A TOPBP1 allele causing male infertility uncouples XY silencing dynamics from sex body formation
- Department of Molecular Biology and Genetics, Weill Institute for Cell and Molecular Biology, Cornell University, United States
- Fundación Canaria del Instituto de Investigación Sanitaria de Canarias (FIISC), Unidad de Investigación, Hospital Universitario de Canarias, Spain
- Instituto de Tecnologías Biomédicas, Universidad de La Laguna, Spain
- Universidad Fernando Pessoa Canarias, Spain
- Department of Biomedical Sciences, Cornell University, United States
Figures
Figure 1 with 1 supplement
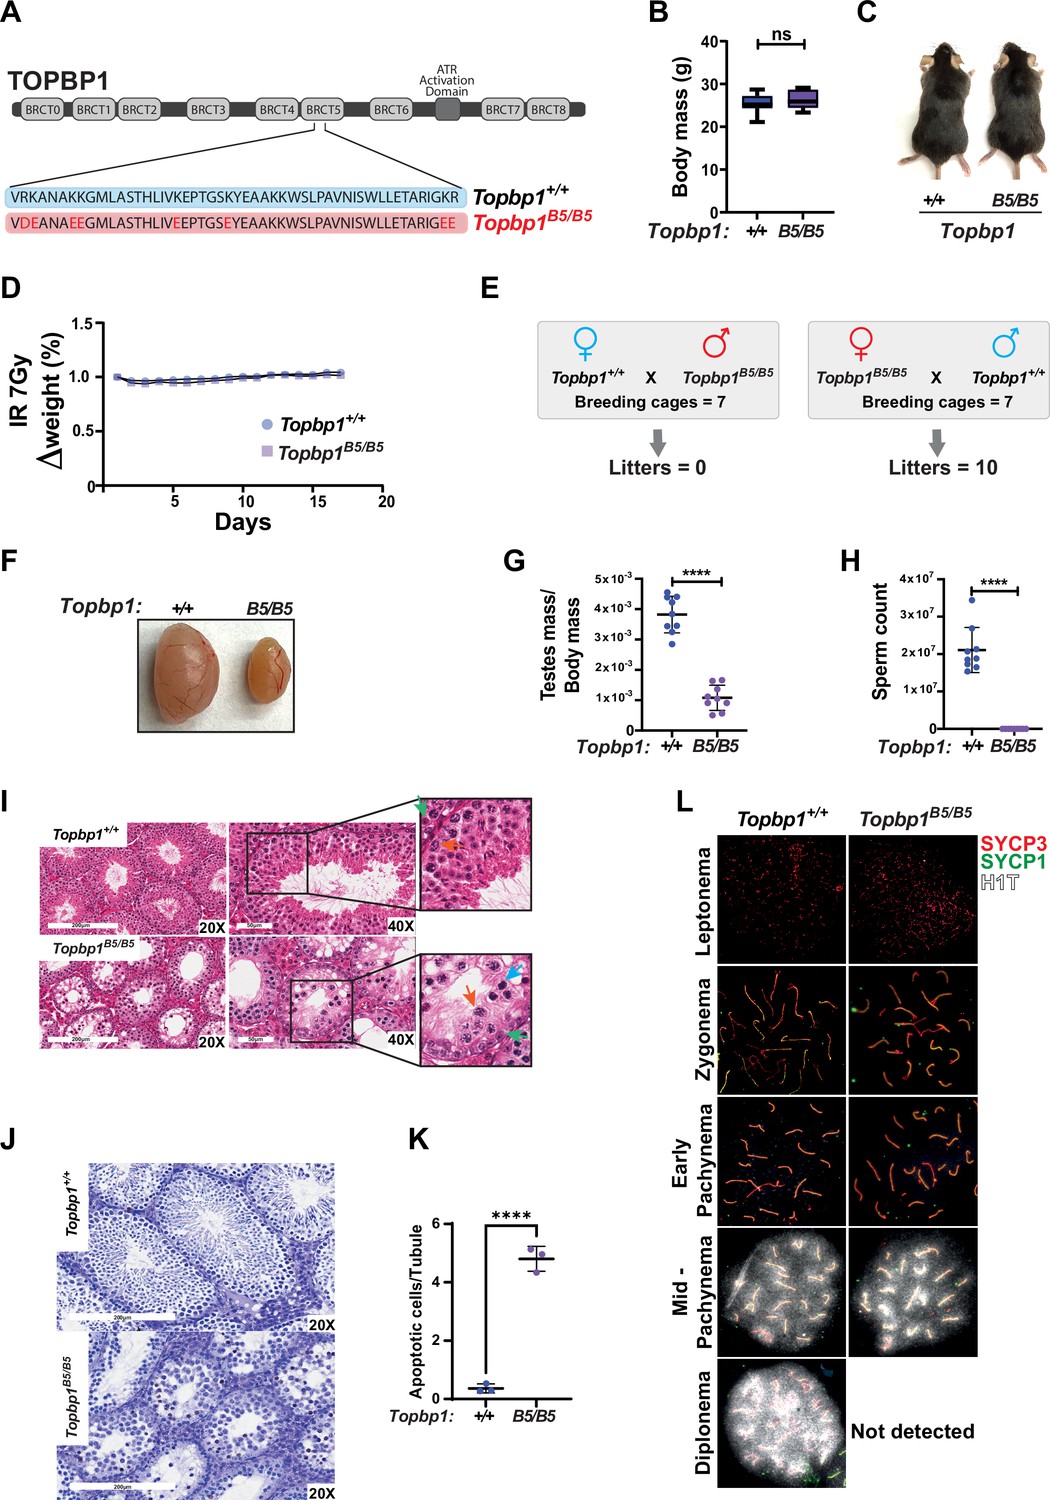
A new TOPBP1 mutant separating its role in fertility from organismal viability.
(A) Schematic showing mutations in the Topbp1 B5 allele. (B) Body mass (Topbp1+/+ mean = 25.26, SD = 2.38; Topbp1B5/B5 mean = 26.43, SD = 2.28, n = 9) and (C) appearance of Topbp1B5/B5 and Topbp1+/+ littermate mice. (D) Effect of full body ionizing radiation (IR) (7 Gy) on changes in body mass of Topbp1B5/B5 and Topbp1+/+ littermate mice (E) Breeding scheme and resulting litters. (F, G) Comparison of testes size (Topbp1+/+ mean = 0.038, SD = 0.006; Topbp1B5/B5 mean = 0.011, SD = 0.004, n = 9), and (H) sperm count, of Topbp1B5/B5 and Topbp1+/+ littermate mice (Topbp1+/+ mean = 2.1 × 10⁷, SD = 6 × 10⁶; Topbp1B5/B5 mean = 0.0, SD = 0.0, n = 9). (I) H&E-stained histological testes sections displaying loss of cellularity in Topbp1B5/B5. Green arrow = spermatogonia, red arrow = healthy spermatocyte, blue arrow = dying spermatocyte. (J, K) TUNEL assay performed on histological testes sections (Topbp1+/+ mean = 0.36, SD = 0.15; Topbp1B5/B5 mean = 4.80, SD = 0.43, n = 3). (L) Meiotic spreads stained for SYCP3, SYCP1, and H1t. ****p<0.0001, n = number of mice. p-Values were calculated using unpaired t-test.
Figure 1—figure supplement 1
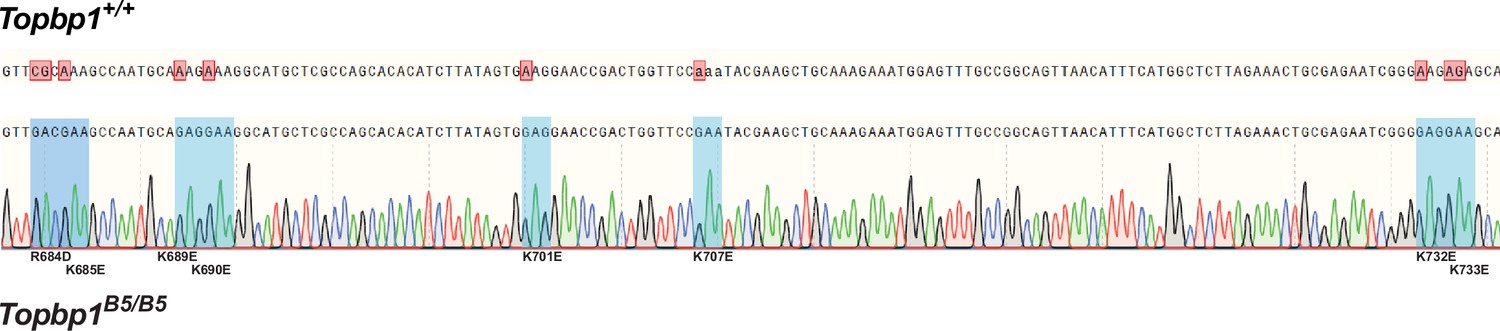
Genotyping of Topbp1B5/B5 mice.
Sanger sequencing confirms the eight-charge reversal point mutations on the BRCT 5 domain of TOPBP1 from homozygous Topbp1B5/B5 mice.
Figure 2 with 4 supplements
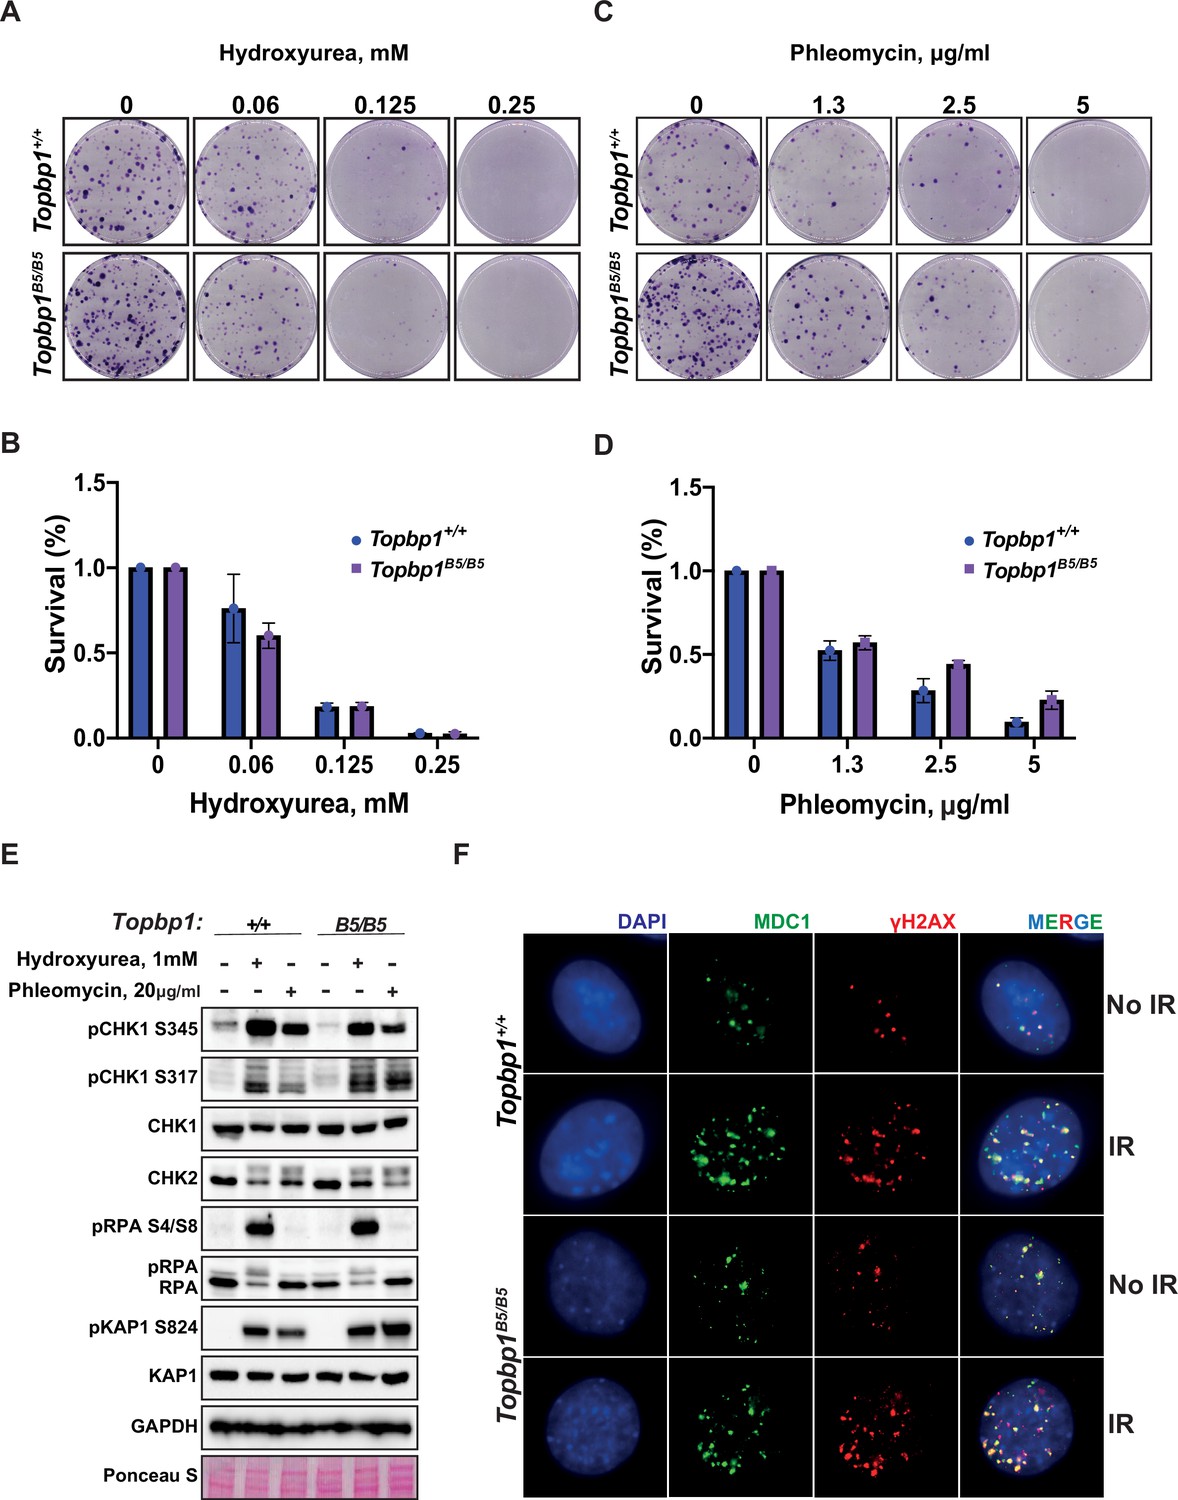
Topbp1B5/B5 mouse embryonic fibroblasts (MEFs) display no detectable DNA damage response (DDR) defects.
(A) MEFs obtained from littermate mice of indicated genotypes were subjected to clonogenic survival assay in the indicated concentrations of hydroxyurea or (C) phleomycin. (B, D) Quantification of clonogenic survival assays from (A) and (C), respectively, performed in biological and experimental triplicates (n = 3), error bars are displayed as standard deviation. (E) Western blot for indicated DDR markers in MEFs obtained from Topbp1B5/B5 and Topbp1+/+ littermate mice. The data from MEFs were performed using littermate pairs and validated using a second pair of Topbp1B5/B5 and Topbp1+/+ littermate mice. (F) Immunofluorescence of MDC1 and phosphoH2AX_S139-stained nuclei from Topbp1B5/B5 and Topbp1+/+ MEFs treated with ionizing radiation (IR) (7 Gy).
-
Figure 2—source data 1
Original file for the western blot analysis in Figure 2E (anti-CHK1, anti-CHK2, and anti-GAPDH).
- https://cdn.elifesciences.org/articles/90887/elife-90887-fig2-data1-v1.zip
Figure 2—figure supplement 1
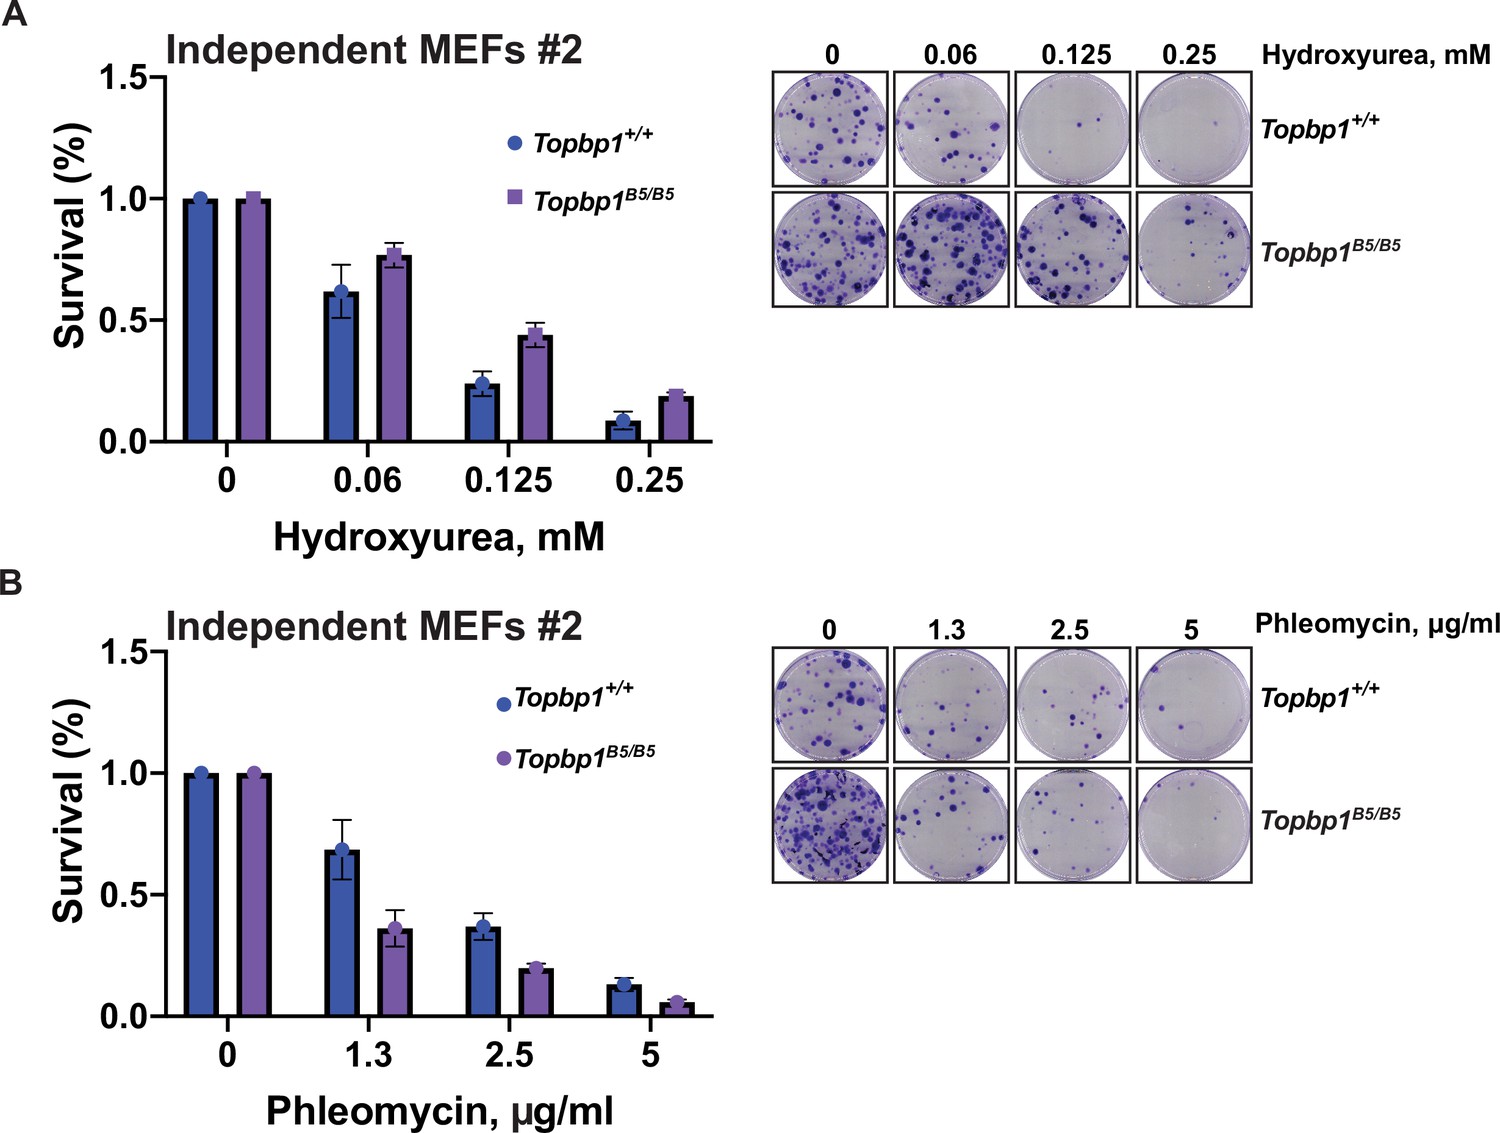
Survival assays of Topbp1B5/B5 mouse embryonic fibroblasts (MEFs).
(A) MEFs obtained from littermate mice (second independent litter) of indicated genotypes were subjected to clonogenic survival assay in the indicated concentrations of hydroxyurea or (B) phleomycin. The clonogenic survival assays were performed in biological and experimental triplicates (n = 3), error bars are displayed as standard deviation.
Figure 2—figure supplement 2
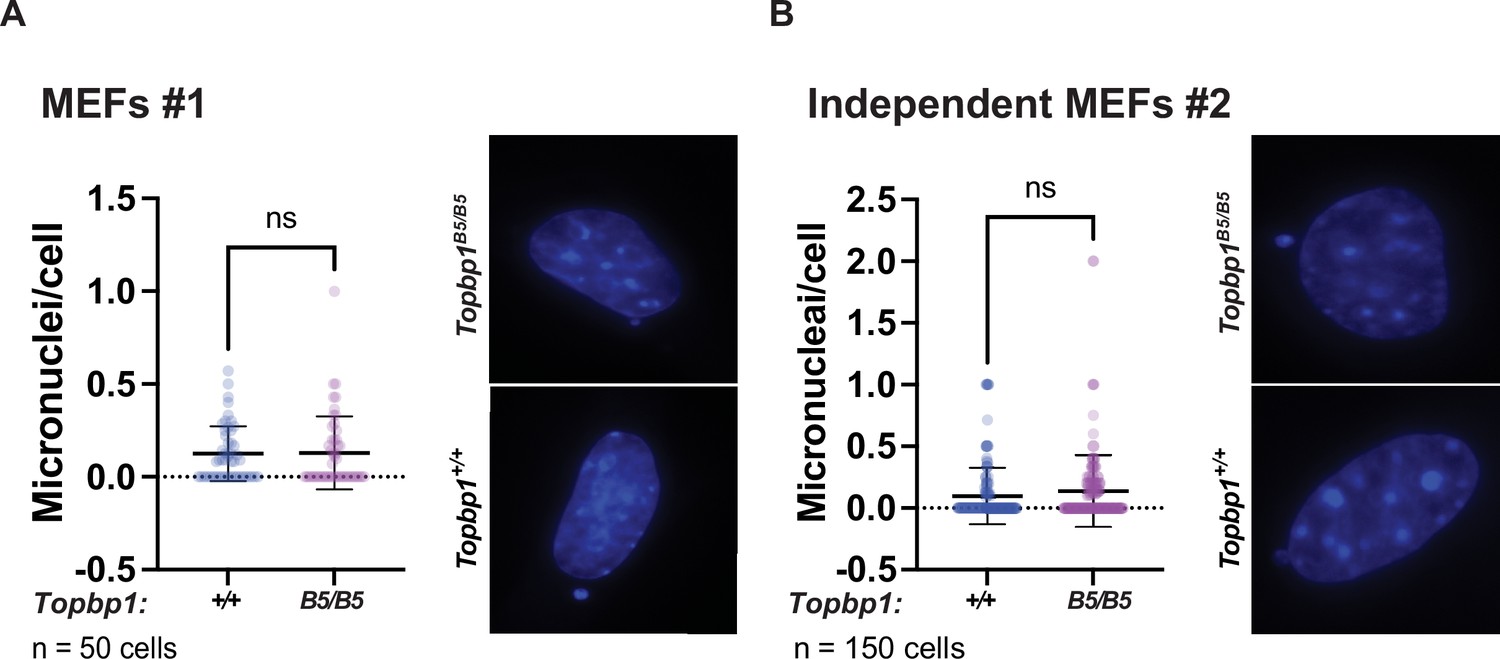
Absence of an increased number of micronuclei in Topbp1B5/B5 mouse embryonic fibroblasts (MEFs).
Immunofluorescence showing DAPI-stained nuclei and micronuclei quantification of Topbp1+/+ and Topbp1B5/B5 (A) MEFs #1 and (B) MEFs #2. (MEFs #2 is a second independent litter.) Ns = p>0.05. p-Values were calculated using unpaired t-test.
Figure 2—figure supplement 3

TOPBP1-B5 shows disruption in binding 53BP1 and BLM.
(A) HEK-293T cells were transfected with plasmids expressing wild-type TOPBP1 or indicated BRCT mutants (K155A – BRCT 1, K250A – BRCT 2, K704A – BRCT 5, K1713A – BRCT 7, and B5 – 8 mutations in BRCT 5), with a 3xFlag tag. After cell lysis and anti-Flag IP, lysate and elution were analyzed by western blot for the indicated proteins. (B) IP-mass spectrometry of flagTOPBP1 wild type versus flag-TOPBP1-B5 was performed in silac-labeled HEK-293T cells. Cell transfections, lysis, protein IP, and elution were performed as described in (A). From left to right, the TOPBP1 interactors were plotted from highest to lowest binding. The size of circles represents the number of peptide hits.
-
Figure 2—figure supplement 3—source data 1
- https://cdn.elifesciences.org/articles/90887/elife-90887-fig2-figsupp3-data1-v1.zip
Figure 2—figure supplement 4
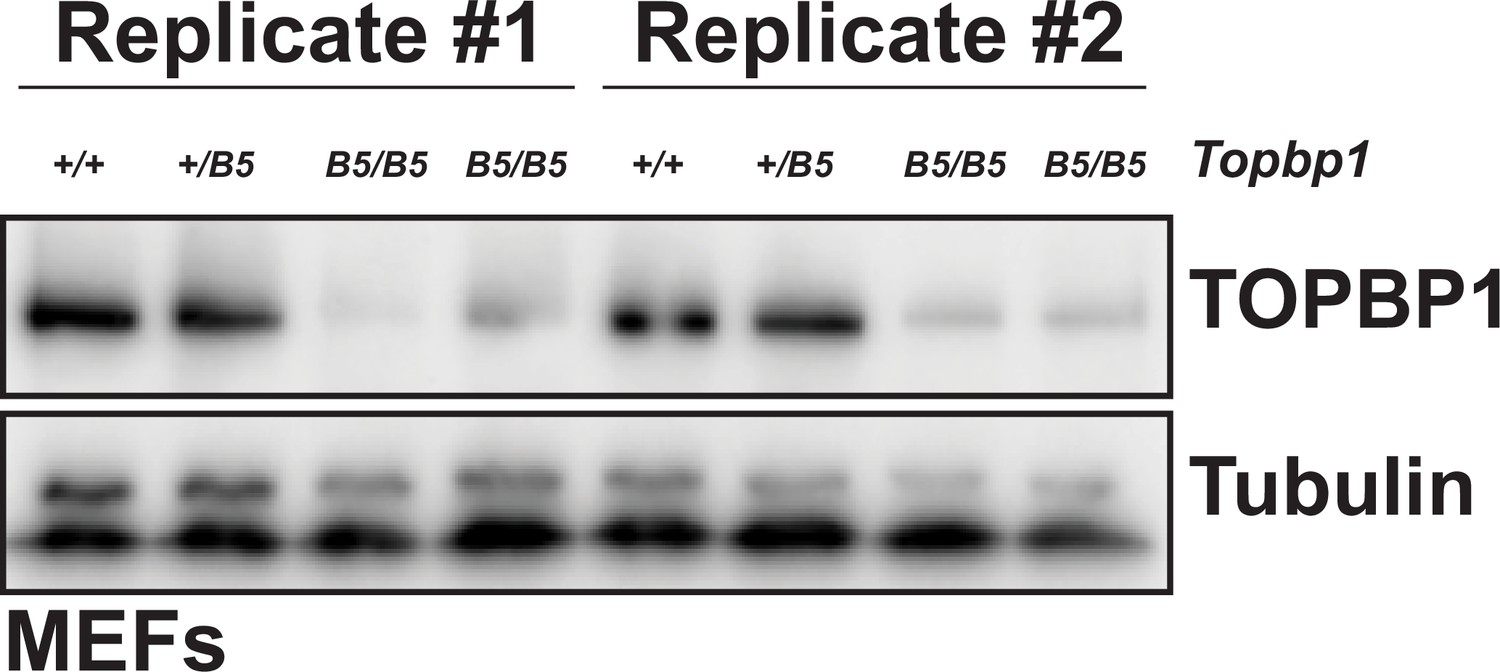
Topbp1B5/B5 mouse embryonic fibroblasts (MEFs) show lower TOPBP1 protein abundance than Topbp1+/+ MEFs.
Western blot probing TOPBP1 in MEFs, Topbp1 +/+, Topbp1B5/+, and Topbp1B5/B5 in two biological replicates.
-
Figure 2—figure supplement 4—source data 1
Original file for the western blot analysis in Figure 2—figure supplement 4 (anti-TOPBP1 and anti-TUBULIN).
- https://cdn.elifesciences.org/articles/90887/elife-90887-fig2-figsupp4-data1-v1.zip
-
Figure 2—figure supplement 4—source data 2
PDF containing Figure 2—figure supplement 4 and original scans of the relevant western blot analysis (anti-TOPBP1 and anti-TUBULIN) with highlighted bands and labels.
- https://cdn.elifesciences.org/articles/90887/elife-90887-fig2-figsupp4-data2-v1.pdf
Figure 3 with 5 supplements
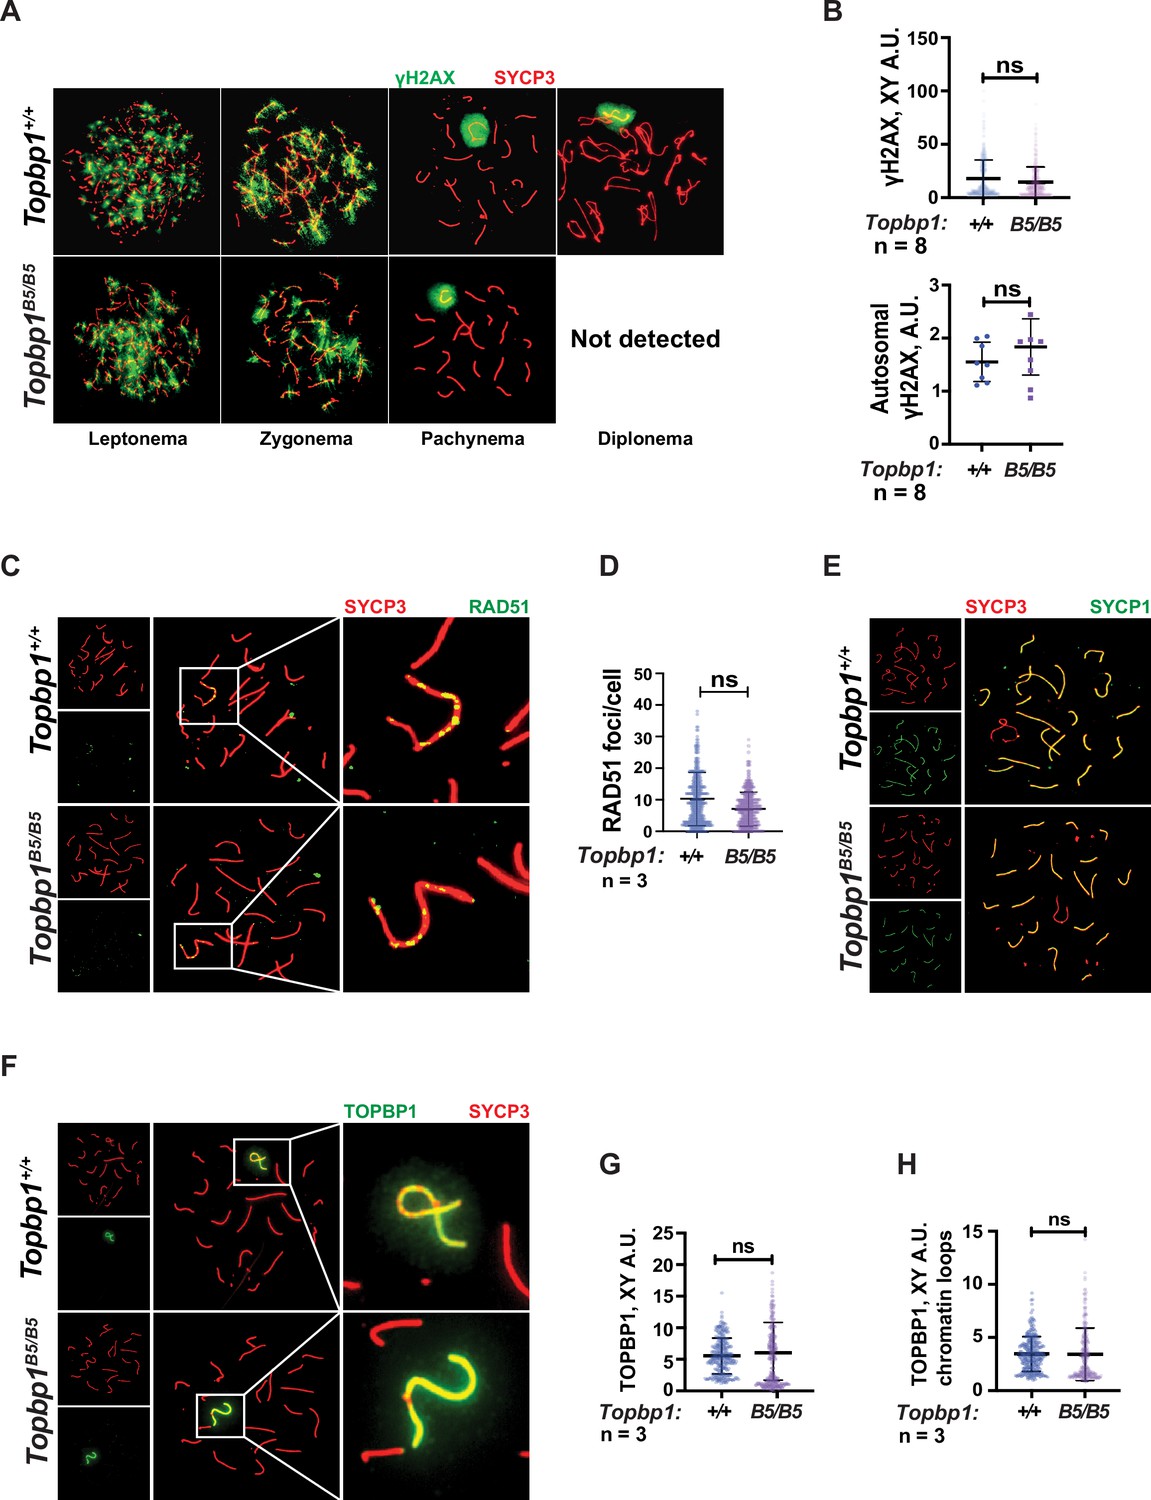
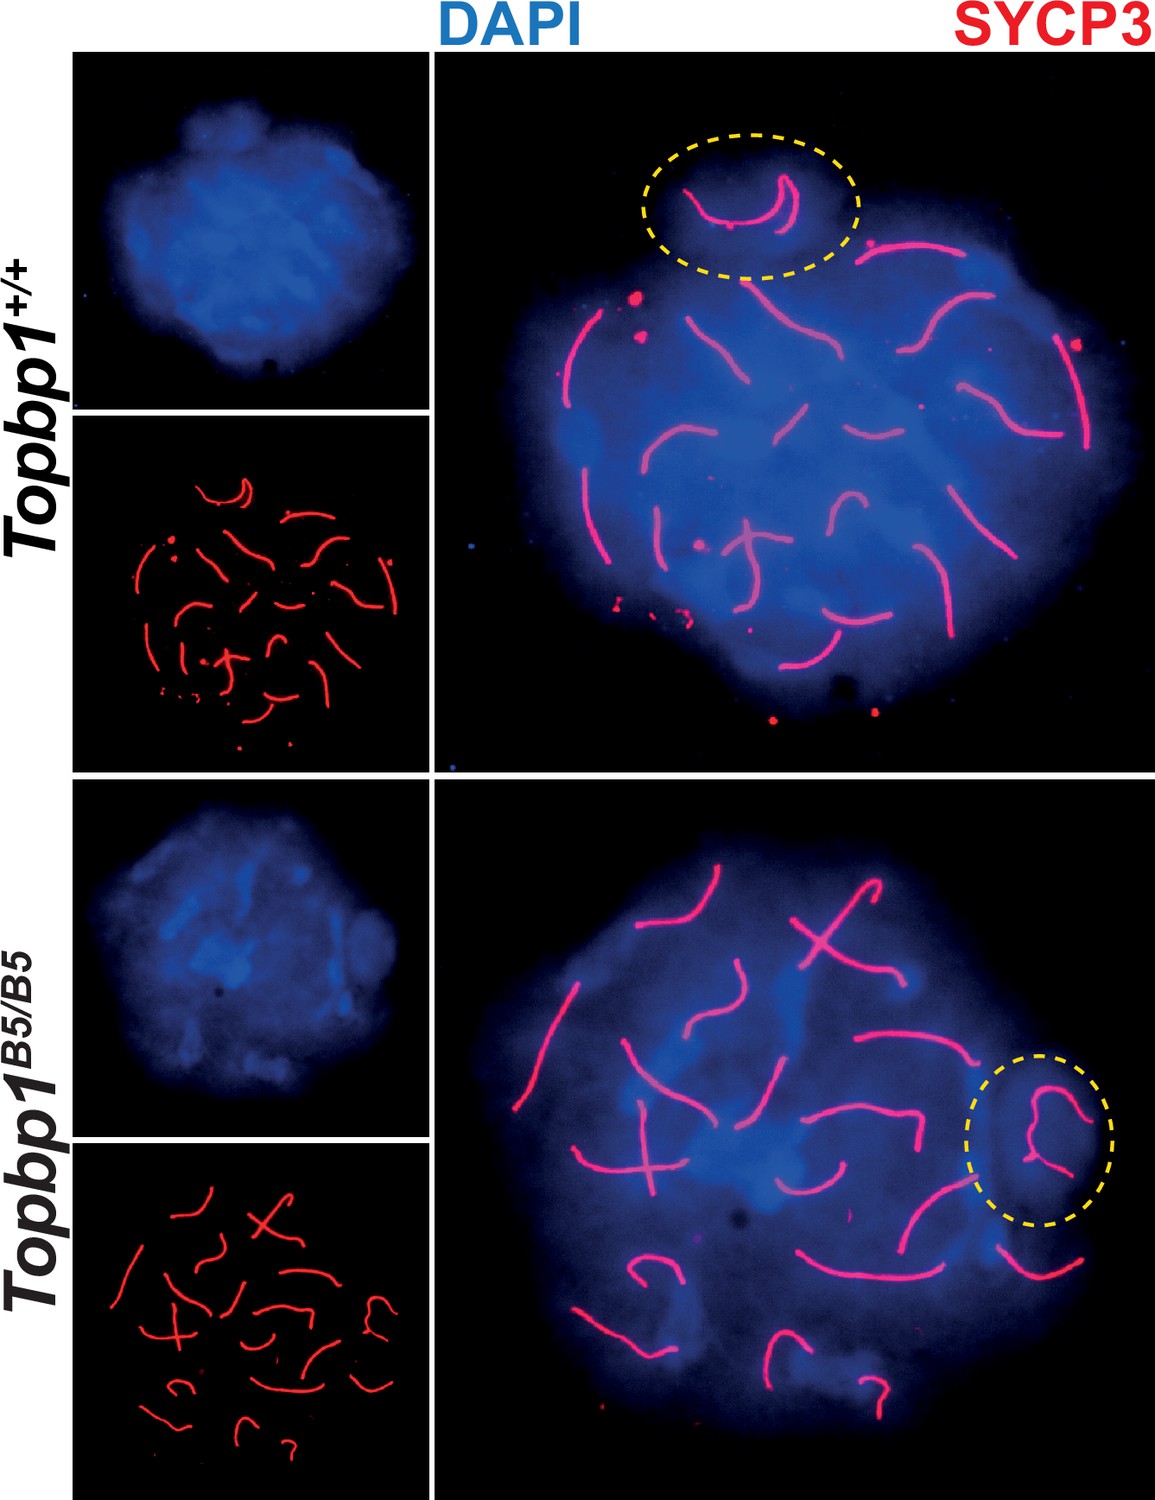
Markers of DNA repair, synapsis, sex body formation, and TOPBP1 localization are mostly normal in Topbp1B5/B5 spermatocytes.
(A) Meiotic spreads showing Topbp1+/+ and Topbp1B5/B5 spermatocytes stained with SYCP3 and γH2AX, prepared as described in ‘Materials and methods’. (B) Quantification of γH2AX-stained pachytene spreads, upper graph XY body (each dot represents one pachytene cell measured; Topbp1+/+ number of cells = 386, number of mice = 8; Topbp1B5/B5 number of cells = 410, number of mice = 8; p-value=0.3063), bottom graph autosomal chromosomes (each dot represents the average of signal from all autosomes in each mouse, Topbp1+/+ number of cells = 160, number of mice = 8; Topbp1B5/B5 number of cells = 161, number of mice = 8; p-value=0.5081). (C) Meiotic spreads showing Topbp1+/+ and Topbp1B5/B5 pachytene spermatocytes stained with SYCP3 and RAD51. (D) Quantification of RAD51 foci/cell of mid-pachytene meiotic spreads (each dot represents one pachytene cell measured; Topbp1+/+ number of cells = 149, number of mice = 3; Topbp1B5/B5 number of cells = 183, number of mice = 3; p-value=0.2174). (E) Meiotic spreads showing Topbp1+/+ and Topbp1B5/B5 pachytene spermatocytes stained with SYCP3 and SYCP1. (F) Meiotic spreads showing Topbp1+/+ and Topbp1B5/B5 pachytene spermatocytes stained with SYCP3 and TOPBP1. (G) Quantification of TOPBP1 on X and Y chromosome cores from (F) (each dot represents one pachytene cell measured; Topbp1+/+ number of cells = 246, number of mice = 3; Topbp1B5/B5 number of cells = 233, number of mice = 3; p-value=0.8546). (H) Quantification of TOPBP1 on X and Y chromatin loops from (F) (each dot represents one pachytene cell measured; Topbp1+/+ number of cells = 246, number of mice = 3; Topbp1B5/B5 number of cells = 233, number of mice = 3; p-value=0.6755). n = number of mice. p-Values were calculated using a linear mixed effect model (see ‘Materials and methods’ for details).
Figure 3—figure supplement 1

Topbp1B5/B5 mid-pachytene spermatocytes show normal HORMAD1, HORMAD2, pHORMAD2, and pCHK1_S345 localization and intensities.
(A) Topbp1+/+ and Topbp1B5/B5 pachytene spermatocytes stained with HORMAD1 and SYCP3, prepared as described in ‘Materials and methods’. (B) Topbp1+/+ and Topbp1B5/B5 pachytene spermatocytes stained with HORMAD2 and SYCP3. (C) Meiotic spreads showing Topbp1+/+ and Topbp1B5/B5 pachytene spermatocytes stained with SYCP3 and pMDC1-T4 prepared as described in ‘Materials and methods’. (D) Quantification of pMDC1-T4-stained pachytene spreads from (C) (each dot represents one pachytene cell measured; Topbp1+/+ number of cells = 60, number of mice = 3; Topbp1B5/B5 number of cells = 159, number of mice = 3; p-value=0.8193). (E) Meiotic spreads showing Topbp1+/+ and Topbp1B5/B5 pachytene spermatocytes stained with SYCP3 and pCHK1-S345. (F) Quantification of pCHK1-S345-stained pachytene spreads from (E) (each dot represents one pachytene cell measured; Topbp1+/+ number of cells = 168, number of mice = 2; Topbp1B5/B5 number of cells = 125, number of mice = 2; p-value=0.6536). (G) Meiotic spreads showing Topbp1+/+ and Topbp1B5/B5 pachytene spermatocytes stained with SYCP3 and pHORMAD2-S271. (H) Quantification of pHORMAD2-S271-stained pachytene spreads from (G) (each dot represents one pachytene cell measured; Topbp1+/+ number of cells = 224, number of mice = 3; Topbp1B5/B5 number of cells = 254, number of mice = 3; p-value=0.2811). p-Values were calculated using a linear mixed effect model (see ‘Materials and methods’ for details).
Figure 3—figure supplement 2
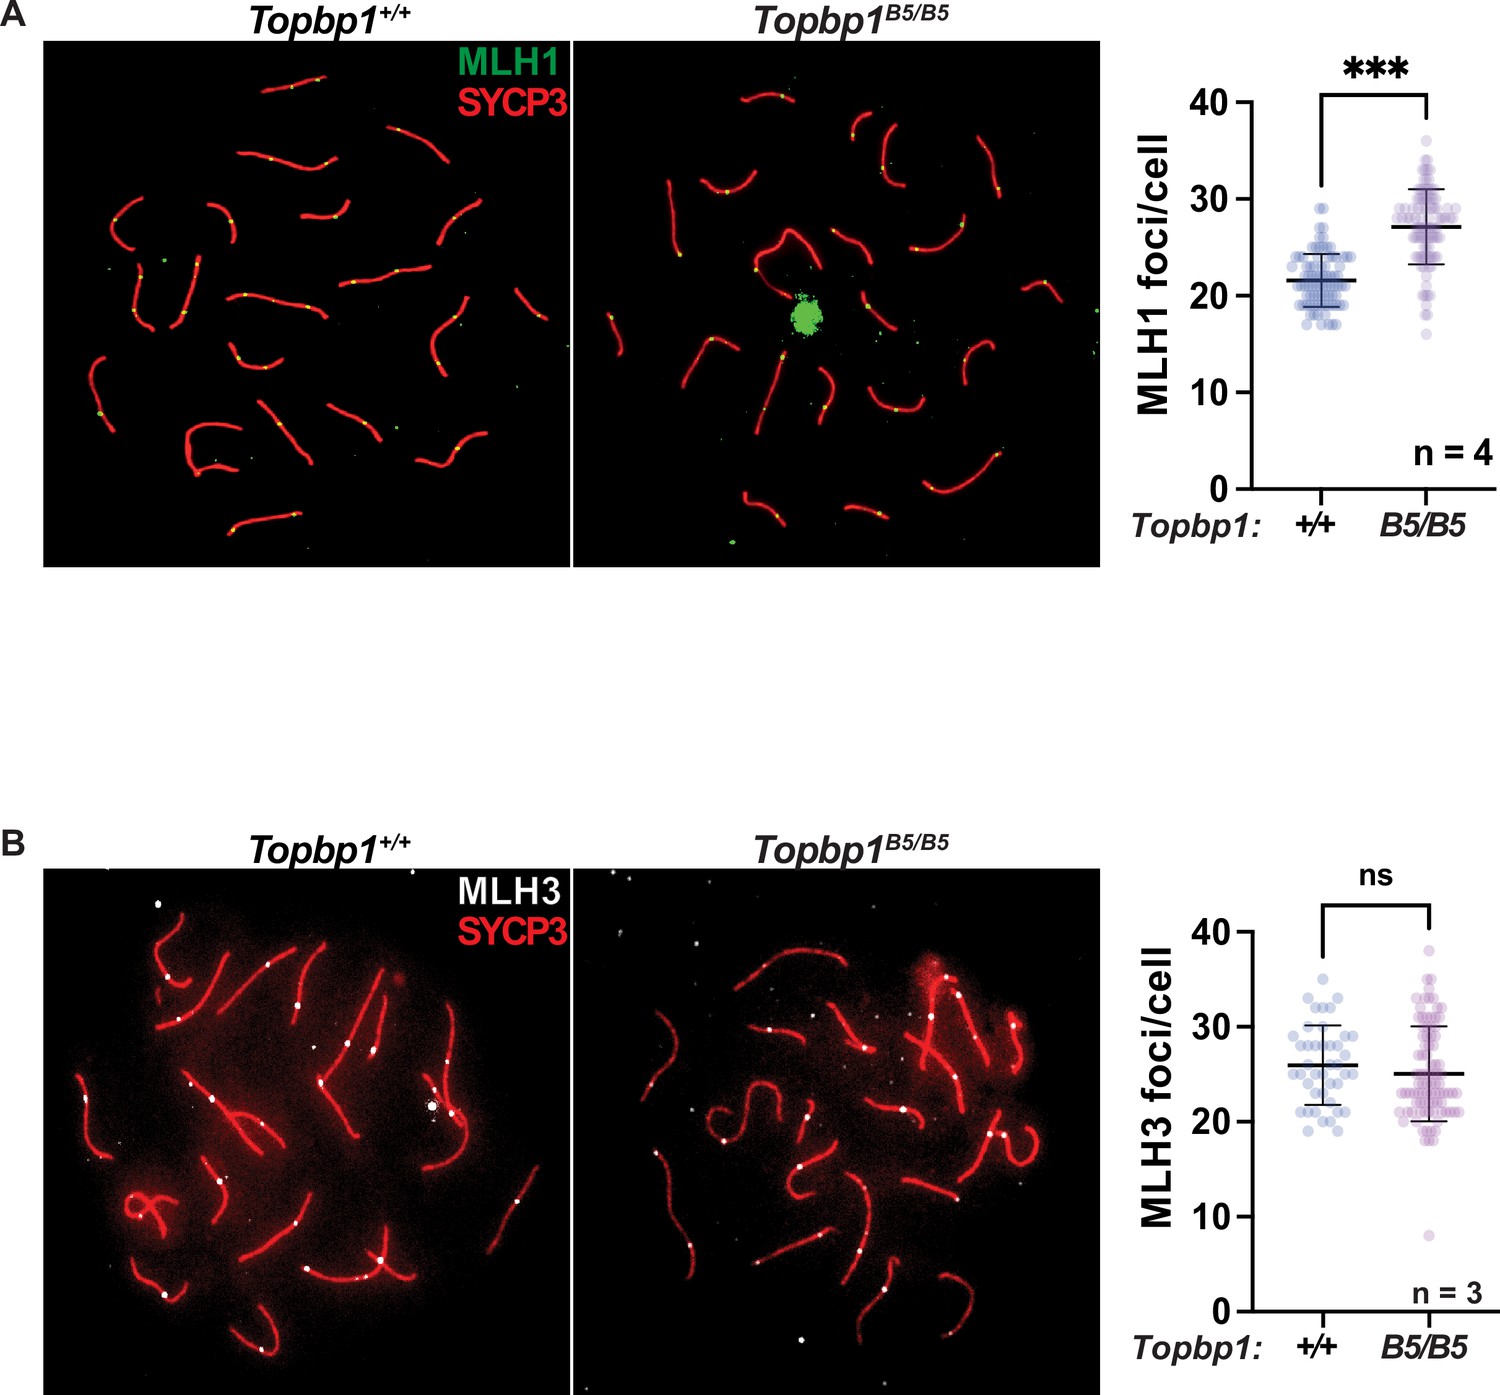
Topbp1B5/B5 mid-pachytene spermatocytes show an increased number of MLH1 foci/cell but no difference in the number of MHL3 foci/cell.
(A) Meiotic spreads showing Topbp1+/+ and Topbp1B5/B5 pachytene spermatocytes stained with SYCP3 and MLH1, prepared as described in ‘Materials and methods’ on the left, and on the right, the foci count of MLH1-stained pachytene spreads (each dot represents the number of foci/cell; Topbp1+/+ number of cells = 84, number of mice = 4; Topbp1B5/B5 number of cells = 94, number of mice = 4; p-value<0.0001). (B) Meiotic spreads showing Topbp1+/+ and Topbp1B5/B5 pachytene spermatocytes stained with SYCP3 and MLH3 prepared as described in ‘Materials and methods’ on the left, and on the right, the Foci count of MLH3-stained pachytene spreads (each dot represents the number of foci/cell; Topbp1+/+ number of cells = 48, number of mice = 3; Topbp1B5/B5 number of cells = 91, number of mice = 3; p-value=0.4088). p-Values were calculated using a linear mixed effect model (see ‘Materials and methods’ for details).
Figure 3—figure supplement 3
Topbp1B5/B5 mid-pachytene spermatocytes form a normal sex body.
Topbp1+/+ and Topbp1B5/B5 mid-pachytene spermatocytes stained with DAPI and SYCP3, prepared as described in ‘Materials and methods’.
Figure 3—figure supplement 4
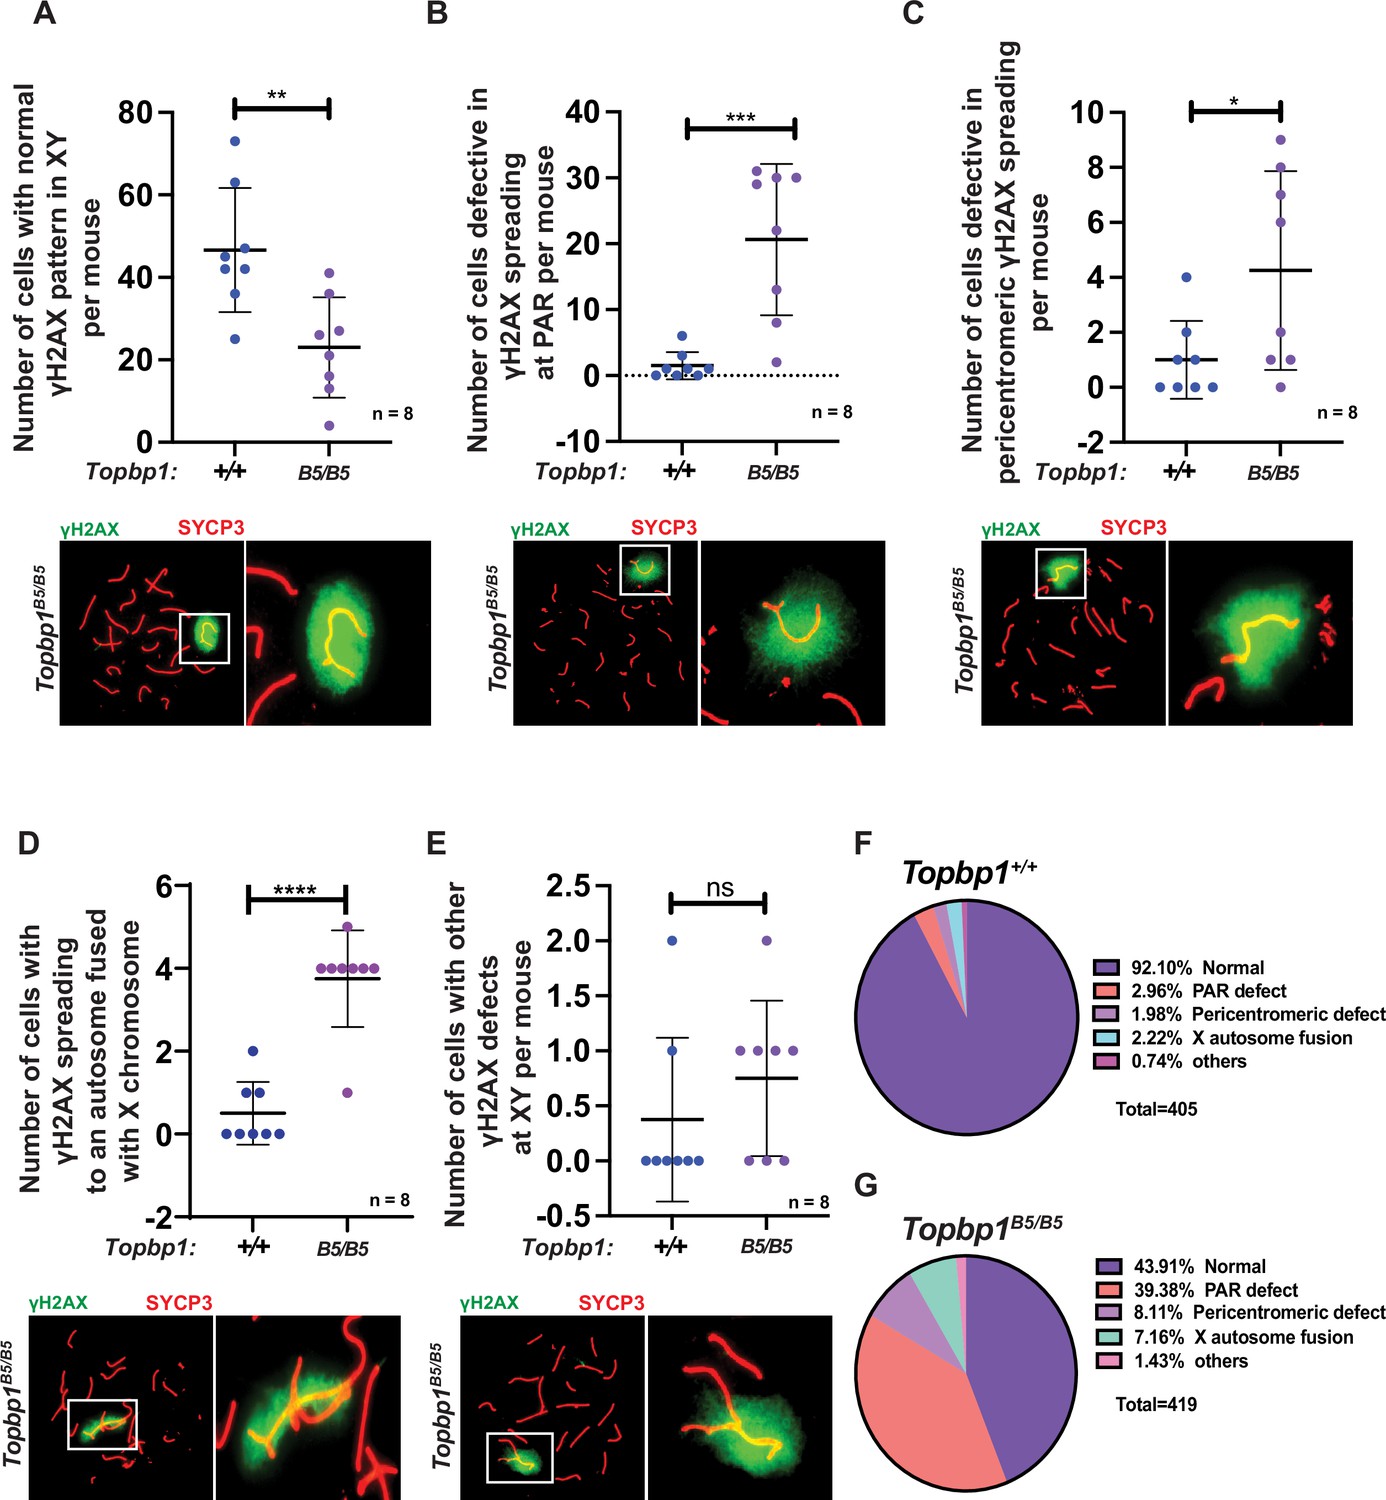
Topbp1B5/B5 mid-pachytene spermatocytes show subtle defects/delays in the spreading of γH2AX on XY chromosomes.
Quantification and representative images of Topbp1B5/B5 mid-pachytene spermatocytes showing: (A) normal spreading of γH2AX on XY chromosomes; (B) defect/delay in the spreading of γH2AX at the PAR; (C) defect/delay in the spreading of γH2AX at the pericentromeric region of the Y chromosome; (D) spreading of γH2AX into an autosomal chromosome fused to the X chromosome; and (E) other types of defects/delays in the spreading of γH2AX onto the XY chromosomes. Each dot in the graph represents the sum of the cells counted per mouse. (F) Percentage of the previously described defects found in Topbp1+/+ or (G) Topbp1B5/B5 mid-pachytene spermatocytes. *p<0.05, **p<0.01, ***p<0.001, and ****p<0.0001. p-Values were calculated using unpaired t-test in GraphPad. n = number of mice.
Figure 3—figure supplement 5

TOPBP1 is normally localized in all stages of prophase I in Topbp1B5/B5.
Meiotic spreads showing Topbp1+/+ and Topbp1B5/B5 spermatocytes stained with SYCP3 and TOPBP1, prepared as described in ‘Materials and methods’.
Figure 4 with 1 supplement
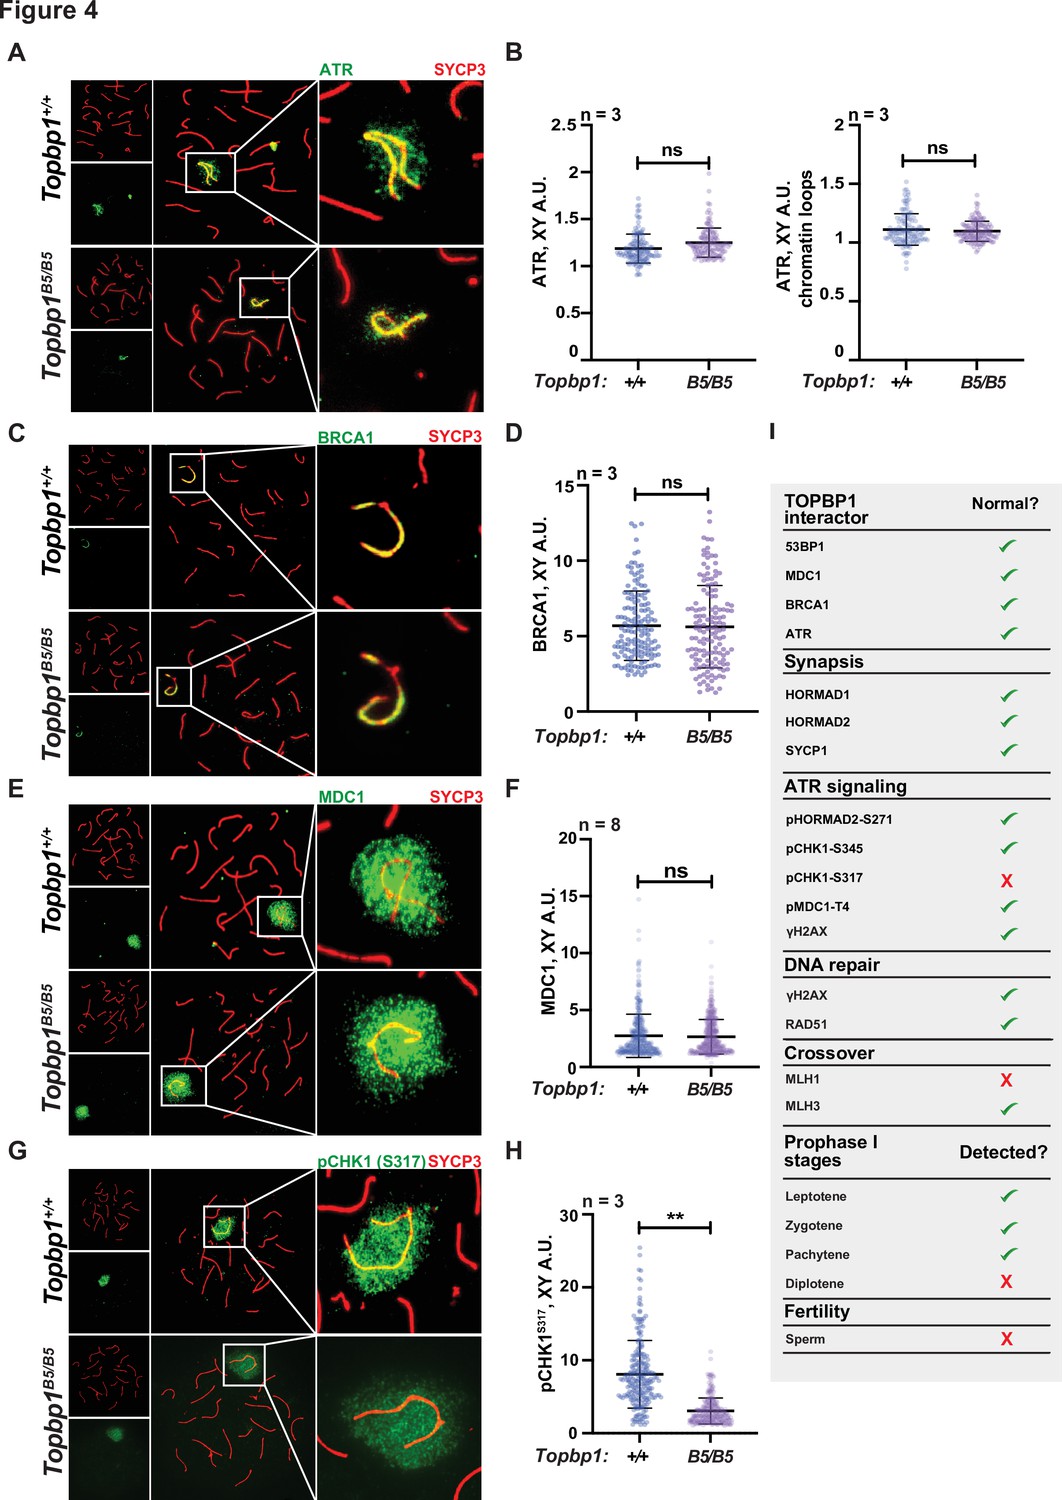
Topbp1B5/B5 spermatocytes display normal localization of ATR, BRCA1, and MDC1.
(A) Meiotic spreads showing Topbp1+/+ and Topbp1B5/B5 pachytene spermatocytes stained with SYCP3 and ATR. (B) Quantification of ATR in pachytene spreads from (A). Left: ATR on X and Y chromosome cores (each dot represents one pachytene cell measured; Topbp1+/+ number of cells = 127, number of mice = 3; Topbp1B5/B5 number of cells = 127, number of mice = 3; p-value=0.4068). Right: ATR on X and Y chromatin loops (each dot represents one pachytene cell measured; Topbp1+/+ number of cells = 127, number of mice = 3; Topbp1B5/B5 number of cells = 127, number of mice = 3; p-value=0.9396). (C) Meiotic spreads showing Topbp1+/+ and Topbp1B5/B5 pachytene spermatocytes stained with SYCP3 and BRCA1. (D) Quantification of BRCA1 in pachytene spreads from (C) (each dot represents one pachytene cell measured; Topbp1+/+ number of cells = 152, number of mice = 3; Topbp1B5/B5 number of cells = 140, number of mice = 3; p-value=0.6509). (E) Meiotic spreads showing Topbp1+/+ and Topbp1B5/B5 pachytene spermatocytes stained with SYCP3 and MDC1. (F) Quantification of MDC1 in pachytene spreads from (E) (each dot represents one pachytene cell measured; Topbp1+/+ number of cells = 696, number of mice = 8; Topbp1B5/B5 number of cells = 988, number of mice = 8; p-value=0.3603). (G) Meiotic spreads showing Topbp1+/+ and Topbp1B5/B5 pachytene spermatocytes stained with SYCP3 and pCHK1-S317. (H) Quantification of pCHK1-S317 in pachytene spreads from (G) (each dot represents one pachytene cell measured; Topbp1+/+ number of cells = 223, number of mice = 3; Topbp1B5/B5 number of cells = 254, number of mice = 3; **p-value=0.0023). p-Values were calculated using a linear mixed effect model (see ‘Materials and methods’ for details). (I) Table summarizing the normal or disrupted ATR and TOPBP1-dependent events during male fertility accessed in Topbp1B5/B5. n = number of mice.
Figure 4—figure supplement 1
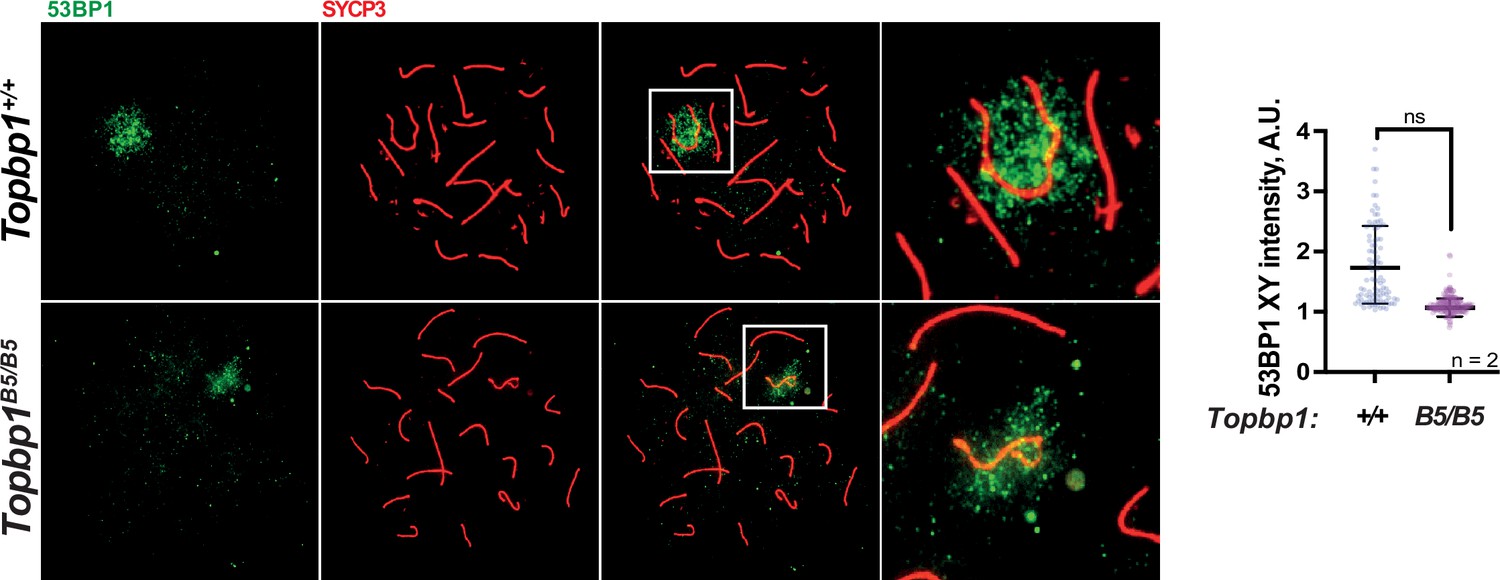
53BP1 localization in Topbp1B5/B5 mid-pachytene spermatocytes.
Representative images of meiotic spreads showing Topbp1+/+ and Topbp1B5/B5 pachytene spermatocytes stained with SYCP3 and 53BP1 on the left, and quantification of 53BP1-stained pachytene spreads on the right (each dot represents one pachytene cell measured; Topbp1+/+ number of cells = 95, number of mice = 2; Topbp1B5/B5 number of cells = 171, number of mice = 2; p-value=0.2384). p-Values were calculated using a linear mixed effect model (see ‘Materials and methods’ for details).
Figure 5
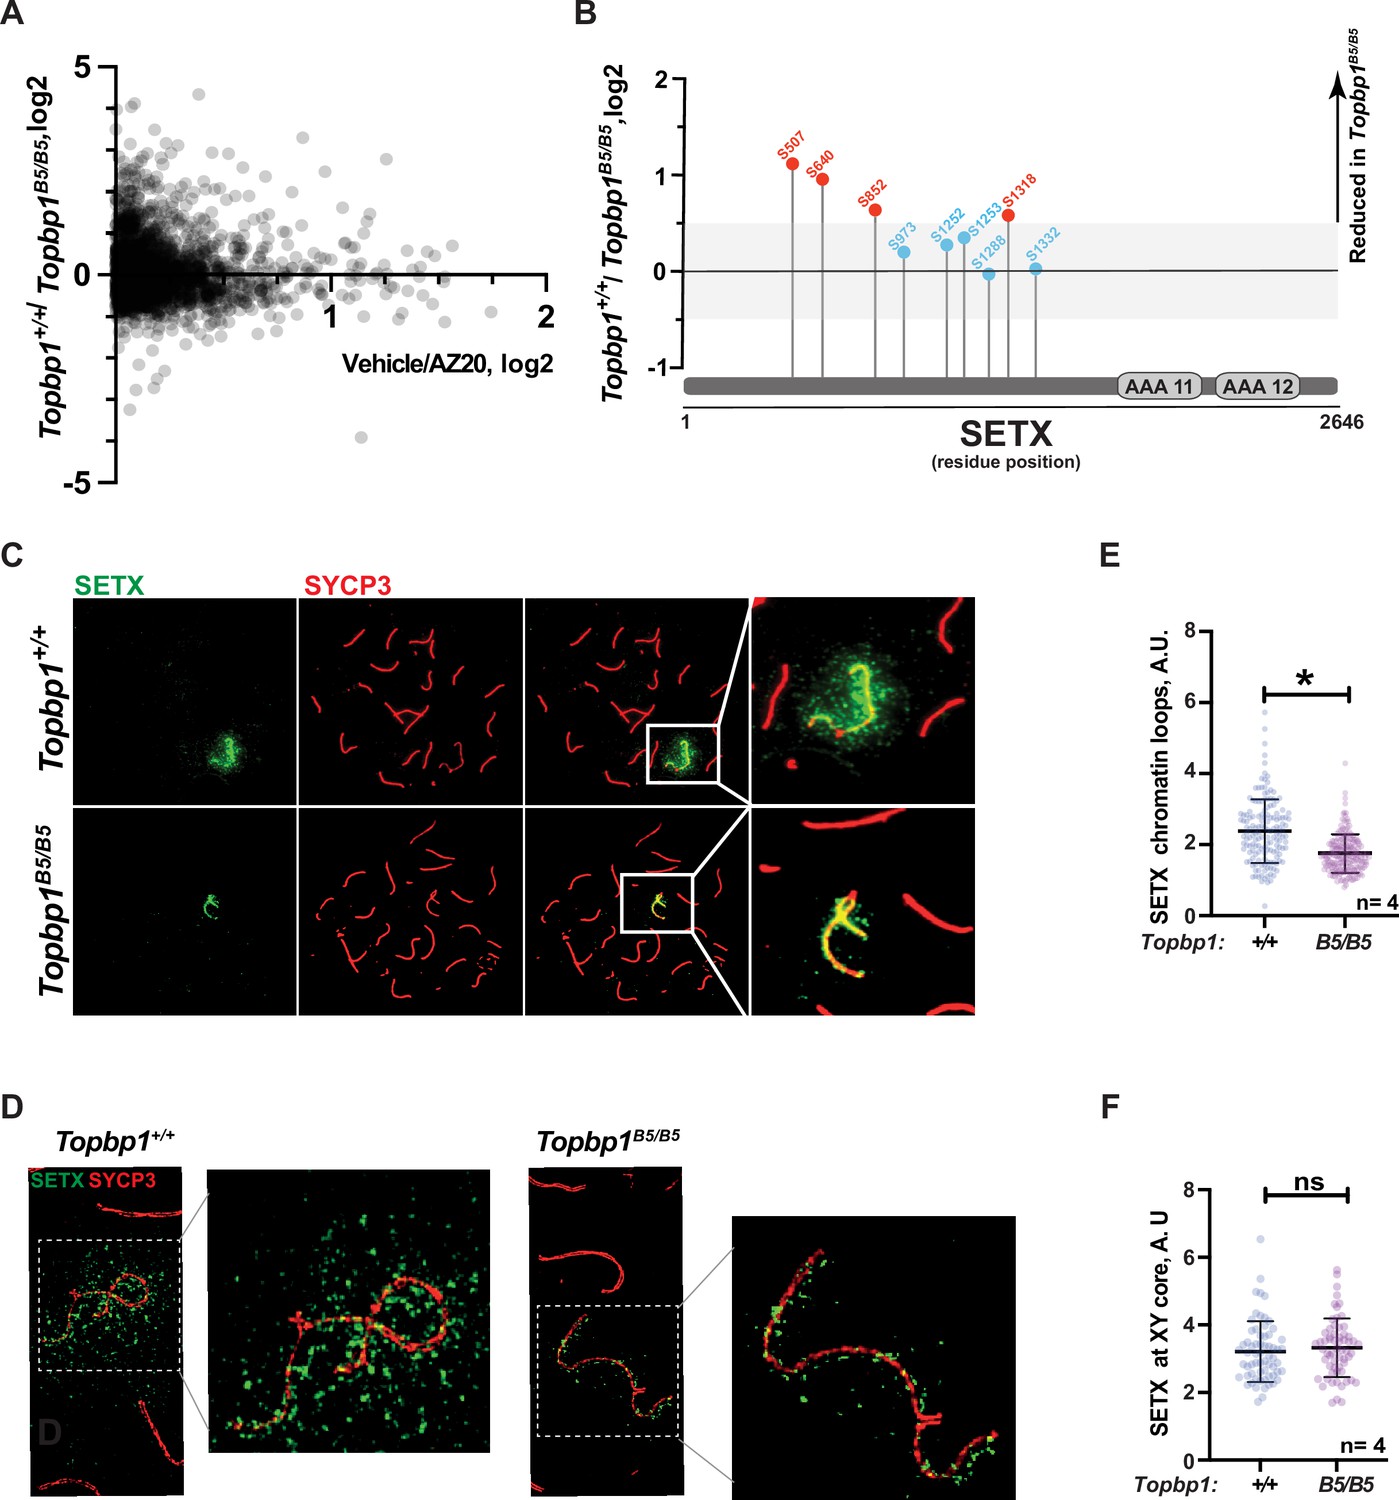
Defective Senataxin (SETX) phosphorylation and localization in Topbp1B5/B5 spermatocytes.
(A) Scatter plot of phosphoproteomic datasets corresponding to Topbp1+/+/Topbp1B5/B (Y axis) and Topbp1+/+(vehicle)/Topbp1+/+(AZ20) (X axis) from whole testes of mice. (B) SETX phosphopeptides identified in the Topbp1+/+/Topbp1B5/B phosphoproteomic experiment shown in (A). Red: reduced in Topbp1B5/B mutant; blue: unchanged. (C) Meiotic spreads showing pachytene spermatocytes from Topbp1+/+ and Topbp1B5/B5 mice stained with SYCP3 and SETX in regular immunofluorescence. (D) 3D-SIM analysis of meiotic spreads described in (C). (E) Quantification of SETX on X and Y chromatin loops in pachytene spreads from (C) (each dot represents one pachytene cell measured; Topbp1+/+ number of cells = 152, number of mice = 4; Topbp1B5/B5 number of cells = 174, number of mice = 4; *p-value=0.0452). (F) Quantification of SETX on X and Y chromosome cores in pachytene spreads from (C) (each dot represents one pachytene cell measured; Topbp1+/+ number of cells = 152, number of mice = 4; Topbp1B5/B5 number of cells = 174, number of mice = 4; p-value=0.5987). p-Values were calculated using a linear mixed effect model (see ‘Materials and methods’ for details).
Figure 6 with 16 supplements
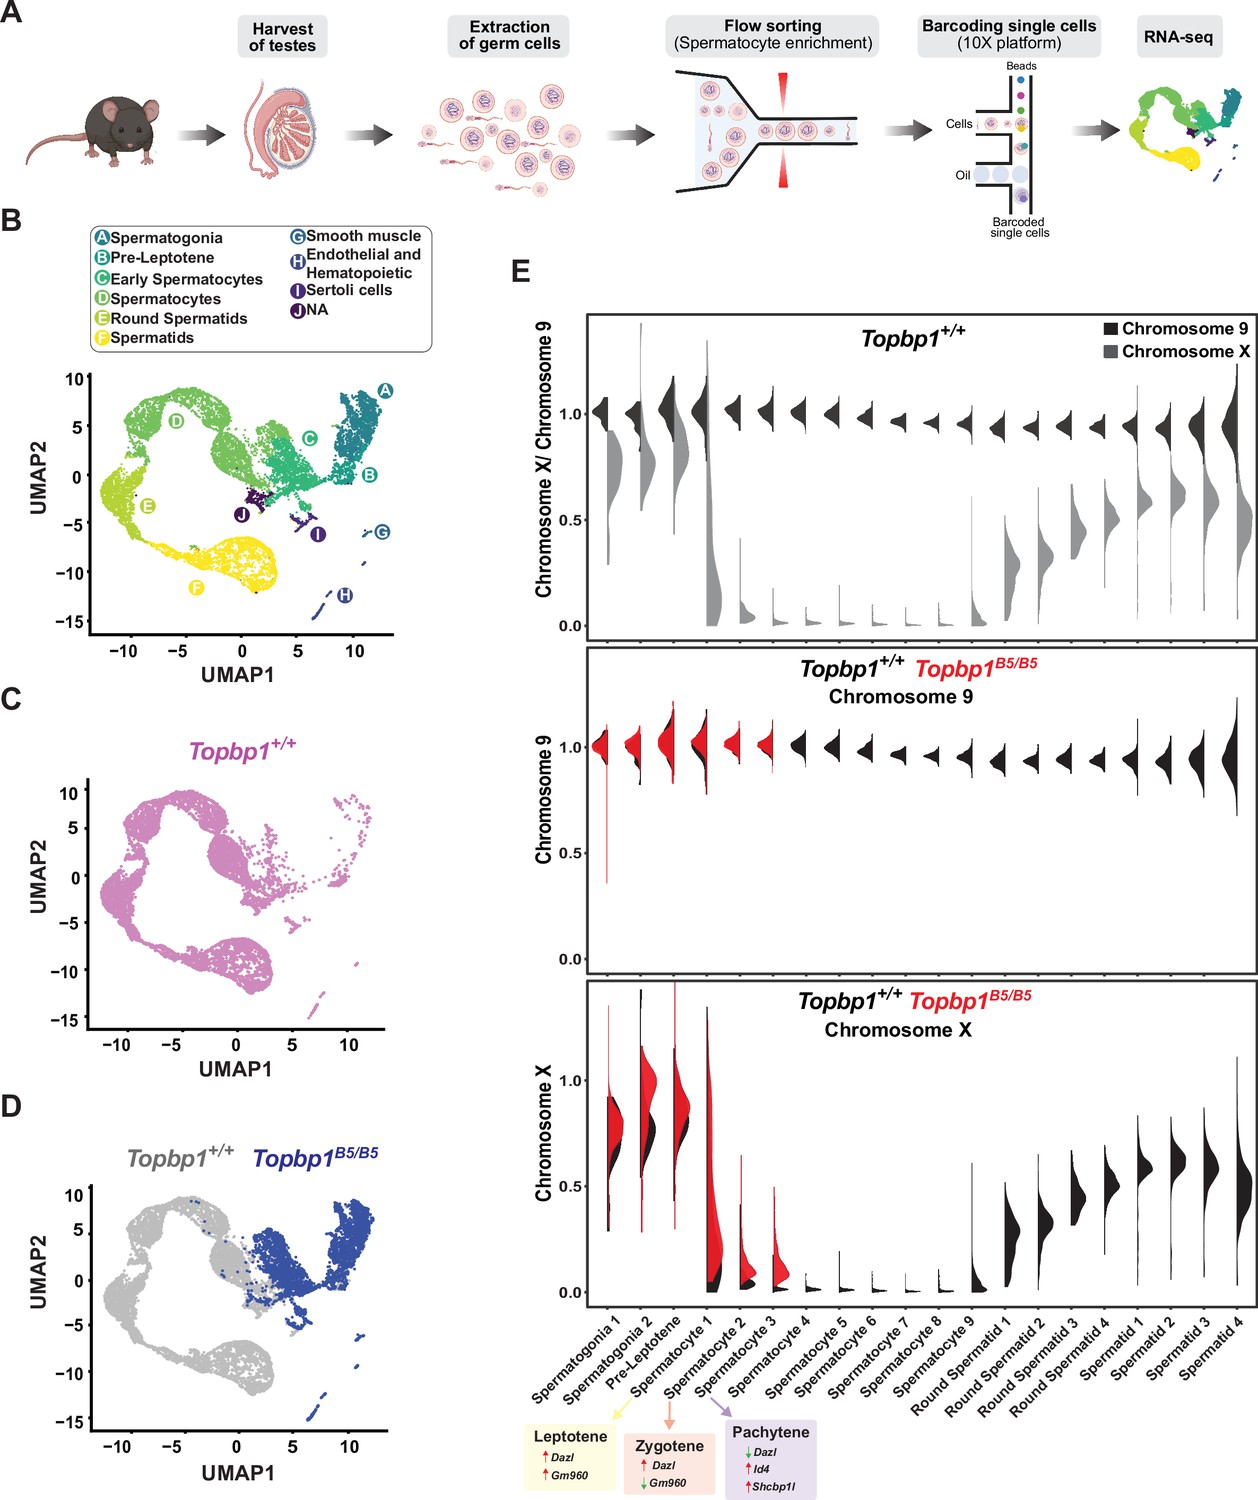
Single-cell RNAseq reveals that Topbp1B5/B5 spermatocytes initiate meiotic sex chromosome inactivation (MSCI) but fail to promote full silencing.
(A) scRNAseq workflow for isolation and purification of single cells for RNAseq. (B) Uniform Manifold Approximation and Projection (UMAP) analysis of sub-clusters captured in the scRNAseq, representing all cells captured for both Topbp1+/+ and Topbp1B5/B5. (C) UMAP analysis of sub-clusters captured in the scRNAseq of Topbp1+/+. (D) UMAP analysis of sub-clusters captured in the scRNAseq of Topbp1+/+ (gray) and Topbp1B5/B5 (blue). (E) Violin plots displaying the ratio of the average expression of X chromosome genes by the average expression of chromosome 9 genes at different stages of spermatogenesis for Topbp1+/+ and Topbp1B5/B5 cells. The level of X-genes expression in spermatocyte 3 is significantly higher in Topbp1B5/B5 cells when compared to Topbp1+/+ cells, with a p-value of 1.5e-178 using a two-sided Wilcoxon rank-sum test.
Figure 6—figure supplement 1
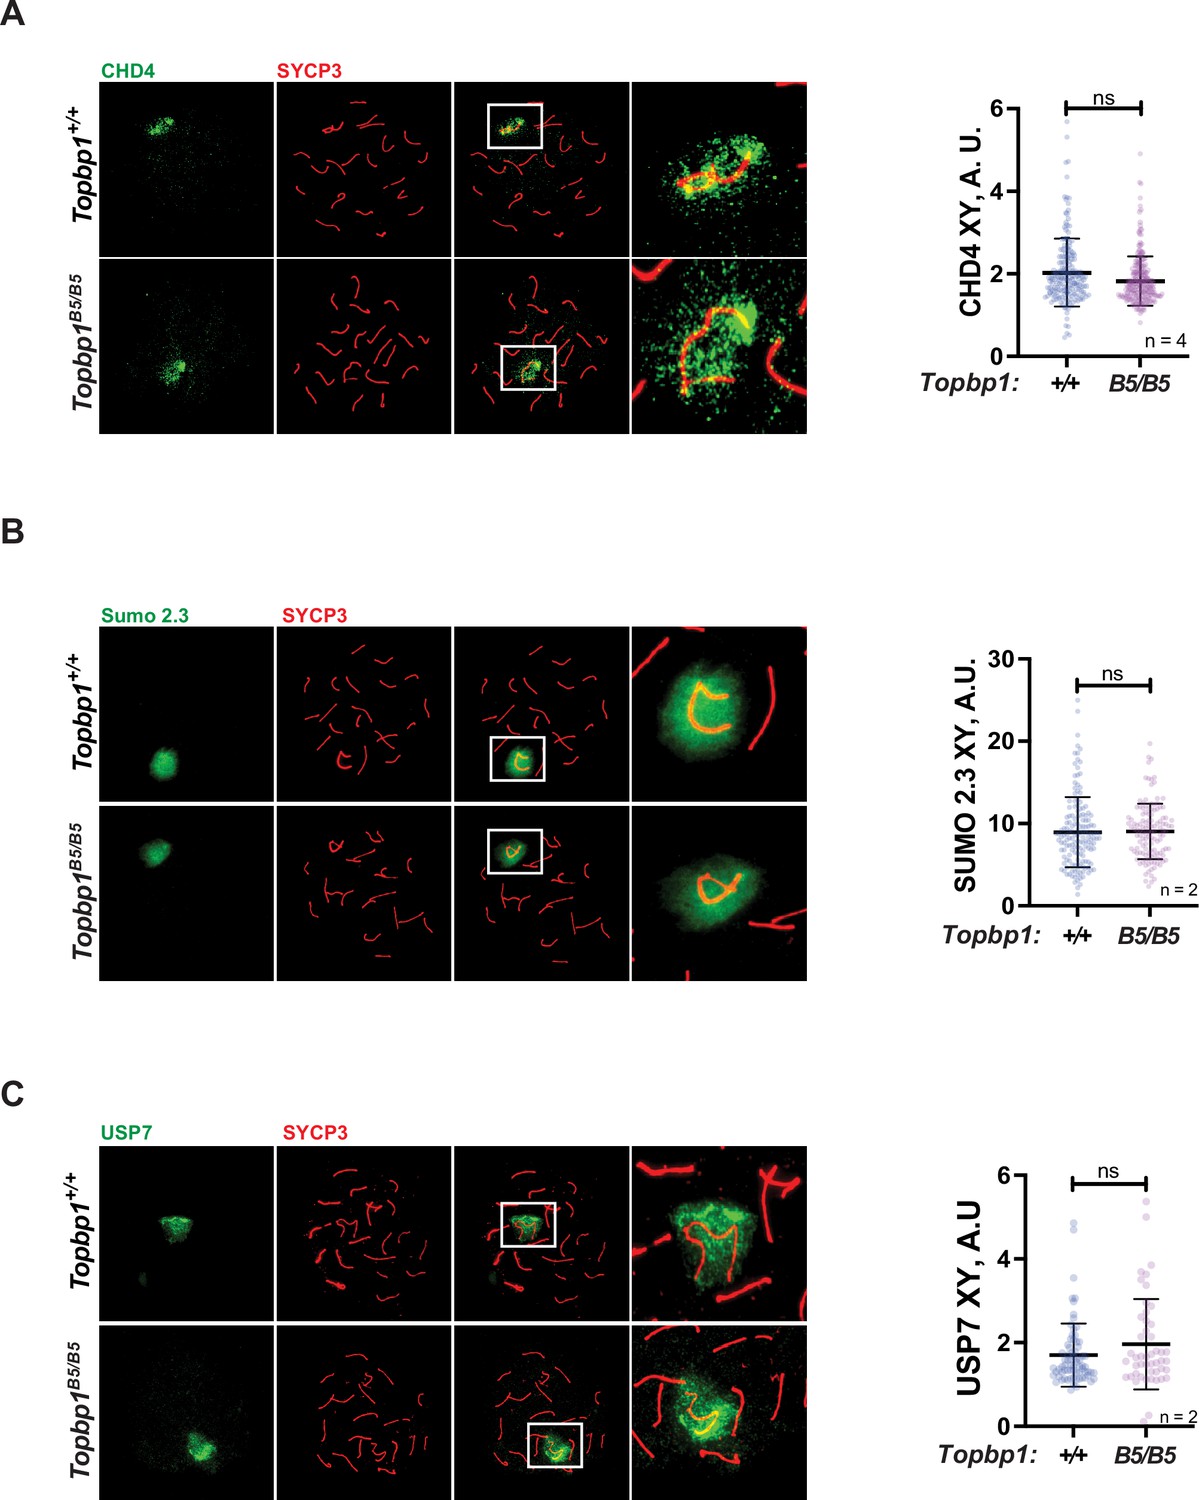
Topbp1B5/B5 pachytene spermatocytes do not exhibit any difference in CHD4, Sumo2-3, and USP7 intensities and localization compared to Topbp1+/+.
(A) Representative images of meiotic spreads showing Topbp1+/+ and Topbp1B5/B5 pachytene spermatocytes stained with SYCP3 and CHD4 on the left, and quantification of CHD4-stained pachytene spreads on the right (each dot represents one pachytene cell measured; Topbp1+/+ number of cells = 176, number of mice = 4; Topbp1B5/B5 number of cells = 215, number of mice = 4; p-value=0.2125). (B) Representative images of meiotic spreads showing Topbp1+/+ and Topbp1B5/B5 pachytene spermatocytes stained with SYCP3 and SUMO2.3 on the left, and quantification of SUMO2.3-stained pachytene spreads on the right (each dot represents one pachytene cell measured; Topbp1+/+ number of cells = 155, number of mice = 2; Topbp1B5/B5 number of cells = 126, number of mice = 2; p-value=0.8951). (C) Representative images of meiotic spreads showing Topbp1+/+ and Topbp1B5/B5 pachytene spermatocytes stained with SYCP3 and USP7 on the left, and quantification of USP7-stained pachytene spreads on the right (each dot represents one pachytene cell measured; Topbp1+/+ number of cells = 73, number of mice = 2; Topbp1B5/B5 number of cells = 48, number of mice = 2; p-value=0.8610). p-Values were calculated using a linear mixed effect model (see ‘Materials and methods’ for details).
Figure 6—figure supplement 2
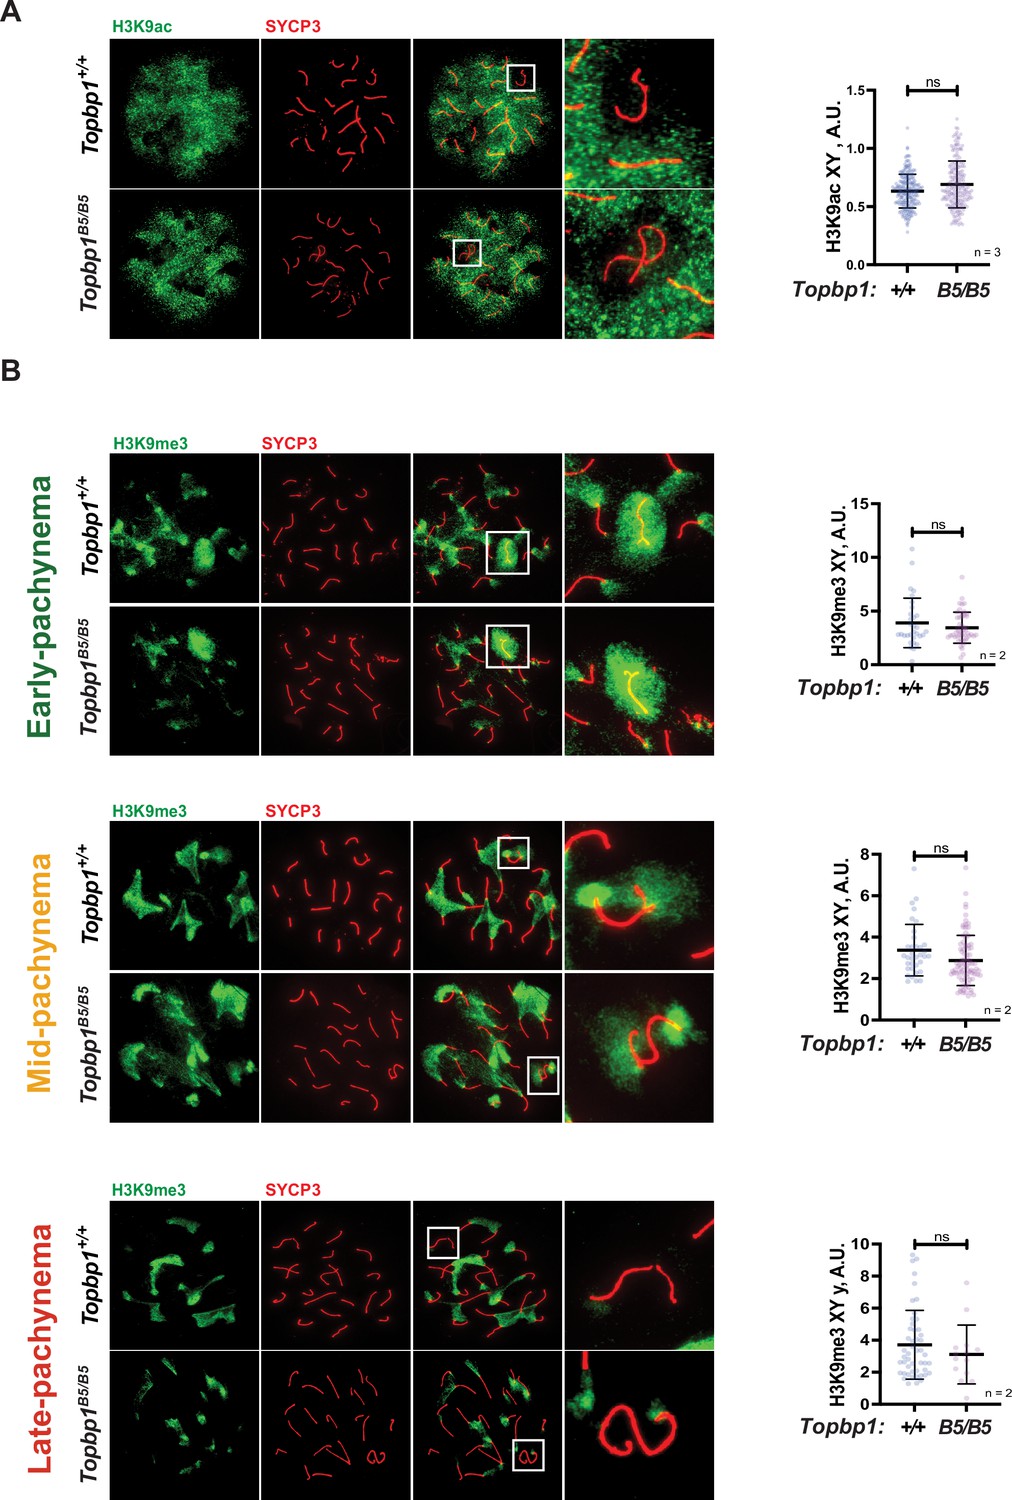
Topbp1B5/B5 pachytene spermatocytes show no difference in H3K9ac or K3K9me3 staining compared to Topbp1+/+.
(A) Representative images of meiotic spreads showing Topbp1+/+ and Topbp1B5/B5 pachytene spermatocytes stained with SYCP3 and H3K9ac on the left, and quantification of H3K9ac-stained pachytene spreads on the right (each dot represents one pachytene cell measured; Topbp1+/+ number of cells = 214, number of mice = 3; Topbp1B5/B5 number of cells = 203, number of mice = 3; p-value=0.4948). (B) Representative images of meiotic spreads showing Topbp1+/+ and Topbp1B5/B5 pachytene spermatocytes stained with SYCP3 and H3K9me3 on the left, and quantification of H3K9me3-stained pachytene spreads on the right. (Early-pachytene spreads: each dot represents one cell measured; Topbp1+/+ number of cells = 31, number of mice = 2; Topbp1B5/B5 number of cells = 48, number of mice = 2; p-value=0.6374; mid-pachytene spreads: each dot represents one cell measured; Topbp1+/+ number of cells = 35, number of mice = 2; Topbp1B5/B5 number of cells = 86, number of mice = 2; p-value=0.3990; late-pachytene: each dot represents one cell measured; Topbp1+/+ number of cells = 49, number of mice = 2; Topbp1B5/B5 number of cells = 14, number of mice = 2; p-value=0.3474.) p-Values were calculated using a linear mixed effect model (see ‘Materials and methods’ for details).
Figure 6—figure supplement 3
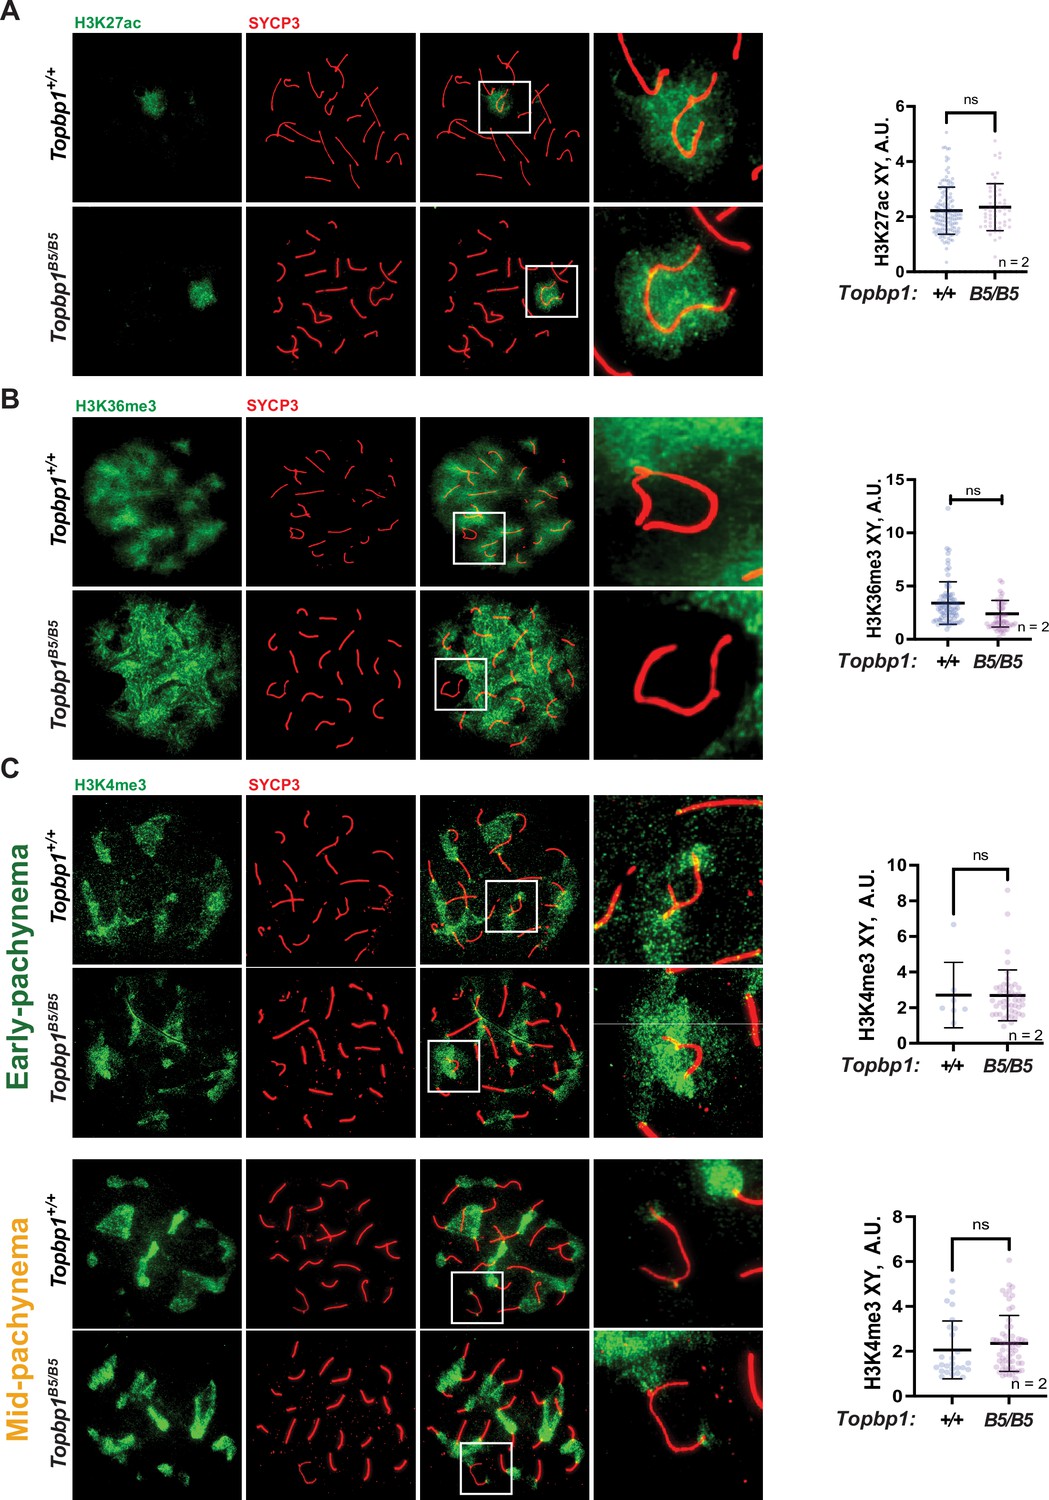
Topbp1B5/B5 pachytene spermatocytes display no difference in H3K27ac, H3K36me3, or K3K4me3 staining compared to Topbp1+/+.
(A) Representative images of meiotic spreads showing Topbp1+/+ and Topbp1B5/B5 pachytene spermatocytes stained with SYCP3 and H3K27ac on the left, and quantification of H3K27ac-stained pachytene spreads on the right (each dot represents one pachytene cell measured; Topbp1+/+ number of cells = 143, number of mice = 2; Topbp1B5/B5 number of cells = 56, number of mice = 2; p-value=0.7881). (B) Representative images of meiotic spreads showing Topbp1+/+ and Topbp1B5/B5 pachytene spermatocytes stained with SYCP3 and H3K36me3 on the left, and quantification of H3K36me3-stained pachytene spreads on the right (each dot represents one pachytene cell measured; Topbp1+/+ number of cells = 79, number of mice = 2; Topbp1B5/B5 number of cells = 52, number of mice = 2; p-value=0.2778). (C) Representative images of meiotic spreads showing Topbp1+/+ and Topbp1B5/B5 pachytene spermatocytes stained with SYCP3 and H3K4me3 on the left, and quantification of H3K4me3-stained pachytene spreads on the right. (Early-pachytene spreads: each dot represents one cell measured Topbp1+/+ number of cells = 7, number of mice = 2; Topbp1B5/B5 number of cells = 46, number of mice = 2; p-value=0.9895; mid-pachytene spreads: each dot represents one cell measured; Topbp1+/+ number of cells = 26, number of mice = 2; Topbp1B5/B5 number of cells = 58, number of mice = 2; p-value = 0.3292.). p-Values were calculated using a linear mixed effect model (see ‘Materials and methods’ for details).
Figure 6—figure supplement 4
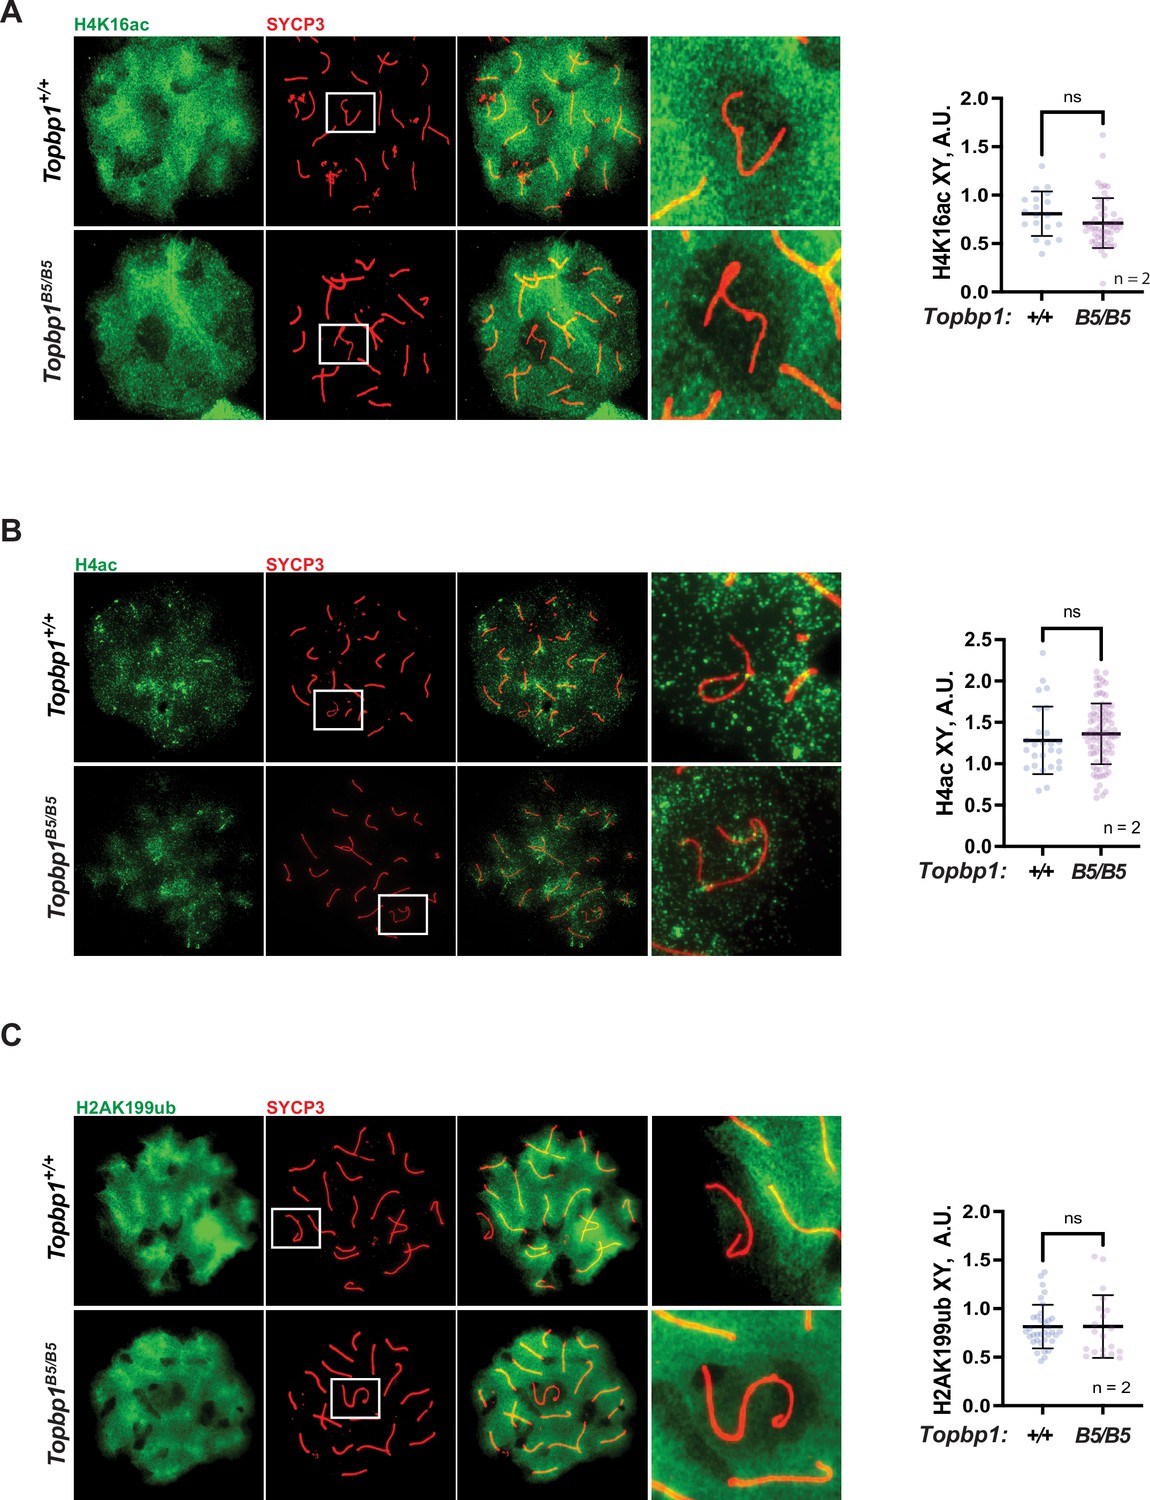
Topbp1B5/B5 pachytene spermatocytes display no difference in H4K16ac, H4ac, or H2AK166ub staining compared to Topbp1+/+.
(A) Representative images of meiotic spreads showing Topbp1+/+ and Topbp1B5/B5 pachytene spermatocytes stained with SYCP3 and H4K16ac on the left, and quantification of H4K16ac-stained pachytene spreads, on the right (each dot represents one pachytene cell measured; Topbp1+/+ number of cells = 19, number of mice = 1; Topbp1B5/B5 number of cells = 53, number of mice = 2; p-value=0.7314). (B) Representative images of meiotic spreads showing Topbp1+/+ and Topbp1B5/B5 pachytene spermatocytes stained with SYCP3 and H4ac on the left, and quantification of H4ac-stained pachytene spreads on the right (each dot represents one pachytene cell measured; Topbp1+/+ number of cells = 26, number of mice = 2; Topbp1B5/B5 number of cells = 87, number of mice = 2; p-value=0.6795). (C) Representative images of meiotic spreads showing Topbp1+/+ and Topbp1B5/B5 pachytene spermatocytes stained with SYCP3 and H2A-K199-ub on the left, and quantification of H2A-K199-ub-stained pachytene spreads on the right (each dot represents one pachytene cell measured; Topbp1+/+ number of cells = 35, number of mice = 2; Topbp1B5/B5 number of cells = 20, number of mice = 2; p-value=0.9941). p-Values were calculated using a linear mixed effect model (see ‘Materials and methods’ for details).
Figure 6—figure supplement 5
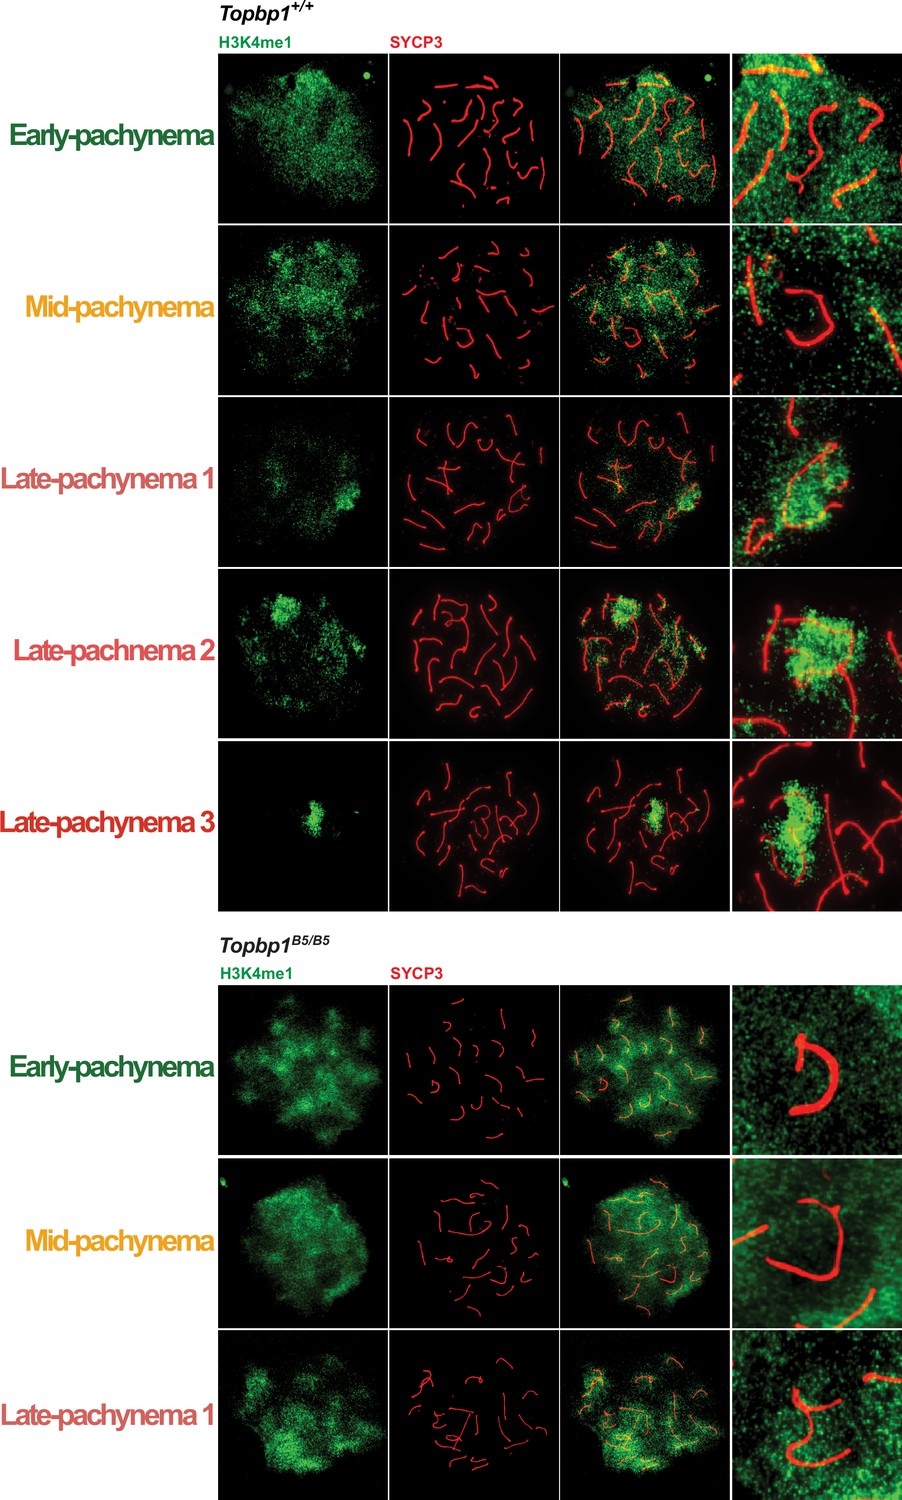
From early pachytene to beginning of late pachytene, Topbp1B5/B5 spermatocytes exhibit the same localization pattern of H3K4me1 compared to Topbp1+/+.
Representative images of Topbp1+/+ and Topbp1B5/B5 early, mid, and late pachytene spermatocytes stained with H3K4me1 and SYCP3.
Figure 6—figure supplement 6
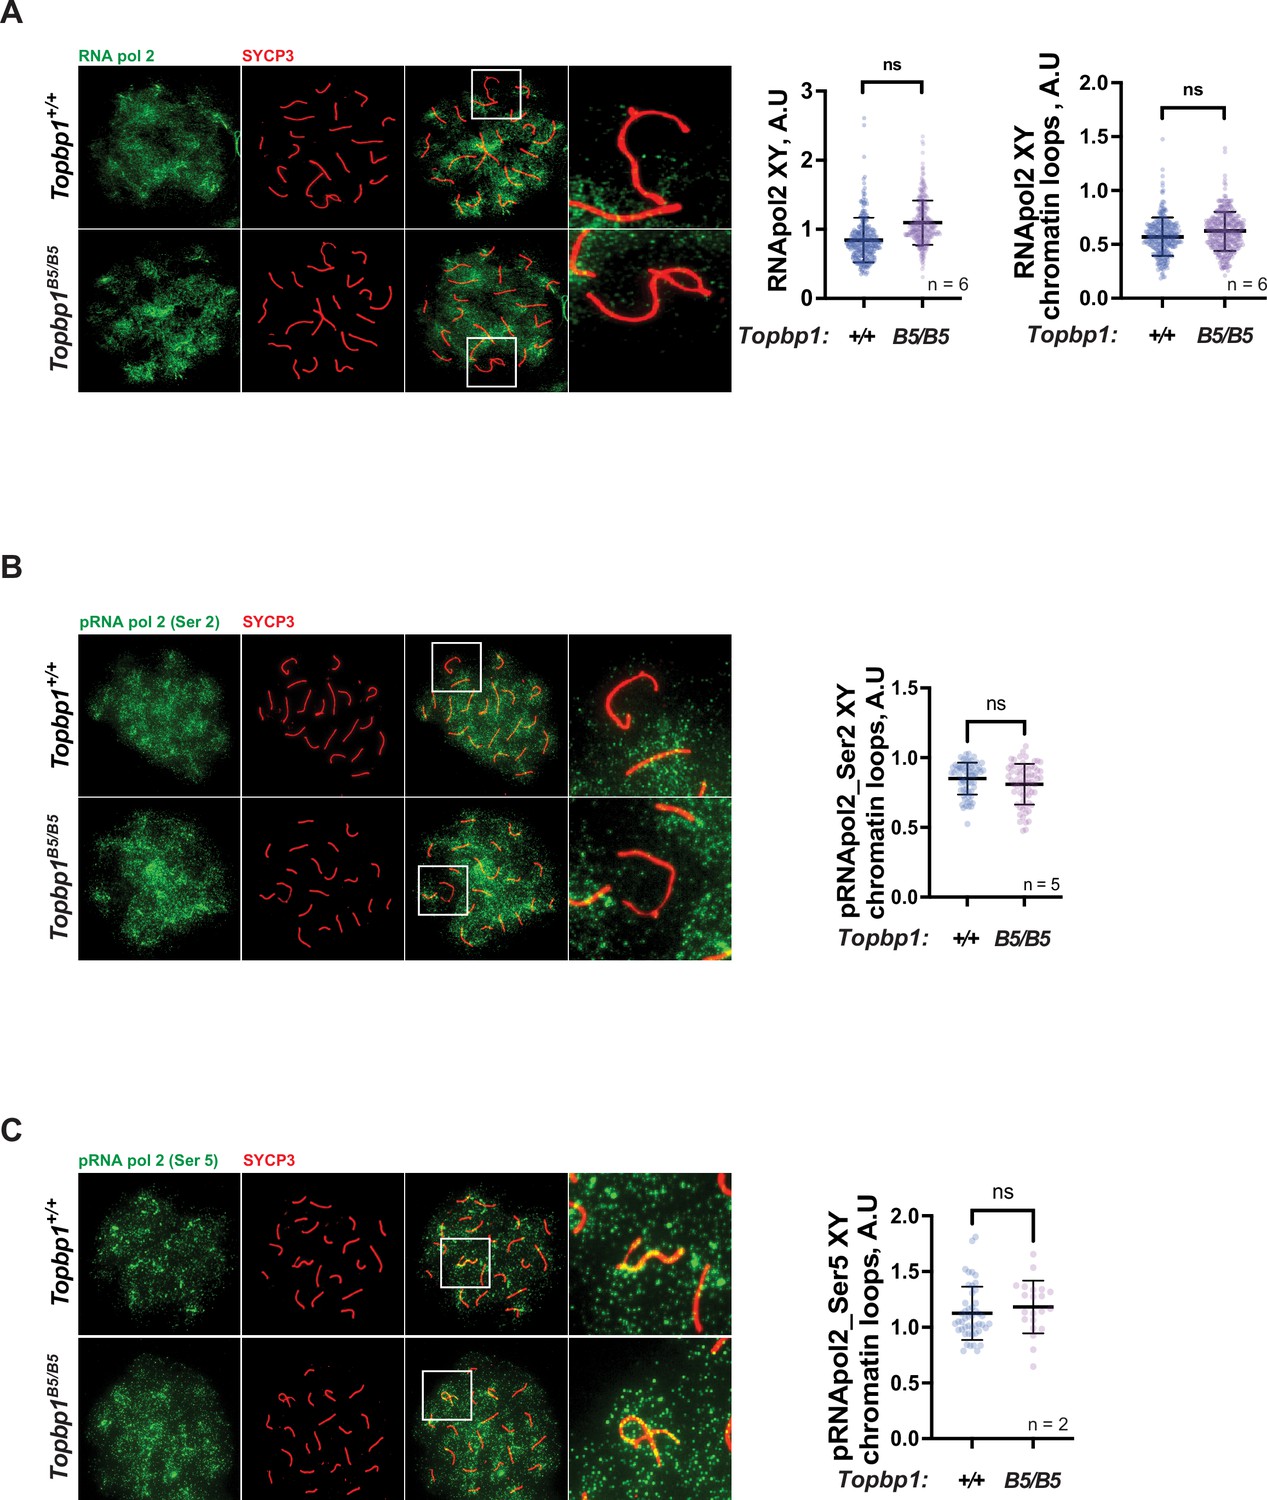
Topbp1B5/B5 pachytene spermatocytes exhibit no differences in the intensity or localization patterns of RNApol2, pRNApol2_Ser2, or pRNApol2_ser5 compared to Topbp1+/+.
(A) Representative images of meiotic spreads showing Topbp1+/+ and Topbp1B5/B5 pachytene spermatocytes stained with SYCP3 and RNApol2 on the left, and quantification of RNApol2-stained pachytene spreads on the right (each dot represents one pachytene cell measured; Topbp1+/+ number of cells = 242, number of mice = 6; Topbp1B5/B5 number of cells = 289, number of mice = 6; p-value for X and Y cores = 0.2026, p-value for X and Y chromatin loops = 0.4407). (B) Representative images of meiotic spreads showing Topbp1+/+ and Topbp1B5/B5 pachytene spermatocytes stained with SYCP3 and pRNApol2-Ser2 on the left, and quantification of pRNApol2-Ser2-stained pachytene spreads on the right (each dot represents one pachytene cell measured; Topbp1+/+ number of cells = 66, number of mice = 5; Topbp1B5/B5 number of cells = 66, number of mice = 5; p-value=0.3862). (C) Representative images of meiotic spreads showing Topbp1+/+ and Topbp1B5/B5 pachytene spermatocytes stained with SYCP3 and pRNApol2-Ser5 on the left, and quantification of pRNApol2-Ser5-stained pachytene spreads on the right (each dot represents one pachytene cell measured; Topbp1+/+ number of cells = 47, number of mice = 3; Topbp1B5/B5 number of cells = 21, number of mice = 2; p-value=0.5104). p-Values were calculated in GraphPad using a linear mixed effect model. p-Values were calculated using a linear mixed effect model (see ‘Materials and methods’ for details).
Figure 6—figure supplement 7

Genes used as markers to define the stages of the germ cells in the scRNAseq analysis.
Uniform Manifold Approximation and Projection (UMAP) plots showing markers for spermatogonia (Sal1 and Dmrt1), spermatocytes (Dazl, Id4, Sycp3, and Shcbp1l), and spermatids (Acrv1, Oaz3, and Prm2).
Figure 6—figure supplement 8
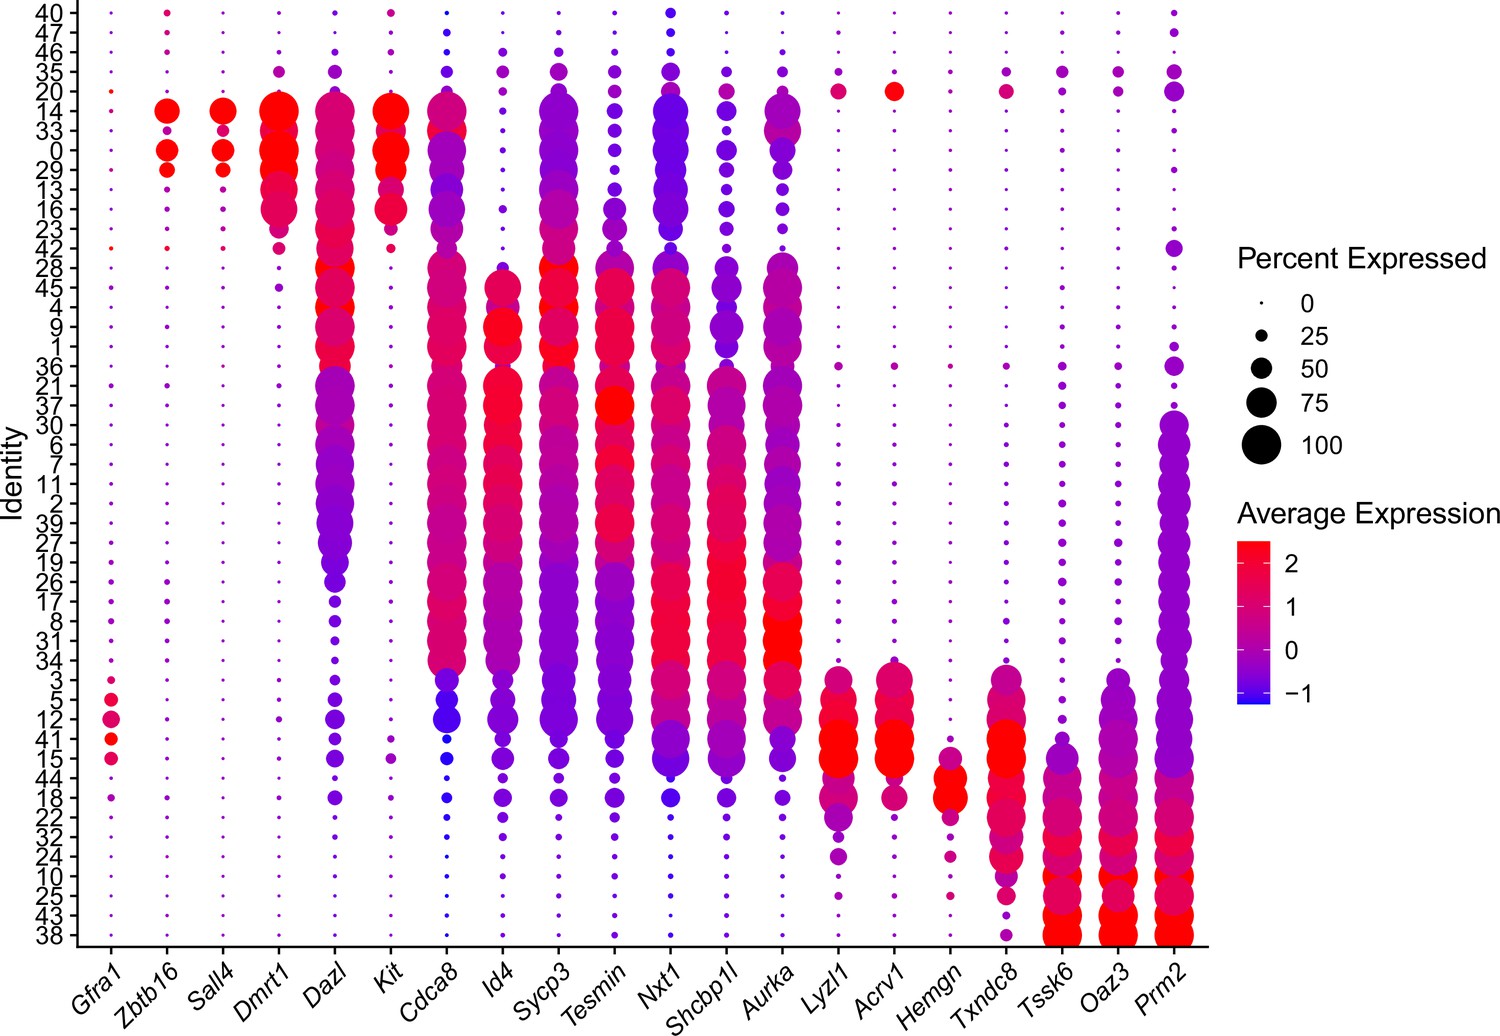
Genes used as markers to track spermatogenesis progression and form the 47 sub-cluster for all cells captured in the 10X platform in the scRNAseq analysis.
Bubble plot displaying gene markers and their respective pattern of expression during spermatogenesis.
Figure 6—figure supplement 9
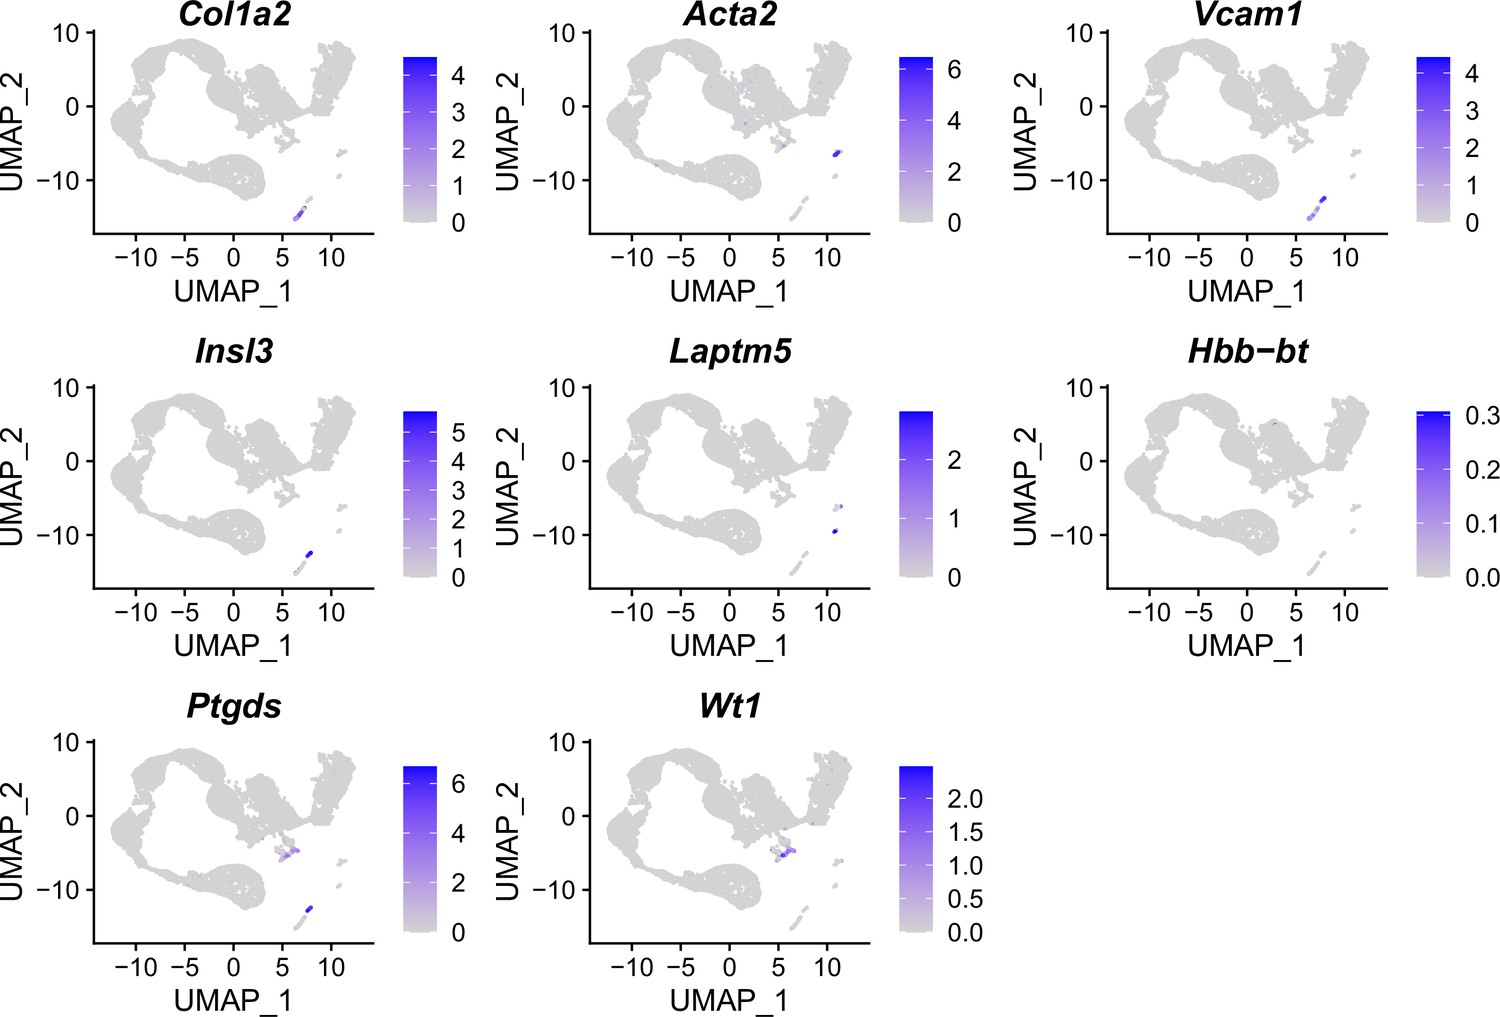
Genes used as markers of somatic cells captured in the scRNAseq analysis.
Uniform Manifold Approximation and Projection (UMAP) plots show markers for the somatic cells captured on the germ cell-enriched population, endothelial and hematopoietic (Col1a2, Vcam1, Laptm5, and Insl3), smooth muscle (Acta2), and Sertoli (Ptgds and Wt1).
Figure 6—figure supplement 10
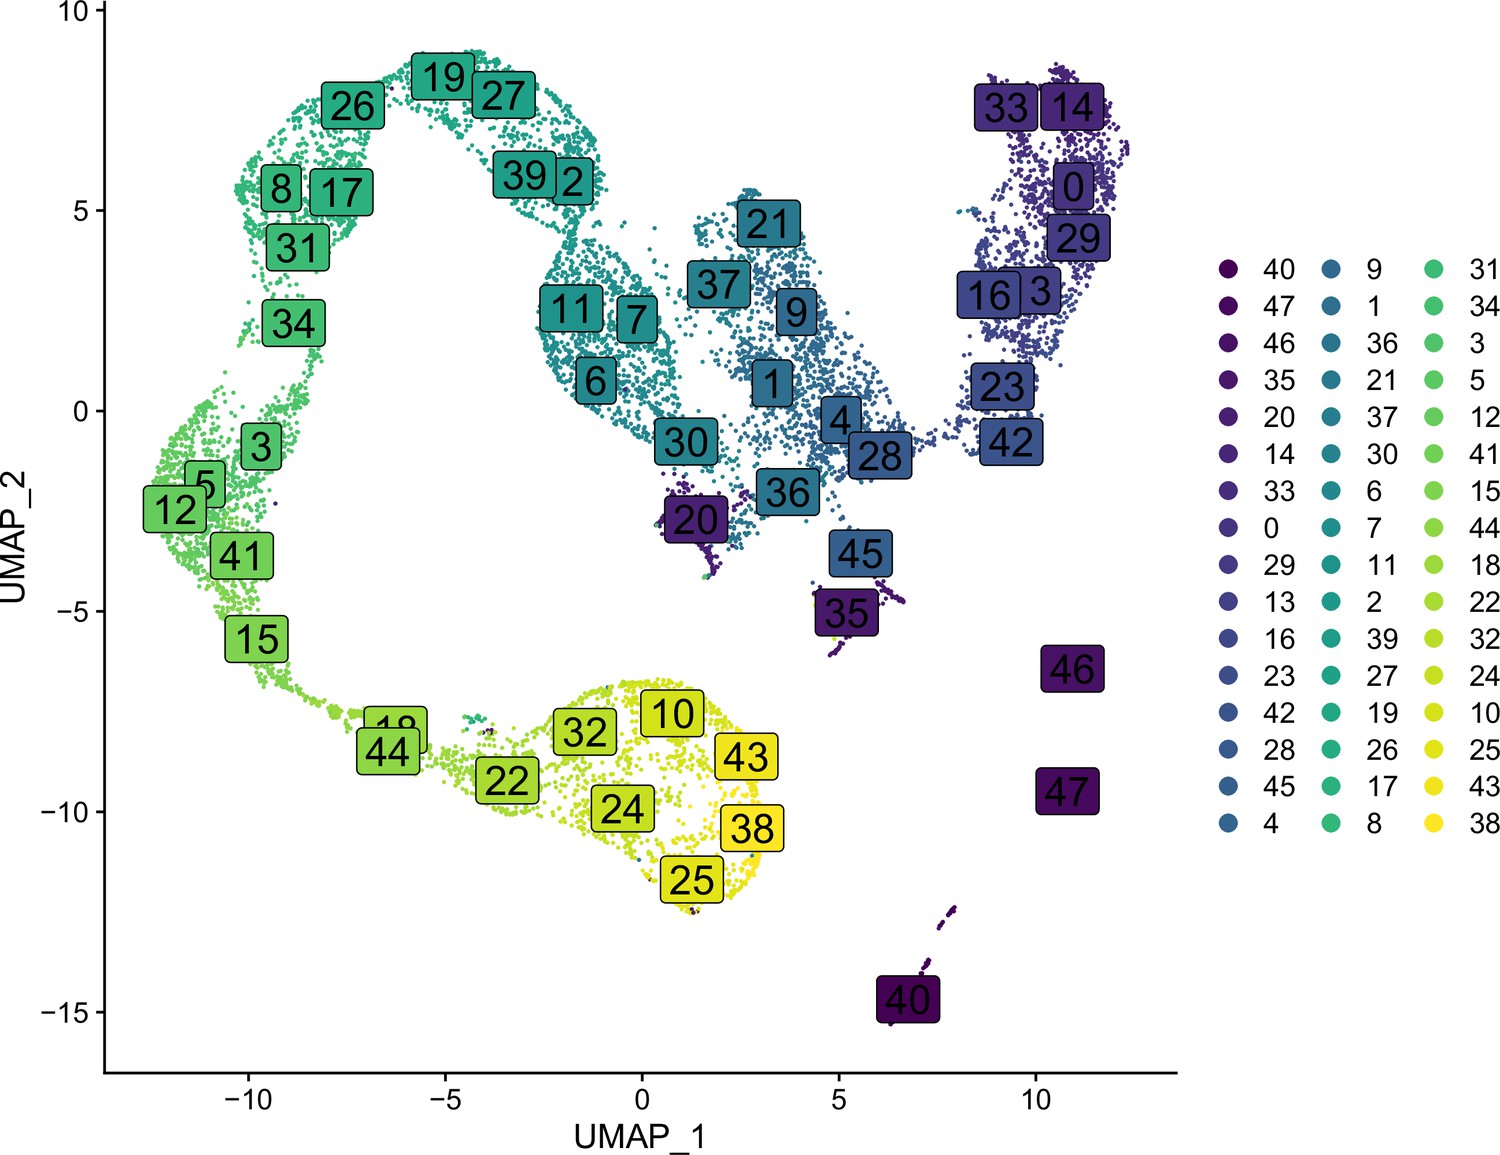
Analysis of sub-clusters of all cells captured in the 10X platform.
Uniform Manifold Approximation and Projection (UMAP) plot displaying the 47 sub-clusters of cells captured in the scRNAseq analysis.
Figure 6—figure supplement 11

Analysis of the main 24 sub-clusters captured in the germ cells-enriched scRNAseq analysis.
Uniform Manifold Approximation and Projection (UMAP) plot showing 24 sub-clusters for spermatogonia, spermatocytes, round spermatids, spermatids, Sertoli, smooth muscle, and endothelial and hematopoietic cells captured in the 10X platform.
Figure 6—figure supplement 12

Spermatocytes from Topbp1+/+ and Topbp1B5/B5 show correlation greater than 0.9.
Plot of Pearson correlation values between cell groups separated by cluster and genotype using log-normalized average expression of all genes.
Figure 6—figure supplement 13
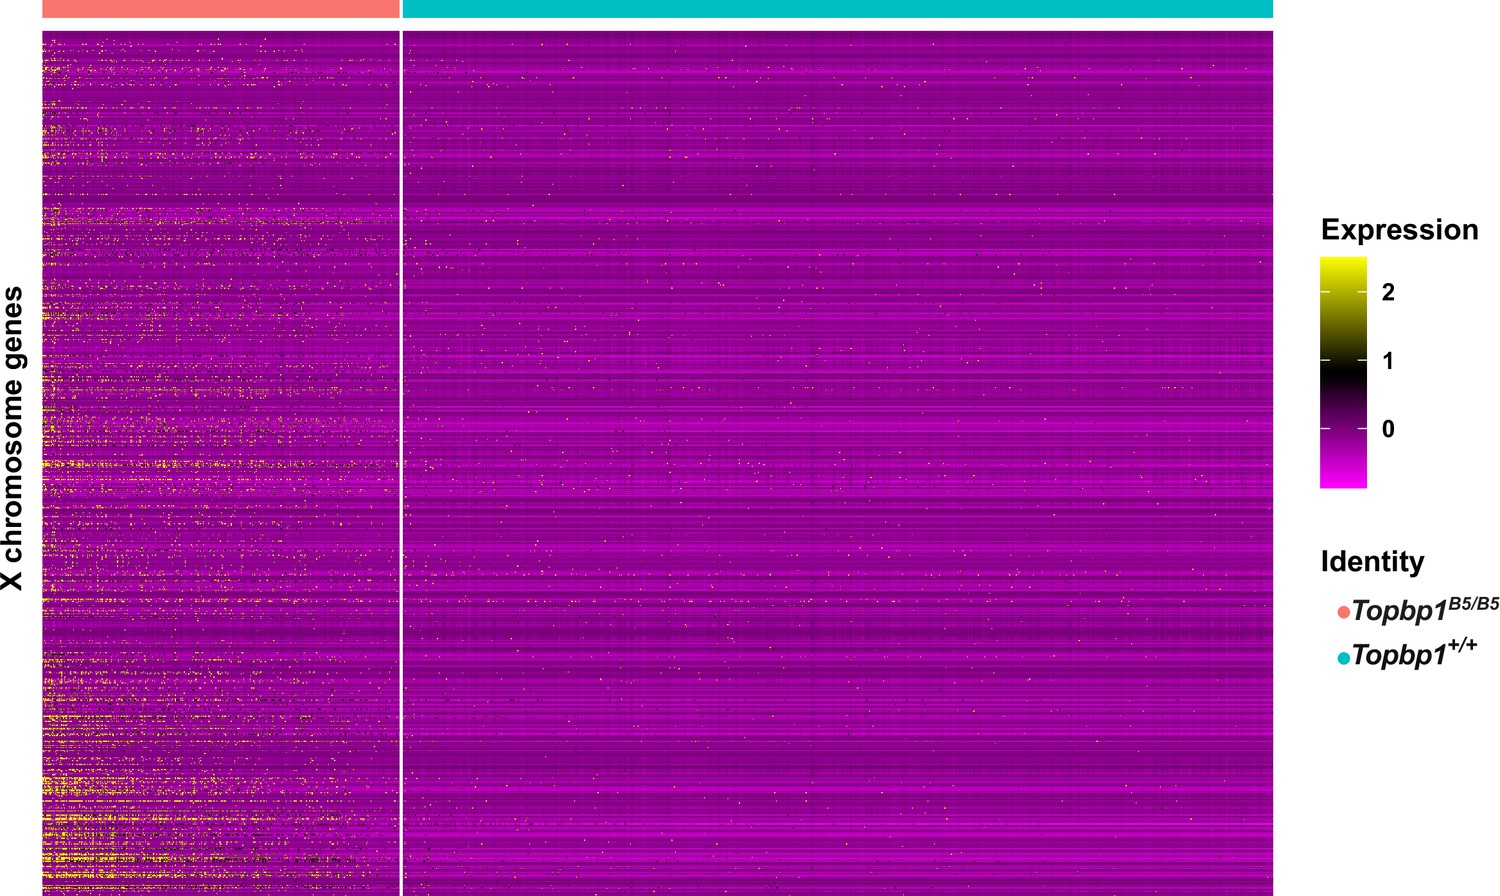
Topbp1B5/B5 pachytene spermatocytes show increased expression of X-linked genes.
Heatmap displaying the expression levels of X-chromosome genes in spermatocyte 3 stage (pachytene) of Topbp1B5/B5 on the right and Topbp1+/+ on the left. Each line represents a gene, and each row is a cell.
Figure 6—figure supplement 14

Topbp1B5/B5 pachytene spermatocytes show increased expression of XY ‘killer genes’ and other X and Y genes typically used to illustrate meiotic sex chromosome inactivation (MSCI) defects.
Violin plots showing the level of expression and number of cells expressing the XY chromosome genes in SP3 (pachytene): Zfy1, Zfy2, Kdm6a, Lamp2, Scml2, Zfx, Uba1y, and Rhox13 in Topbp1B5/B5 and in Topbp1+/+. The Wilcoxon test was used to calculate the p-values. **p<0.01, ***p<0.001, and **** p<0.0001.
Figure 6—figure supplement 15
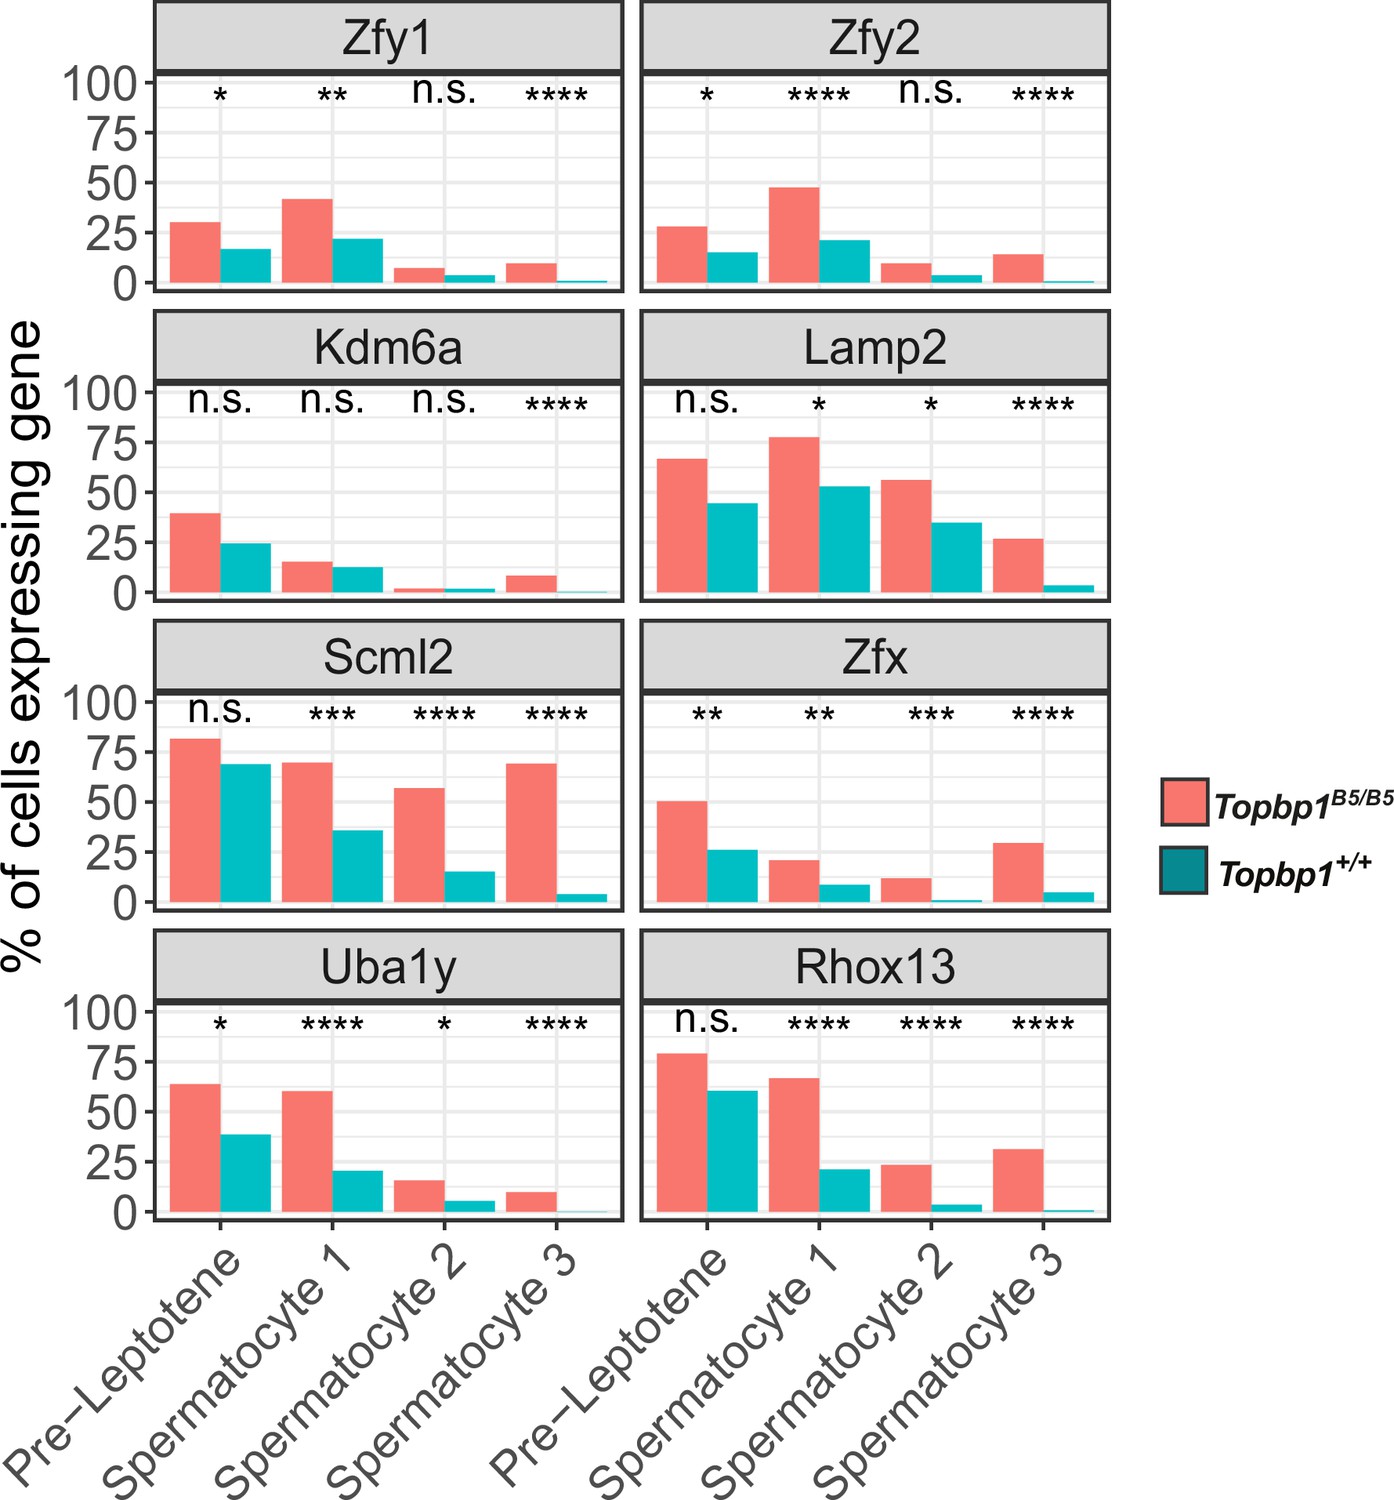
Topbp1B5/B5 pachytene spermatocytes show increased expression of XY-linked genes.
Bar plots showing the number of cells expressing the XY chromosome genes in SP3 (pachytene): Zfy1, Zfy2, Kdm6a, Lamp2, Scml2, Zfx, Uba1y, and Rhox13 in Topbp1B5/B5 and in Topbp1+/+. Fisher’s exact test was used to calculate the p-values. **p<0.01, ***p<0.001, and ****p<0.0001.
Figure 6—figure supplement 16
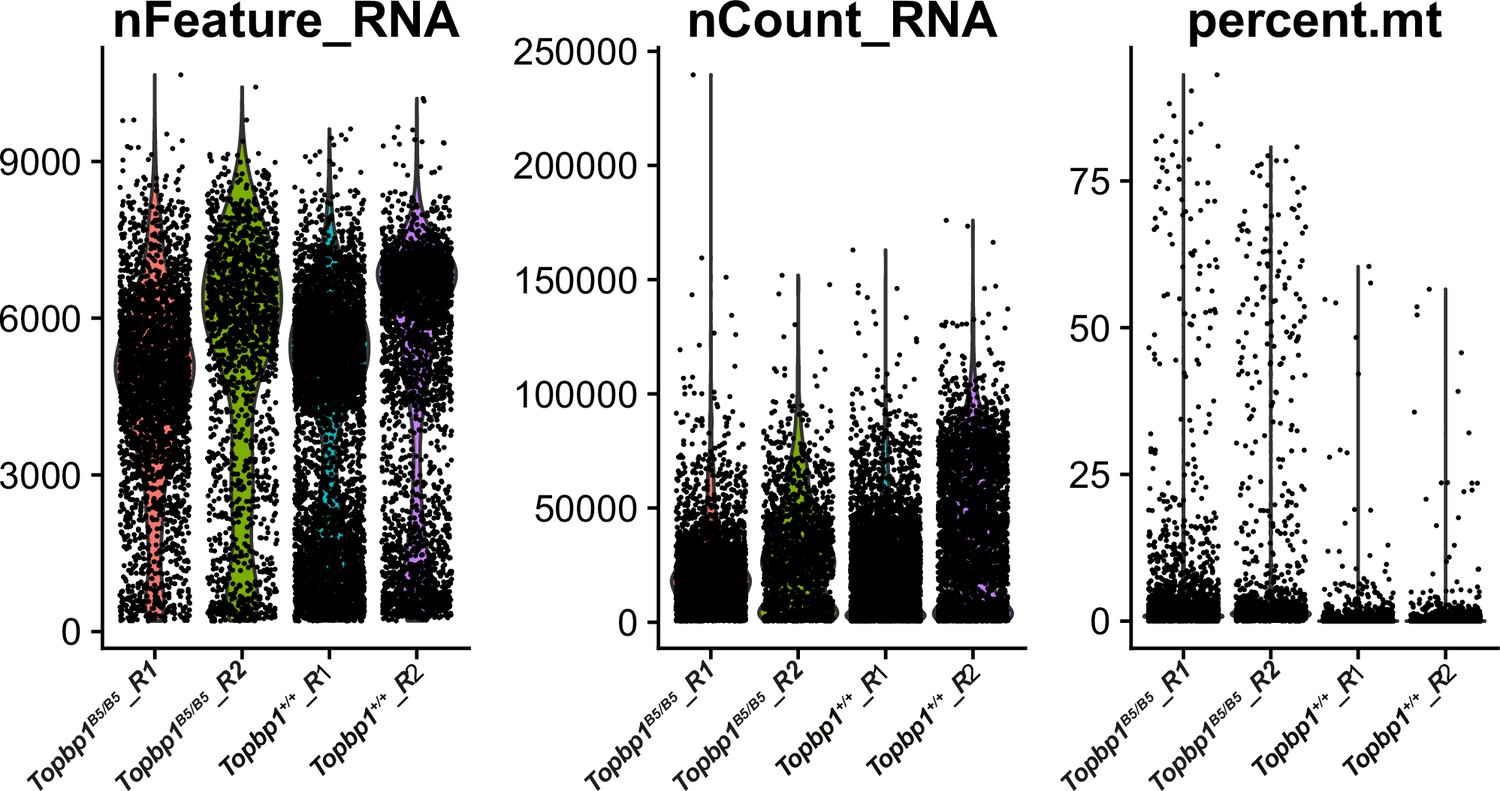
Quality control of the scRNAseq data.
Violin plots show the quality control for the scRNAseq data, displaying the distribution of gene counts, UMI counts, and mitochondrial gene percentage per library before filtering data.
Figure 7 with 2 supplements
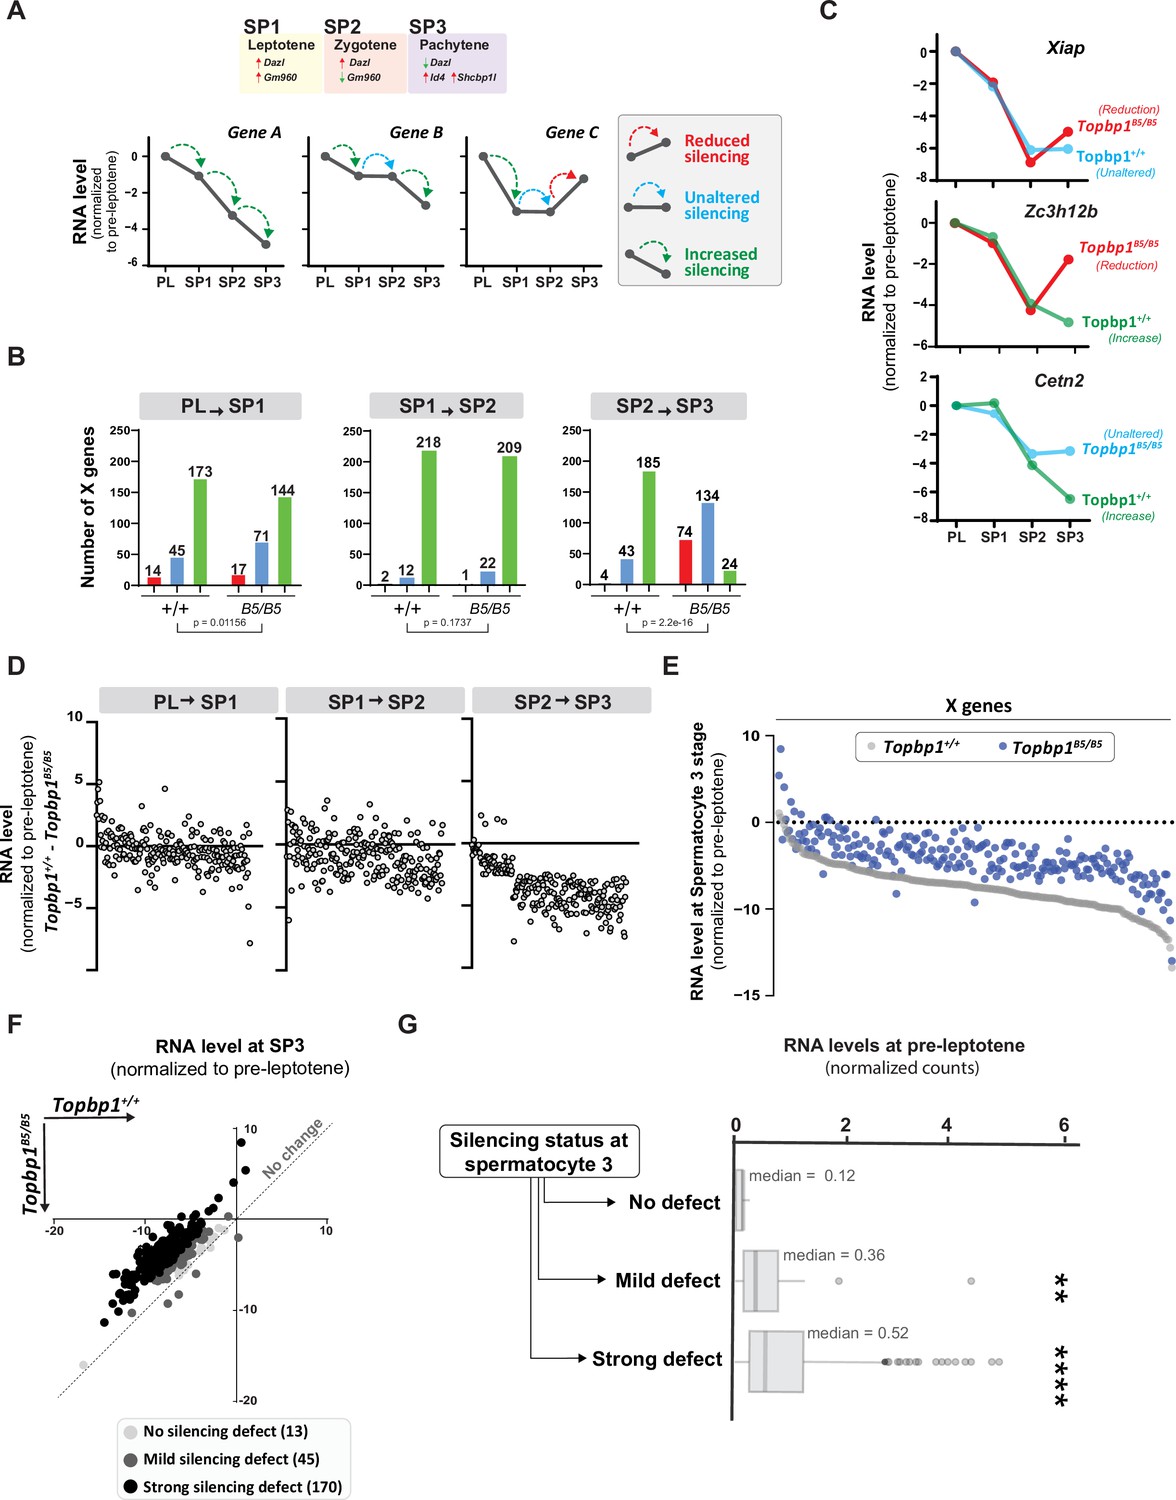
TOPBP1 regulates silencing dynamics of X genes at the spermatocyte 3 stage.
(A) Illustration of the gene markers used to define spermatocyte 1 as leptotene, spermatocyte 2 as zygotene, and spermatocyte 3 as pachytene; hypothetical examples illustrating the categorization of transitions in silencing dynamics between the stages of pre-leptotene (PL), spermatocyte 1 (SP1), spermatocyte 2 (SP2), and spermatocyte 3 (SP3). (B) Number of genes in each of the categories described in (A), during the different stage transitions and respective p-values above each graph (the p-values were calculated using the Fisher’s exact test). (C) Examples of genes with altered silencing dynamics in the Topbp1B5/B5, red = reduced silencing, blue = unaltered silencing and green = increased silencing (D) Scatter plot showing the difference in RNA level between Topbp1+/+ and Topbp1B5/B5 for each of the indicated stage transitions. (E) Scatter plot showing expression level of X-chromosome genes, normalized to pre-leptotene levels, in Topbp1+/+ (gray) and Topbp1B5/B5 (blue) at SP3. (F) Graph plotting expression levels of X-chromosome genes, normalized to pre-leptotene levels, in Topbp1+/+ (Y axis) and Topbp1B5/B5 (X axis) and split in three categories based on the severity of silencing defect. (G) Box plot showing PL expression levels of X-chromosome genes in each of the categories of silencing defect severity shown in (F).
Figure 7—figure supplement 1

Analysis of the gene marker used to define the zygotene stage.
Uniform Manifold Approximation and Projection (UMAP) analysis of the gene Gm960 was used as a gene marker to define the zygotene stage.
Figure 7—figure supplement 2
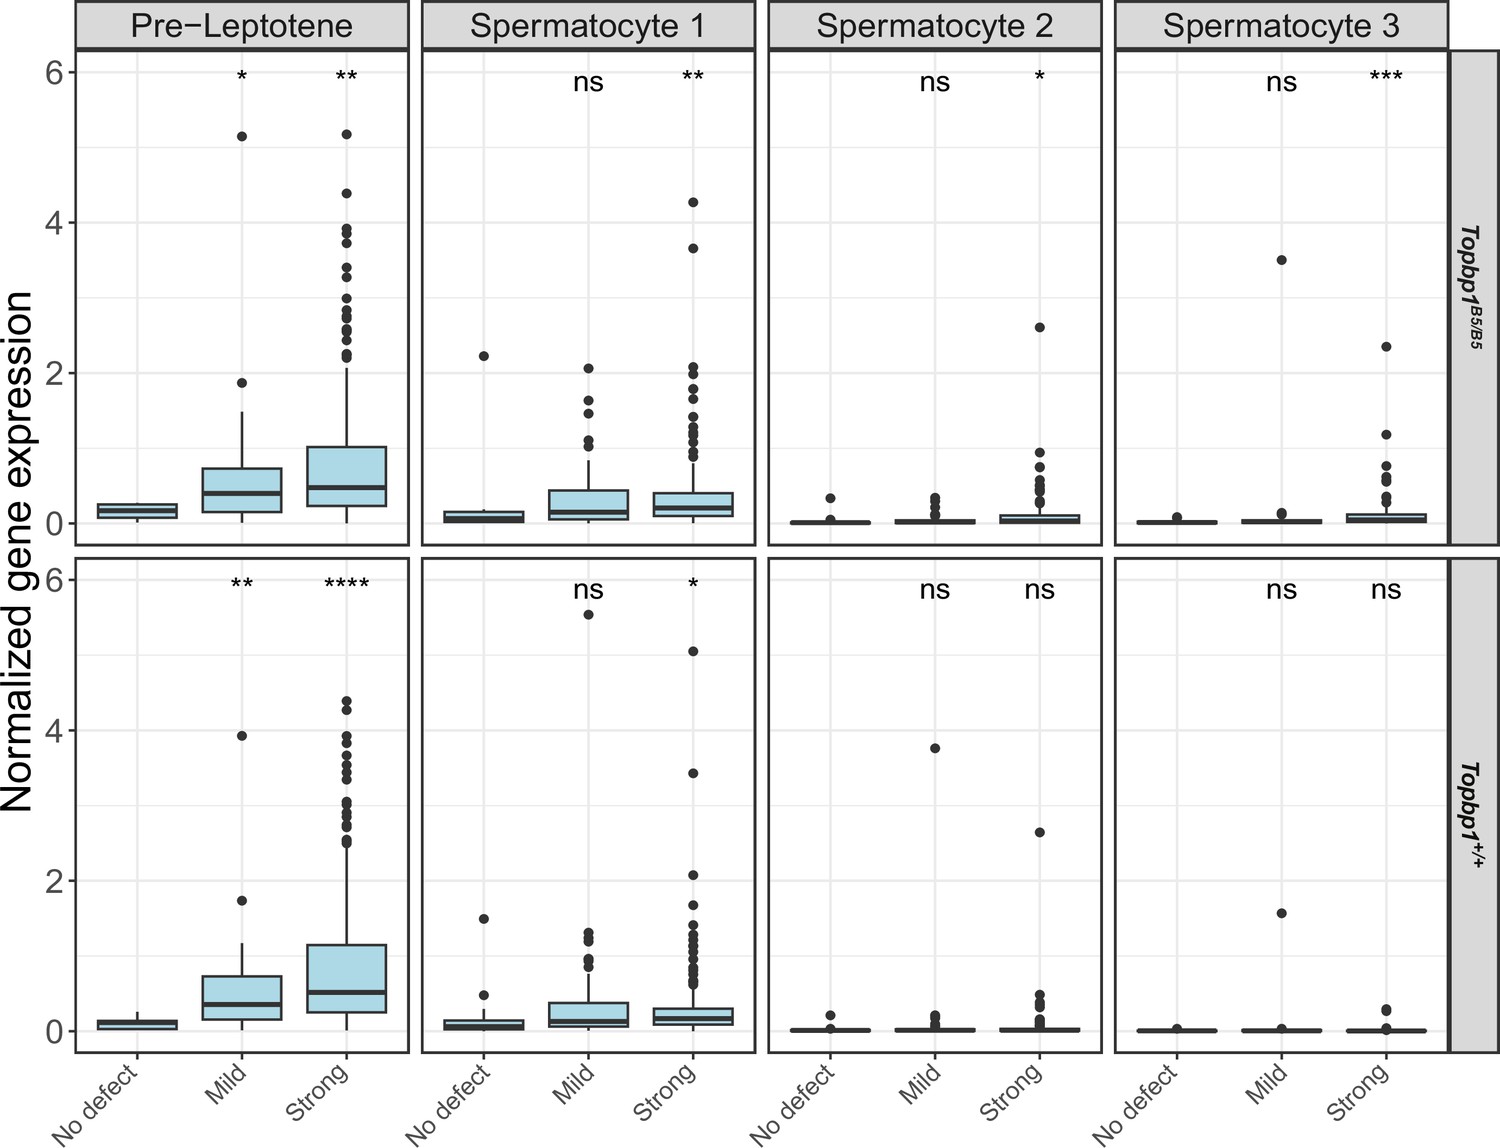
Expression levels of genes with no defects, mild defects, and strong defects in Topbp1B5/B5 and Topbp1+/+.
Boxplot showing the expression levels of the clusters of genes with no defects, mild defects, and strong defects from pre-leptotene to Spermatocyte 3 (pachytene) in Topbp1B5/B5 and Topbp1+/+. The Wilcoxon rank-sum test was used to calculate the p-values. *p<0.05, **p<0.01, ***p<0.001, and ****p<0.0001.
Figure 8
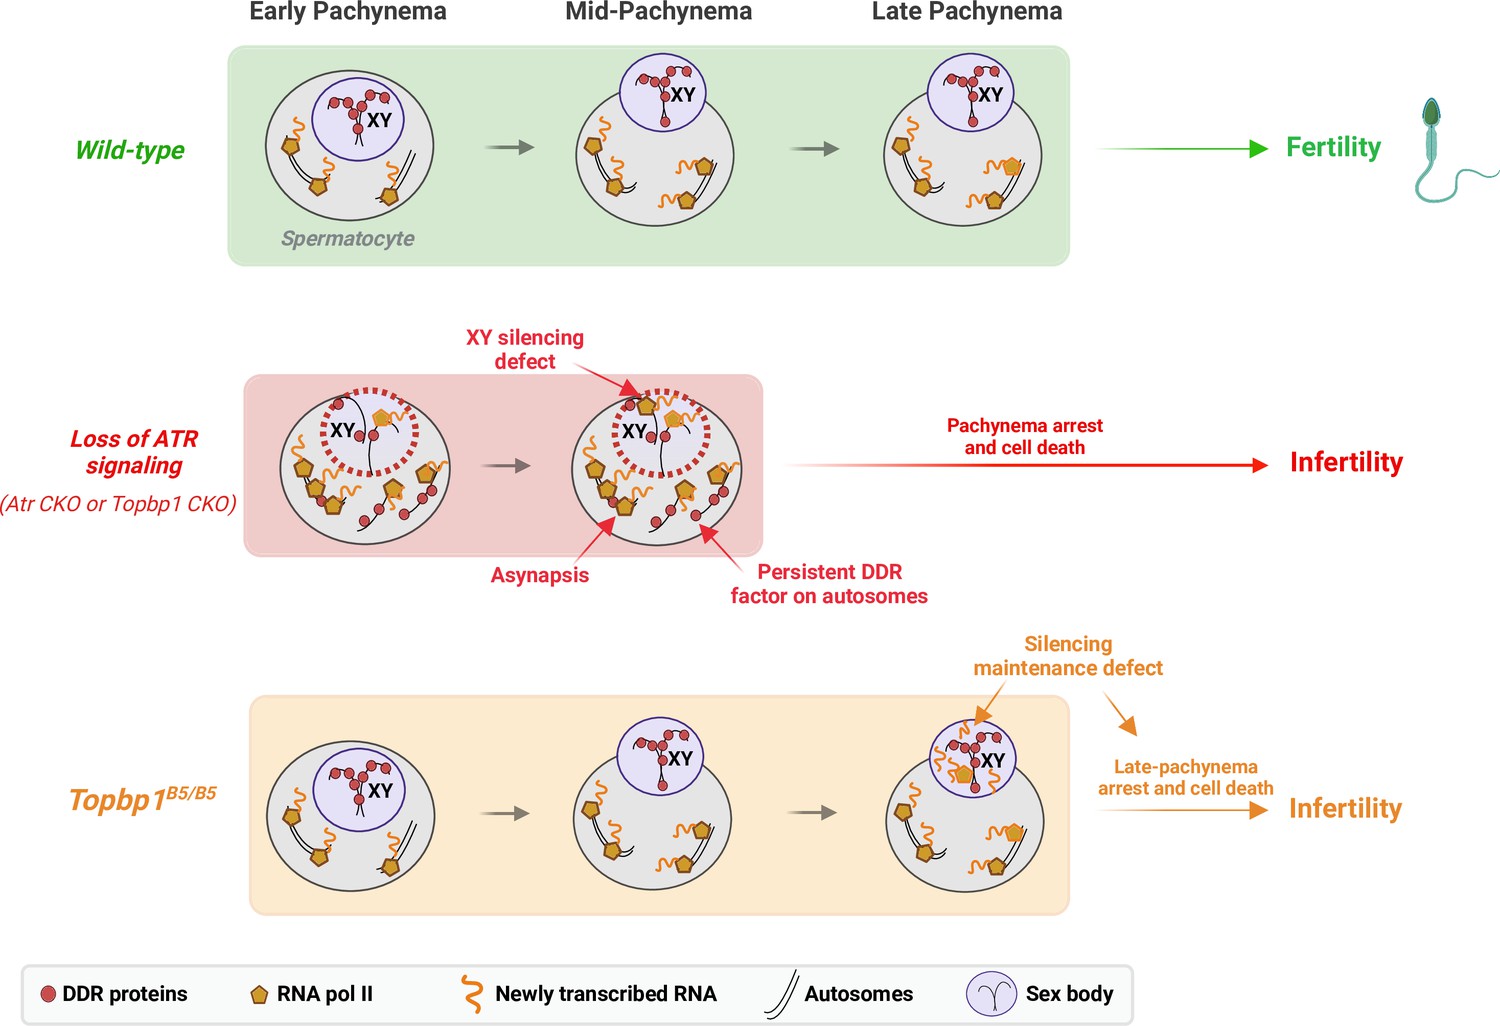
A new TOPBP1 mutant separates XY silencing from sex body formation.
Schematic of sub-stages of meiotic prophase I. In wild-type mice, meiotic sex chromosome inactivation (MSCI) initiates following the accumulation of the DNA damage response (DDR) proteins at the XY chromosomes. During mid-pachytene, the XY body is fully formed, and transcription is restricted to the autosomes. In Atr or Topbp1 CKOs, the sex body is not formed, and the DDR proteins are not sequestered to the XY. Asynapsis events and transcription of toxic genes at the sex chromosomes are observed, triggering mid-pachytene arrest. In Topbp1B5/B5, MSCI initiates, the sex body is normally formed with normal recruitment of DDR proteins to the X and Y chromosomes, yet cells fail in the reinforcement/maintenance of silencing. Cells progress through mid-pachytene but not into diplonema.
Author response image 1

Topbp1B5/B5 displays normal condensation of the XY-pair.
(A) Immunostaining of XY condensation in Topbp1+/+ and Topbp1B5/B5 testes sections (γH2AX: green and DAPI: gray). (B) Quantification of all sex body-positive cells per tubule (Topbp1+/+ number of cells counted = 781, number of tubules counted = 28, number of mice = 3; Topbp1B5/B5 number of cells counted = 967, number of tubules counted = 28, number of mice = 3). (C) Quantification of elongated-sex body cells per tubule (Topbp1+/+ number of cells counted = 19 and 762 normal round/oval-sex bodies cells, number of tubules counted = 28, number of mice = 3; Topbp1B5/B5 number of cells counted = 45 and 922 normal round/oval-sex bodies cells, number of tubules counted = 28, number of mice = 3).
Author response image 2

Genes used as markers of spermatocytes captured in the scRNAseq analysis.
Violin plots display the distribution of cells expressing Gm960 (Leptotene marker), Meiob(Leptotene/Zygotene marker), Psma8 (Pachytene marker), Pwill1 (Pachytene marker), Pou5f2 (Diplotene marker), and Ccna1 (Secondary Spermatocytes marker).
Author response image 3

Single cell RNAseq reveals that Topbp1B5/B5 spermatocytes initiate MSCI but fail to promote full silencing of Y chromosome-linked genes.
Violin plot displaying the ratio of the average expression of Y chromosome genes by the average expression of chromosome 9 genes at different stages of spermatogenesis for Topbp1+/+ and Topbp1B5/B5 cells.
Tables
Appendix 1—key resources table
| Reagent type (species) or resource | Designation | Source or reference | Identifiers | Additional information |
|---|---|---|---|---|
| Sequence-based reagent | p3xflag-TOPBP1-Flag-N-terminal-F | IDT | PCR primer | attcatcgatagatctgataAT GTCCAGAAATGACAAAGA |
| Sequence-based reagent | p3xflag-TOPBP1-Flag-N-terminal-R | IDT | PCR primer | tagagtcgactggtaccgatttag TGTACTCTAGGTCGTT |
| Sequence-based reagent | TOPBP1_K1317A_R | IDT | Site-directed mutagenesis | tgccactgaggctaaatacg cctcgtttcgaagtggatgt |
| Sequence-based reagent | TOPBP1_K1317A_F | IDT | Site-directed mutagenesis | acatccacttcgaaacgagg cgtatttagcctcagtggca |
| Sequence-based reagent | TOPBP1_K155A_F | IDT | Site-directed mutagenesis | caggtttgcagcaactaaat atgctttgctaccaacttctcctgca |
| Sequence-based reagent | TOPBP1_K155A_R | IDT | Site-directed mutagenesis | tgcaggagaagttggtagcaaa gcatatttagttgctgcaaacctg |
| Sequence-based reagent | TOPBP1_K250A_R | IDT | Site-directed mutagenesis | tctcttggcacactcatacg cctgaccttttggttcttgc |
| Sequence-based reagent | TOPBP1_K250A_F | IDT | Site-directed mutagenesis | gcaagaaccaaaaggtcagg cgtatgagtgtgccaagaga |
| Sequence-based reagent | Topbp1_BRCT5-Fwd genotyping | IDT | PCR primer | tgcatttccattaaccaacctc |
| Sequence-based reagent | Topbp1_BRCT5 Rev genotyping | IDT | PCR primer | ggtagagttcaaatgtgtgtcatg |
| Antibody | Anti-phospho H2A.X (Ser139) (mouse monoclonal) | Millipore | Cat# 05-636; RRID:AB_309864 | IF (meiotic spreads) 1:50,000 IF 1:2000 |
| Antibody | Anti-SCP3 antibody (mouse monoclonal) | Abcam | Cat# ab97672; RRID:AB_10678841 | IF (meiotic spreads) 1:1000 |
| Antibody | Anti-SYCP3 (rabbit polyclonal) | Lenzi et al., 2005 | Custom | IF (meiotic spreads) 1:10,000 |
| Antibody | Anti-SCP1 (rabbit polyclonal) | Abcam | ab15090 | IF (meiotic spreads) 1:1000 |
| Antibody | Anti-Rad51 (rabbit polyclonal) | Millipore | PC130 | IF (meiotic spreads) 1:1000 |
| Antibody | Anti-ATR (rabbit polyclonal) | Cell signaling | 2790 | IF (meiotic spreads) 1:1000 |
| Antibody | Anti-TOPBP1 (rabbit polyclonal) | Danielsen et al., 2009 | Custom | IF (meiotic spreads) 1:500 Western blot 1:1000 |
| Antibody | Anti-phospho-Chk1 (ser317) (rabbit monoclonal) | Cell Signaling | 12302 | IF (meiotic spreads) 1:100 Western blot 1:1000 |
| Antibody | Anti-H1T (guinea pig polyclonal) | A gift from Dr. Mary Ann Handel; Inselman et al., 2003 | Custom | IF (meiotic spreads) 1:500 |
| Antibody | Anti-HORMAD2 (rabbit polyclonal) | Wojtasz et al., 2012 | Custom | IF (meiotic spreads) 1:500 |
| Antibody | Anti-HORMAD1 (rabbit polyclonal) | Wojtasz et al., 2012 | Custom | IF (meiotic spreads) 1:500 |
| Antibody | Phospho HORMAD2 (S271) (rabbit polyclonal) | Wojtasz et al., 2009 | Custom | IF (meiotic spreads) 1:500 |
| Antibody | Anti-GAPDH (mouse monoclonal) | Thermo Fisher Scientific | AM4300 | Western blot 1:5000 |
| Antibody | Anti-β-actin (rabbit polyclonal) | Cell Signaling | 4967 | Western blot 1:5000 |
| Antibody | Anti-phospho MDC1 (T4) (rabbit polyclonal) | Abcam | Ab35967 | IF (meiotic spreads) 1:500 |
| Antibody | Anti-SETX (rabbit polyclonal) | Abcam | Ab220827 | IF (meiotic spreads) 1:100 |
| Antibody | Anti-MLH1 (mouse monoclonal) | BD Biosciences | 550838 | IF (meiotic spreads) 1:200 |
| Antibody | Anti-MLH3 (guinea pig polyclonal) | Holloway et al., 2014 | Custom | IF (meiotic spreads) 1:200 |
| Antibody | Anti-CHK1 (mouse monoclonal) | Santa Cruz | sc-8408 | Western blot 1:1000 |
| Antibody | Anti-CHK2 (mouse monoclonal) | Millipore | 05-649 (clone7) | Western blot 1:1000 |
| Antibody | Anti-phospho CHK1 (S345) (rabbit polyclonal) | Cell Signaling | 2341 | IF (meiotic spreads) 1:200 Western blot 1:1000 |
| Antibody | Anti-phospho RPA (S4/S8) (rabbit polyclonal) | Bethyl | A300-245A | Western blot 1:1000 |
| Antibody | RPA (made against full length RPA2 expressed and purified in E. coli, and injected to rabbit) (rabbit polyclonal) | N/A | Custom | Western blot 1:1000 |
| Antibody | Anti-KAP1 (rabbit monoclonal) | Bethyl | a700-014-T | Western blot 1:1000 |
| Antibody | Anti-phospho KAP1 (S824) (rabbit polyclonal) | Bethyl | A300-767A-T | Western blot 1:1000 |
| Antibody | Anti-53BP1 (rabbit polyclonal) | Cell Signaling | 4937 | Western blot 1:1000 |
| Antibody | Anti-53BP1 (rabbit polyclonal) | Novus Biologicals | NB100-304 | IF (meiotic spreads) 1:200 |
| Antibody | Anti-BLM (rabbit polyclonal) | Abcam | ab2179 | Western blot 1:500 |
| Antibody | Anti-Rad9 (rabbit polyclonal) | Bethyl | A300-890A-T | Western blot 1:1000 |
| Antibody | Anti-BRCA1 (rabbit polyclonal) | Kakarougkas et al., 2013 | Custom | IF (meiotic spreads) 1:200 |
| Antibody | Anti-BRCA1 (rabbit polyclonal) | Proteintech | 22362-1-AP | Western blot 1:1000 |
| Antibody | Anti-MDC1 (rabbit polyclonal) | Modzelewski et al., 2015 | Custom | IF (meiotic spreads) 1:200 IF 1:200 |
| Antibody | Anti-RNA pol 2 (mouse monoclonal) | Millipore | 05-623 | IF (meiotic spreads) 1:2000 |
| Antibody | Anti-phospho RNA pol 2 (Ser2) (rat monoclonal) | Millipore | 04-1571 | IF (meiotic spreads) 1:400 |
| Antibody | Anti-phospho RNA pol 2 (Ser5) (rat monoclonal) | Millipore | 04-1572 | IF (meiotic spreads) 1:400 |
| Antibody | Anti-H3K9ac (rabbit polyclonal) | Abclonal | A7255 | IF (meiotic spreads) 1:200 |
| Antibody | Anti-H3K9me3 (rabbit polyclonal) | Active Motif | 39766 | IF (meiotic spreads) 1:200 |
| Antibody | Anti-H3K4me1 (rabbit polyclonal) | Abclonal | A2355 | IF (meiotic spreads) 1:200 |
| Antibody | Anti-CHD4 (rabbit polyclonal) | Abclonal | A10557 | IF (meiotic spreads) 1:200 |
| Antibody | Anti-Sumo_2/3 (rabbit polyclonal) | Proteintech | 11251-1-AP | IF (meiotic spreads) 1:200 |
| Antibody | Anti-USP7 (mouse monoclonal) | Proteintech | 66514-1-Ig | IF (meiotic spreads) 1:200 |
| Antibody | Anti-H3K27ac (rabbit polyclonal) | Active Motif | 39134 | IF (meiotic spreads) 1:200 |
| Antibody | Anti-H3K36ac (rabbit polyclonal) | Active Motif | 61102 | IF (meiotic spreads) 1:200 |
| Antibody | Anti-H3K4me3 (rabbit polyclonal) | Active Motif | 39160 | IF (meiotic spreads) 1:200 |
| Antibody | Anti-H4K16ac (rabbit polyclonal) | Abclonal | A5280 | IF (meiotic spreads) 1:200 |
| Antibody | Anti-H4c (rabbit polyclonal) | Millipore | 06-598 | IF (meiotic spreads) 1:200 |
| Antibody | Anti-H2AK199ub (rabbit monoclonal) | Abcam | Ab193203 | IF (meiotic spreads) 1:200 |
| Antibody | Goat anti-rabbit IgG (H+L) highly cross-adsorbed secondary antibody, Alexa Fluor 488 (goat polyclonal) | Thermo Fisher Scientific | A-11034 | IF (meiotic spreads) 1:1000 |
| Antibody | Goat anti-mouse IgG (H+L) antibody, Alexa Fluor 488 conjugated (goat polyclonal) | Thermo Fisher Scientific | A-11017 | IF (meiotic spreads) 1:1000 |
| Antibody | Goat anti-rabbit IgG (H+L) antibody, Alexa Fluor 594 conjugated (goat polyclonal) | Thermo Fisher Scientific | A-11012 | IF (meiotic spreads) 1:1000 |
| Antibody | Goat anti-mouse IgG (H+L) highly cross-adsorbed secondary antibody, Alexa Fluor Plus 594 (goat polyclonal) | Thermo Fisher Scientific | A32742 | IF (meiotic spreads) 1:1000 |
| Antibody | Goat anti-guinea pig IgG (H+L) highly cross-adsorbed secondary antibody, Alexa Fluor 647 (goat polyclonal) | Thermo Fisher Scientific | A-21450 | IF (meiotic spreads) 1:1000 |
| Commercial assay or kit | ApopTag Plus Peroxidase In Situ Apoptosis Kit | Millipore | S7101 | |
| Software, algorithm | GraphPad Prism 9 | GraphPad Prism | RRID:SCR_002798 | |
| Software, algorithm | Cellranger v7.0.0 | 10X Genomics | https://support.10xgenomics.com/single-cell-gene-expression/software/downloads/3.1 | |
| Software, algorithm | R v4.2.1 | R Foundation | RRID:SCR_001905 | |
| Software, algorithm | Seurat v4.3.0 | Hao et al., 2021 | RRID:SCR_007322 | |
| Software, algorithm | sva v3.44.0 | Leek et al., 2023 | RRID:SCR_012836 | |
| Software, algorithm | SingleR v1.10.0 | Aran et al., 2019 | RRID:SCR_023120 | |
| Software, algorithm | Reshape2 v1.4.4 | Wickham, 2007 | RRID:SCR_022679 | |
| Software, algorithm | biomaRt v2.52.0 | Durinck et al., 2009 | RRID:SCR_019214 | |
| Software, algorithm | ggpubr v0.5.0 | Kassambara, 2019 | RRID:SCR_021139 | |
| Software, algorithm | Tidyverse v1.3.2 | Wickham et al., 2019 | RRID:SCR_019186 | |
| Software, algorithm | ggnewscale v0.4.8 | Campitelli | https://eliocamp.github.io/ggnewscale/index.html | |
| Software, algorithm | Harmony v0.1.1 | Korsunsky et al., 2019 | RRID:SCR_022206 | |
| Software, algorithm | Org.Mm.eg.db v3.15.0 | Carlson et al., 2019 | RRID:SCR_023488 | |
| Software, algorithm | Corrplot v0.92 | Wei and Simko, 2017 | RRID:SCR_023081 | |
| Software, algorithm | SeuratWrappers v0.3.1 | Satija Lab | RRID:SCR_022555 | |
| Software, algorithm | gghalves v0.1.4 | Tiedemann, 2022 | https://github.com/erocoar/gghalves |
Author response table 1
| Mouse | Topbpl | Topbpl |
|---|---|---|
| 1 | 26 | 43 |
| 2 | 46 | 72 |
| 3 | 43 | 84 |
| 4 | 79 | 64 |
| 5 | 37 | 29 |
| 6 | 48 | 52 |
| 7 | 74 | 67 |
| 8 | 52 | 8 |
Additional files
Download links
A two-part list of links to download the article, or parts of the article, in various formats.
Downloads (link to download the article as PDF)
Open citations (links to open the citations from this article in various online reference manager services)
Cite this article (links to download the citations from this article in formats compatible with various reference manager tools)
A TOPBP1 allele causing male infertility uncouples XY silencing dynamics from sex body formation
eLife 12:RP90887.
https://doi.org/10.7554/eLife.90887.3


