Tmem263 deletion disrupts the GH/IGF-1 axis and causes dwarfism and impairs skeletal acquisition
- Department of Physiology, Johns Hopkins University School of Medicine, United States
- Department of Orthopaedic Surgery, Johns Hopkins University School of Medicine, United States
- Department of Orthopaedics, University of Maryland School of Medicine, United States
- Cell and Molecular Medicine graduate program, Johns Hopkins University School of Medicine, United States
- Research and Development Service, Baltimore Veterans Administration Medical Center, United States
Figures
Figure 1

TMEM263 is a novel and highly conserved plasma membrane protein.
(A) Sequence alignment of full-length human (NP_689474), mouse (NP_001013046), chicken (NP_001006244), Xenopus frog (NP_989399), and zebrafish (NP_998306) transmembrane protein 263 (TMEM263) using Clustal-omega (Sievers and Higgins, 2018). Identical amino acids are shaded black and similar amino acids are shaded gray. Gaps are indicated by dash lines. The two predicted transmembrane domains are indicated in red. (B) TMEM263 expression across normal human tissues based on the consensus Human Protein Atlas (HPA) and Gene-Tissue Expression (GTEx) datasets. The data can be accessed via the HPA database (https://www.proteinatlas.org). nTPM denotes normalized protein-coding transcripts per million and it corresponds to the mean values of the different individual samples from each tissue. Bars are color-coded based on tissue groups with functional features in common. (C) Tmem263 expression across mouse tissues (n=11). Relative expression across tissues were first normalized to β-actin, then normalize to the tissue (pancreas) with the lowest expression. (D) Immunoblot analysis of cell lysate from HEK293 cells transfected with a control pCDNA3 empty plasmid or plasmid encoding human TMEM263 tagged with a C-terminal Myc-DDK epitope. Immunoblots were probed with an anti-FLAG (DDK) antibody (left panel) or an anti-TMEM263 antibody (right panel). (E) TMEM263 is localized to the plasma membrane. Surface biotinylation was carried out on transfected HEK293 cells. Biotinylated plasma membrane proteins were captured with Avidin-agarose beads, eluted, and immunoblotted for TMEM263 with an anti-FLAG antibody.
-
Figure 1—source data 1
Top left – Original uncropped membrane from imager showing blue channel only as a black and white image.
Two close molecular markers are noted. FLAG-tagged TMEM263 at the predicted molecular weight is marked. The cropped region used for the main figure image is marked with a dotted box. This membrane was probed with the anti-FLAG antibody. Bottom left – The same membrane as shown above, but overexposed and imaged with the light channel to show the entire membrane outline. The anti-FLAG antibody is very clean and therefore the membrane boarder is hard to see otherwise. Top right – Original uncropped membrane from imager showing blue channel only as a black and white image. Two close molecular markers are noted. FLAG-tagged TMEM263 at the predicted molecular weight is marked. The cropped region used for the main figure image is marked with a dotted box. This membrane was probed with the anti-FLAG antibody. Bottom left – The same membrane as shown above, but overexposed and imaged with the light channel to show the entire membrane outline. The anti-TMEM263 antibody is fairly clean and therefore the membrane boarder is hard to see otherwise.
- https://cdn.elifesciences.org/articles/90949/elife-90949-fig1-data1-v1.zip
-
Figure 1—source data 2
Left – Original uncropped membrane from imager showing blue channel only as a black and white image.
Two close molecular markers are noted. FLAG-tagged TMEM263 at the predicted molecular weight is marked. The cropped region used for the main figure image is marked with a dotted box. This membrane was probed with the anti-FLAG antibody. Right – The same membrane as on the left, but overexposed and imaged with the light channel to show the entire membrane outline. The anti-FLAG antibody is very clean and therefore the membrane boarder is hard to see otherwise.
- https://cdn.elifesciences.org/articles/90949/elife-90949-fig1-data2-v1.zip
Figure 2 with 1 supplement

Deletion of Tmem263 gene causes dwarfism.
(A) Generation of Tmem263 knockout (KO) mice. The exon 3 that encodes ~81% of the full-length protein was deleted using CRISPR/Cas9 method and confirmed with DNA sequencing. The location and sequence of the two guide RNAs (gRNA) used to generate the deletion were underlined. Filled-in black boxes indicate part of the exon that codes for Tmem263 protein, and white boxes indicate part of the exon that codes for 5’ and 3’ UTR of the transcript. (B) Wild-type (WT) and KO alleles were confirmed by PCR genotyping. (C) The complete loss of Tmem263 transcript in KO mice was confirmed by qPCR in male and female mouse liver and hypothalamus (WT, n=6–8; KO, n=6–8). (D) The expected Mendelian versus observed genotype distributions in postnatal day 1 (P1) pups (n=82). (E) Representative images of WT and Tmem263-KO pups at P1. Milk spots are indicated by a red arrow. (F) Representative Alcian blue and Alizarin red staining of axial skeletal and cartilage in WT and KO P1 pups. (G) Body weights of WT and Tmem263-KO pups at P1 (WT = 17; Het = 42; KO = 23), P7 (WT = 15; het = 28; KO = 5), P14 (WT = 16; het = 34; KO = 4), and P21 (WT = 33; het = 41; KO = 13). For panel G, we combined the data of male and female pups from P1 to P21. (H) Representative images of adult WT and Tmem263-KO mice at 9 weeks of age. (I–J) Body weights and body length of WT (+/+), heterozygous (+/-), and KO (-/-) male and female mice at 9 weeks of age. Sample size for males (WT = 45; het = 73; KO = 9) and females (WT = 30; het = 59; KO = 8). (K) The growth curve trajectory based on the combined data in G and I. All data are presented as mean ± SEM. ****p<0.0001 (one-way ANOVA with Tukey’s multiple comparisons test).
Figure 2—figure supplement 1
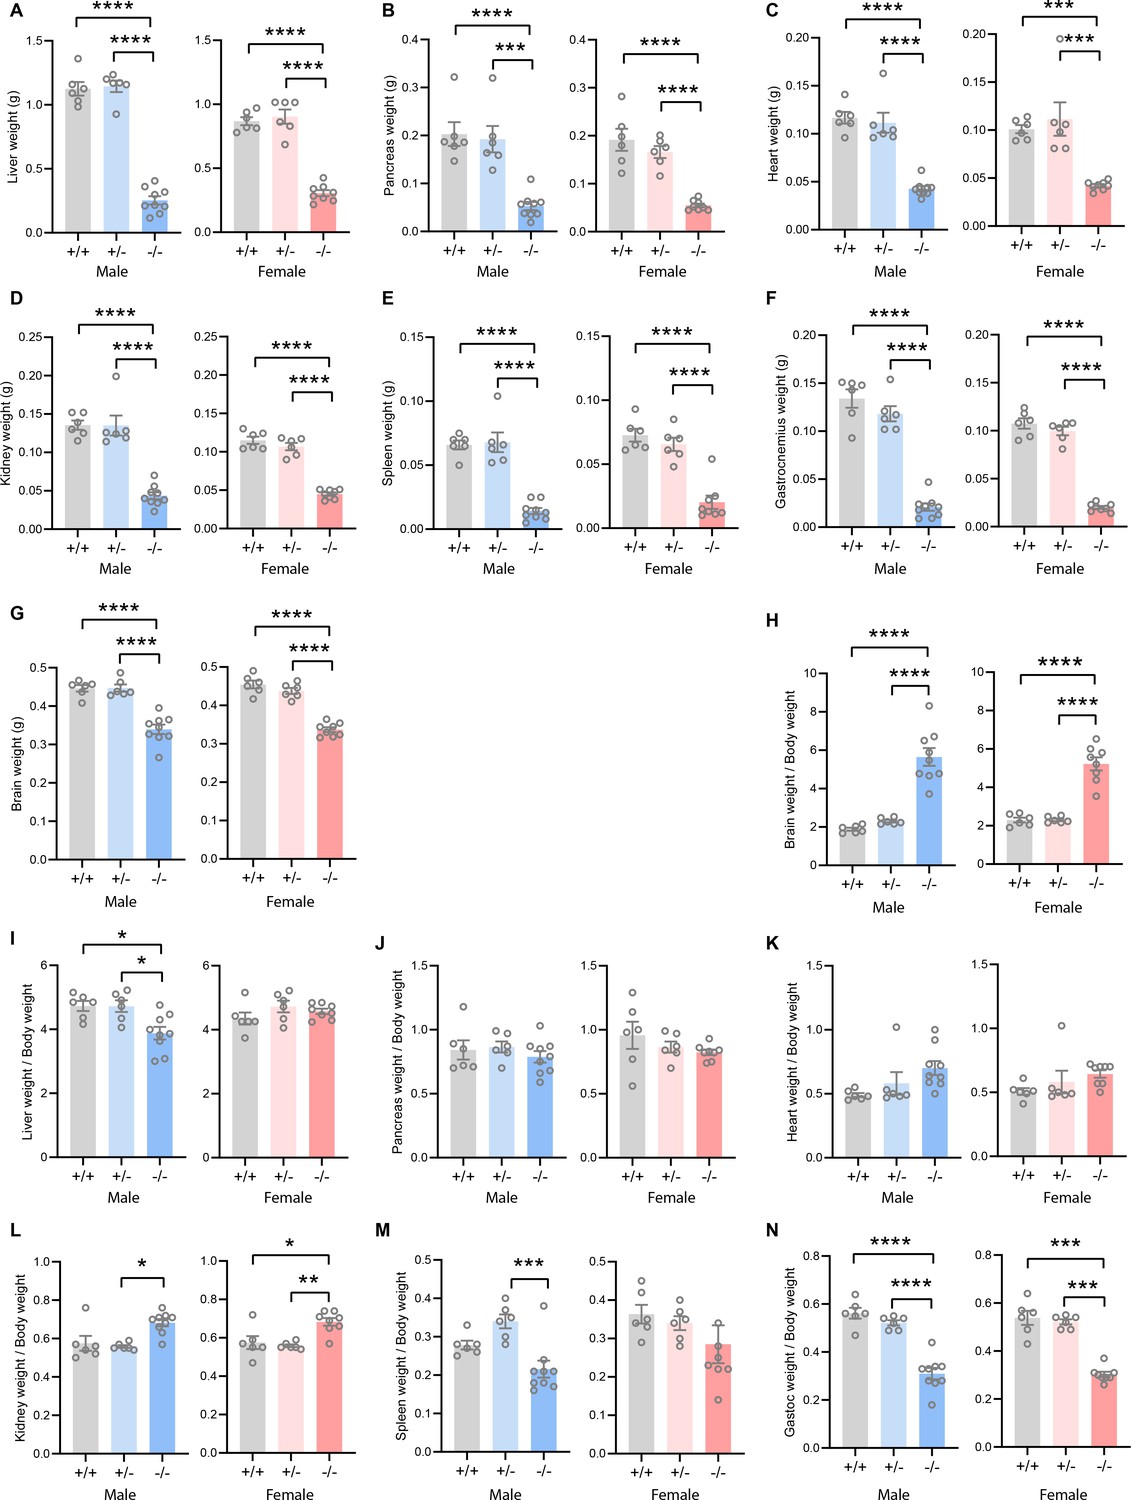
Absolute and relative tissue and organ weights of Tmem263 wild-type (WT) (+/+), heterozygous (+/-), and knockout (KO) (-/-) male and female mice.
The absolute weight of liver (A), pancreas (B), heart (C), kidney (D), spleen (E), skeletal muscle (gastrocnemius) (F), and brain (G) in WT, heterozygous, and KO mice. The relative weight, after normalization to body weight, of brain (H), liver (I), pancreas (J), heart (K), kidney (L), spleen (M), and gastrocnemius (N) in WT (+/+), heterozygous (+/-), and KO (-/-) mice. Sample size for males (WT = 6; het = 6; KO = 9) and females (WT = 6; het = 6; KO = 8) at 9 weeks of age. All data are mean ± SE. **p<0.01; ***p<0.001; ****p<0.0001 (one-way ANOVA with Tukey’s multiple comparisons test).
Figure 3
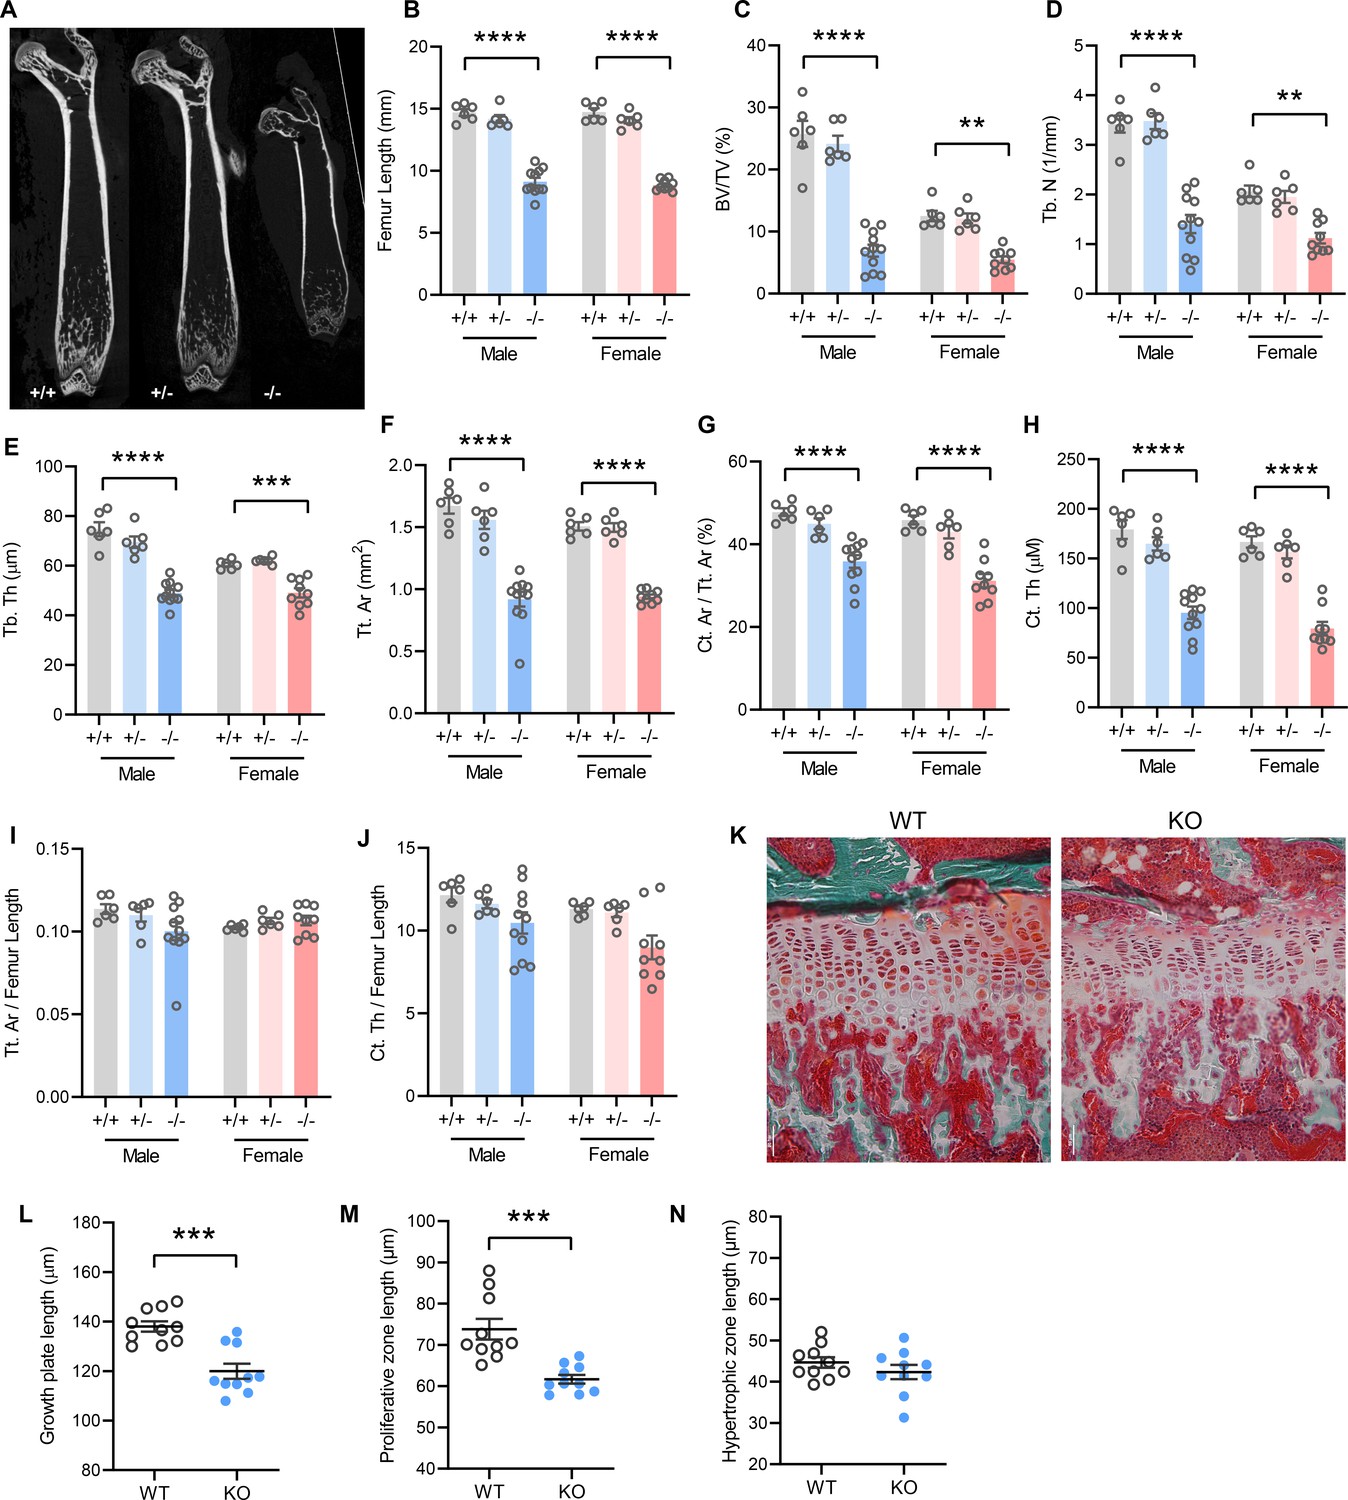
Mice lacking TMEM263 exhibit pronounced skeletal dysplasia.
(A) Representative microCT images of bone (femur) showing a dramatic reduction in size in Tmem263 knockout (KO) (-/-) mice relative to wild-type (WT) (+/+) and heterozygous (+/-) controls at 8 weeks of age. (B) Femur length of WT (+/+), heterozygous (+/-), and KO (-/-) male and female mice at 8 weeks of age. (C) Quantification of trabecular bone volume per tissue volume (BV/TV) in the distal femur of WT (+/+), heterozygous (+/-), and KO (-/-) male and female mice. (D) Quantification of trabecular number (Tb. N) in the distal femur. (E) Trabecular bone thickness (Tb. Th). (F) Cortical tissue area (Tt. Ar). (G) Cortical area per tissue area. (H) Cortical thickness. (I) Tissue area per femur length. (J) Cortical thickness per femur length in male and female mice. (K) Representative images of tibial growth plate histology in WT and Tmem263-KO male mice. (L–N) Quantification of growth plate length (L), proliferative zone length (M), and hypertrophic zone length (N) in WT (n=10) and KO (n=10) male mice. All data were collected on 8-week-old mice. Sample size for panels B–J: males (WT = 6; het = 6; KO = 11) and females (WT = 6; het = 6; KO = 9). All data are mean ± SE. **p<0.01; ***p<0.001; ****p<0.0001 (one-way ANOVA with Tukey’s multiple comparisons test).
Figure 4
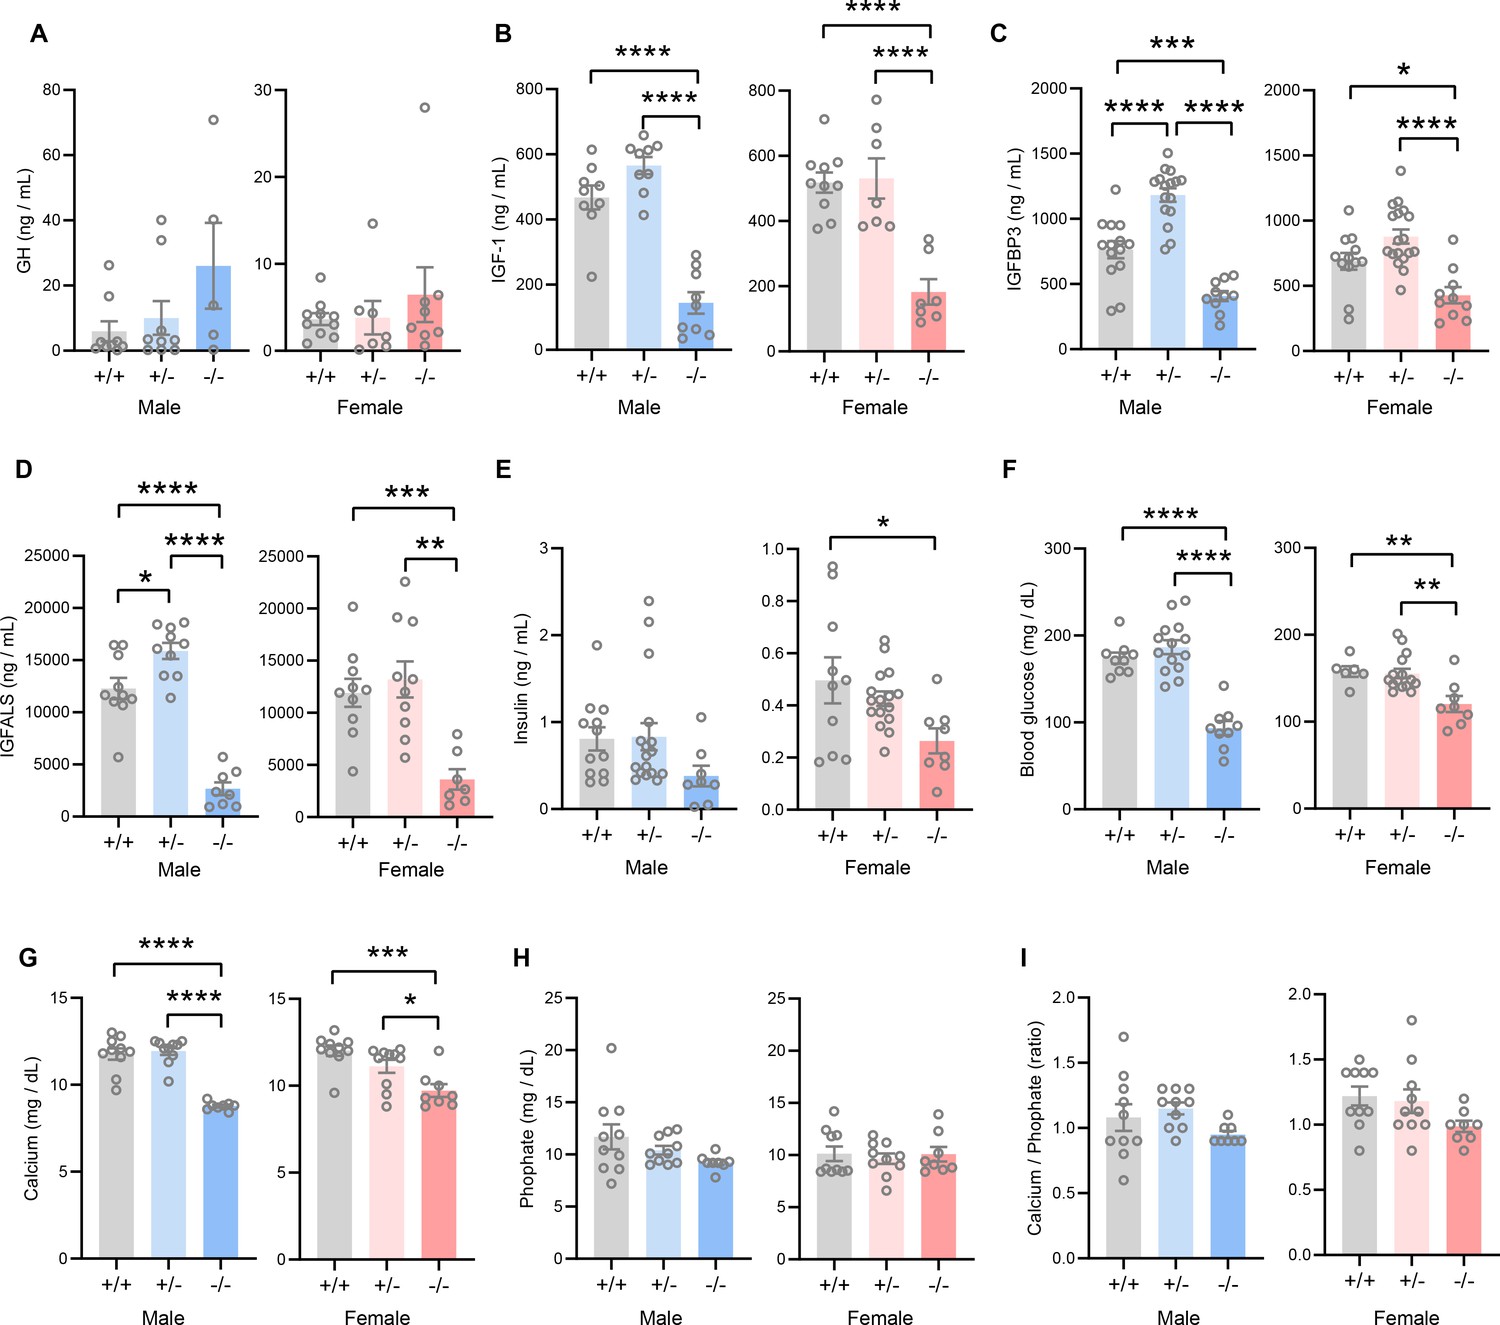
TMEM263 deficiency results in marked reduction in circulating insulin-like growth factor 1 (IGF-1), IGF binding protein 3 (IGFBP3), and IGF acid labile subunit (IGFALS) levels.
Serum levels of growth hormone (GH; A), IGF-1 (B), IGFBP3 (C), IGFALS (D), insulin (E), glucose (F), calcium (G), and phosphate (H) in wild-type (WT) (+/+), heterozygous (+/-), and Tmem263-KO (-/-) male and female mice at 8 weeks of age. Sample size for panel A (GH): males (WT = 9; het = 9; KO = 5) and females (WT = 10; het = 7; KO = 8). Panel B (IGF-1): males (WT = 9; het = 9; KO = 9) and females (WT = 10; het = 7; KO = 7). Panel C (IGFBP3): males (WT = 15; het = 16; KO = 11) and females (WT = 12; het = 18; KO = 10). Panel D (IGFALS): males (WT = 10; het = 10; KO = 8) and females (WT = 10; het = 10; KO = 8). Panel E (insulin): males (WT = 12; het = 17; KO = 8) and females (WT = 10; het = 16; KO = 8). Panel F (glucose): males (WT = 9; het = 14; KO = 9) and females (WT = 6; het = 15; KO = 8). Panel G and H (calcium and phosphate): males (WT = 10; het = 10; KO = 8) and females (WT = 10; het = 10; KO = 8). (I) Ratio of calcium-to-phosphate in WT, heterozygous, and KO male and female mice. Sample size for males (WT = 10; het = 10; KO = 8) and females (WT = 10; het = 10; KO = 8). All data are presented as mean ± SEM. *p<0.05; **p<0.01; ***p<0.001; ****p<0.0001 (one-way ANOVA with Tukey’s multiple comparisons test).
Figure 5
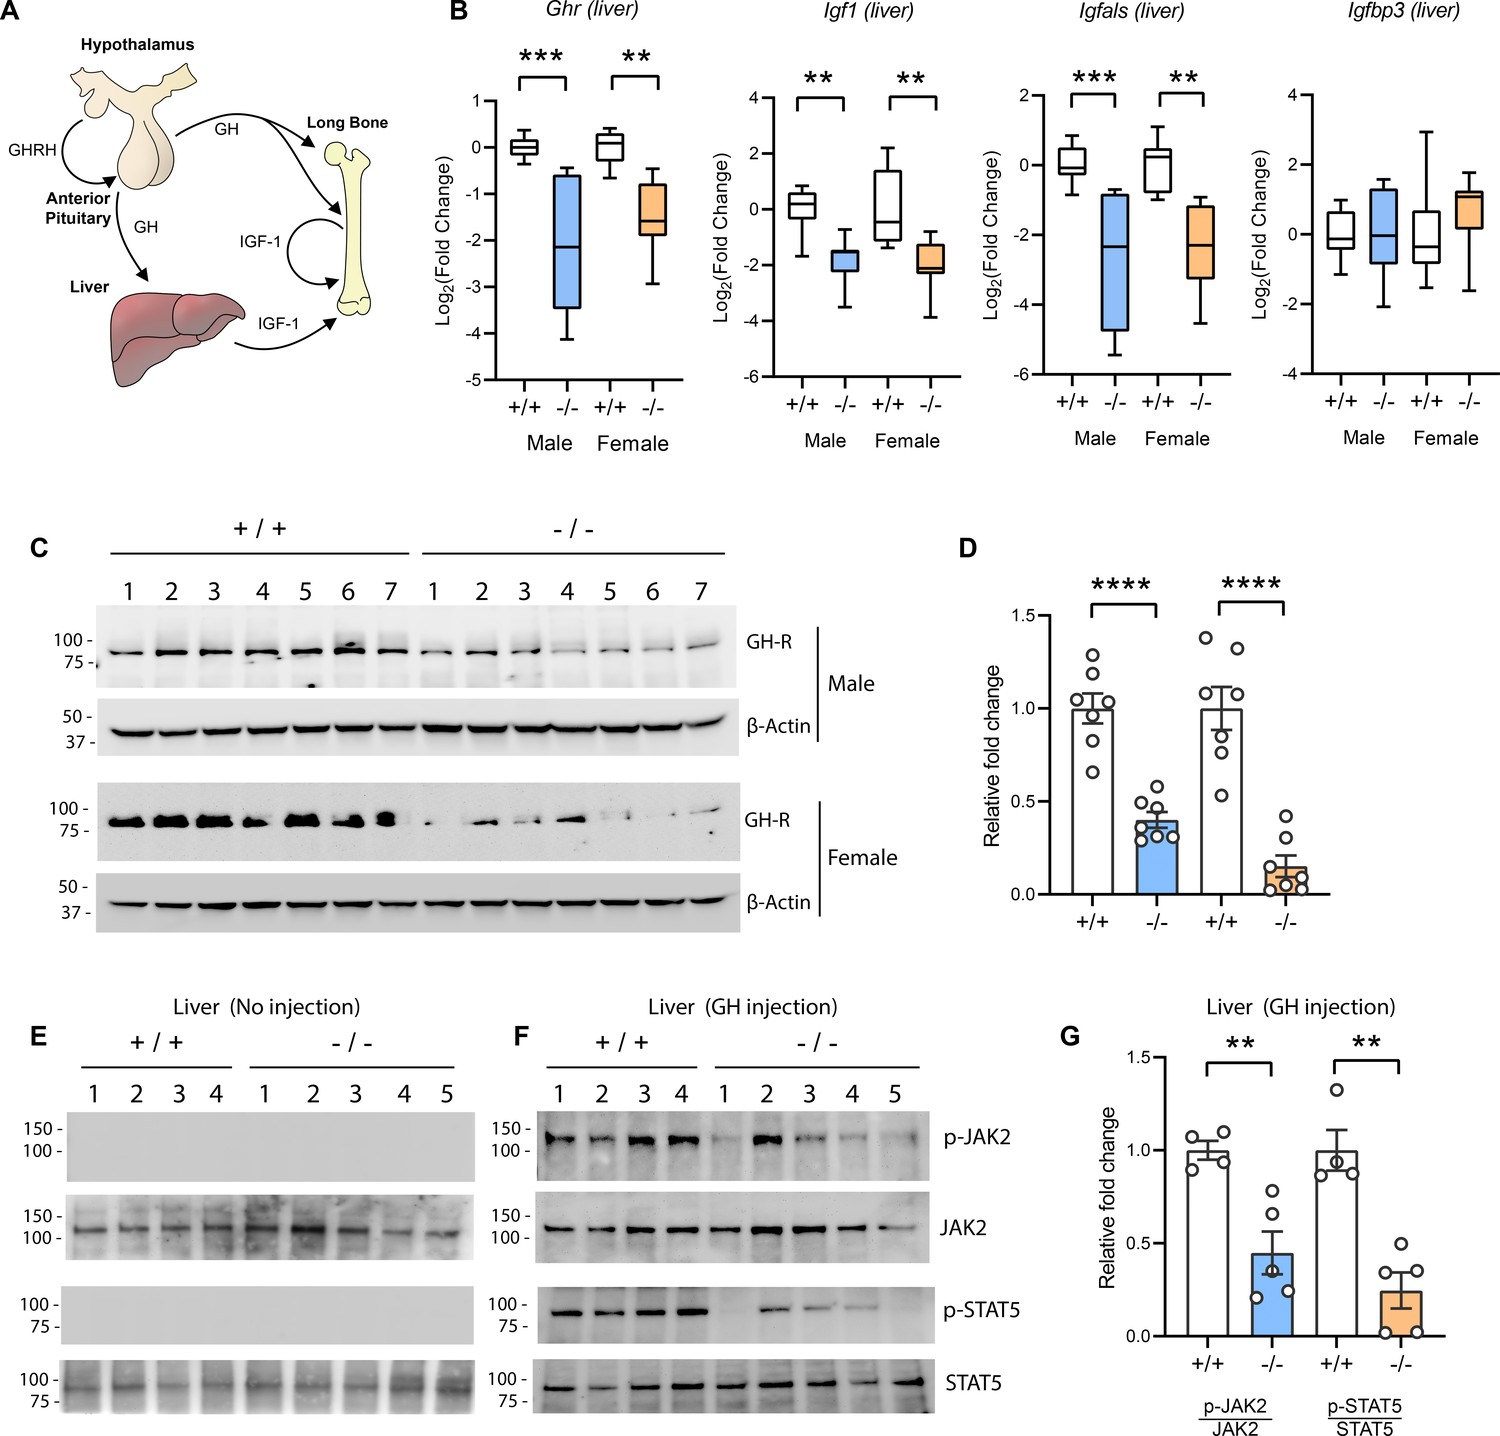
Reduced hepatic growth hormone receptor (GHR) protein level and signaling in TMEM263 knockout (KO) mice.
(A) The growth hormone (GH)/insulin-like growth factor 1 (IGF-1) axis required for postnatal skeletal growth. At the onset of growth spurt, growth hormone releasing hormone (GHRH) from the hypothalamus causes the release of GH from the anterior pituitary. Circulating GH binds to its receptor (GHR) in liver and other peripheral tissues to induce the synthesis and secretion of IGF-1, which then acts in an endocrine, paracrine, and/or autocrine manner to induce skeletal growth. (B) Expression levels of Ghr (growth hormone receptor), Igf1, Igfals (IGF binding protein acid labile subunit), and Igfbp3 (IGF binding protein 3) transcripts in the liver of wild-type (WT) and KO mice. Sample size of male mice (WT, n=8; KO, n=8) and female mice (WT, n=8; KO, n=8). (C) Immunoblot analysis of GHR protein levels in the liver of WT (n=7) and KO (n=7) mice. Molecular weight markers are indicated on the left. (D) Quantification of the immunoblot results as shown in C (n=7 per genotype). (E–F) Reduced hepatic GH-induced signaling in KO (-/-; n=5) mice relative to WT (+/+; n=4) controls. Immunoblot analysis of phospho-JAK2 (Tyr1008), total JAK2, phospho-STAT5 (Y694), and total STAT5 in liver lysates from control male mice not injected with GH (E) and male mice injected with recombinant GH (F). Molecular weight markers are indicated on the left of the gel. (G) Quantification of the immunoblot results as shown in F (WT, n=4; KO, n=5). All data are presented as mean ± SEM. **p<0.01; ***p<0.001; ****p<0.0001 (one-way ANOVA with Tukey’s multiple comparisons test for data in B and two-tailed Student’s t-test for data in D and F).
-
Figure 5—source data 1
Top left – Original uncropped membrane from imager showing blue channel only as a black and white image.
Two close molecular markers are noted. Growth hormone receptor (GHR) at the predicted molecular weight is marked. The cropped region used for the main figure image is marked with a dotted box. This membrane was probed with the anti-GHR antibody. Top middle – Original uncropped membrane from imager showing blue channel only as black and white. Two molecular markers are noted. β-Actin at the predicted molecular weight is marked. The cropped region used for the main figure is marked with a dotted box. The membrane was probed with the anti-β-actin antibody. Top right – The same membrane as the top middle, but overexposed and imaged with the light channel to show the entire membrane outline. The anti-β-actin antibody is very clean and therefore the membrane boarder is hard to see otherwise. Bottom left – Original uncropped membrane from imager showing blue channel only as a black and white image. Two close molecular markers are noted. GHR at the predicted molecular weight is marked. The cropped region used for the main figure image is marked with a dotted box. This membrane was probed with the anti-GHR antibody. Bottom middle – Original uncropped membrane from imager showing blue channel only as black and white. Two molecular markers are noted. β-Actin at the predicted molecular weight is marked. The cropped region used for the main figure is marked with a dotted box. The membrane was probed with the anti-β-actin antibody. Bottom right – The same membrane as the top middle, but overexposed and imaged with the light channel to show the entire membrane outline. The anti-β-actin antibody is very clean and therefore the membrane boarder is hard to see otherwise.
- https://cdn.elifesciences.org/articles/90949/elife-90949-fig5-data1-v1.zip
-
Figure 5—source data 2
Top left – Original uncropped membrane from imager showing blue channel only as a black and white image.
Two close molecular markers are noted. Phospho-JAK2 at the predicted molecular weight is marked. The cropped region used for the main figure image is marked with a dotted box. This membrane was probed with the anti-phospho-JAK2 antibody. Top right – The same membrane as on the left, re-probed to visualize total-JAK2 signal. Bottom left – Original uncropped membrane from imager showing blue channel only as a black and white image. Two close molecular markers are noted. Phospho-STAT5b at the predicted molecular weight is marked. The cropped region used for the main figure image is marked with a dotted box. This membrane was probed with the anti-phospho-STAT5b antibody. Bottom right – The same membrane as on the bottom left, re-probed to visualize total-STAT5b signal.
- https://cdn.elifesciences.org/articles/90949/elife-90949-fig5-data2-v1.zip
-
Figure 5—source data 3
Top left – Original uncropped membrane from imager showing blue channel only as a black and white image.
Two close molecular markers are noted. Phospho-JAK2 at the predicted molecular weight is marked. The cropped region used for the main figure image is marked with a dotted box. This membrane was probed with the anti-phospho-JAK2 antibody. Bottom left – The same membrane as on the top left, re-probed to visualize total-JAK2 signal. Top right – Original uncropped membrane from imager showing blue channel only as a black and white image. Two close molecular markers are noted. Phospho-STAT5b at the predicted molecular weight is marked. The cropped region used for the main figure image is marked with a dotted box. This membrane was probed with the anti-phospho-STAT5 antibody. Bottom right – The same membrane as on the top right, re-probed to visualize total-STAT5b signal.
- https://cdn.elifesciences.org/articles/90949/elife-90949-fig5-data3-v1.zip
Figure 6 with 1 supplement
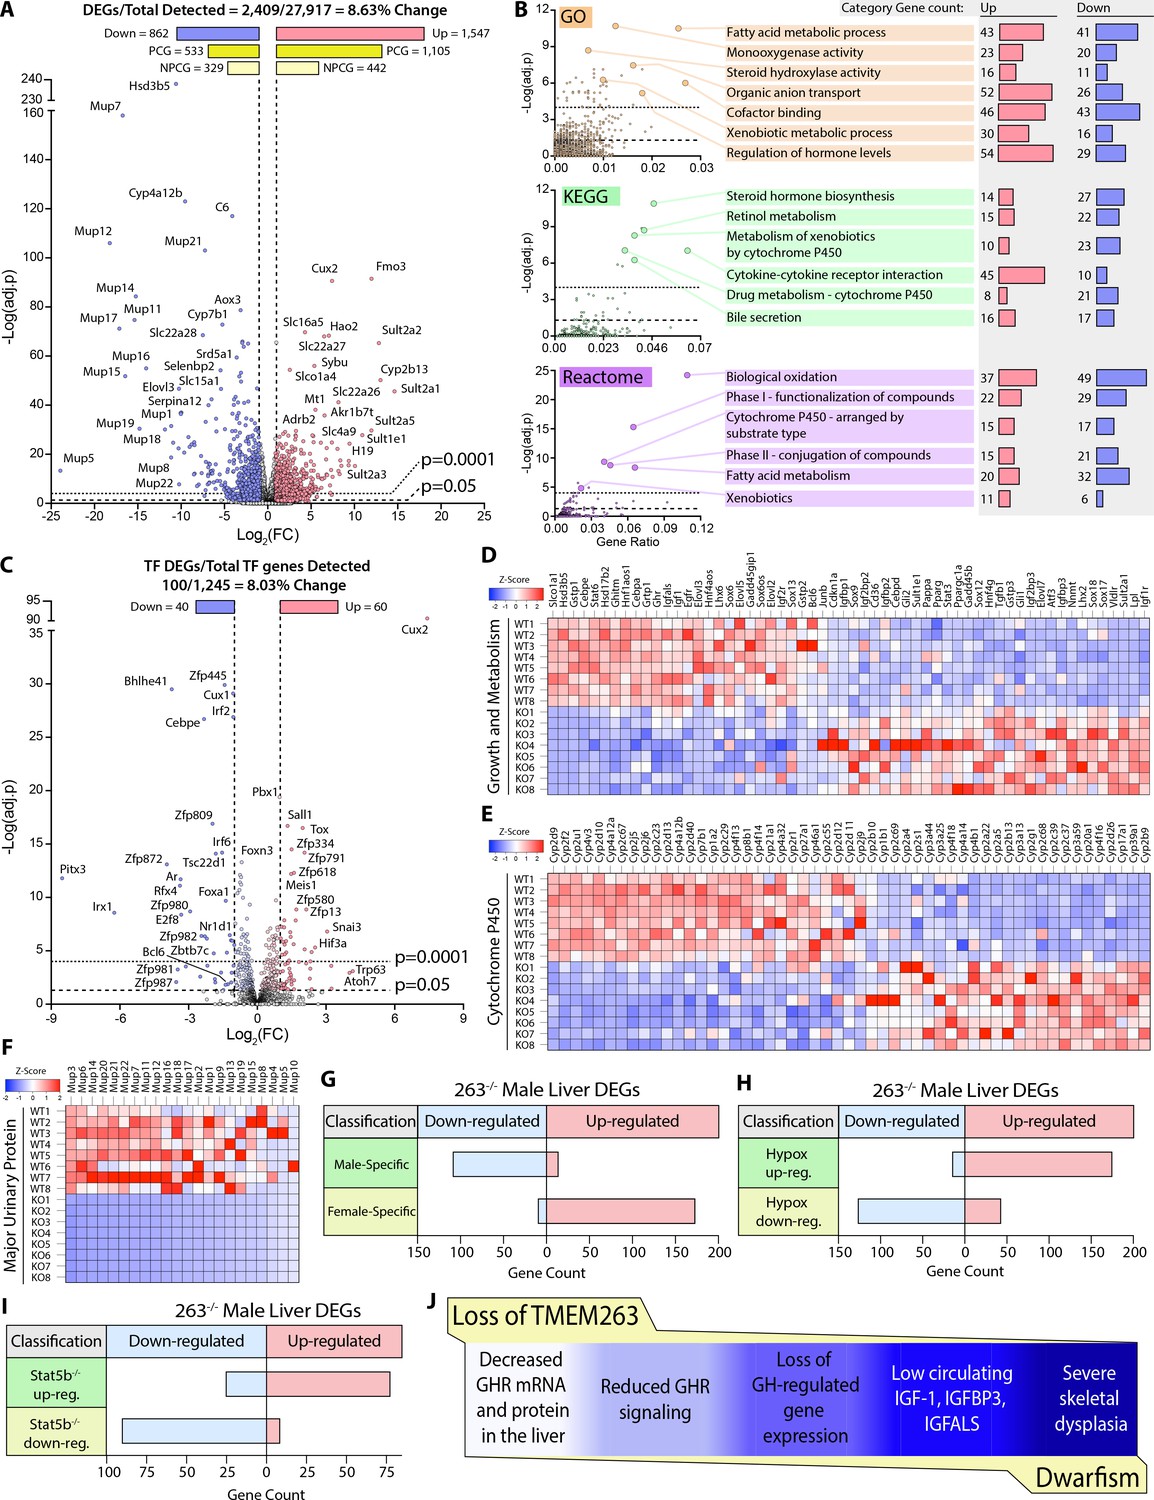
Loss of TMEM263 disrupts growth hormone (GH)-regulated gene expression in the male mouse liver.
(A) Volcano plot of male mouse liver transcriptome. (B) Enrichment analysis of differentially expressed genes (DEGs) by Gene Ontology (GO), Kyoto Encyclopedia of Genes and Genomes (KEGG), and Reactome (http://www.reactome.org) databases. Plots of -Log(adj. p) vs gene ratio to show complete spread of all enrichment results for each analysis. The most effected categories are highlighted and labeled with the category name and number of up- and down-regulated genes within each. (C) Volcano plot showing the expression of all transcription factor (TF) genes detected in the male mouse liver transcriptome. TFs that are significantly up- or down-regulated in knockout (KO) male mouse liver are highlighted. (D) Heat map of DEGs involved in growth and metabolism. (E) Heat map of all protein-coding DEGs from the cytochrome P450 (Cyp) gene family. (F) Heat map of all protein-coding DEGs from the major urinary protein (Mup) gene family. (G–I) Tmem263-KO male liver DEG overlap comparison to three separate public datasets of mouse liver gene expression: (G) wild-type (WT) male vs. WT female mice (Conforto et al., 2012), (H) hypophysectomized vs. sham control male mice (Wauthier et al., 2010), and (I) Stat5b-KO vs WT male mice (Clodfelter et al., 2006). (J) Summary of key findings underpinning the dwarfism and skeletal dysplasia phenotypes of Tmem263-null mice. All heat map data is shown on a column z-score scale. Only significantly different genes (adjusted p-value <0.05 and Log2(FC) <-1 or >1) are shown for all heat maps. PCG = protein-coding gene, NPCG = non-protein-coding gene. Sample size for male WT (n=8) and KO (n=8) mice (9-week-old) in all data shown.
Figure 6—figure supplement 1
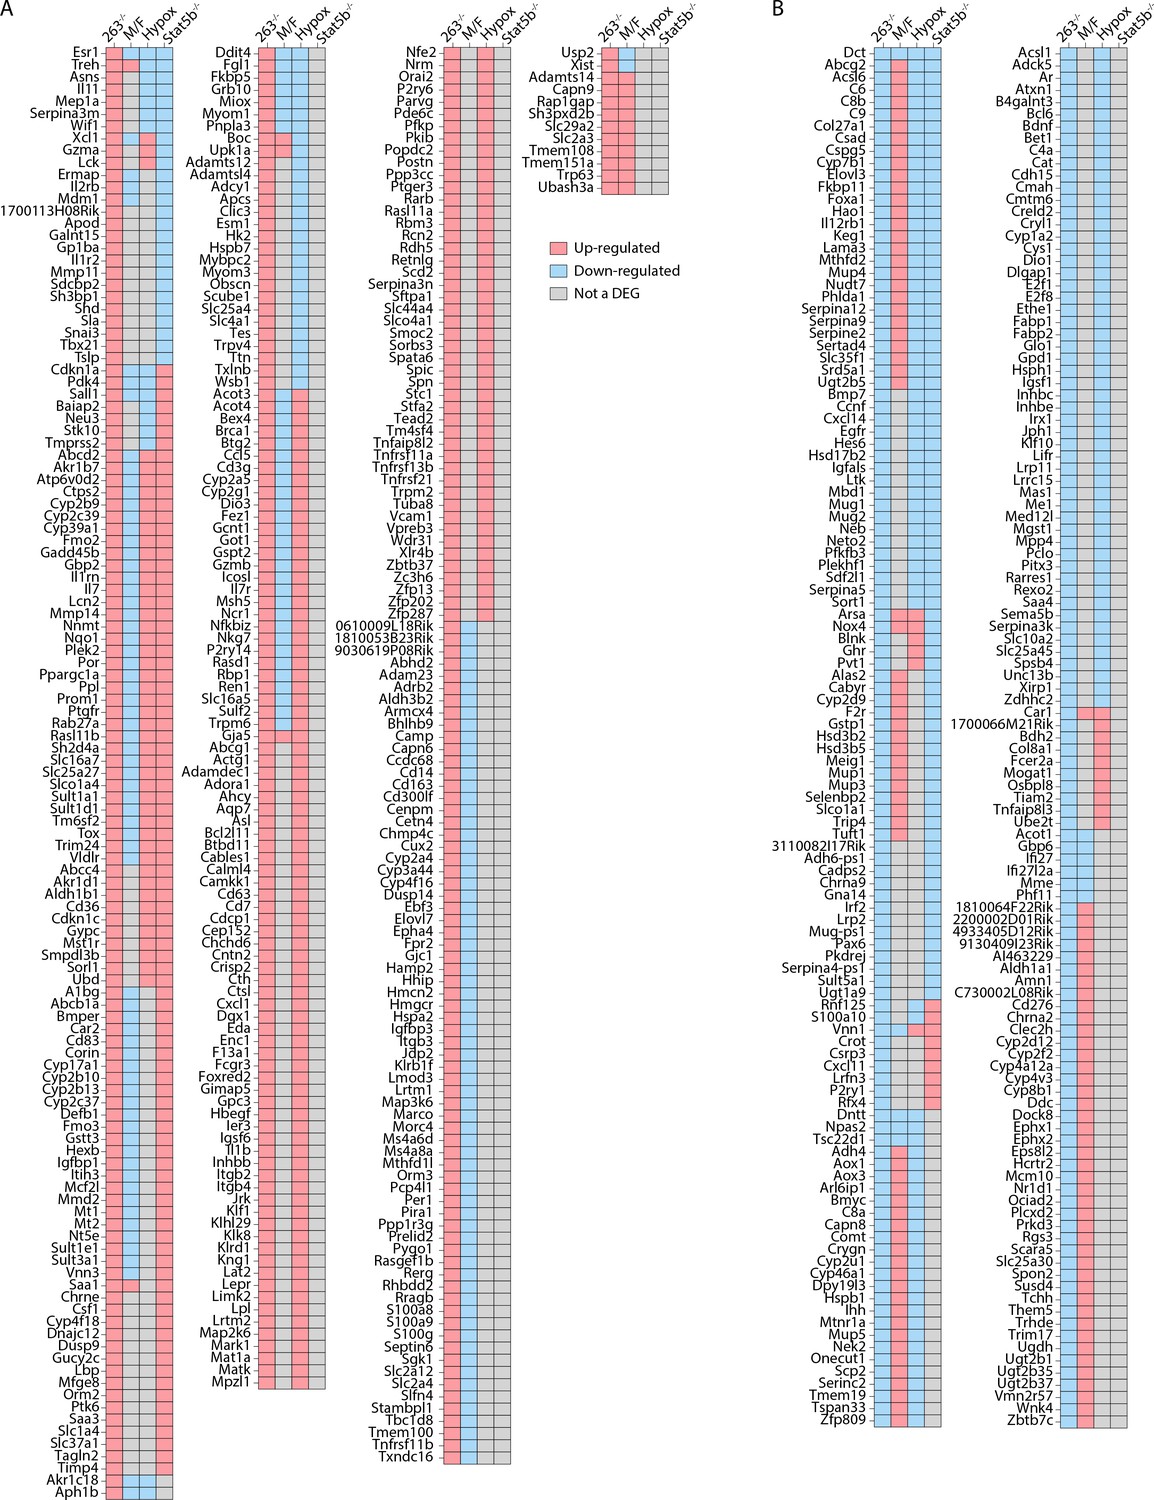
All Tmem263 knockout (KO) male mouse liver (263-/-) differentially expressed genes (DEGs) expressed by at least one other mouse model for comparison.
The DEGs from Tmem263 (-/-) male mouse liver compared to the published DEGs from (i) wild-type (WT) male vs female mice (M/F), (ii) hypophysectomized vs sham control male mice (Hypox), and (iii) Stat5b-KO vs WT male mice (Stat5b-/-). (A–B) All Tmem263-KO male liver up-regulated (A) and down-regulated (B) genes considered a DEG in at least one other experiment. A red box indicates the gene is up-regulated within the given experiment, a blue box indicates down-regulation within the experiment, and a gray box indicates that the particular gene is not a DEG in the given experiment.
Tables
Key resources table
| Reagent type (species) or resource | Designation | Source or reference | Identifiers | Additional information |
|---|---|---|---|---|
| Gene (Mus musculus) | Tmem263 | GenBank | Gene ID: 103266 | |
| Strain, strain background (Mus musculus) | Tmem263 knockout (-/-) mouse line; C57BL/6J genetic background | This paper | The mouse line was generated at the Johns Hopkins Transgenic Core facility. The mouse line is available upon request | |
| Cell line (Homo sapiens) | Human Embryonic Kidney cells (HEK 293T) | ATCC | Cat. #: CRL-3216 | Cell line has been authenticated by ATCC |
| Transfected construct (human) | Human TMEM263 expression plasmid in pCDNA3.1 vector backbone | Origene | Cat. #: (RC203933) | Contains a C-terminal Myc and FLAG epitope tag |
| Antibody | Anti-FLAG M2 (Mouse monoclonal) | Sigma | Cat. #: F1804 | WB (1:1000) |
| Antibody | Anti-JAK2 (Mouse monoclonal C-10) | Santa Cruz | Cat. #: sc-390539 | WB (1:100) |
| Antibody | Anti-STAT5 (Mouse monoclonal A-9) | Santa Cruz | Cat. #: sc-74442 | WB (1:100) |
| Antibody | Anti-GHR (Mouse monoclonal B-12) | Santa Cruz | Cat. #: sc-137184 | WB (1:100) |
| Antibody | Anti-phospho-JAK2 (Tyr1008) (Rabbit monoclonal D4A4) | Cell Signaling Technology | Cat. #: sc-137184 | WB (1:500) |
| Antibody | Anti-phospho-STAT5 (Tyr694) (Rabbit polyclonal) | Cell Signaling Technology | Cat. #: sc-137184 | WB (1:500) |
| Antibody | Anti-β-Actin (Mouse monoclonal) | Sigma | Cat. #: A1978 | WB (1:2000) |
| Antibody | Anti-TMEM263 (Rabbit polyclonal) | Origene | Cat. #: TA333490 | WB (1:1000) |
| Peptide, recombinant protein | Recombinant human growth hormone | PeproTech | Cat. #: 100-40 | Dose injected into mice (3 µg/g body weight) |
| Commercial assay or kit | Pierce Cell Surface Isolation kit | Thermo Fisher Scientific | Cat. #: 89881 | |
| Commercial assay or kit | Insulin ELISA kit | Crystal Chem | Cat. #: 90080 | |
| Commercial assay or kit | Growth hormone (GH) ELISA kit | Millipore Sigma | Cat. #: EZRMGH-45K | |
| Commercial assay or kit | IGF1 ELISA kit | Crystal Chem | Cat. #: 80574 | |
| Commercial assay or kit | IGFBP3 ELISA kit | Abcam | Cat. #: ab100692 | |
| Commercial assay or kit | IGFALS ELISA kit | Cusabio | Cat. #: CSB-EL011094MO | |
| Commercial assay or kit | iScript cDNA synthesis kit | Bio-Rad | Cat. #: 1708891 | |
| Commercial assay or kit | iTaq Universal SYBR Green Supermix | Bio-Rad | Cat. #: 1725124 | |
| Chemical compound | Trizol Reagent | Thermo Fisher Scientific | Cat. #: 15596018 |
Additional files
Download links
A two-part list of links to download the article, or parts of the article, in various formats.
Downloads (link to download the article as PDF)
Open citations (links to open the citations from this article in various online reference manager services)
Cite this article (links to download the citations from this article in formats compatible with various reference manager tools)
Tmem263 deletion disrupts the GH/IGF-1 axis and causes dwarfism and impairs skeletal acquisition
eLife 12:RP90949.
https://doi.org/10.7554/eLife.90949.3


