Development and assessment of a sustainable PhD internship program supporting diverse biomedical career outcomes
- Office of Graduate Education, University of North Carolina, United States
- Strategic Evaluation, Inc, United States
- Department of Community and Public Health, Mountain Area Health Education Center (MAHEC), United States
- The University of Texas, United States
- Cell Biology and Physiology, University of North Carolina, United States
Figures
Figure 1
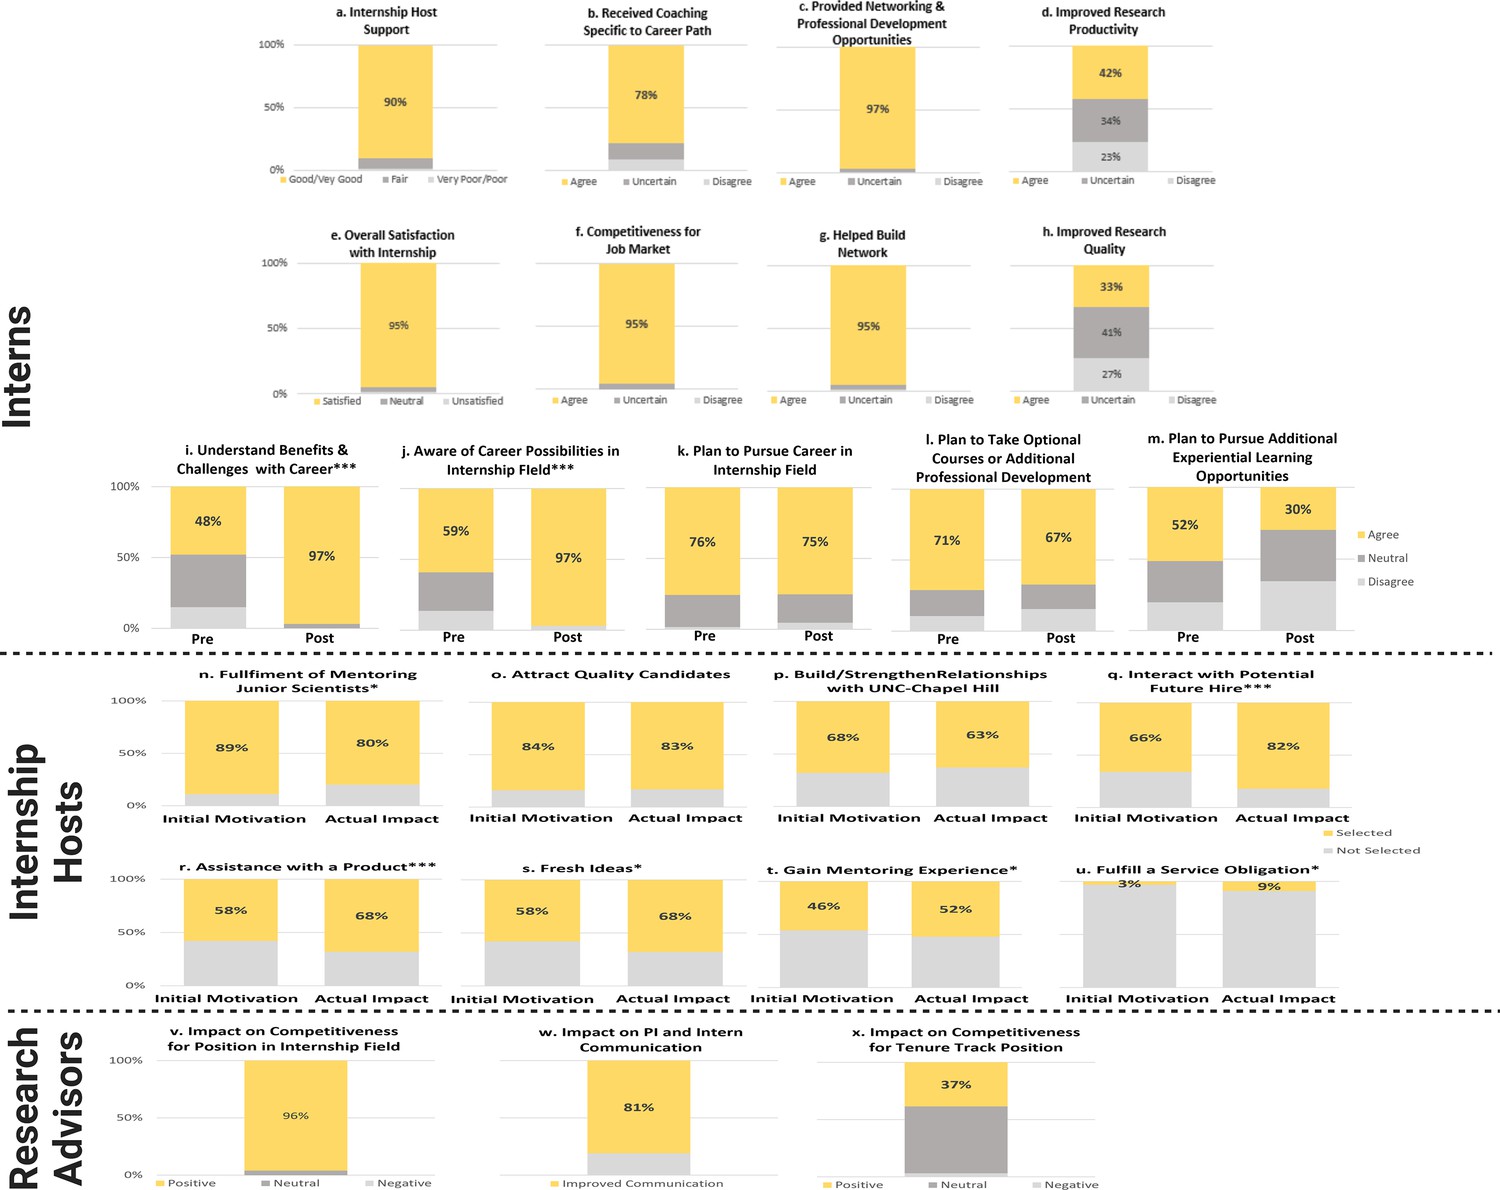
Benefits of internship for different stakeholders (quantitative evidence).
(a–h) Benefits to interns documented through post surveys. (i–m) Benefits to interns documented through pre- and post-surveys. (n–u) Benefits to internship hosts documented through post surveys. (v–x) Benefits to research advisors documented through post surveys. Mean values for the benefits to the interns documented through pre- and post- (i–m) were tested for significance using an independent samples t-test. Asterisk(s) indicate(s) differences were statistically significant (*p<0.05; **p<0.01; ***p<.001).
Figure 2
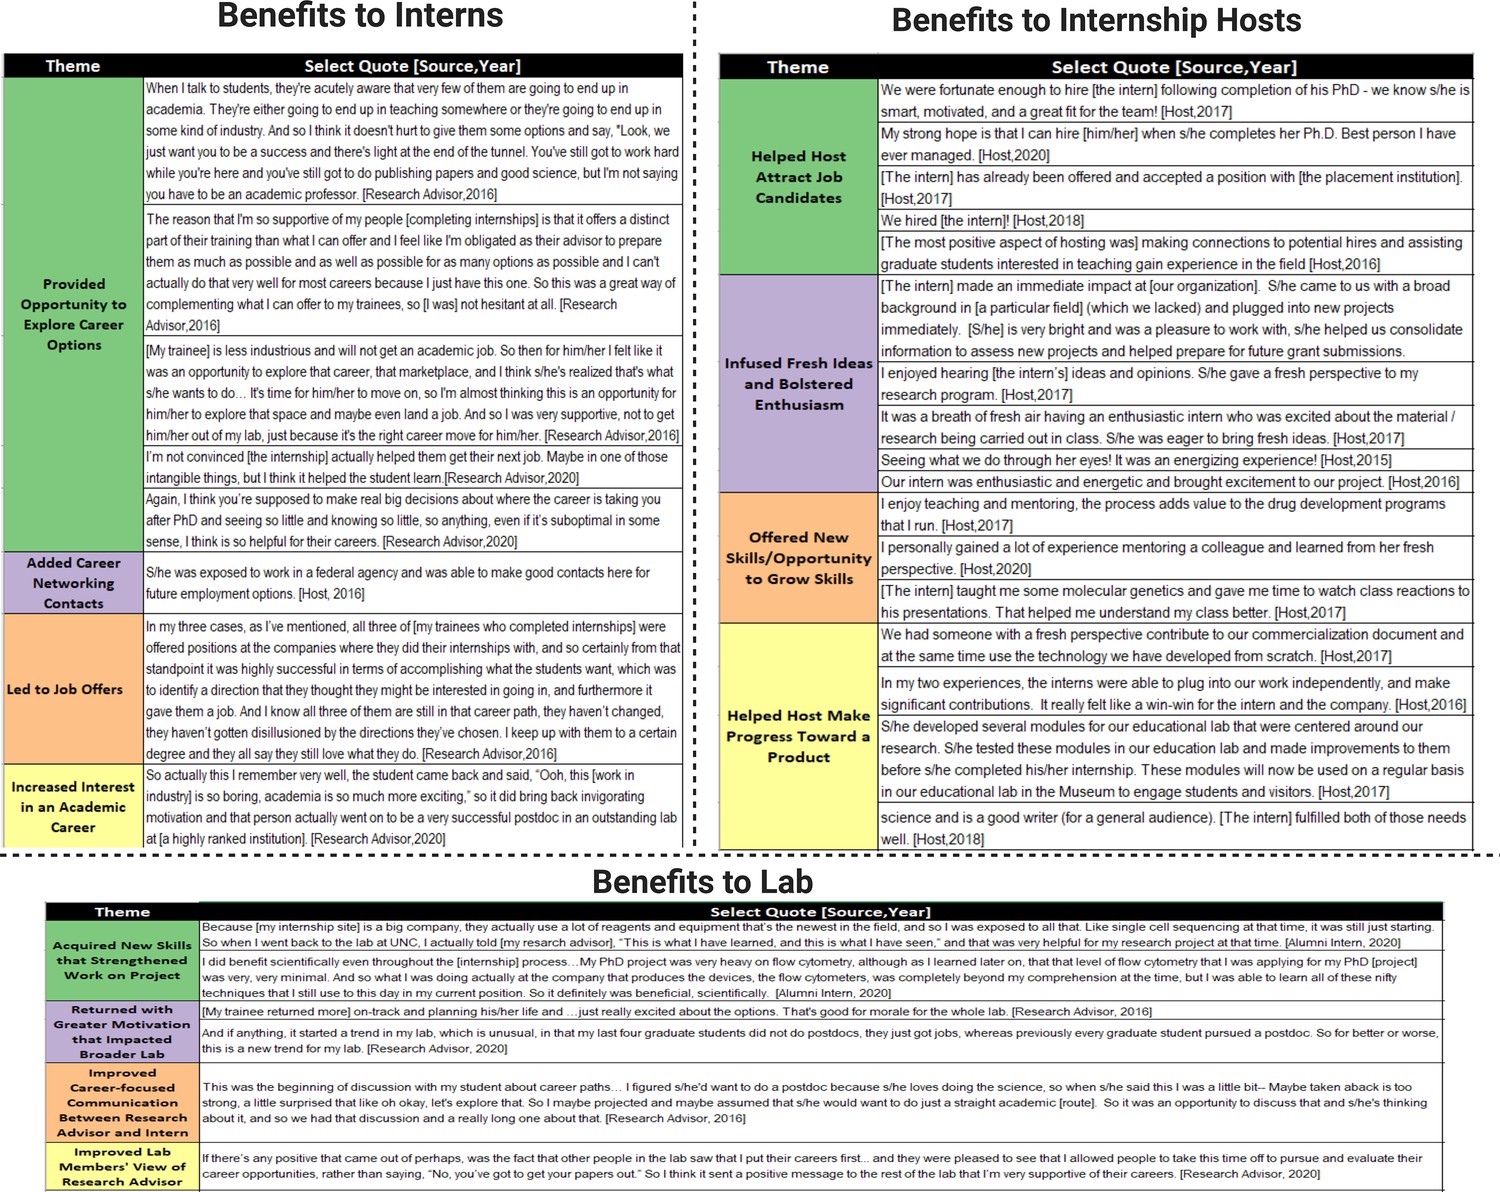
Benefits of internship for different stakeholders (qualitative evidence).
Stakeholder interviews were moderated by an external evaluation team, with participants’ identity remaining confidential. Interviews were transcribed and imported into Atlas.ti, with the evaluator developing codes for key themes. Representative quotes supporting each major theme that emerged are presented in the figure.
Figure 3
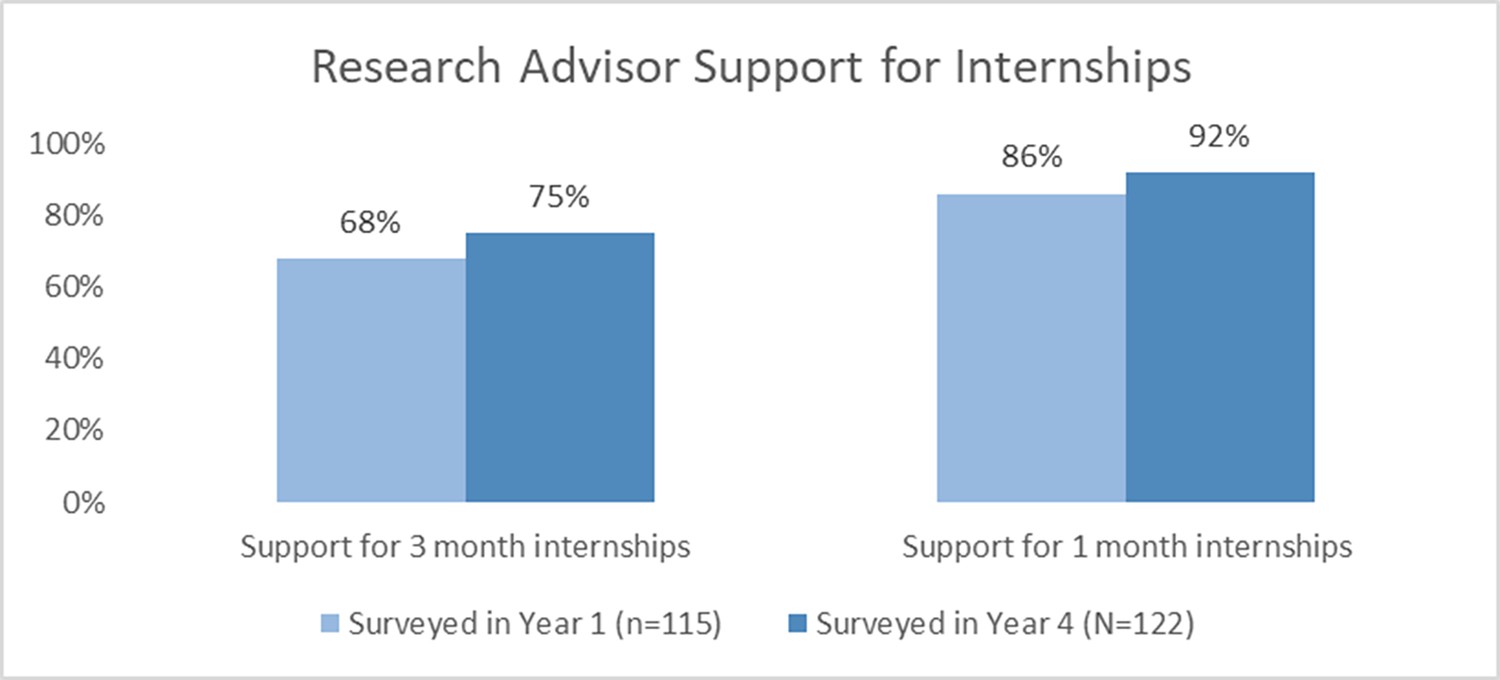
Faculty ratings for research advisor-support of 1- and 3-month internships.
Figure 4
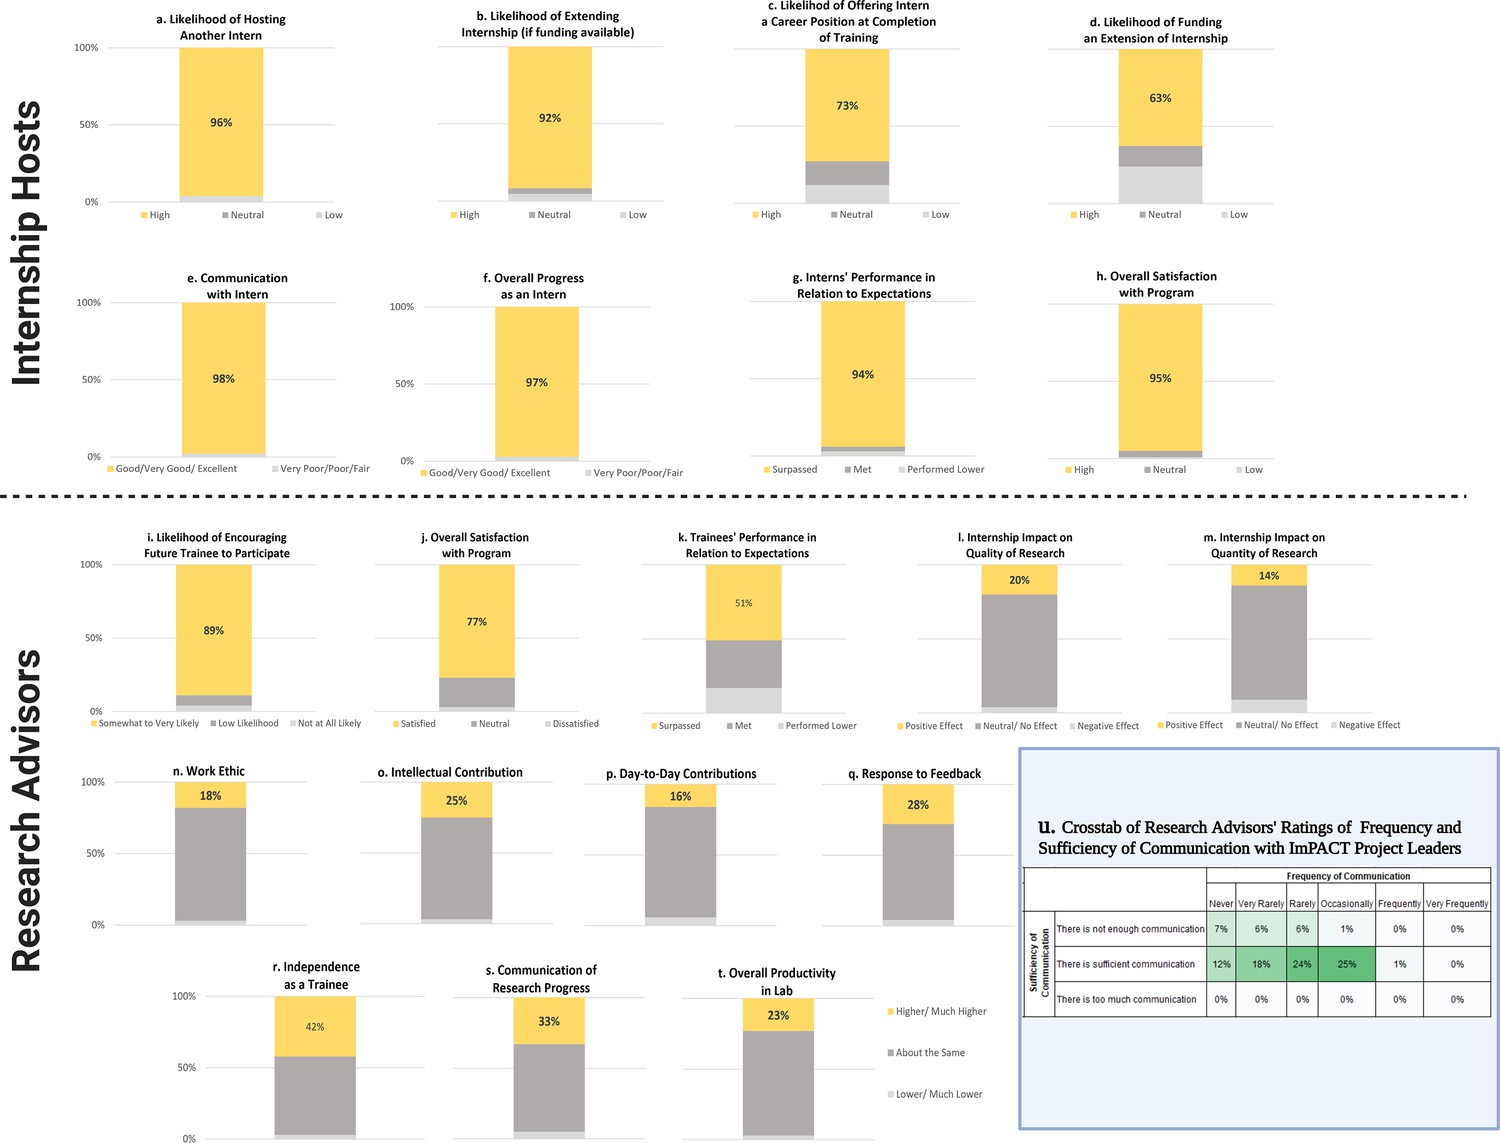
Sustainability and lessons learned (quantitative evidence).
(a–h) Internship host ratings of various internship components that are proxies for sustainability. (i–t) Research advisor ratings of various internship components that are proxies for sustainability. (u) A crosstab of research advisors’ ratings of frequency and sufficiency of communicating with project leadership.
Figure 5
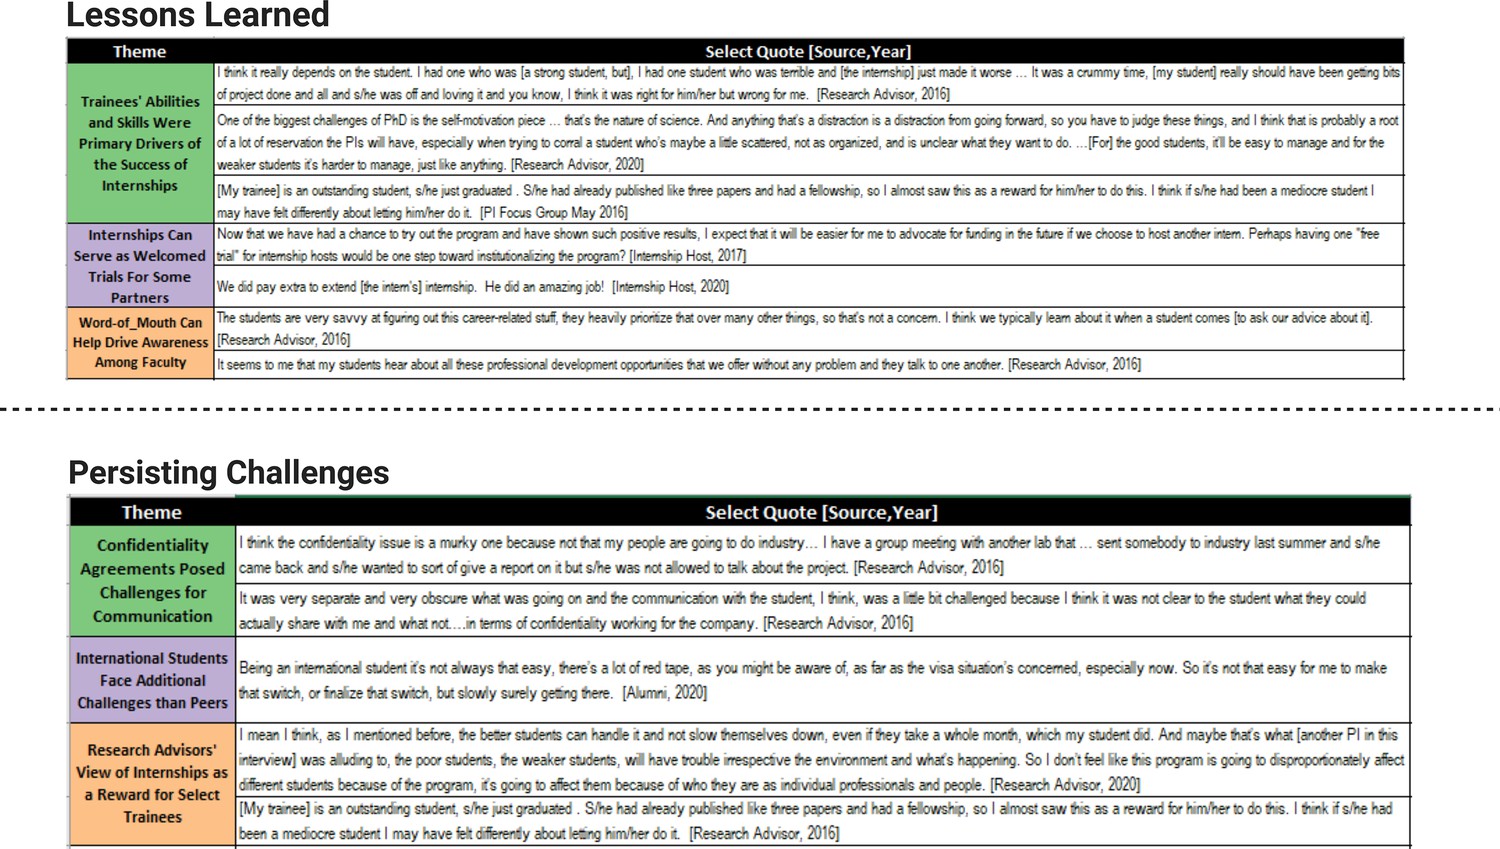
Lessons learned and persisting challenges (qualitative evidence).
Tables
Table 1
Logistic regression model of internship participation, number of career interests, and trainee type (graduate student versus postdoc) on identical interest match - (Model 1).
| Variables | p-Value | OR | 95% CI | |
|---|---|---|---|---|
| Lower | Upper | |||
| Internship participation | <0.001 | 2.99 | 1.48 | 6.06 |
| Number of career interests | <0.001 | 1.20 | 1.11 | 1.29 |
| Trainee type (postdoc) | <0.001 | 5.82 | 3.76 | 9.01 |
Table 2
Matches between career interest and first job placement.
| All interns | n | Exact match (%) |
|---|---|---|
| 130 | 51 (39%) | |
| Graduate students | 109 | 42 (39%) |
| Postdocs | 21 | 9 (43%) |
| Non-interns | 578 | 165 (29%) |
| Graduate students | 251 | 57 (23%) |
| Postdocs | 327 | 108 (33%) |
Table 3
Summary for regression model controlling for demographic variables race/ethnicity (UR/WR), gender (female/male), and citizenship (citizen/international) (Model 2).
| Variables | p-Value | OR | 95% CI | |
|---|---|---|---|---|
| Lower | Upper | |||
| Internship participation | <0.001 | 3.51 | 1.71 | 7.21 |
| Number of career interests | <0.001 | 1.20 | 1.11 | 1.29 |
| Trainee type (Pd) | <0.001 | 5.03 | 2.94 | 8.60 |
| Gender* | 0.02 | 1.58 | 1.07 | 2.33 |
| Race/ethnicity (ns) | 0.52 | 1.00 | 1.00 | 1.01 |
| Citizenship (ns) | 0.26 | 1.00 | 0.99 | 1.00 |
Table 4
Rates of postdoctoral training for interns and non-interns.
| Graduate student participant status | n | Postdoc rate (%) |
|---|---|---|
| Interns (participants) | 107 | 36 |
| Controls (non-participants) | 499 | 57 |
Table 5
Job sector and career type of first job after graduate student internships.
| Tier | Interns | Non-interns |
|---|---|---|
| Job sector | Total n=107 | Total n=499 |
| Academia | 30 (28%) | 271 (54%) |
| For-profit | 67 (63%) | 156 (31%) |
| Government | 2 (2%) | 41 (8%) |
| Non-profit | 5 (5%) | 30 (6%) |
| Unknown | 3 (3%) | 1 (<1%) |
| Career type | ||
| Primarily research | 65 (61%) | 381 (76%) |
| Primarily teaching | 6 (6%) | 19 (4%) |
| Science related | 32 (30%) | 89 (18%) |
| Not related to science | 0 (%) | 1 (<1%) |
| Other/unknown | 4 (4%) | 9 (2%) |
Table 6
Type and quantity of publications between graduate student interns and non-interns.
| Graduate studentparticipant status | n | Average first-author publications (p=0.52) | Average total publications (p=0.66) |
|---|---|---|---|
| Interns (participants) | 54 | 1.94 | 3.65 |
| Controls (non-participants) | 410 | 1.81 | 3.85 |
Additional files
Download links
A two-part list of links to download the article, or parts of the article, in various formats.
Downloads (link to download the article as PDF)
Open citations (links to open the citations from this article in various online reference manager services)
Cite this article (links to download the citations from this article in formats compatible with various reference manager tools)
Development and assessment of a sustainable PhD internship program supporting diverse biomedical career outcomes
eLife 12:RP91011.
https://doi.org/10.7554/eLife.91011.3


