Structure and evolution of alanine/serine decarboxylases and the engineering of theanine production
- Department of Life Sciences and Medicine, University of Science and Technology of China, China
- State Key Laboratory of Tea Plant Biology and Utilization, Anhui Agricultural University, China
Figures
Figure 1
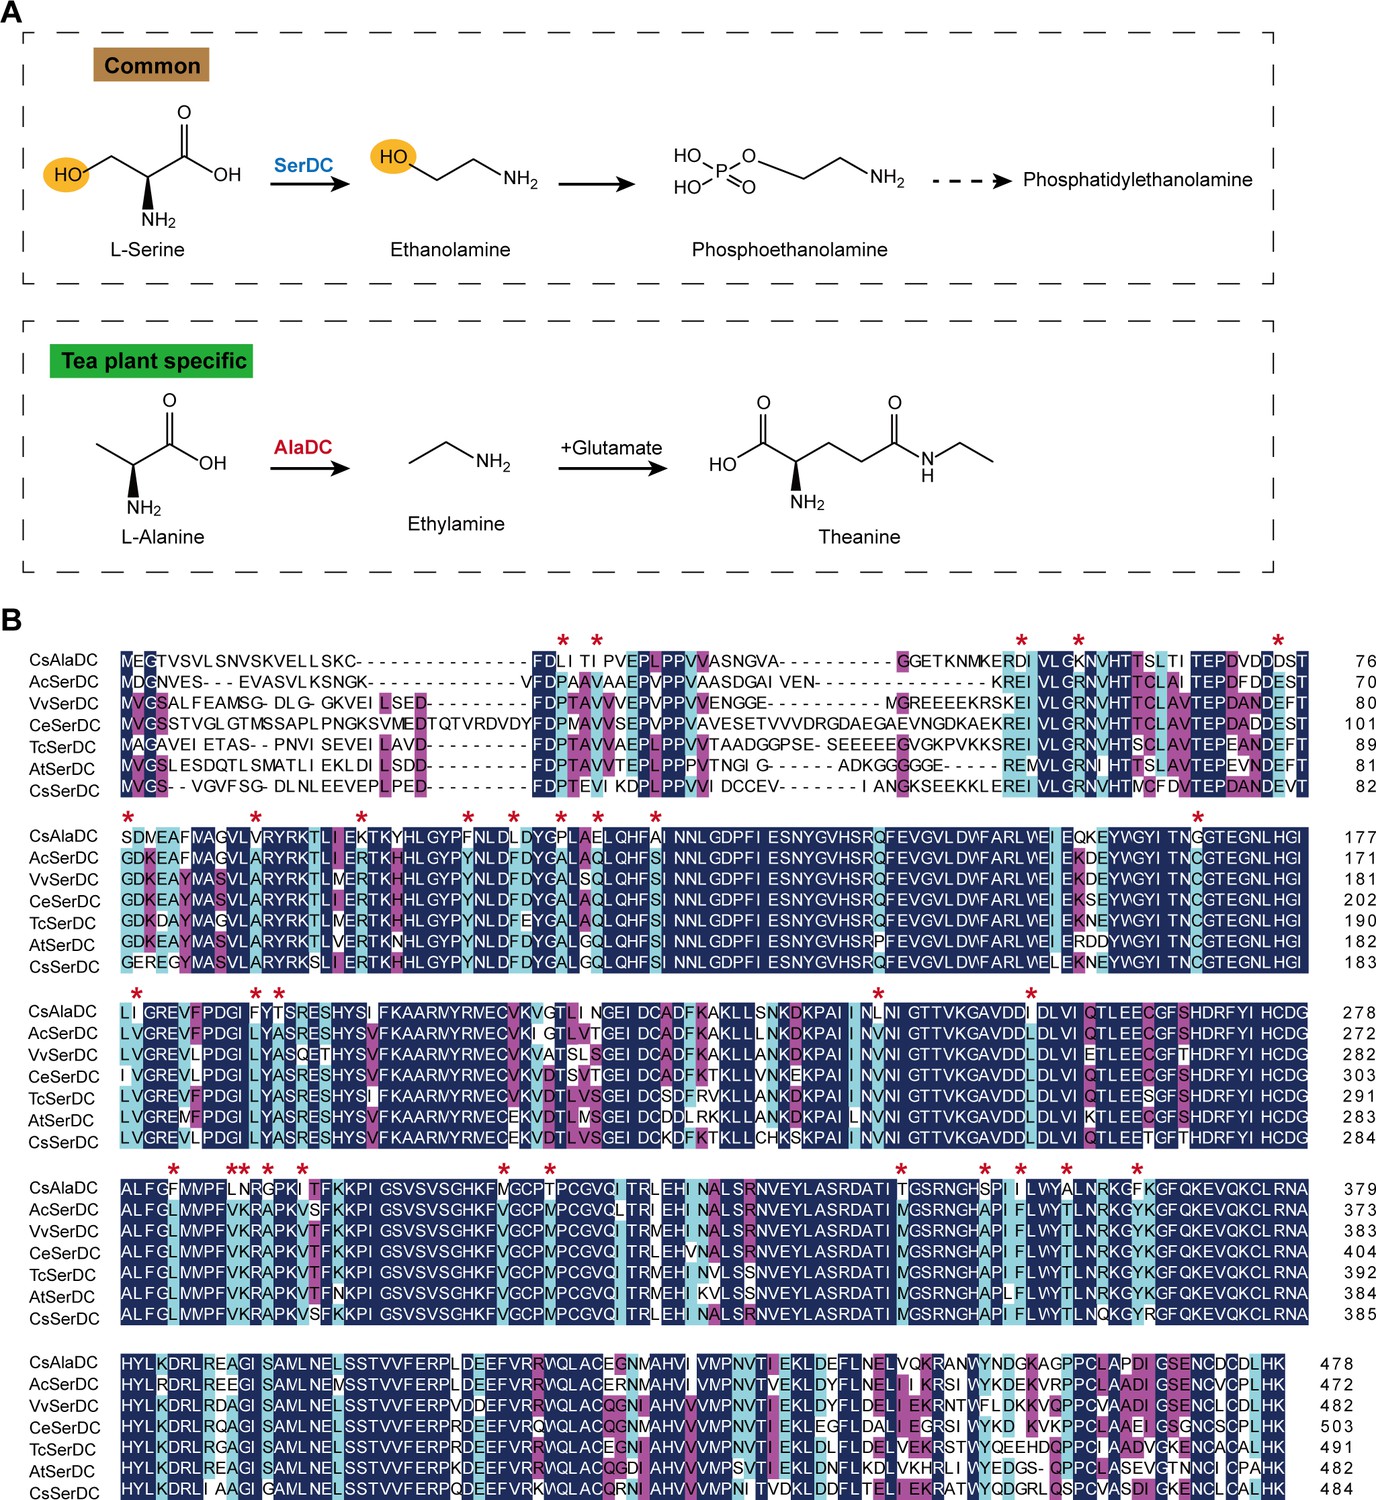
Metabolic pathways and sequence analysis of Camellia sinensis alanine decarboxylase (CsAlaDC) and SerDCs in plants.
(A) The decarboxylation of serine and alanine in plants. SerDC, serine decarboxylase; AlaDC, alanine decarboxylase. (B) Multiple alignments of the amino acid sequences of AlaDC and SerDCs. The amino acid sequences of the six SerDCs from kiwifruit (Actinidia chinensis), grape (Vitis vinifera), coffee (Coffea eugenioides), cocoa (Theobroma cacao), and Arabidopsis. Primary (100%), secondary (80%), and tertiary (60%) conserved percent of similar amino acid residues were shaded in deep blue, light blue, and cheer red, respectively. ‘*’ indicated amino acid residues mutated only in CsAlaDC.
Figure 2 with 2 supplements
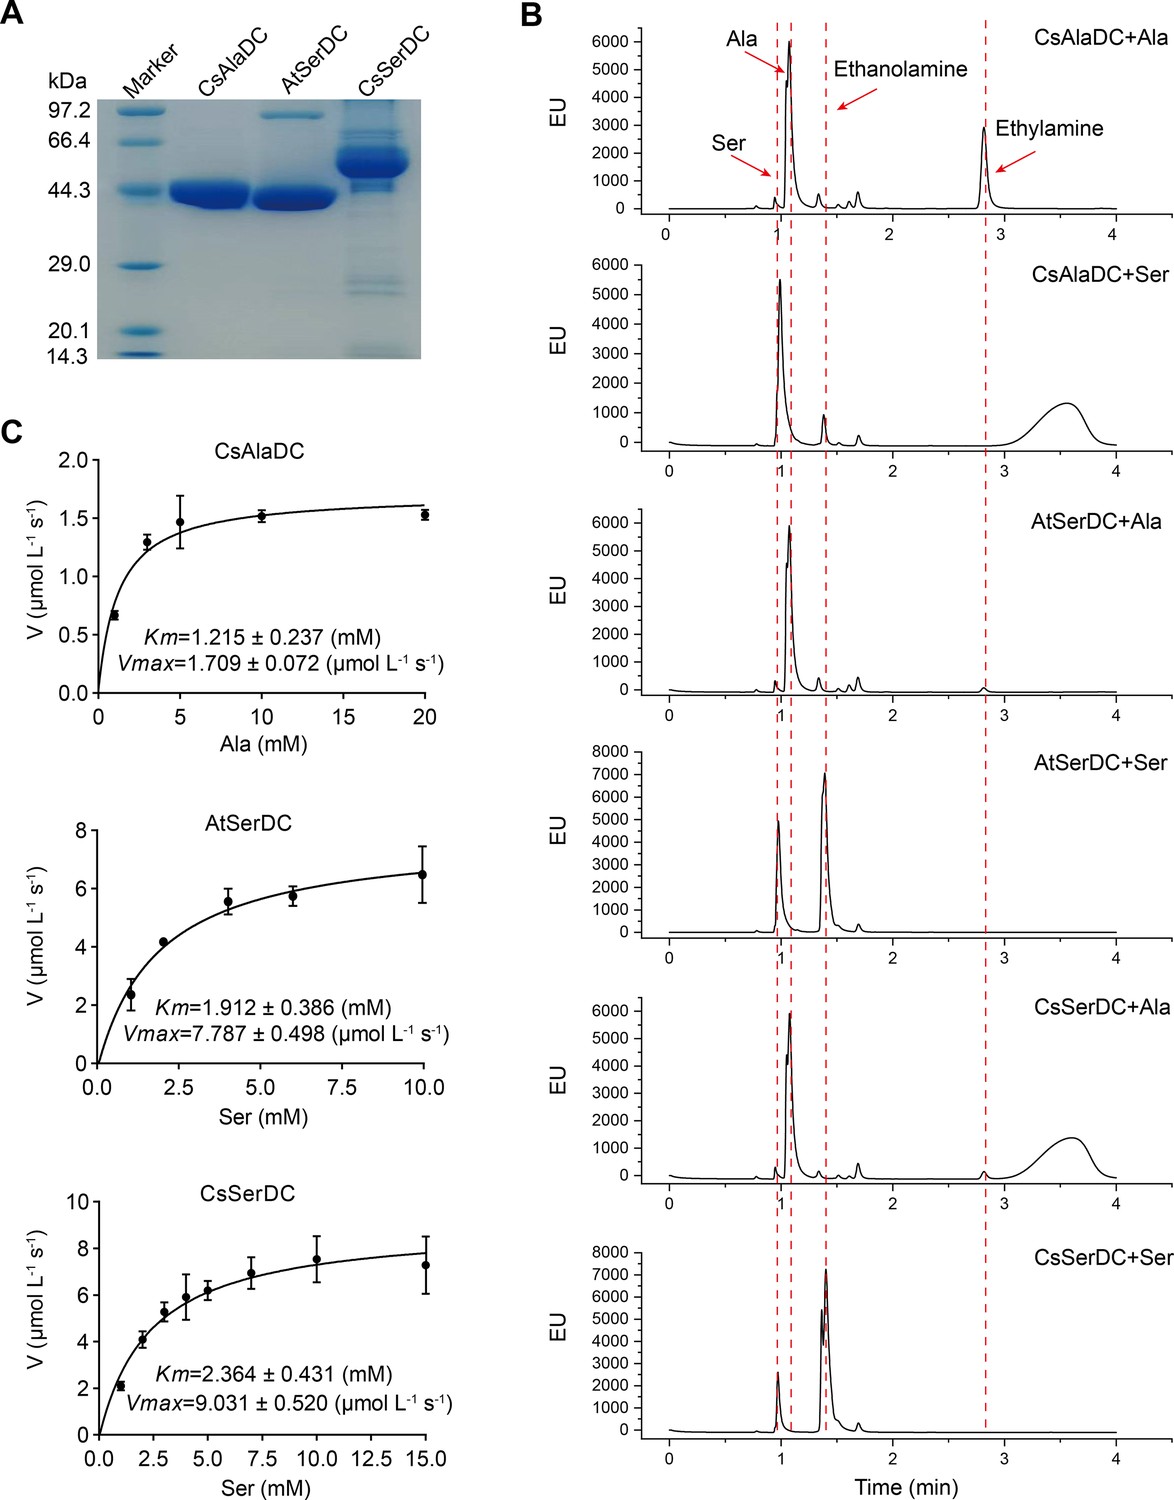
Purification and characterization of Camellia sinensis alanine decarboxylase (CsAlaDC), Arabidopsis thaliana serine decarboxylase (AtSerDC), and Camellia sinensis serine decarboxylase (CsSerDC).
(A) Identification of CsAlaDC, AtSerDC, and CsSerDC using SDS-PAGE. (B) Detection of enzyme activities of CsAlaDC, AtSerDC, and CsSerDC by UPLC. (C) Reaction rates of substrates with different concentrations catalyzed by CsAlaDC, AtSerDC, and CsSerDC.
-
Figure 2—source data 1
Uncropped and labelled gels for Figure 2.
- https://cdn.elifesciences.org/articles/91046/elife-91046-fig2-data1-v1.zip
-
Figure 2—source data 2
Raw unedited gels for Figure 2.
- https://cdn.elifesciences.org/articles/91046/elife-91046-fig2-data2-v1.zip
-
Figure 2—source data 3
Raw excel data for Figure 2C.
- https://cdn.elifesciences.org/articles/91046/elife-91046-fig2-data3-v1.xlsx
Figure 2—figure supplement 1

Comparison of elution profiles of Camellia sinensis alanine decarboxylase (CsAlaDC), Arabidopsis thaliana serine decarboxylase (AtSerDC), and Camellia sinensis serine decarboxylase (CsSerDC).
Figure 2—figure supplement 2

Purification of truncated Camellia sinensis alanine decarboxylase (CsAlaDC) and Arabidopsis thaliana serine decarboxylase (AtSerDC).
Lane 1 represents markers. The precipitated and eluted samples of AtSerDC with a truncated zinc finger structure are shown in lanes 2 and 3, respectively, the precipitated and eluted samples of CsAlaDC with a truncated zinc finger structure are illustrated in lanes 4 and 5, respectively.
-
Figure 2—figure supplement 2—source data 1
Uncropped and labelled gels for Figure 2—figure supplement 2.
- https://cdn.elifesciences.org/articles/91046/elife-91046-fig2-figsupp2-data1-v1.zip
-
Figure 2—figure supplement 2—source data 2
Raw unedited gels for Figure 2—figure supplement 2.
- https://cdn.elifesciences.org/articles/91046/elife-91046-fig2-figsupp2-data2-v1.zip
Figure 3 with 4 supplements
Crystal structures of Camellia sinensis alanine decarboxylase (CsAlaDC) and Arabidopsis thaliana serine decarboxylase (AtSerDC).
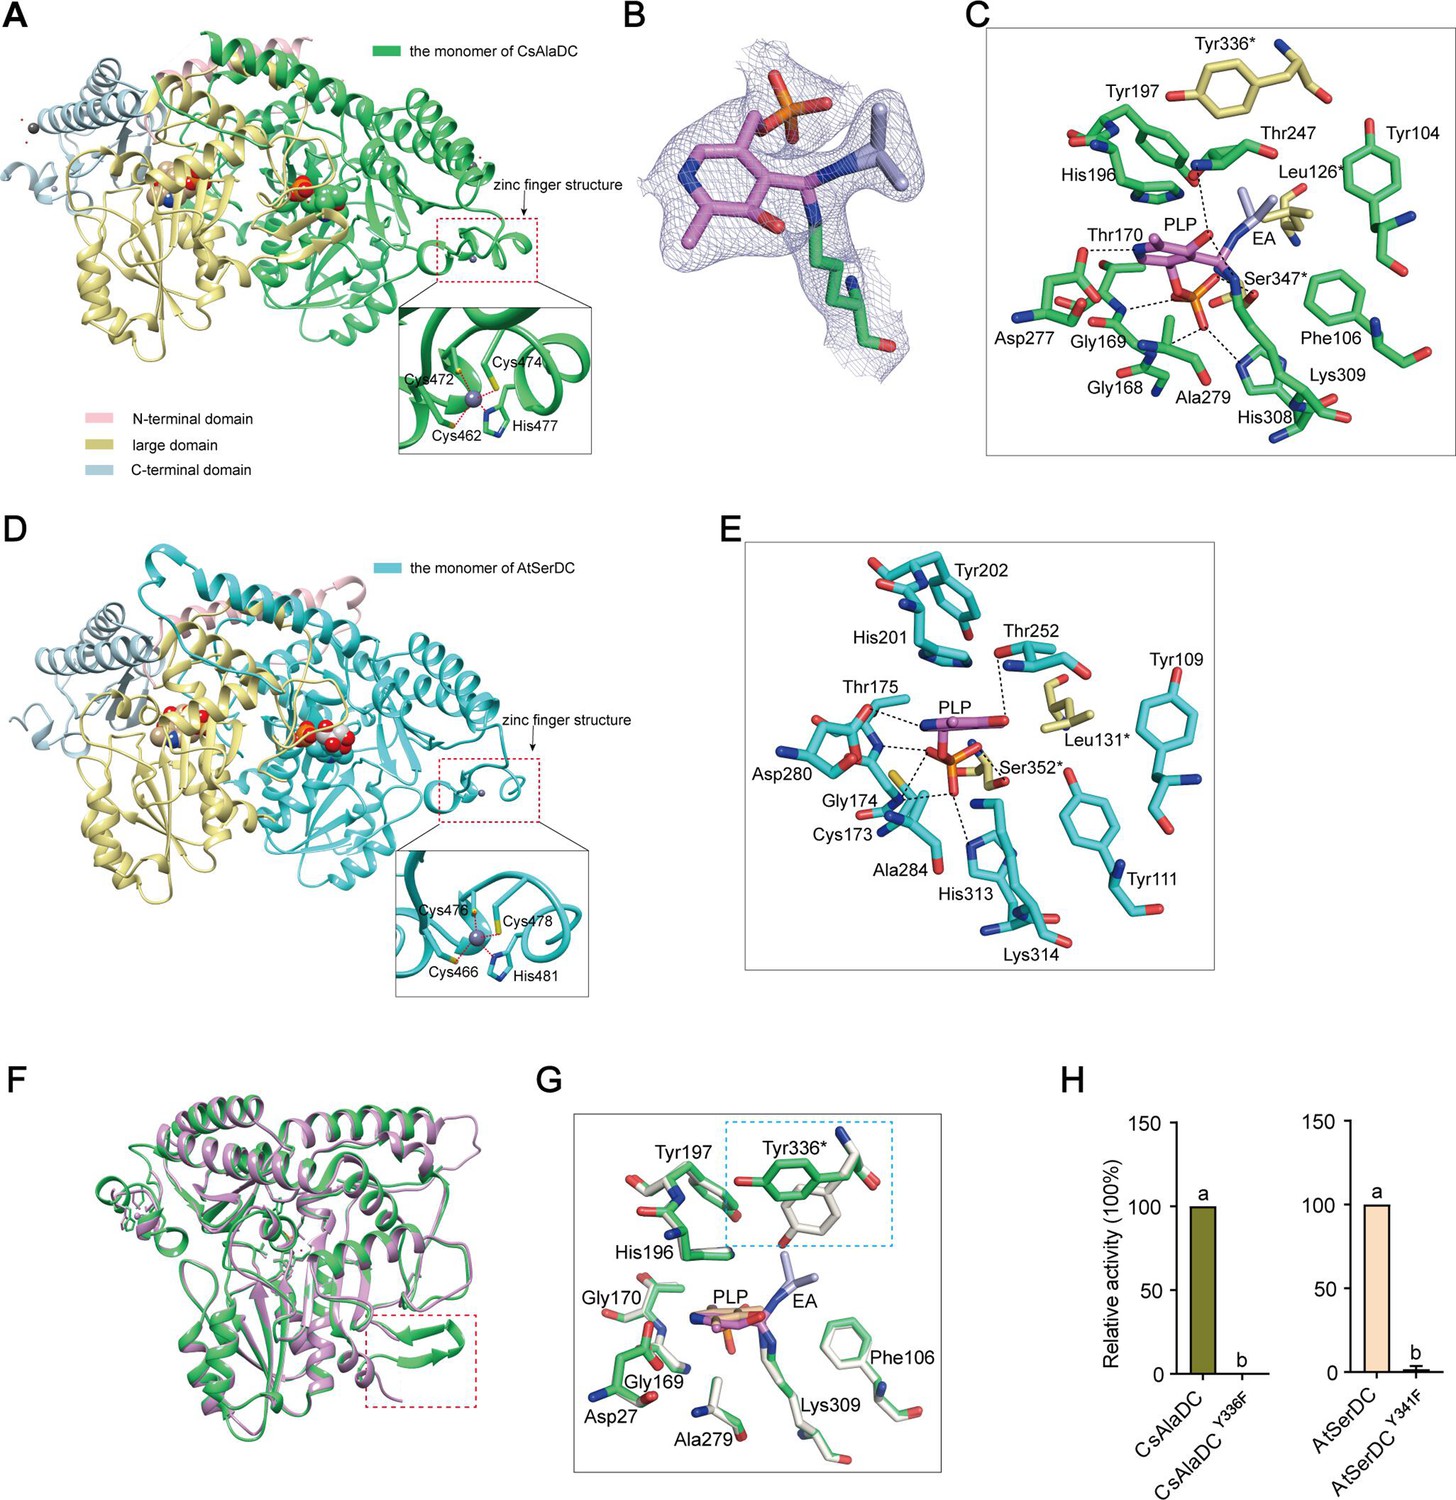
(A) Dimer structure of CsAlaDC. The color display of the N-terminal domain, large domain, and C-terminal domains of chain A is shown in light pink, khaki, and sky blue, respectively. Chain B is shown in spring green. The pyridoxal-5-phosphate (PLP) molecule is shown as a sphere model. The zinc finger structure at the C-terminus of CsAlaDC is indicated by the red box. The gray spheres represent zinc ions, while the red dotted line depicts the coordination bonds formed by zinc ions with cysteine and histidine. (B) The 2Fo-Fc electron density maps of K309-PLP-EA (contoured at 1σ level). The PLP is shown in violet, the K309 is shown in spring green, and the ethylamine (EA) is shown in light blue. (C) Active center of the CsAlaDC-EA complex, with hydrogen bonds denoted by black dotted lines. ‘*’ denotes the amino acids on adjacent subunits. (D) Dimer structure of AtSerDC. The color display of the N-terminal domain, large domain, and C-terminal domains of chain A is shown in light pink, khaki, and sky blue, respectively. Chain B is shown in cyan. The PLP molecule is shown as a sphere model. The zinc finger structure at the C-terminus of AtSerDC is indicated by the red box. The gray spheres represent zinc ions, while the red dotted line depicts the coordination bonds formed by zinc ions with cysteine and histidine. (E) Active center of the AtSerDC, with hydrogen bonds denoted by black dotted lines. ‘*’ denotes the amino acids on adjacent subunits. (F) The monomers of CsAlaDC and AtSerDC are superimposed. CsAlaDC is depicted in spring green, while AtSerDC is shown in plum. The conserved amino acid catalytic loop is indicated by the red box. (G) Amino acid residues of the active center in the CsAlaDC apo and CsAlaDC-EA complex are superimposed. CsAlaDC apo is shown in floral white, while CsAlaDC-EA complex is shown in spring green. (H) The relative activity of wild-type CsAlaDC and its Y336F mutant (left), as well as wild-type AtSerDC and its Y341F mutant (right), is shown. Data represent mean ± SD (n=3). The significance of the difference (p<0.05) was labeled with different letters according to Duncan’s multiple range test.
-
Figure 3—source data 1
Raw excel data for Figure 3H.
- https://cdn.elifesciences.org/articles/91046/elife-91046-fig3-data1-v1.xlsx
Figure 3—figure supplement 1
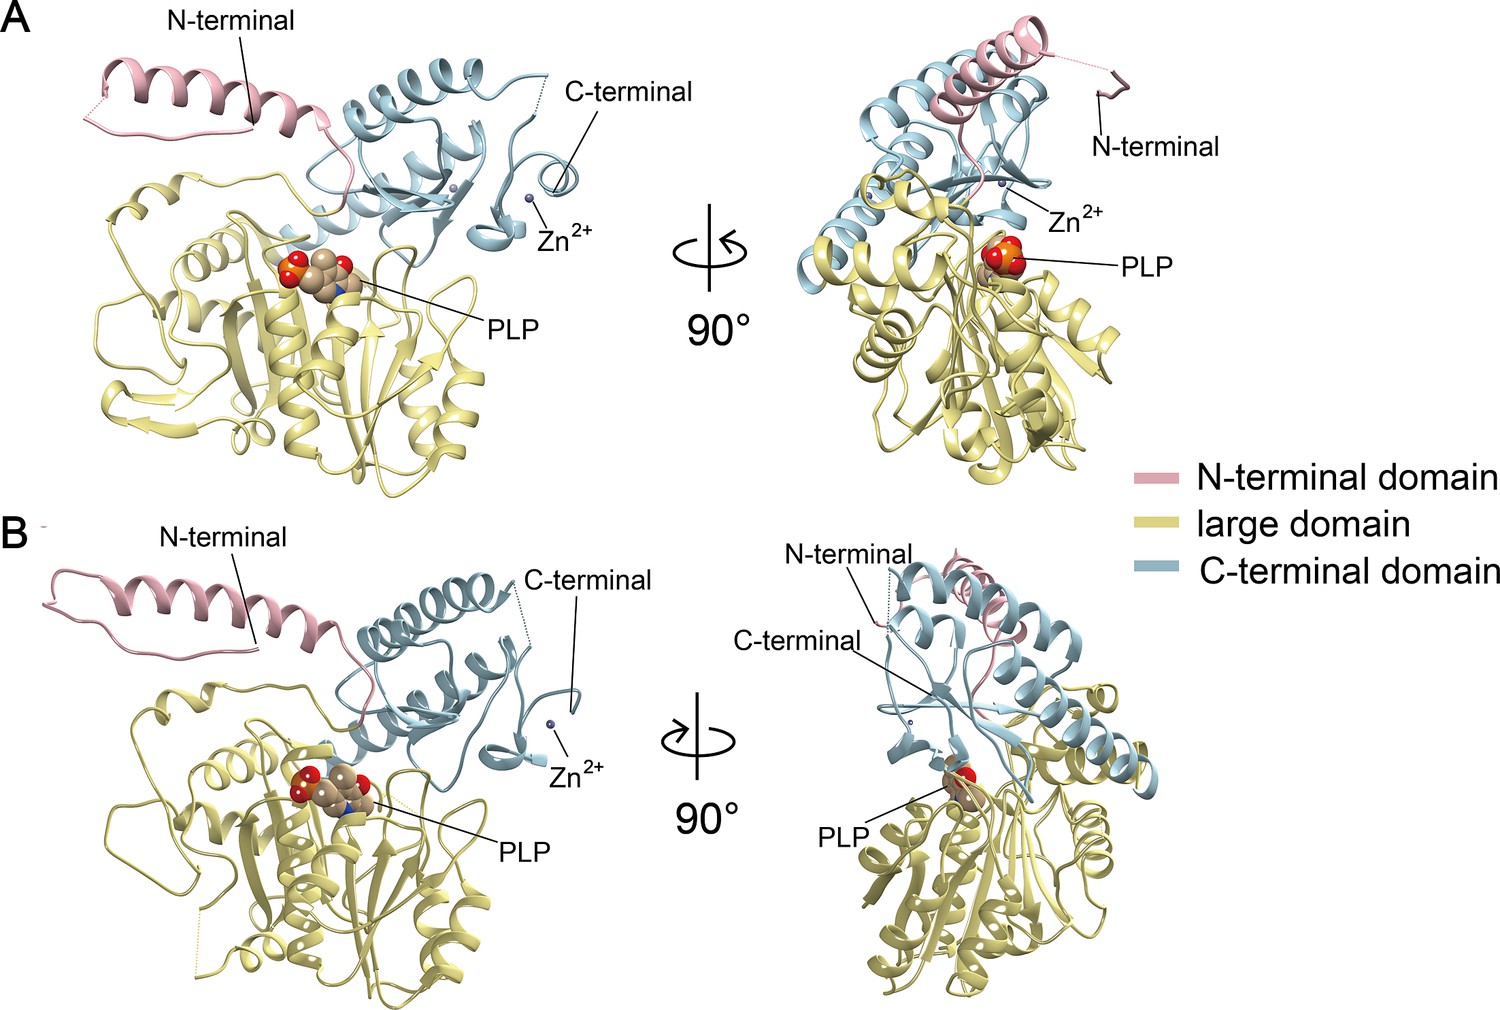
Crystal structures of Camellia sinensis alanine decarboxylase (CsAlaDC) and Arabidopsis thaliana serine decarboxylase (AtSerDC).
(A) Monomer structure of CsAlaDC. (B) Monomer structure of AtSerDC. The color display of the N-terminal domain, large domain, and C-terminal domains is shown in light pink, khaki, and sky blue, respectively. The pyridoxal-5-phosphate (PLP) molecule is shown as a sphere model. The gray spheres represent zinc ions.
Figure 3—figure supplement 2
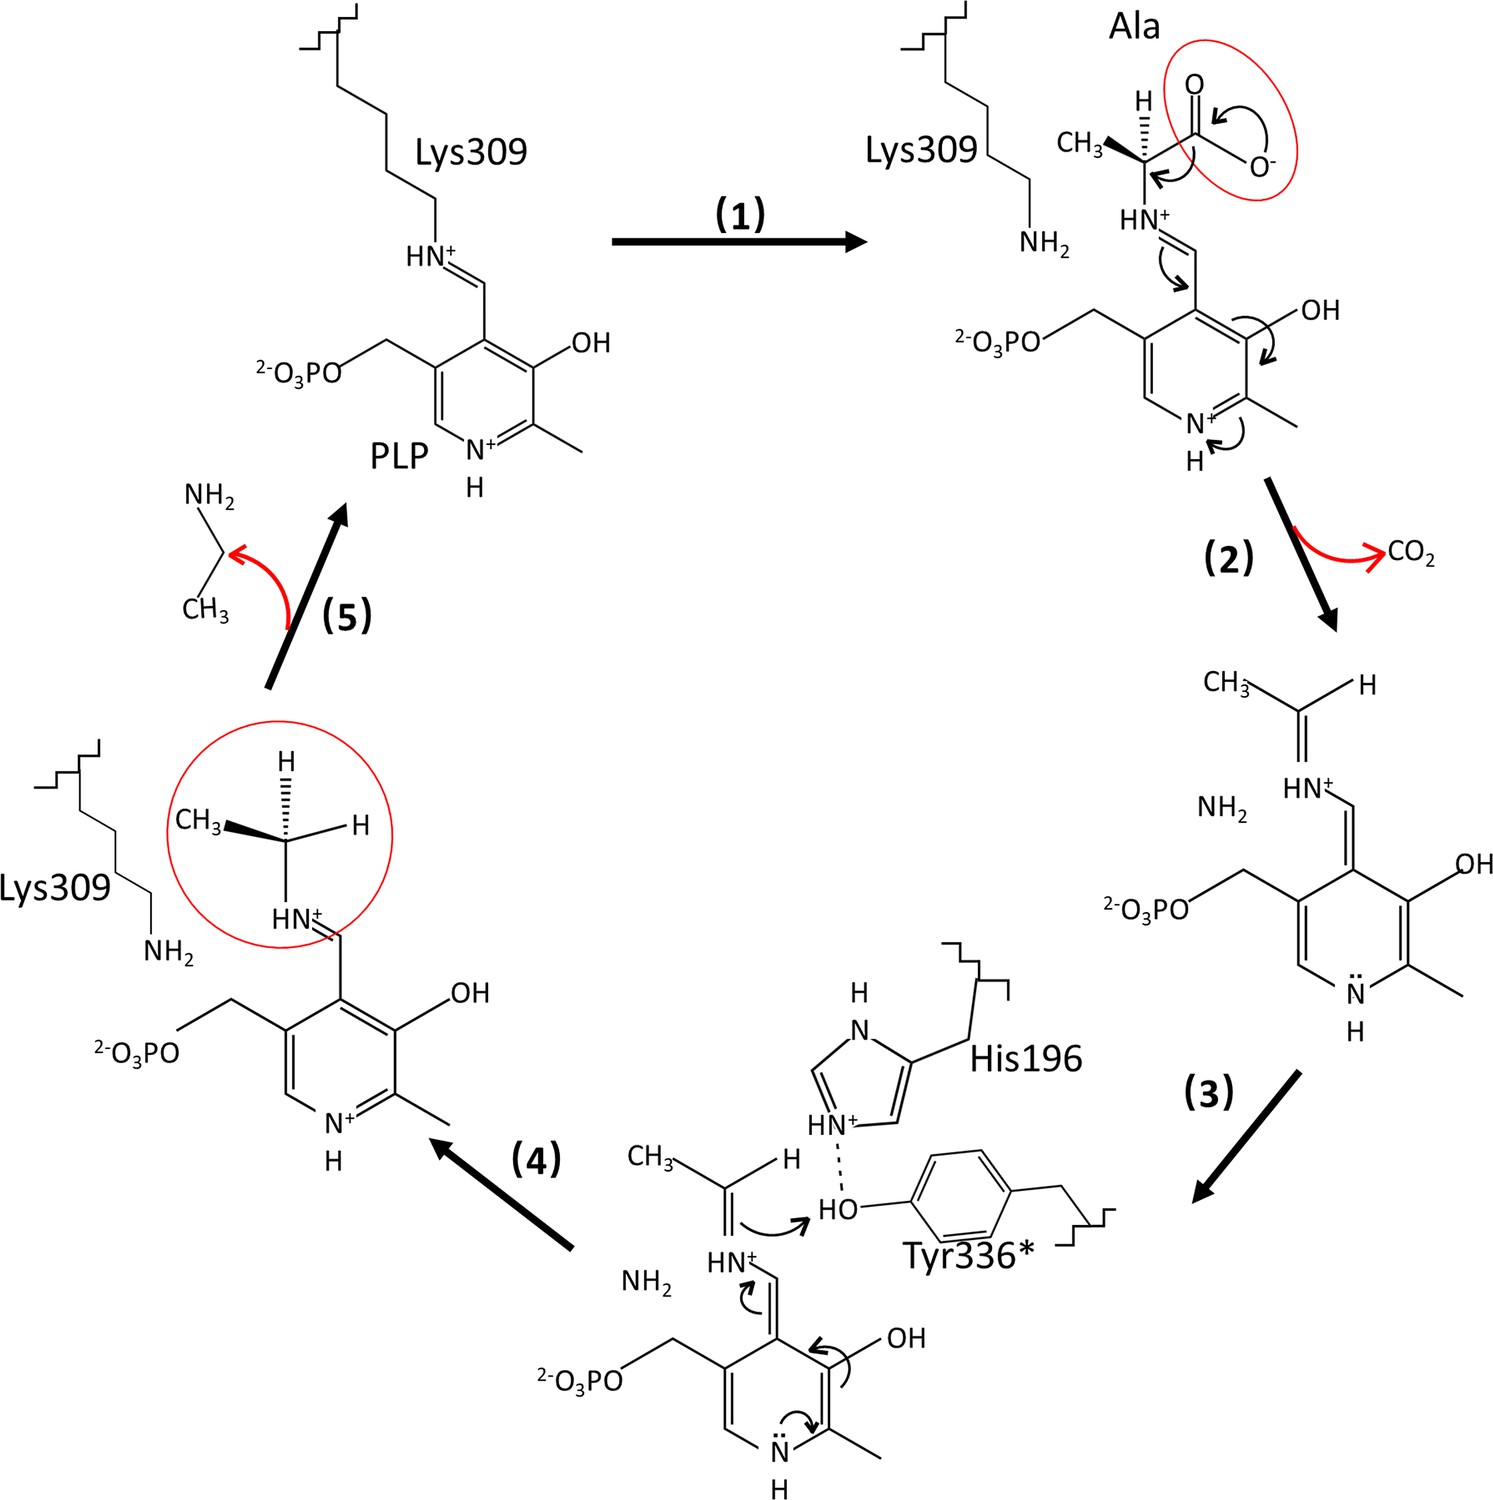
Catalytic mechanisms and conformational changes of Camellia sinensis alanine decarboxylase (CsAlaDC).
After the transaldimation of the internal aldimine within CsAlaDC, resulting in the release of the active-site residue Lys309, the pyridoxal-5-phosphate (PLP) amino acid external aldimine undergoes decarboxylation, leading to the removal of the α-carboxyl group as CO2. This process generates a quinonoid intermediate that is stabilized by the delocalization of paired electrons (Drew, 2019; Juneja et al., 1999). The carbanion at Cα is subsequently protonated by the acidic p-hydroxyl group of Tyr336* located on the large loop, facilitated by its neighboring residue His196, which is situated on the small loop (Lin et al., 2022; Haskell et al., 2008). Simultaneously, the internal aldimine LLP309 in CsAlaDC is restored, resulting in the release of the product (Kakuda et al., 2000).
Figure 3—figure supplement 3
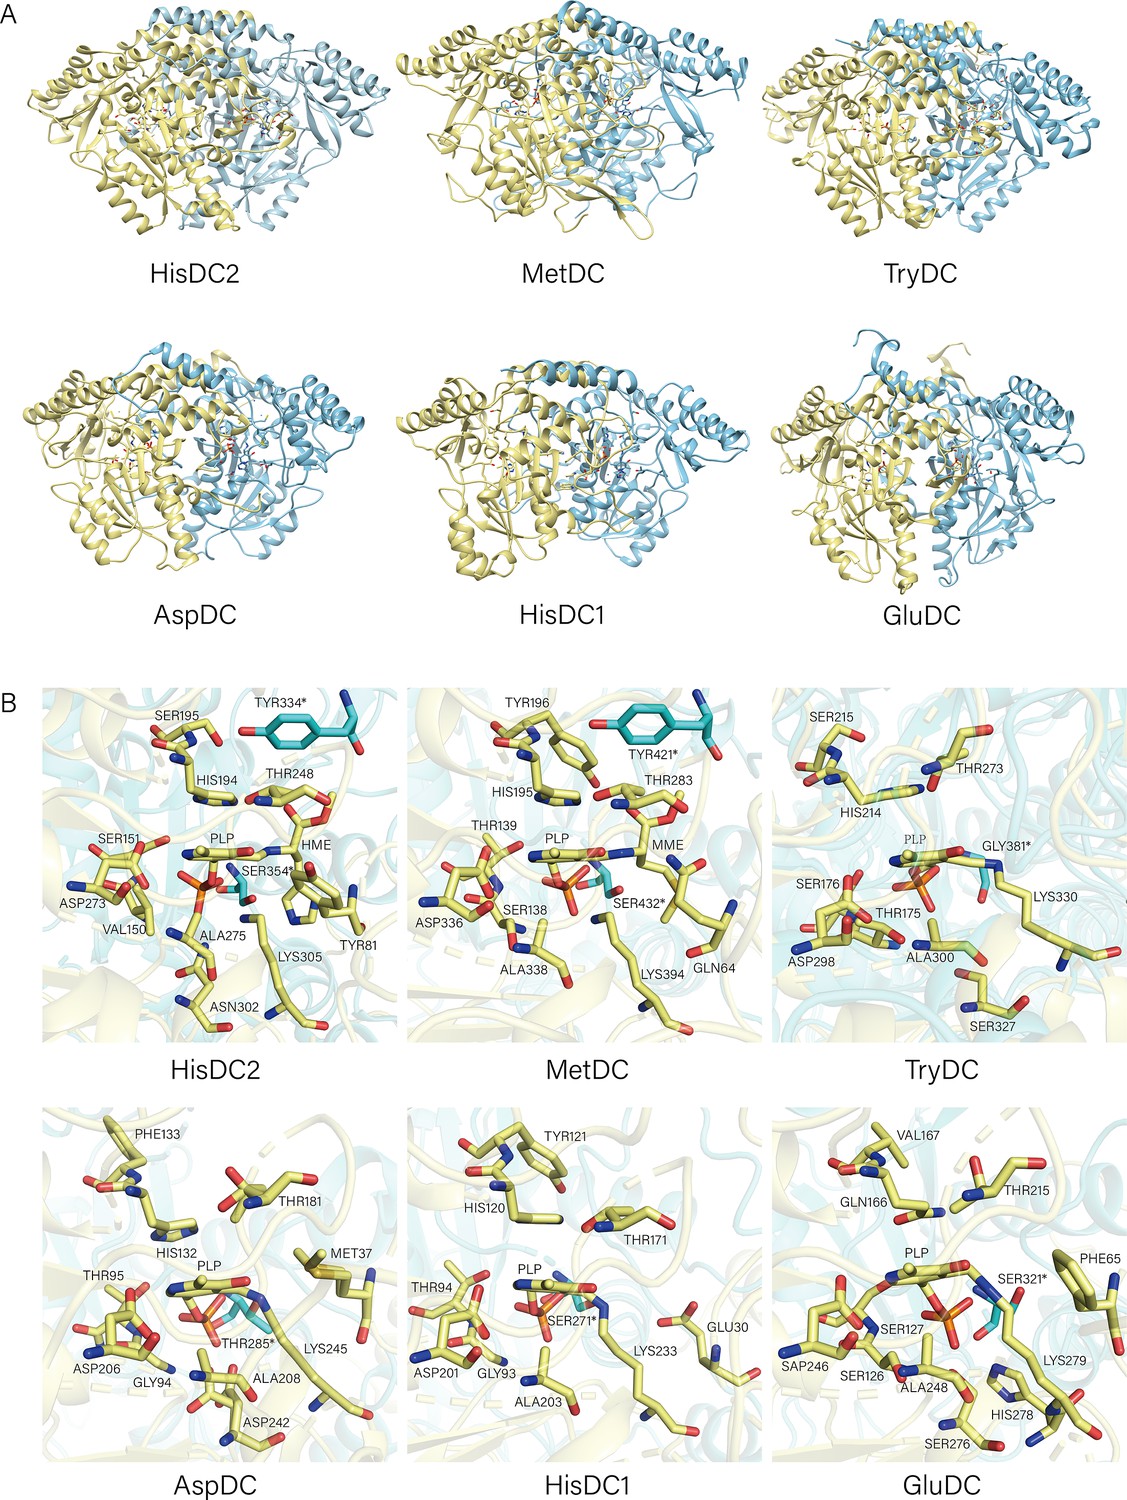
Structures of HisDC2, MetDC, TrpDC, AspDC, HisDC1, and GluDC.
(A) The Overall Structures of HisDC2, MetDC, TryDC, AspDC, HisDC1, and GluDC. Chain A is shown in khaki, chain B is shown in cyan. (B) Amino acid residues in the substrate binding pocket of HisDC2, MetDC, TryDC, AspDC, HisDC1, and GluDC. The amino acid residues in chain A are shown in khaki, and the amino acid residues in chain B are shown in cyan.
Figure 3—figure supplement 4
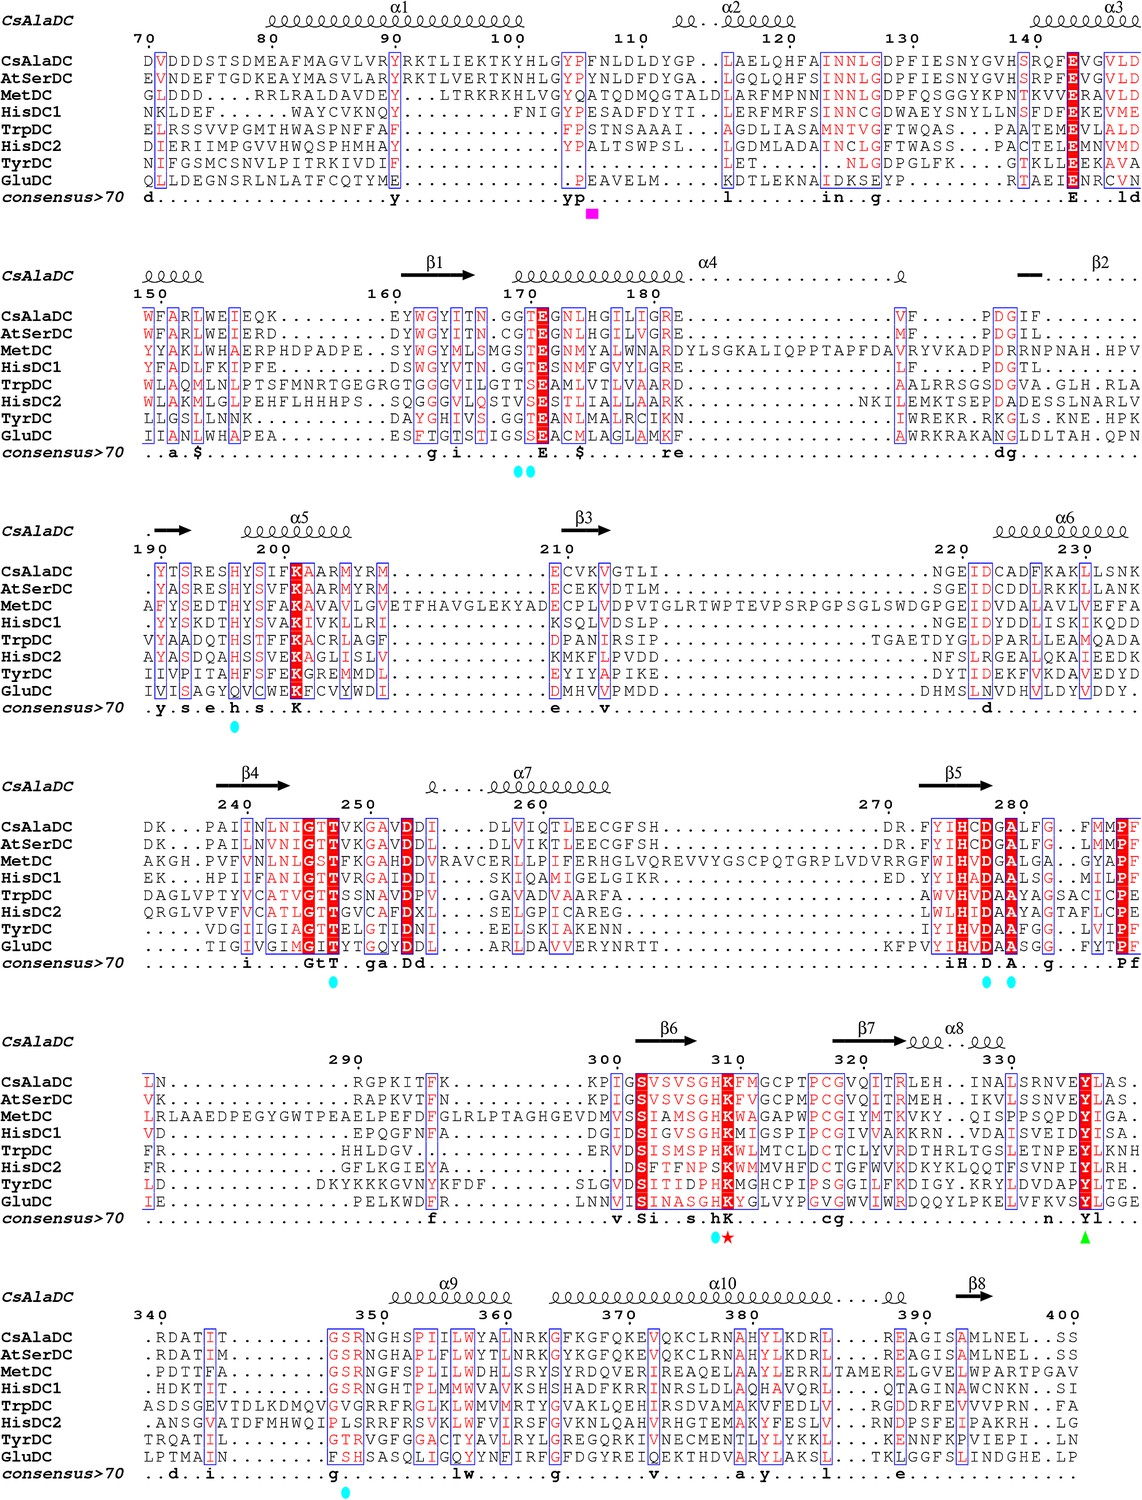
Multiple sequence alignments of Camellia sinensis alanine decarboxylase (CsAlaDC), Arabidopsis thaliana serine decarboxylase (AtSerDC), MetDC, HisDC1, TrpDC, HisDC2, TyrDC, and GluDC were generated using MUSCLE and visualized with ESPript 3 .x.
Conserved amino acid residues in all eight proteins are highlighted with red backgrounds. The magenta box marks key amino acid residues involved in substrate recognition for CsAlaDC and AtSerDC. The Lys residue covalently bound to the pyridoxal-5-phosphate (PLP) cofactor is denoted by a red star, while the green triangle indicates the Tyr residue associated with enzymatic activity. Amino acid residues involved in the CsAlaDC substrate binding pocket are marked with blue circles.
Figure 4 with 4 supplements
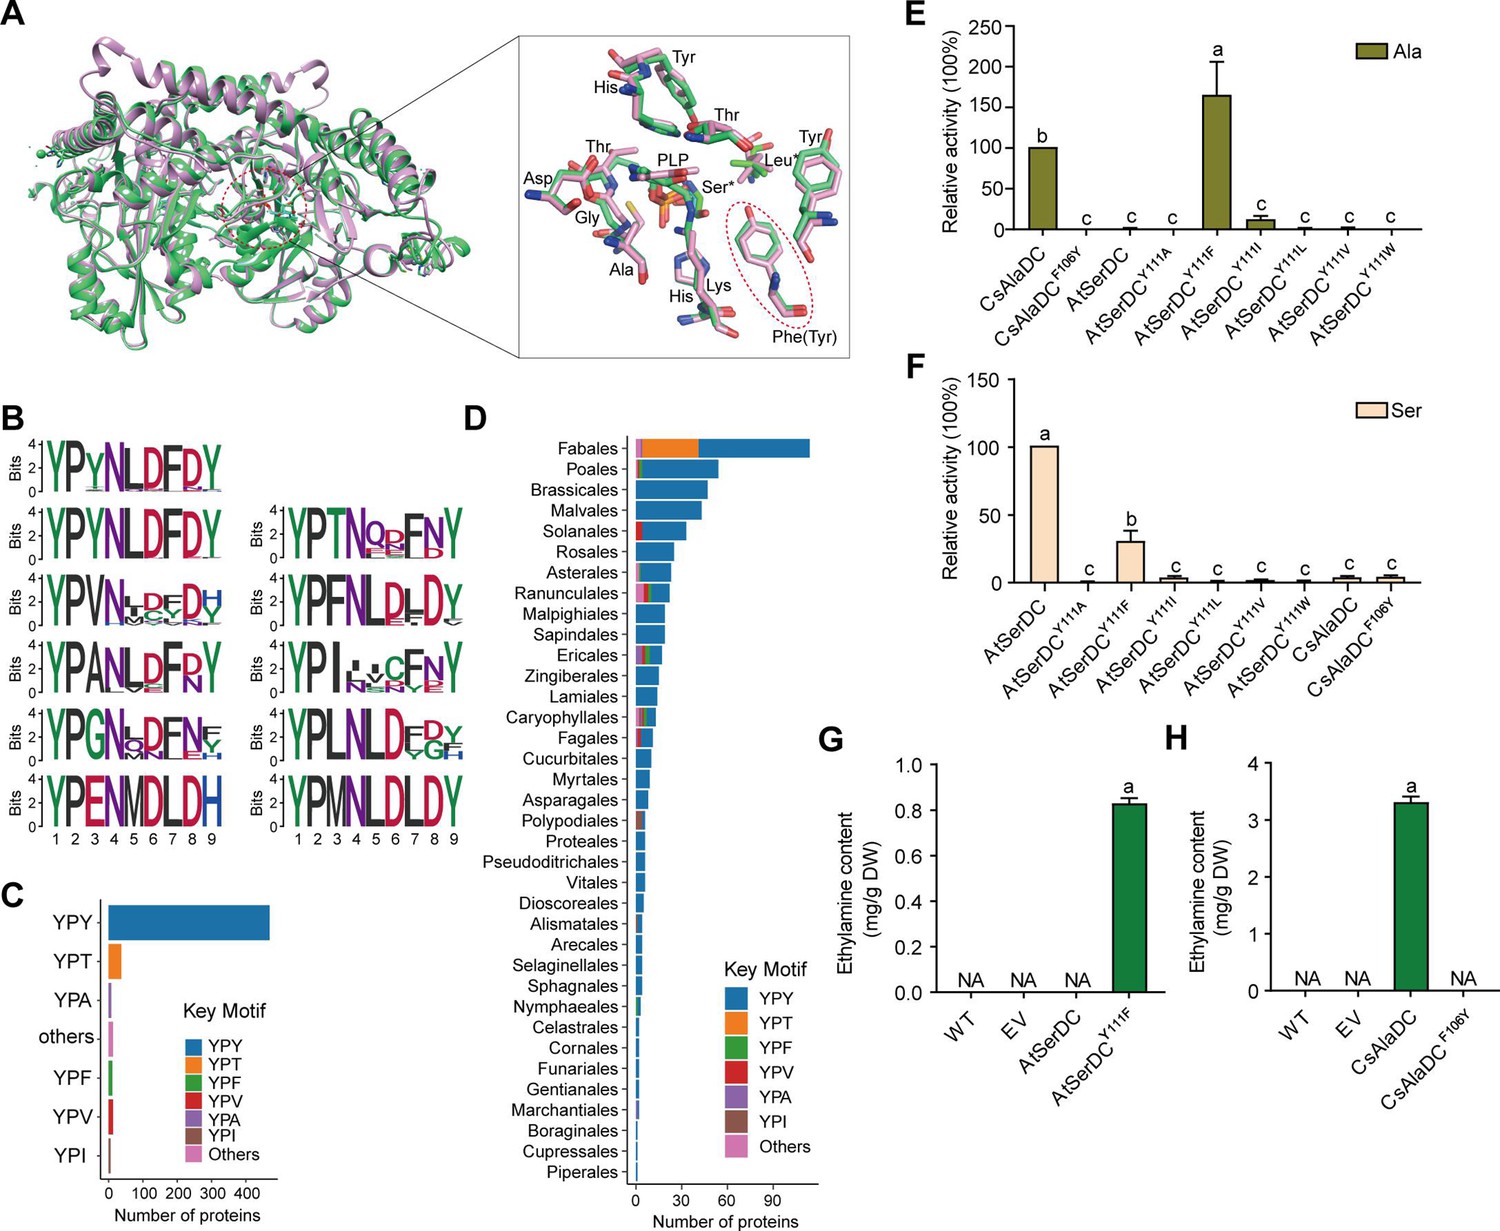
Key amino acid residues for substrate recognition.
(A) Superposition of substrate binding pocket amino acid residues in Camellia sinensis alanine decarboxylase (CsAlaDC) and Arabidopsis thaliana serine decarboxylase (AtSerDC). The amino acid residues of CsAlaDC are shown in spring green, and the amino acid residues of AtSerDC are shown in plum, with the substrate specificity-related amino acid residue highlighted in a red ellipse. (B) Active-site-lining amino acid residues of serine decarboxylase (SDC) homologs from Embryophyta were identified. The height of each amino acid is scaled proportionally to the amount of information content (measured in bits). The first line depicts the conserved motif in all serine decarboxylase (SerDC) homologs from Embryophyta, whereas lines 2–5 represent the conserved motifs based on the variable third amino acid residue. (C) Histogram showing the distribution of the number of key motifs. (D) Histogram showing the number of key motifs in different plant orders. (E) Relative enzyme activities of wild-type CsAlaDC and mutant protein CsAlaDCF106Y against Ala substrate (columns 1 and 2), and enzyme activities of wild-type AtSerDC and various AtSerDC mutant proteins against Ala substrate (columns 3–9) are presented. The percentage graph shows the relative activity of each protein compared to wild-type CsAlaDC activity (taken as a 100% benchmark). (F) Relative enzyme activities of wild-type AtSerDC and AtSerDC mutant proteins (columns 1–7) against Ser substrates, and enzyme activities of wild-type CsAlaDC and mutant protein CsAlaDCF106Y against Ser substrates (columns 8, 9) were measured. The percentage graph shows the relative activity of each protein compared to the wild-type AtSerDC (taken as a 100% benchmark). Three independent experiments were conducted. (G) The EA contents of AtSerDC and its mutant AtSerDCY111F in N. benthamiana. (H) The ethylamine (EA) contents of CsAlaDC and its mutant CsAlaDCF106Y in N. benthamiana. The significance of the difference (p<0.05) was labeled with different letters according to Duncan’s multiple range test.
-
Figure 4—source data 1
Raw excel data for Figure 4E-H.
- https://cdn.elifesciences.org/articles/91046/elife-91046-fig4-data1-v1.xlsx
Figure 4—figure supplement 1
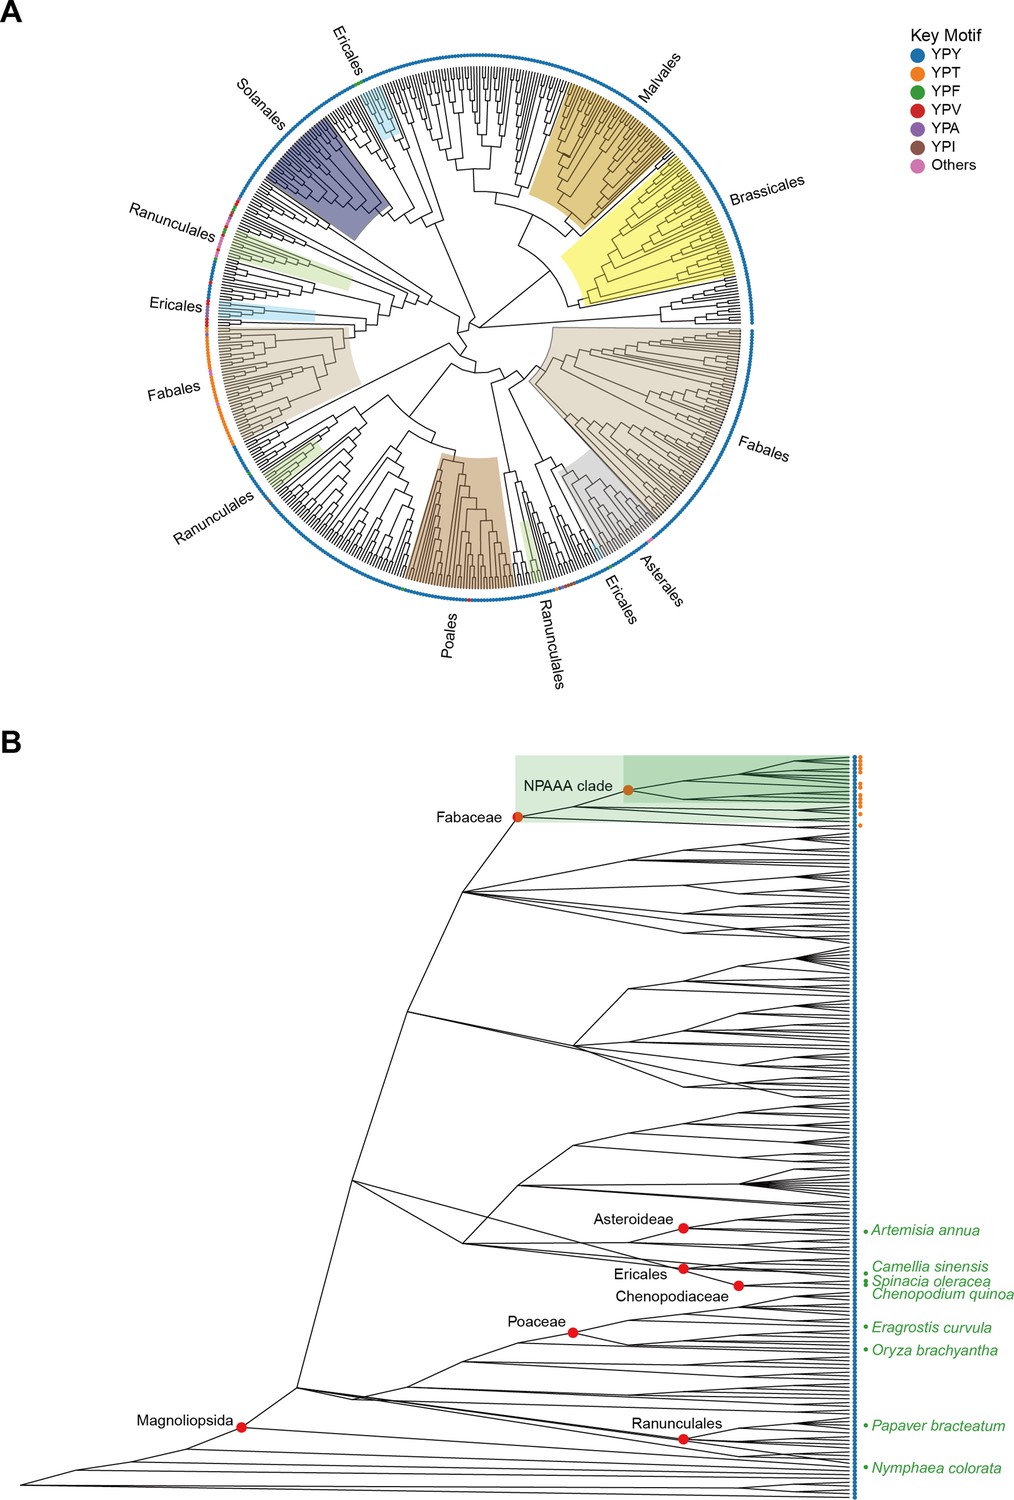
Evolutionary analysis of Camellia sinensis alanine decarboxylase (CsAlaDC) in Embryophyta.
(A) The presented diagram depicts an evolutionary tree of CsAlaDC, which is devoid of a root and solely portrays the topological structure of the tree without including distance information. The color of the inner ring corresponds to various orders, while the outer ring’s leaf nodes are colored based on the motif types that the sequence exhibits. (B) Diversity of serine decarboxylase-like proteins in Embryophyta (196 species). Colored scatter spots on the right side of leaf nodes correspond to the respective motifs shown in A.
Figure 4—figure supplement 2
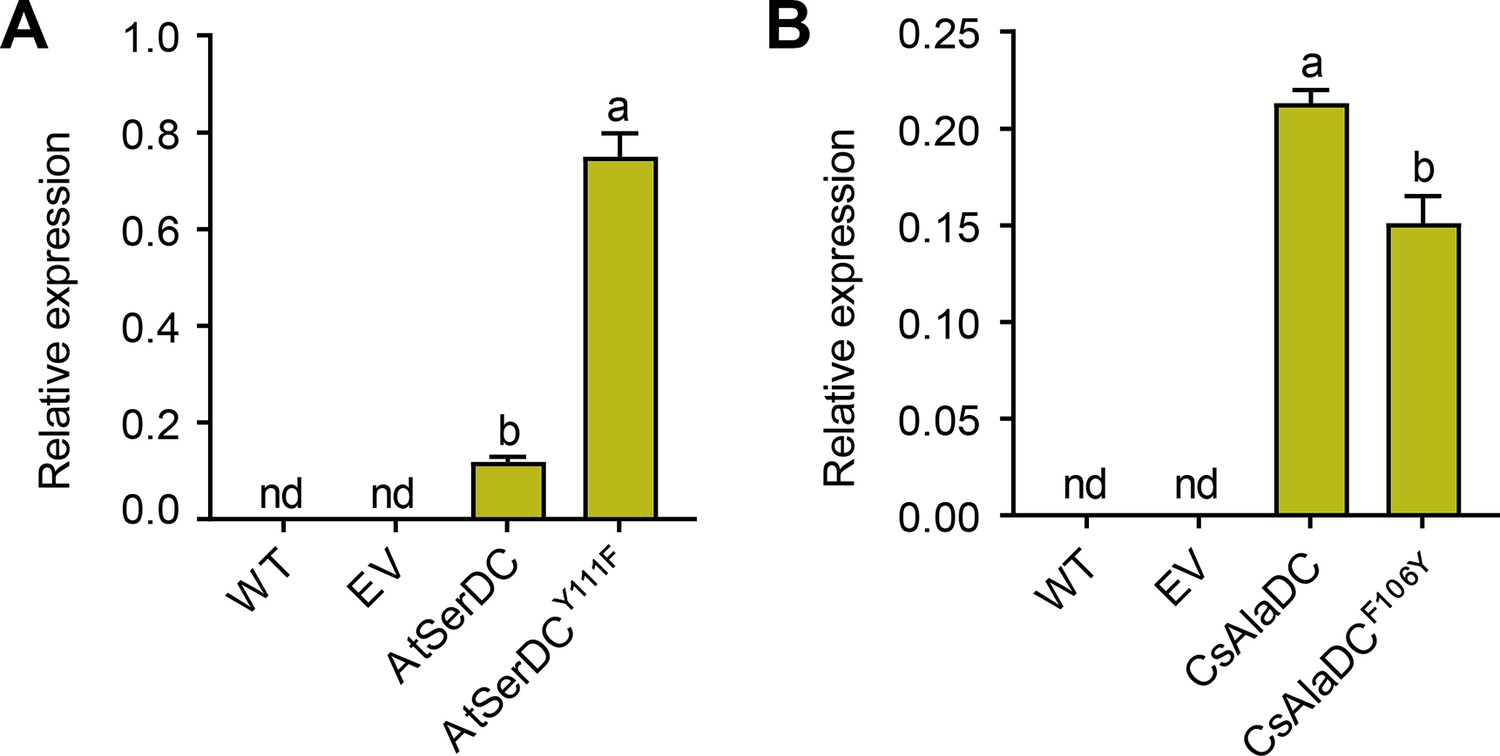
Relative mRNA expression levels of different proteins.
The relative mRNA levels of Arabidopsis thaliana serine decarboxylase (AtSerDC) and its mutant Y111F (A), Camellia sinensis alanine decarboxylase (CsAlaDC), and its mutant F106Y (B) in N.benthamiana leaves were measured by two primers. WT, wildtype of N. benthamiana; EV, empty vector control; NbGAPDH was used as an internal control. Data represent mean ± SD (n=3). The significance of the difference (p<0.05) was labeled with different letters according to Duncan’s multiple range test.
Figure 4—figure supplement 3
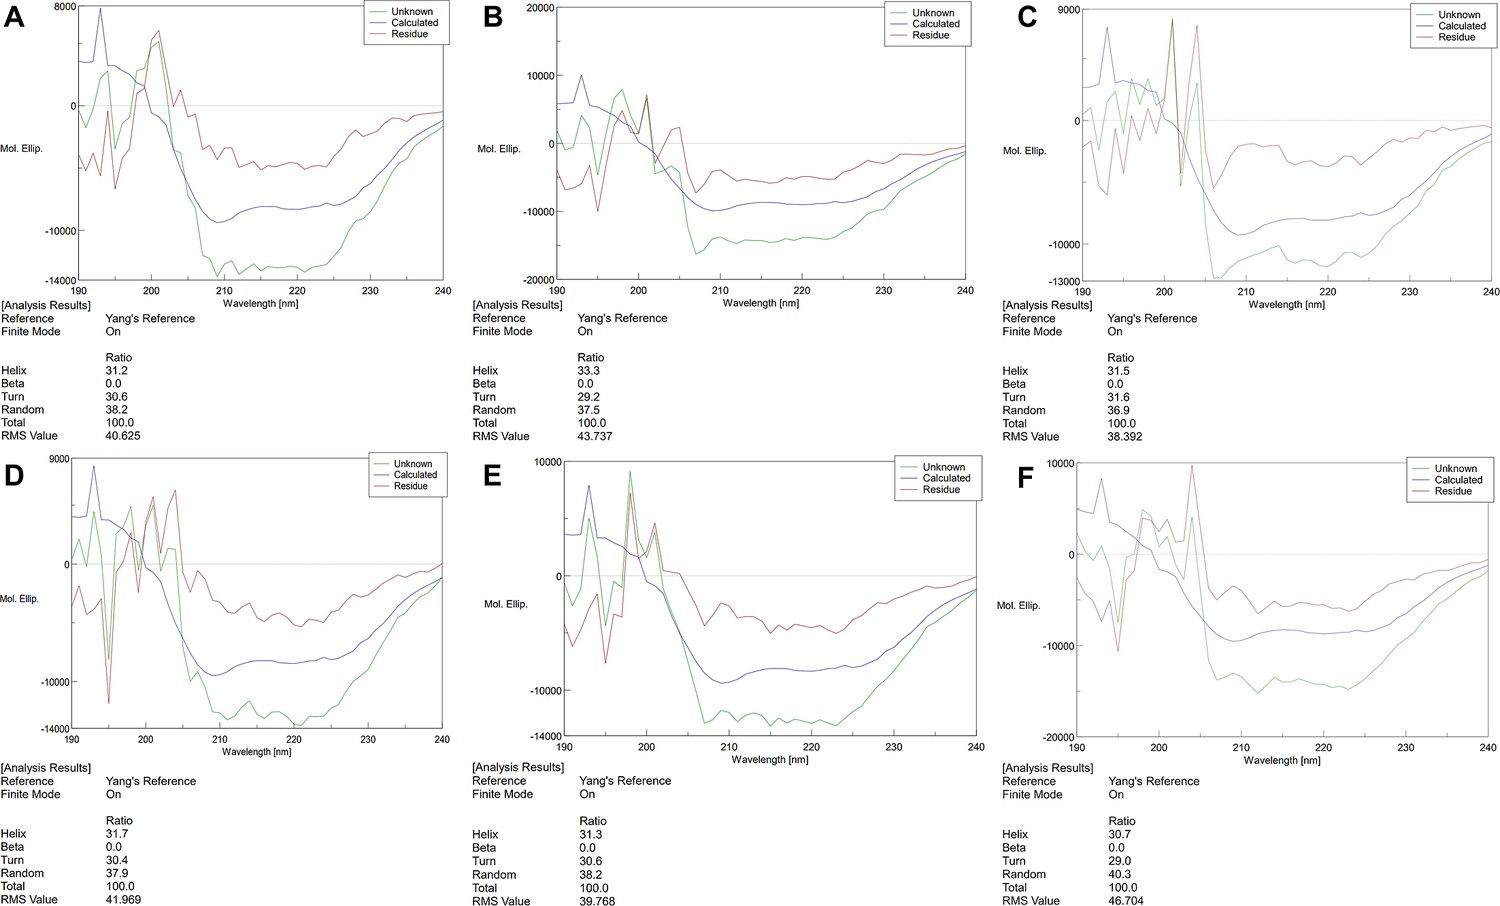
Circular Dichroism Spectra of proteins.
(A) Circular Dichroism Spectra of Camellia sinensis alanine decarboxylase (CsAlaDC) (wild-type, WT). (B) Circular Dichroism Spectra of CsAlaDCY336F. (C) Circular Dichroism Spectra of CsAlaDCF106Y. (D) Circular Dichroism Spectra of AtSerDC (WT). (E) Circular Dichroism Spectra of AtSerDCY341. (F) Circular Dichroism Spectra of AtSerDCY111F.
Figure 4—figure supplement 4
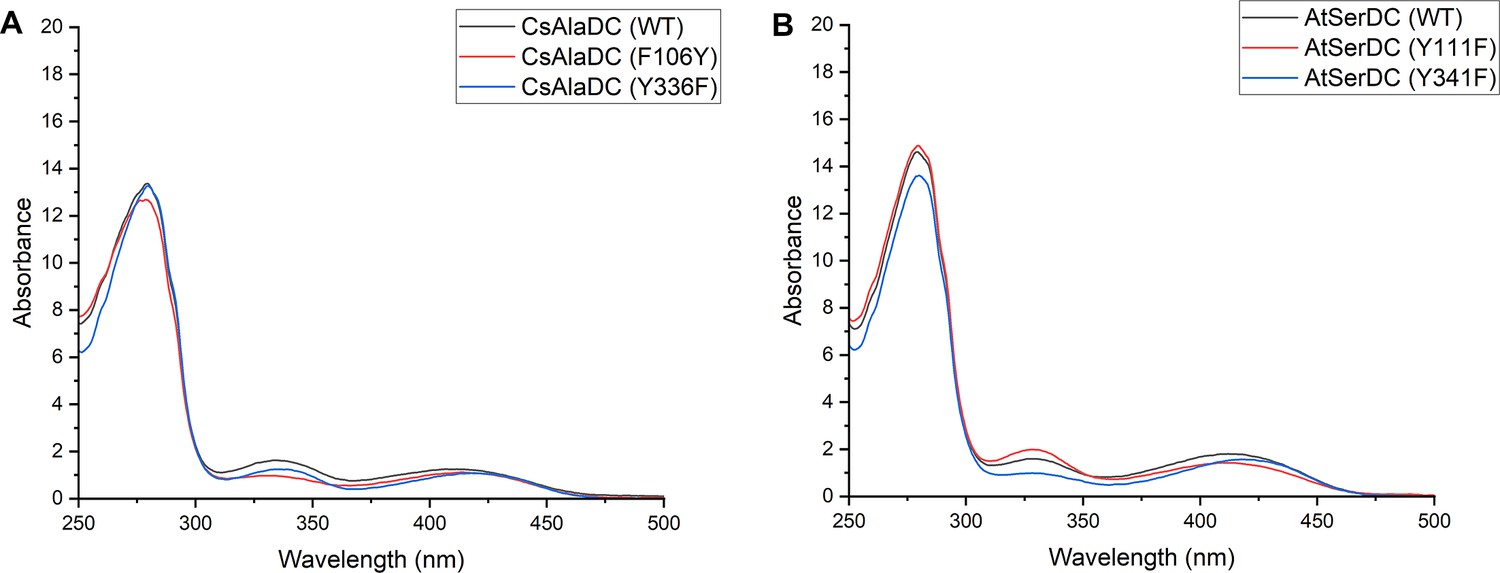
Absorption Spectra of different proteins.
(A) Absorption Spectra of Camellia sinensis alanine decarboxylase (CsAlaDC) (wild-type, WT), CsAlaDCY336F and CsAlaDF106Y. (B) Absorption Spectra of Arabidopsis thaliana serine decarboxylase (AtSerDC) (WT), AtSerDCY341F, and AtSerDCY111F.
Figure 5
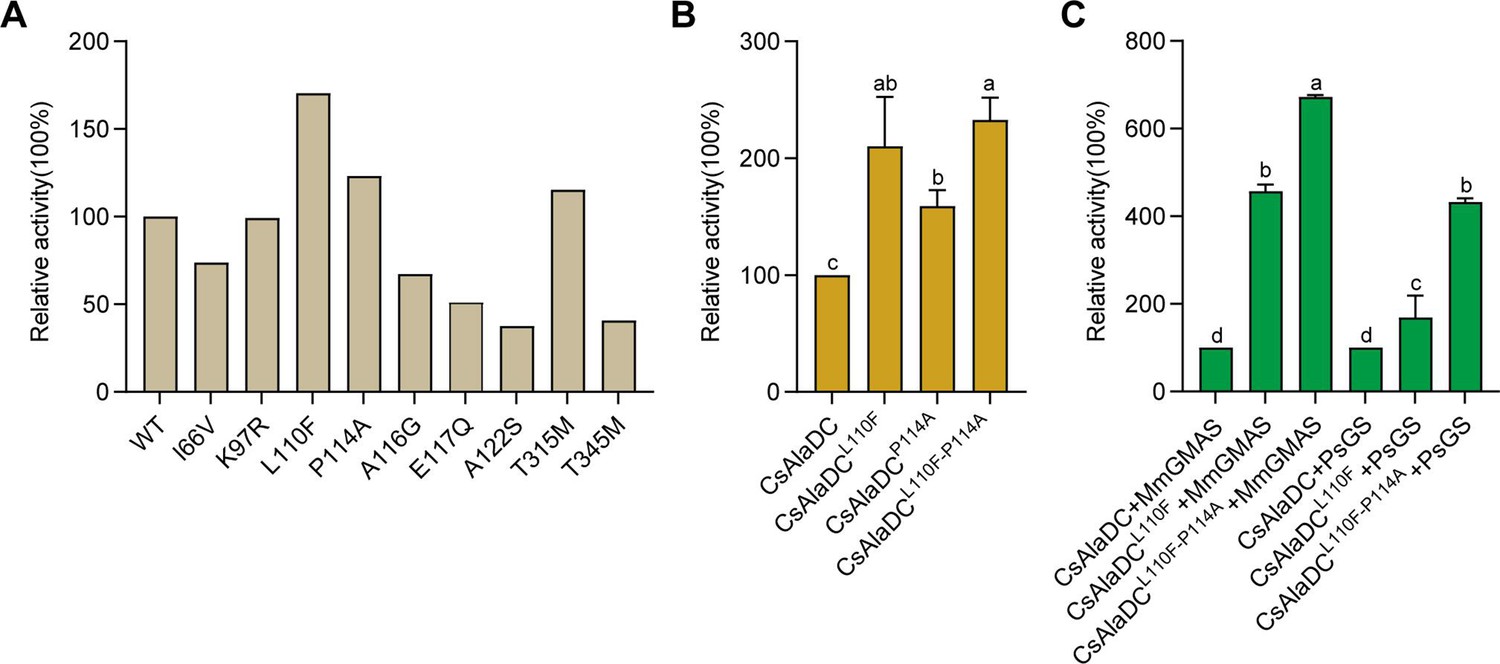
Mutations enhance Camellia sinensis alanine decarboxylase (CsAlaDC) enzyme activity and theanine synthesis in vitro.
(A) Relative enzyme activities of CsAlaDC mutant proteins against Ala substrate. (B) Relative enzyme activities of CsAlaDCL110F, CsAlaDCP114A, and CsAlaDCL110F/P114A against Ala substrate. (C) Histogram showing the relative content of theanine resulting from different combinations of alanine decarboxylase and theanine synthetase. Data represent mean ± SD (n=3). The significance of the difference (p<0.05) was labeled with different letters according to Duncan’s multiple range test.
-
Figure 5—source data 1
Raw excel data for Figure 5.
- https://cdn.elifesciences.org/articles/91046/elife-91046-fig5-data1-v1.xlsx
Author response image 1
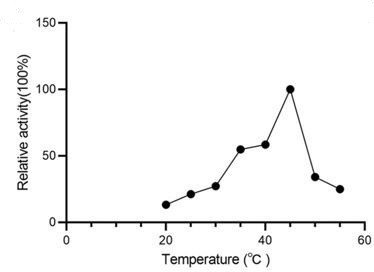
Relative activity of CsAlaDC at different temperatures.
Author response image 2

Absorption Spectra of CsAlaDC (WT) and CsAlaDC (Y336F) (A); and absorption Spectra of AtSerDC (WT) and AtSerDC (Y341F) (B).
Author response image 3

Absorption Spectra of CsAlaDC (WT) and CsAlaDC (F106Y) (A); and absorption Spectra of AtSerDC (WT) and AtSerDC (Y111F) (B).
Tables
Table 1
Kinetic parameters of Camellia sinensis alanine decarboxylase (CsAlaDC), Arabidopsis thaliana serine decarboxylase (AtSerDC), and Camellia sinensis serine decarboxylase (CsSerDC).
| Enzyme | Substrate | Km (mM) | Vmax (μmol L–1 s–1) | Kcat (s–1) | Kcat/Km (s–1 M–1) |
|---|---|---|---|---|---|
| CsAlaDC | Alanine | 1.215±0.237 | 1.709±0.072 | 0.068 | 56.0 |
| AtSerDC | Serine | 1.912±0.386 | 7.787±0.498 | 0.311 | 162.7 |
| CsSerDC | Serine | 2.364±0.431 | 9.031±0.520 | 0.361 | 152.7 |
Additional files
-
MDAR checklist
- https://cdn.elifesciences.org/articles/91046/elife-91046-mdarchecklist1-v1.docx
-
Supplementary file 1
Supplementary tables.
(a) Data collection and refinement statistics. (b) Primers used for gene cloning. (c) Primers used for real-time PCR.
- https://cdn.elifesciences.org/articles/91046/elife-91046-supp1-v1.docx
Download links
A two-part list of links to download the article, or parts of the article, in various formats.
Downloads (link to download the article as PDF)
Open citations (links to open the citations from this article in various online reference manager services)
Cite this article (links to download the citations from this article in formats compatible with various reference manager tools)
Structure and evolution of alanine/serine decarboxylases and the engineering of theanine production
eLife 12:RP91046.
https://doi.org/10.7554/eLife.91046.4


