Double and triple thermodynamic mutant cycles reveal the basis for specific MsbA-lipid interactions
- Department of Chemistry, Texas A&M University, United States
- Department of Chemistry and Biochemistry and Bio5 Institute, The University of Arizona, United States
- Department of Chemistry, Indiana University, United States
Figures
Figure 1
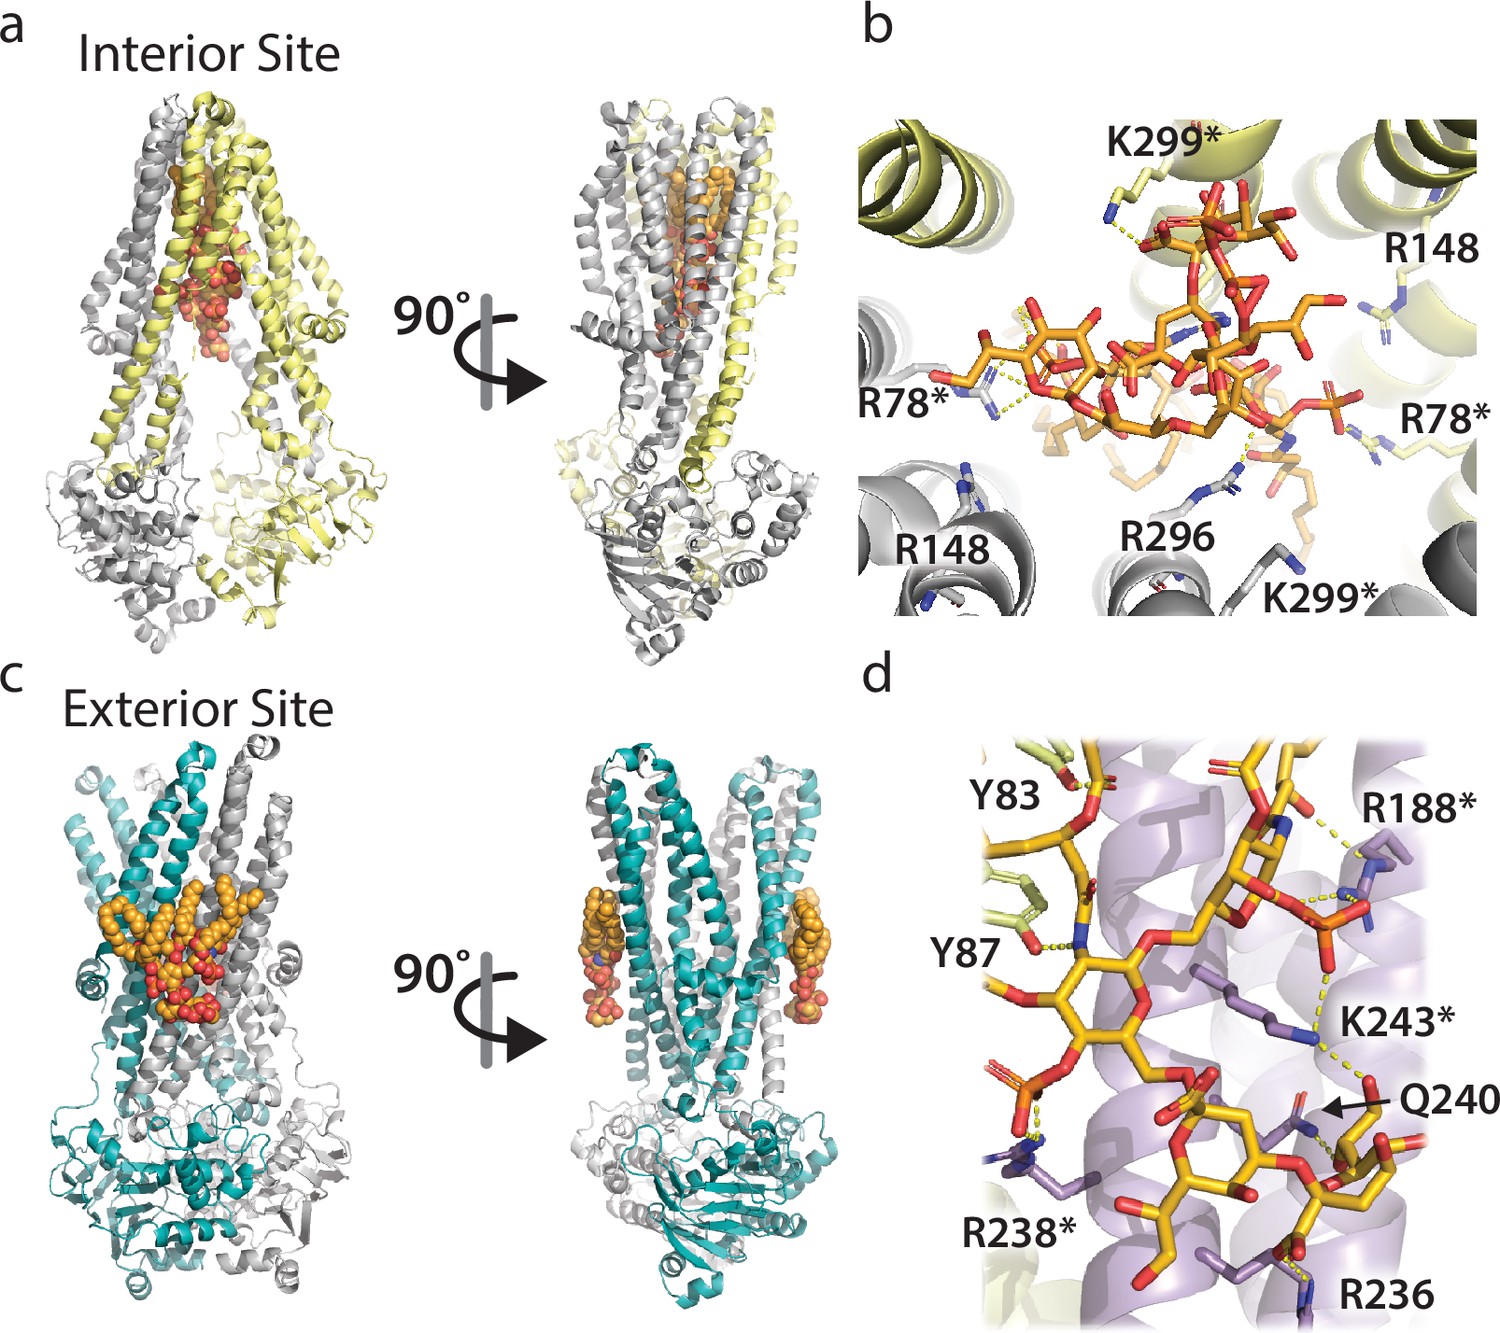
The two distinct LPS binding sites of MsbA and their molecular interactions.
(a) Two views of LPS bound to the interior site or central cavity of MsbA. The protein shown is also bound to the inhibitor G907 (PDB 6BPL) (Ho et al., 2018). The protein and lipid are shown in cartoon and stick representation, respectively. (b) Molecular details of the residues interacting with LPS at the interior site. Bonds are shown as dashed yellow lines along with residue labels. (c) Two views of the KDL molecules bound to the two exterior binding sites of MsbA that are symmetrically related (PDB 8DMM) (Lyu et al., 2022). Shown as described in panel A. (d) Molecular view of KDL bound to MsbA and shown as described in panel B. The asterisk denotes residues selected for mutant cycle analysis.
Figure 2 with 3 supplements

Thermodynamics of KDL binding at the interior site to wild-type and mutant MsbA.
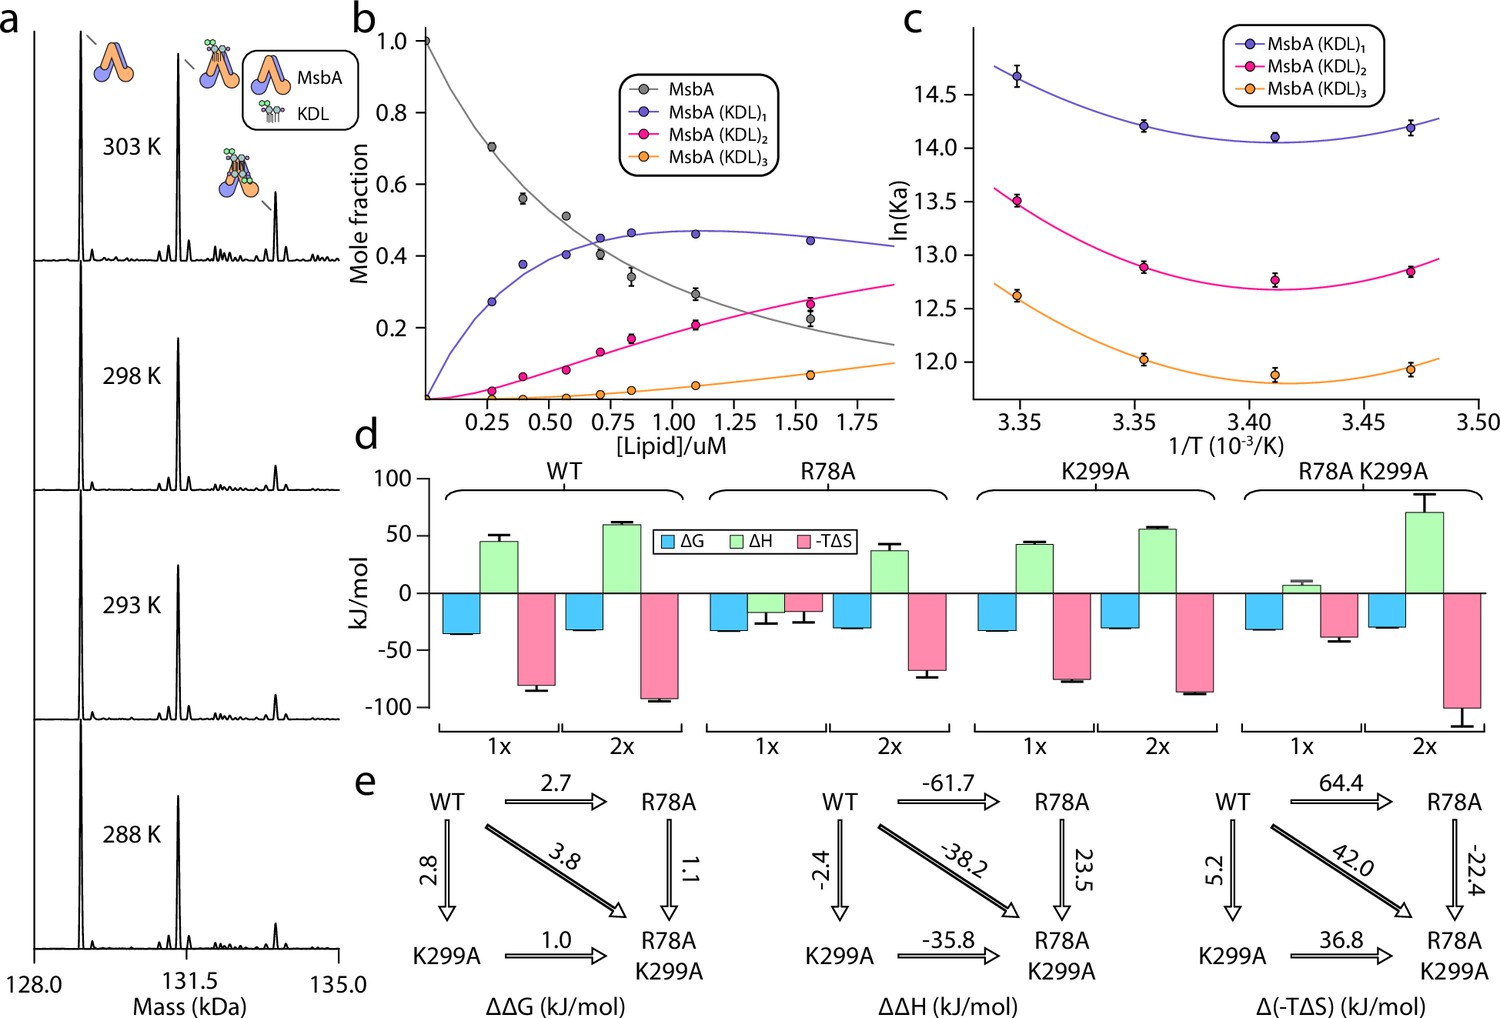
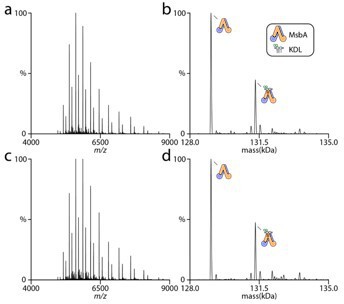
(a) Representative deconvoluted native mass spectra of 0.39 μM wild-type MsbA in C10E5 and in the presence of 0.6 μM KDL recorded at different solution temperatures. (b) Plot of mole fraction of MsbA (KDL)0-3 determined from titration of KDL (dots) at 298 K and resulting fit from a sequential ligand binding model (solid line, R2=0.99). (c) van’ t Hoff plot for MsbA(KDL)1-3 and resulting fit of a nonlinear van’ t Hoff equation. (d) Thermodynamics for MsbA and mutants (MsbAR78A, MsbAK299A and MsbAR78A,K299A) binding KDL at 298 K. (e) Mutant cycles for MsbA and mutants with (from left to right) ΔΔG (mutant minus wild-type), ΔΔH and Δ(-TΔS) values indicated over the respective arrows. Shown are values at 298 K. Reported are the average and standard deviation from repeated measurements (n = 3).
Figure 2—figure supplement 1
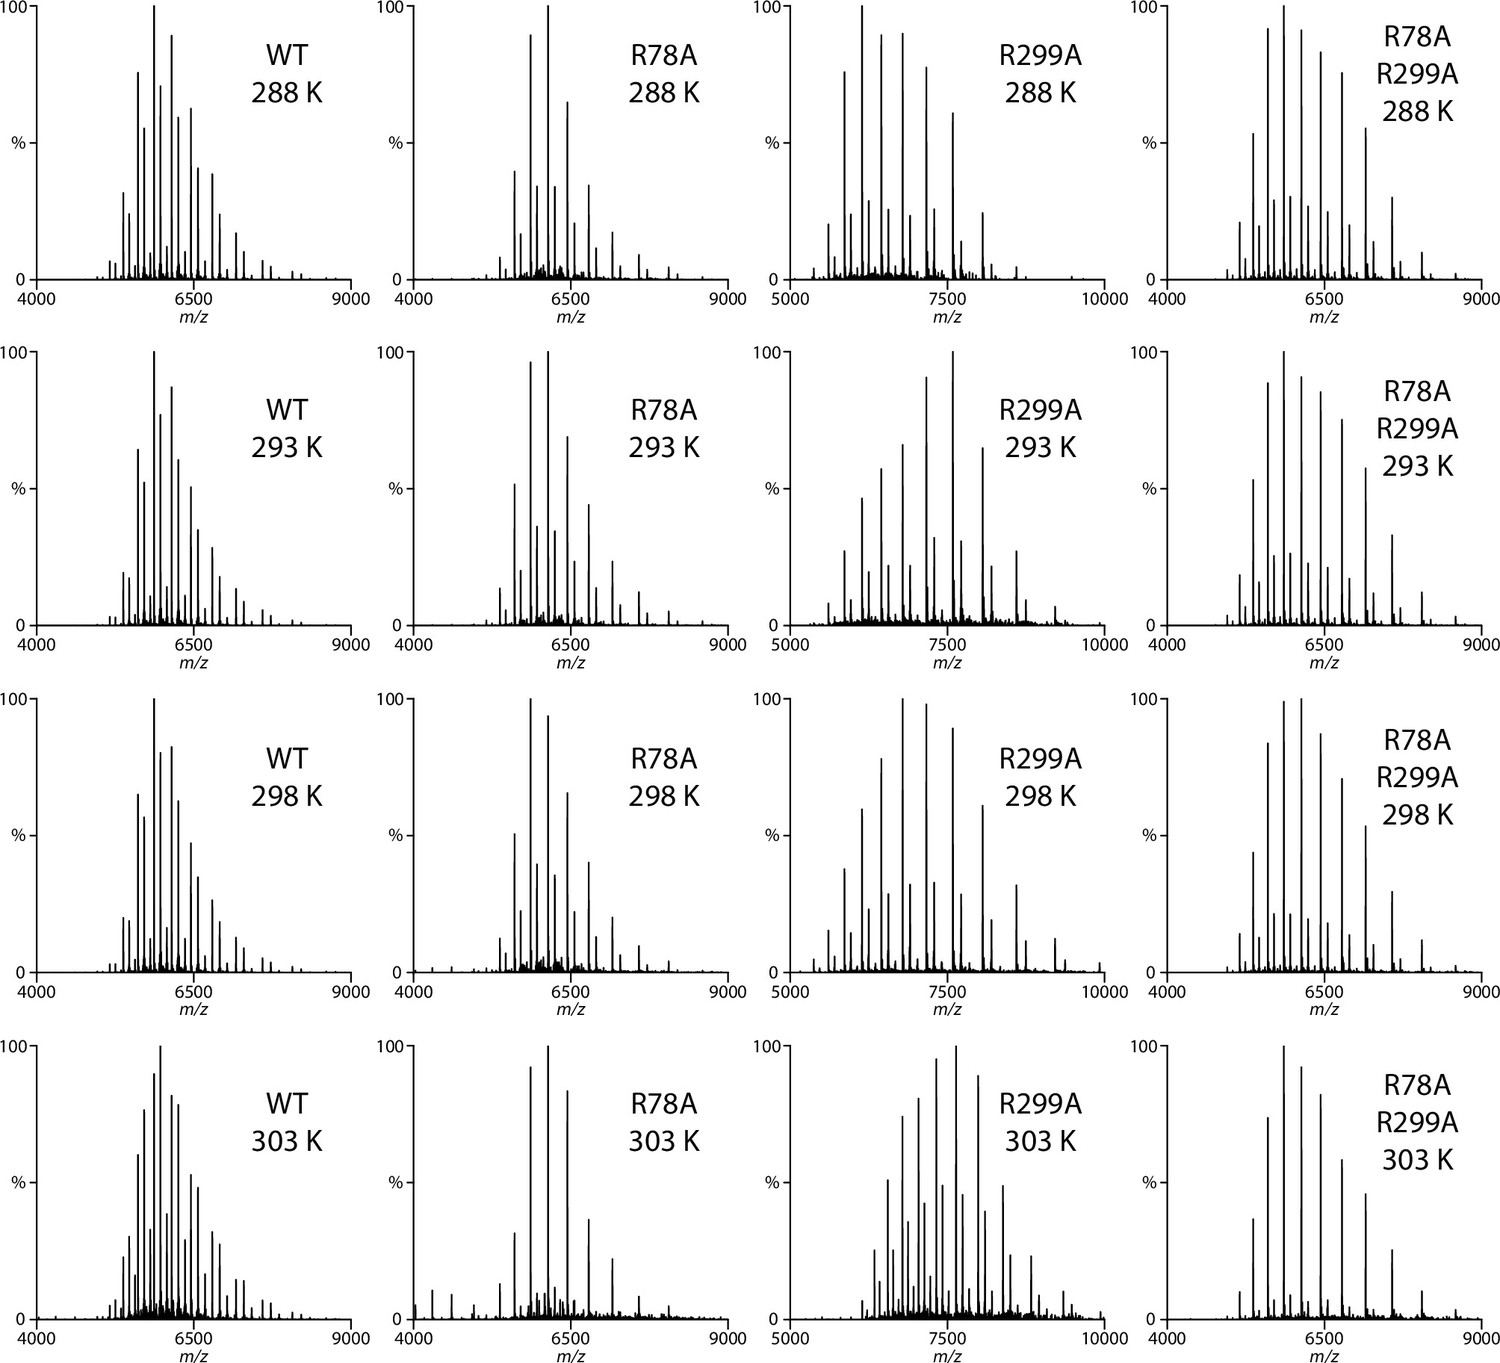
Representative native mass spectra of wild-type and mutant MsbA in the presence of 0.8 μM KDL.
The temperature is provided in the inset. The concentration of MsbA, MsbAR78A, MsbAR299A and MsbAR78A,K299A is 0.39, 0.36, 0.33, and 0.83 μM, respectively.
Figure 2—figure supplement 2

Determination of equilibrium dissociation constants (KD) for KDL binding wild-type and mutant MsbA.
Shown are plots of the mole fraction for MsbA and bound to different number of KDL determined from a titration series (dots) and resulting fit from a sequential ligand-binding model (solid lines). The different temperatures and MsbA mutants are labelled. Reported are the mean and standard deviation (n=3).
Figure 2—figure supplement 3

Determination of thermodynamic parameters for KDL binding wild-type and mutant MsbA.
van’ t Hoff plots for the transporter binding KDL (dots) and resulting fit from nonlinear Van’t Hoff equation (solid lines). Reference temperature (T0) is 298 K Reported are the mean and standard deviation (n=3).
Figure 3 with 6 supplements
Triple mutant cycle analysis of the exterior LPS binding site of MsbA.
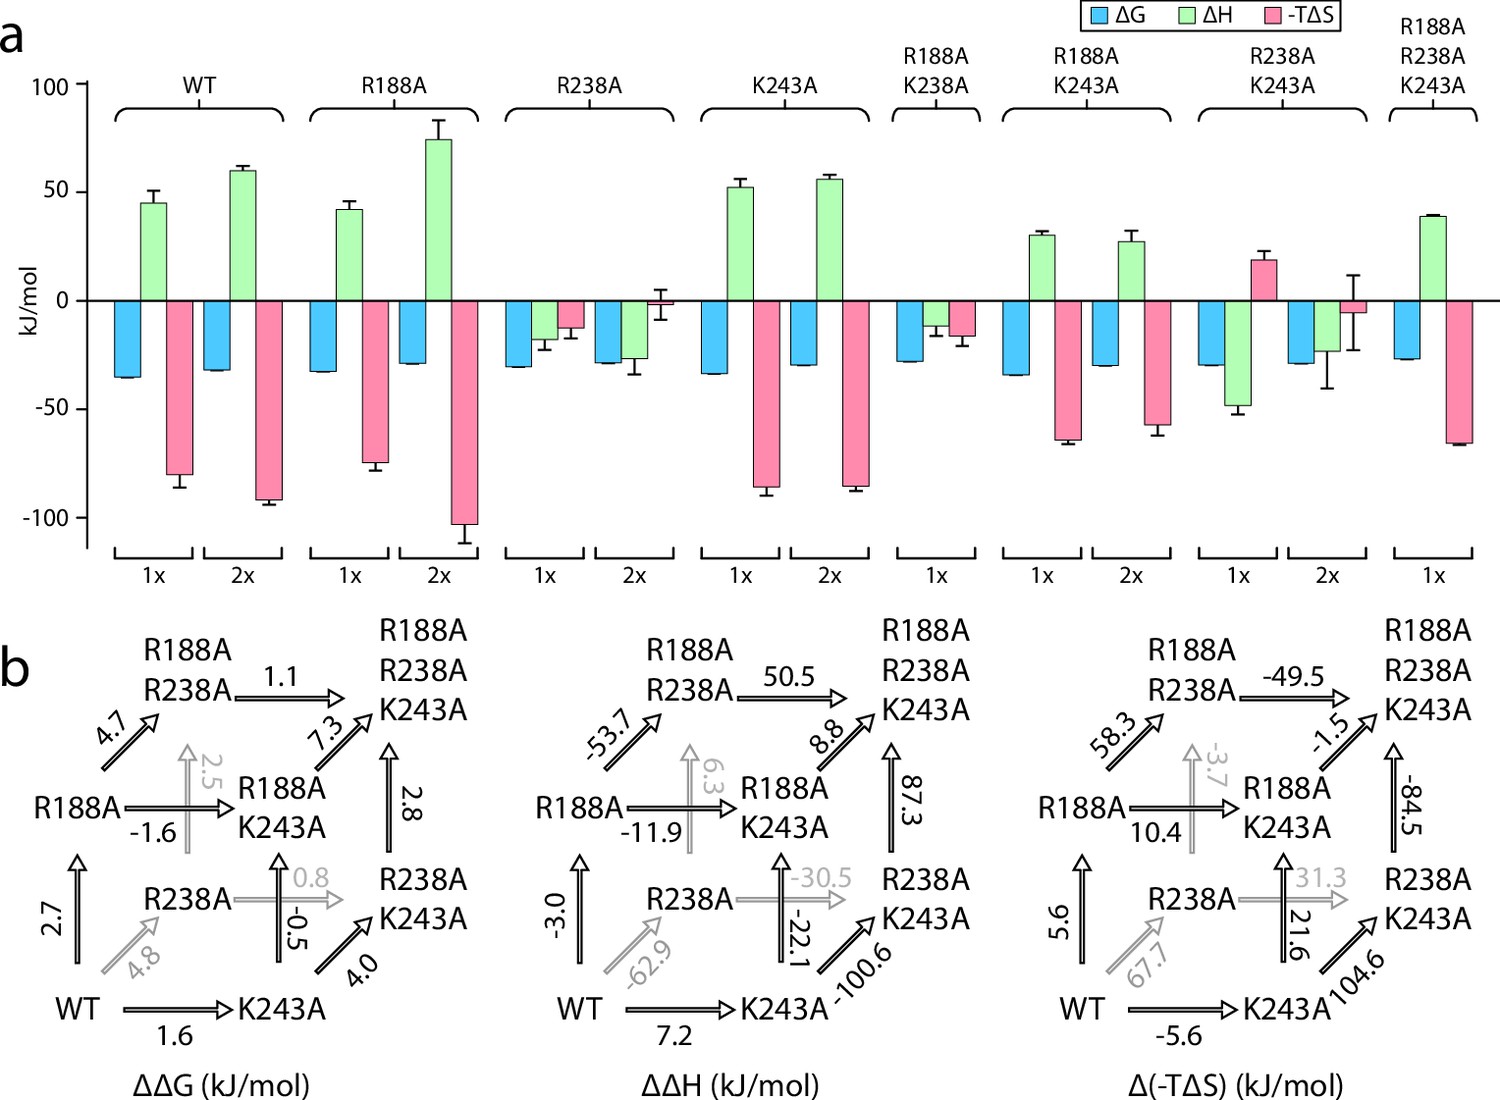
(a) Thermodynamics for MsbA and mutants (MsbAR188A, MsbAR238A, MsbAK243A, MsbAR188A,R243A, MsbAR188A,K243A, MsbAR238A,R243A, and MsbAR188A,R238A,K299A) binding KDL at 298 K. (b) Triple mutant cycles for MsbA and mutants with (from left to right) ΔΔG, ΔΔH and Δ(-TΔS) values indicated over the respective arrows. Shown are values at 298 K. Reported are the average and standard deviation from repeated measurements (n = 3).
Figure 3—figure supplement 1
Representative native mass spectra MsbA mutants in the presence of 0.8 μM KDL.
The concentration of MsbAR188A, MsbAR238A, MsbAK243A and MsbAR188A,K299A is 0.56, 0.26, 0.50, and 0.78 μM, respectively. The temperature is provided in the inset.
Figure 3—figure supplement 2
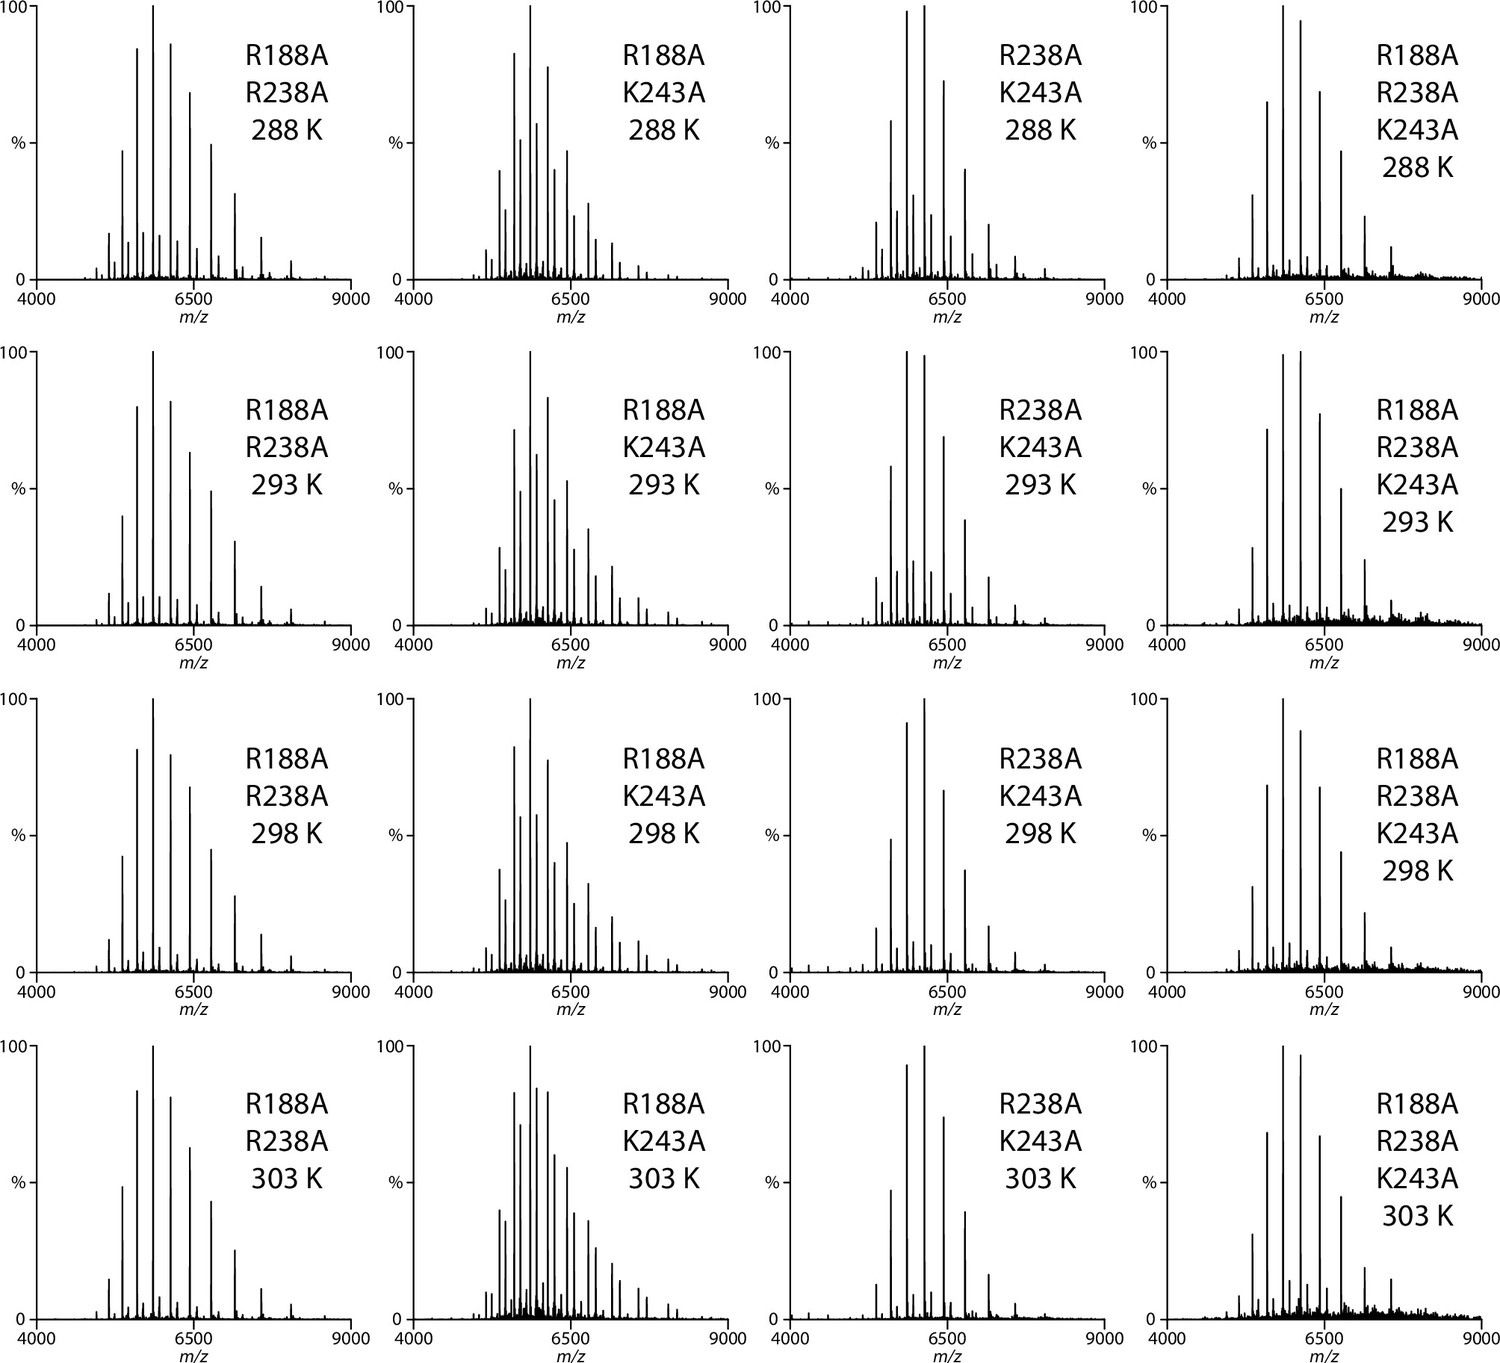
Representative native mass spectra MsbA double mutants in the presence of 0.8 μM KDL.
The concentration of MsbAR188A,R238A, MsbAR188A,K243A, MsbAR238A,K243A, and MsbAR188A,R238A,K243A is 0.58, 0.27, 0.39, and 0.17 μM, respectively. The temperature is provided in the inset.
Figure 3—figure supplement 3
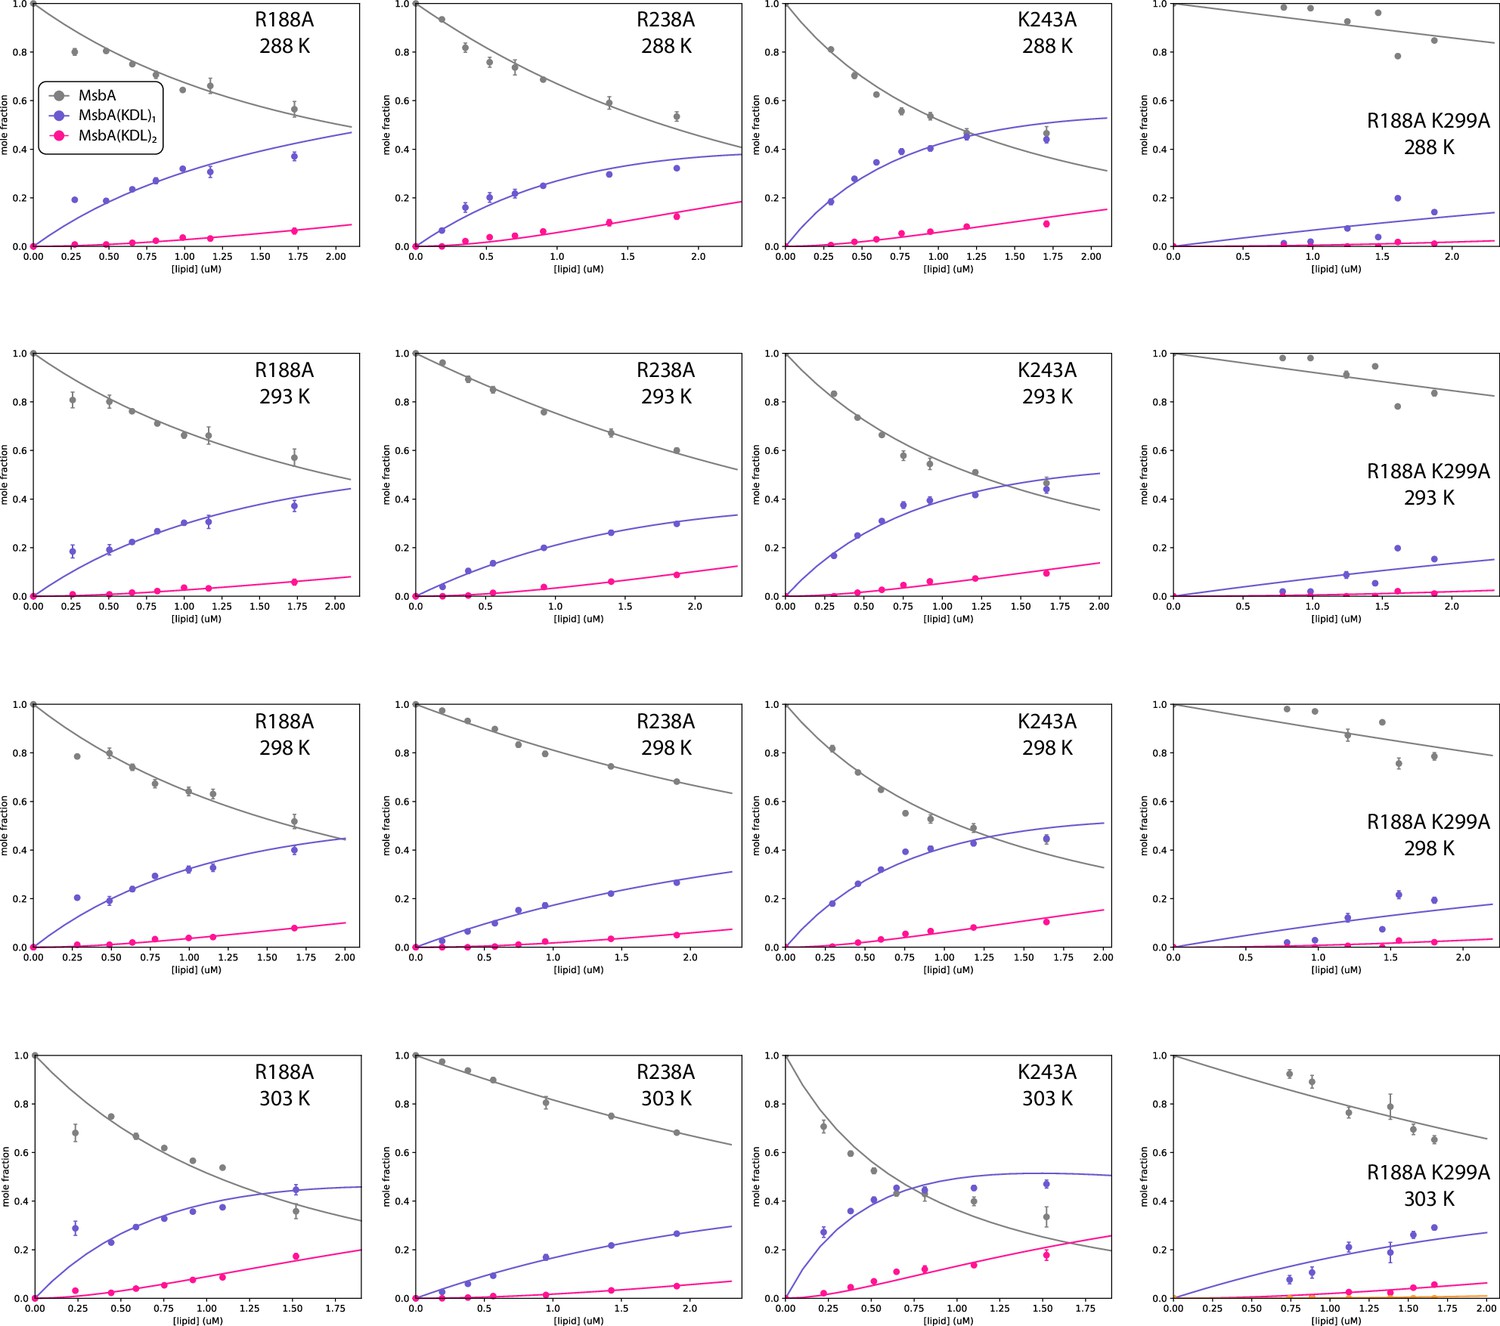
Determination of equilibrium dissociation constants (KD) for MsbA mutants binding KDL.
Shown as described in Figure 2—figure supplement 2.
Figure 3—figure supplement 4
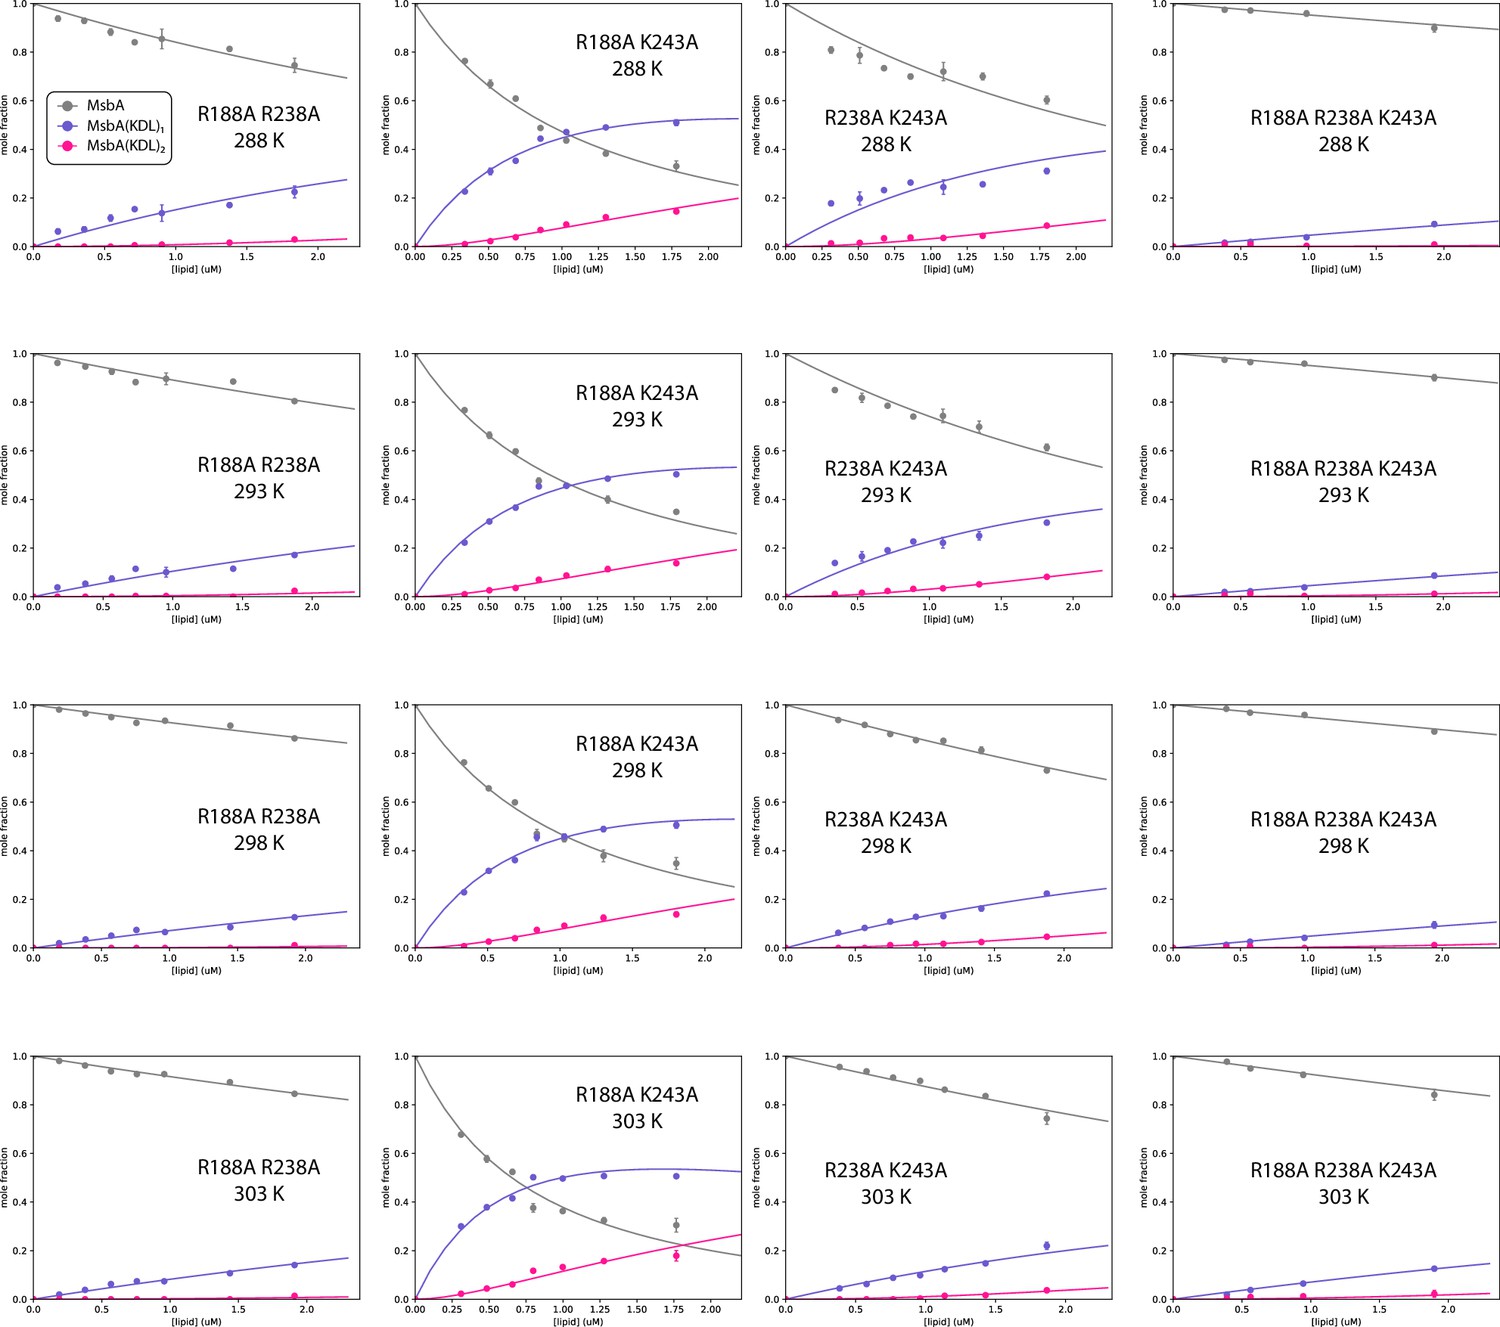
Determination of equilibrium dissociation constants (KD) for MsbA mutants binding KDL.
Shown as described in Figure 2—figure supplement 2.
Figure 3—figure supplement 5
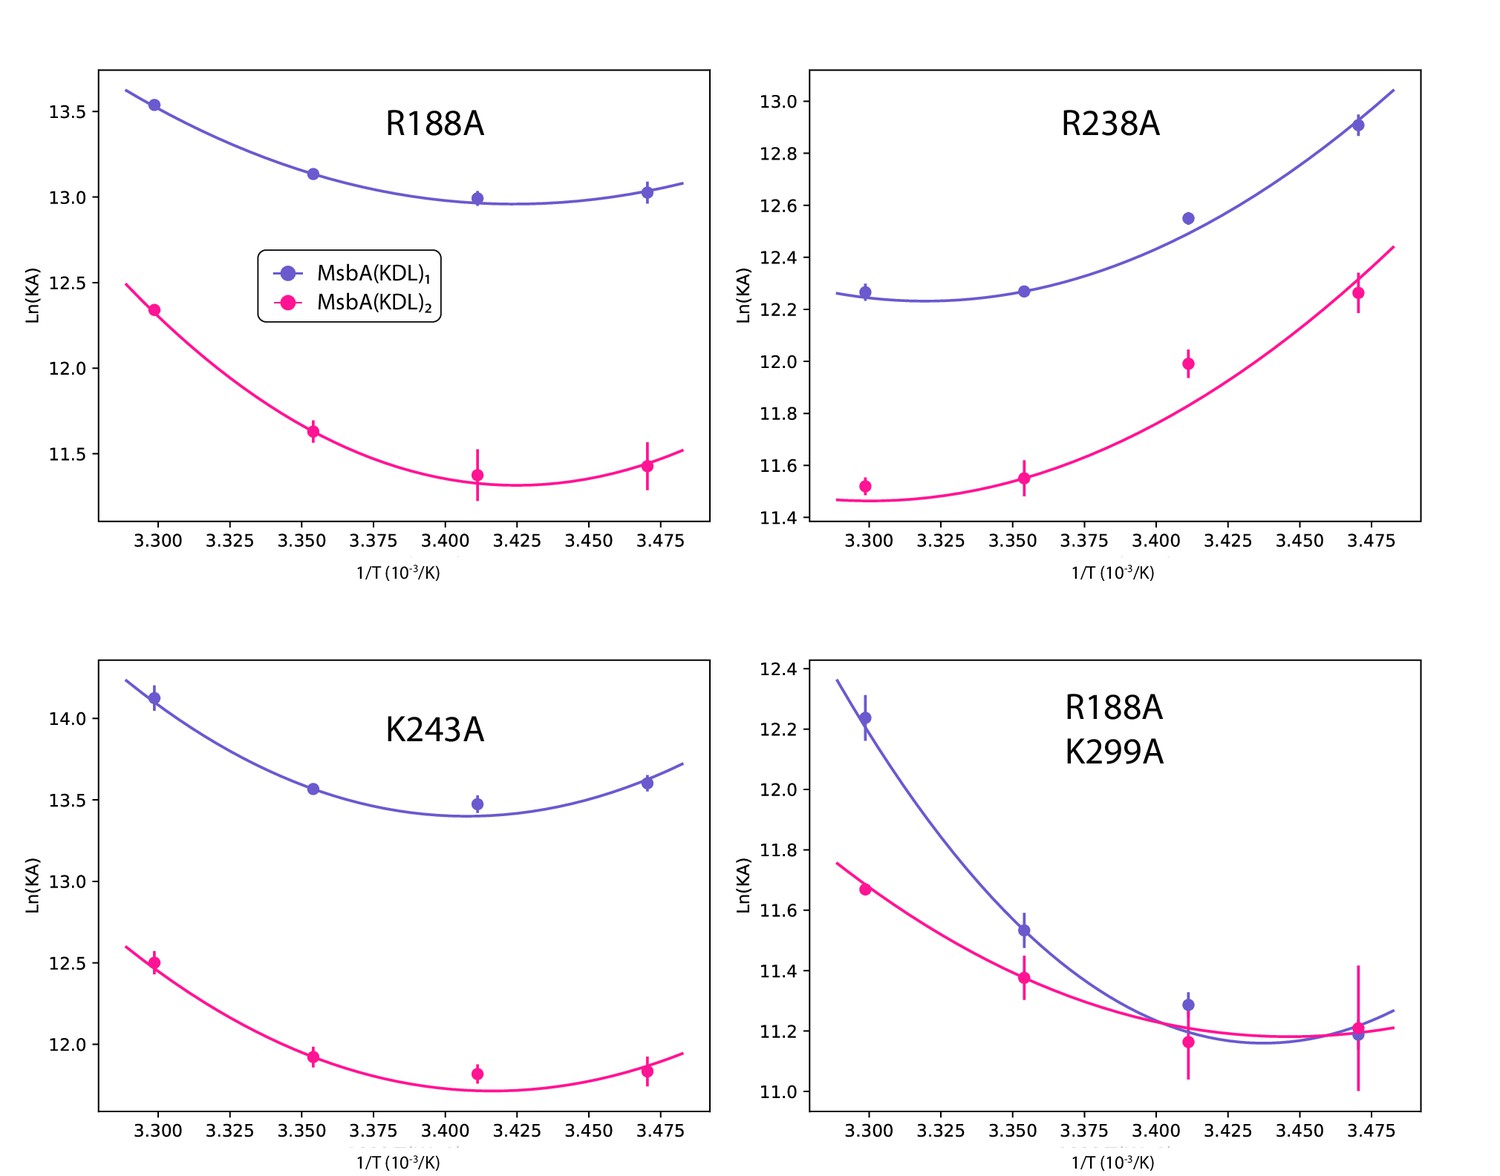
Determination of thermodynamic parameters for KDL binding wild-type and mutant MsbA.
Shown as described in Figure 2—figure supplement 3.
Figure 3—figure supplement 6
Determination of thermodynamic parameters for KDL binding wild-type and mutant MsbA.
Shown as described in Figure 2—figure supplement 3.
Figure 4
Mutant cycle of MsbA residues located within the interior and exterior LOS binding sites.
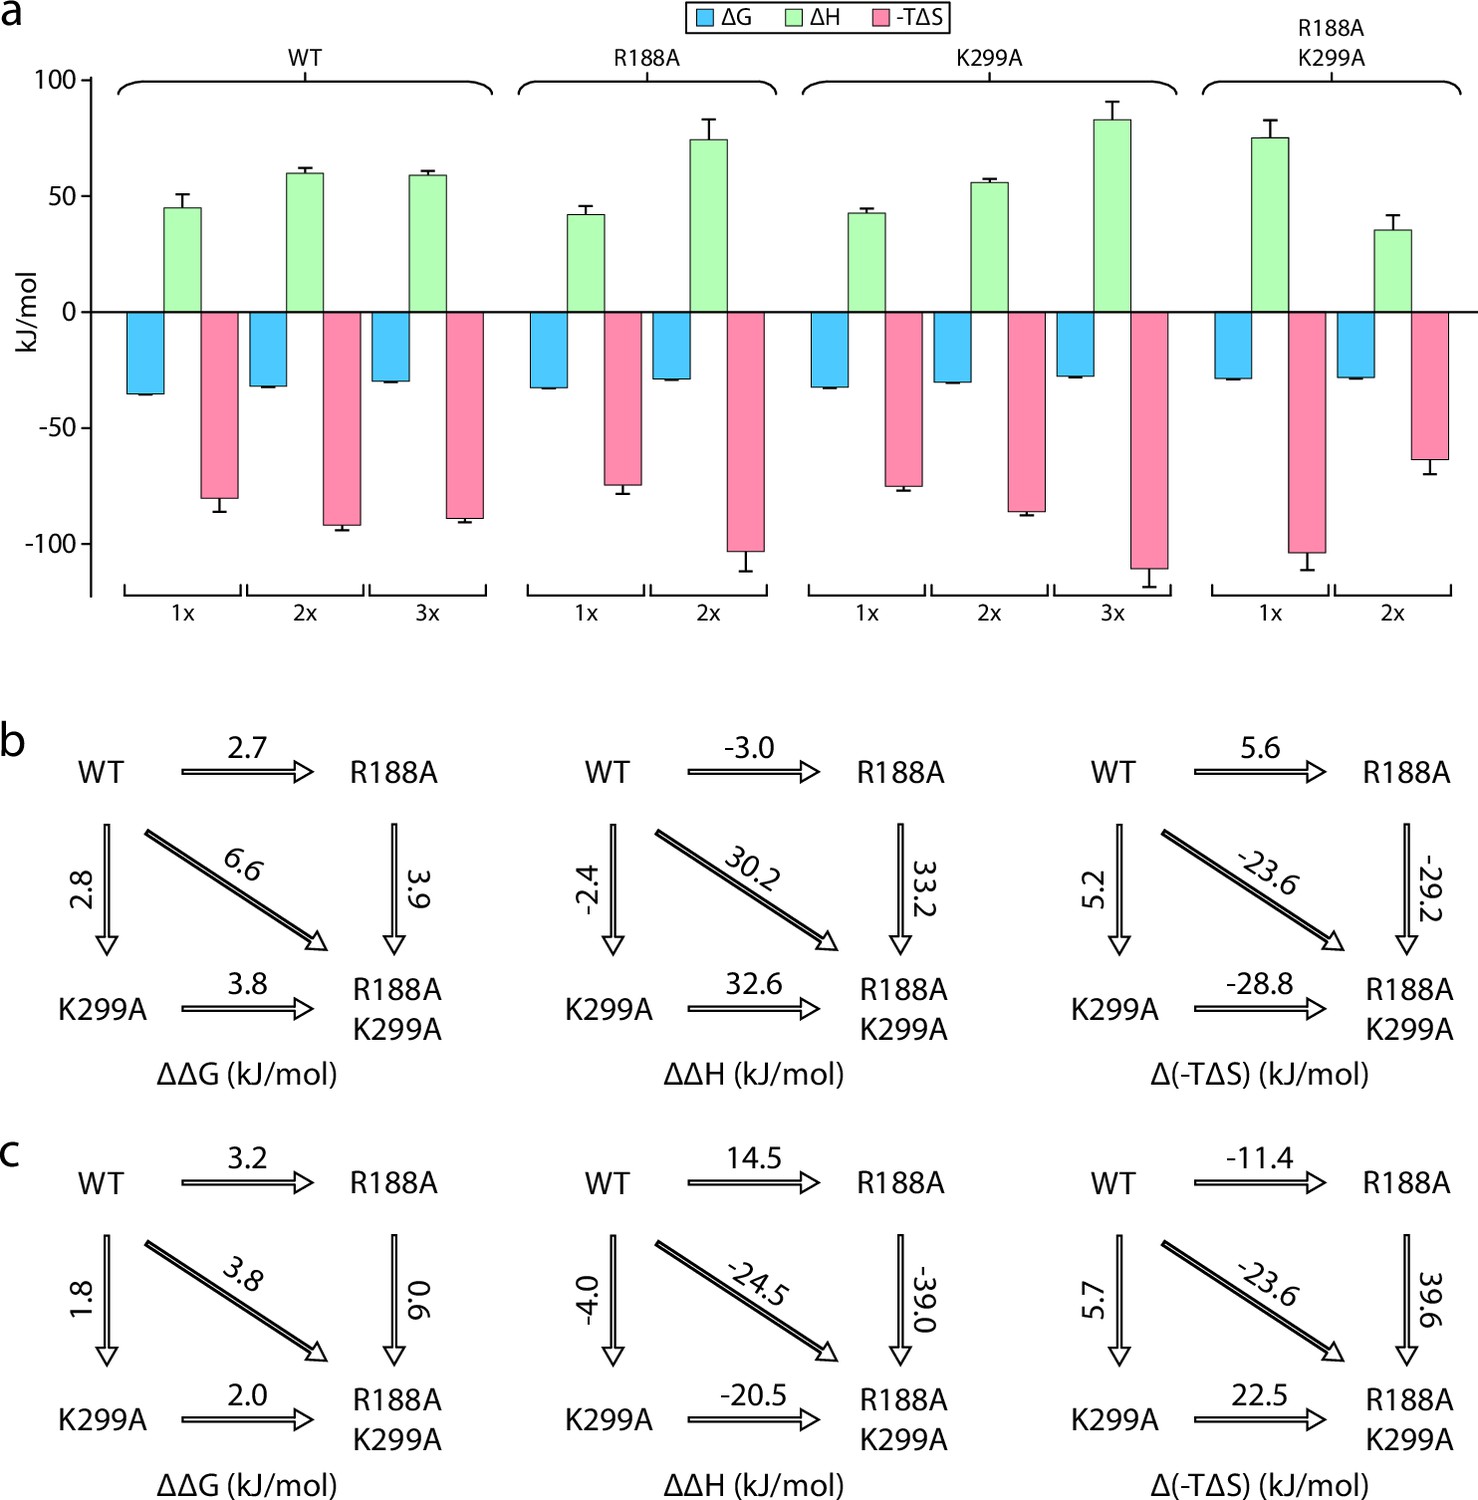
(a) Thermodynamic signatures for MsbA and mutants binding KDL at 298 K. (b–c) Double mutant cycle analysis for R188 and K299. Shown are results for the first (panel b) and second (panel c) KDL binding to MsbA. Shown from left to right is ΔΔG, ΔΔH and Δ(-TΔS) and the values indicated over the respective arrows at 298 K. Reported are the average and standard deviation from repeated measurements (n = 3).
Figure 5 with 6 supplements
Double mutant cycles reveal thermodynamic insight into KDL binding vanadate-trapped MsbA.
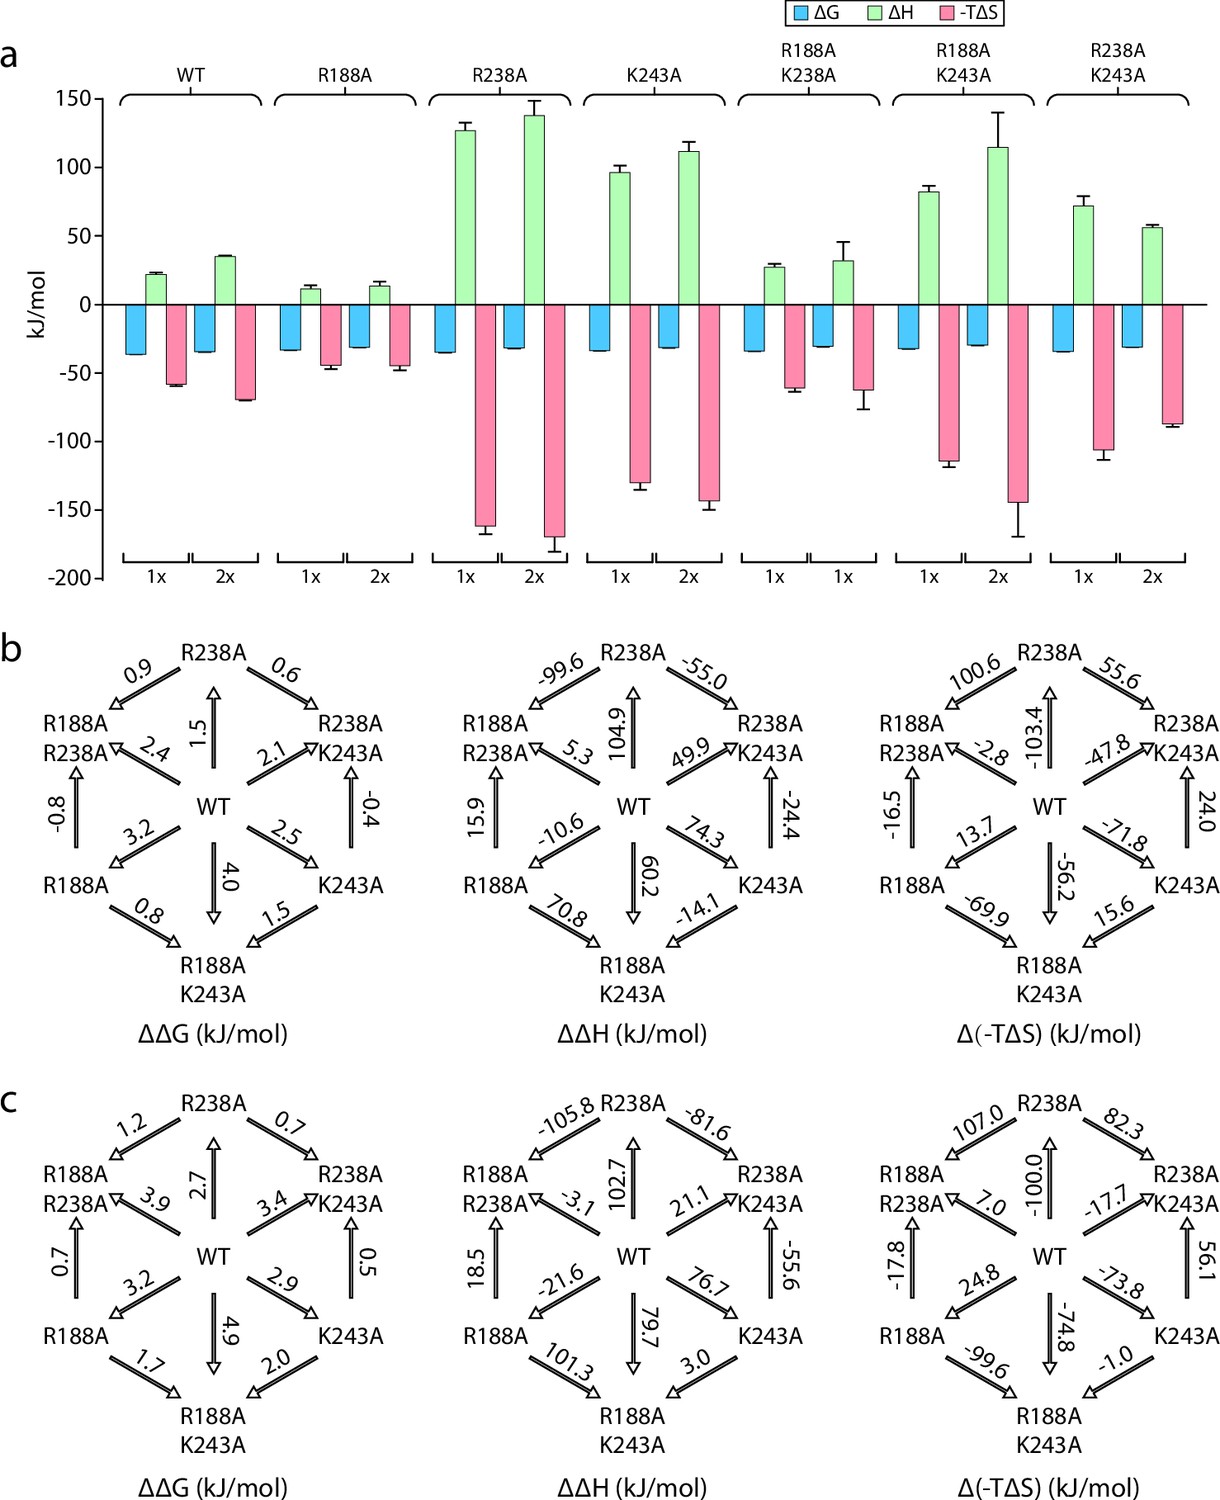
(a) Thermodynamic signatures for MsbA and mutants binding KDL at 298 K. (b–c) Double mutant cycle analysis for pairs of R188, R238, and K243 with a total of three combinations. Shown are results for the first (panel b) and second (panel c) KDL binding to MsbA trapped in an open, OF conformation with ADP and vanadate. Within each panel, ΔΔG, ΔΔH and Δ(-TΔS) are shown from left to right and their values at 298 K are indicated over the respective arrows. Reported are the average and standard deviation from repeated measurements (n = 3).
Figure 5—figure supplement 1
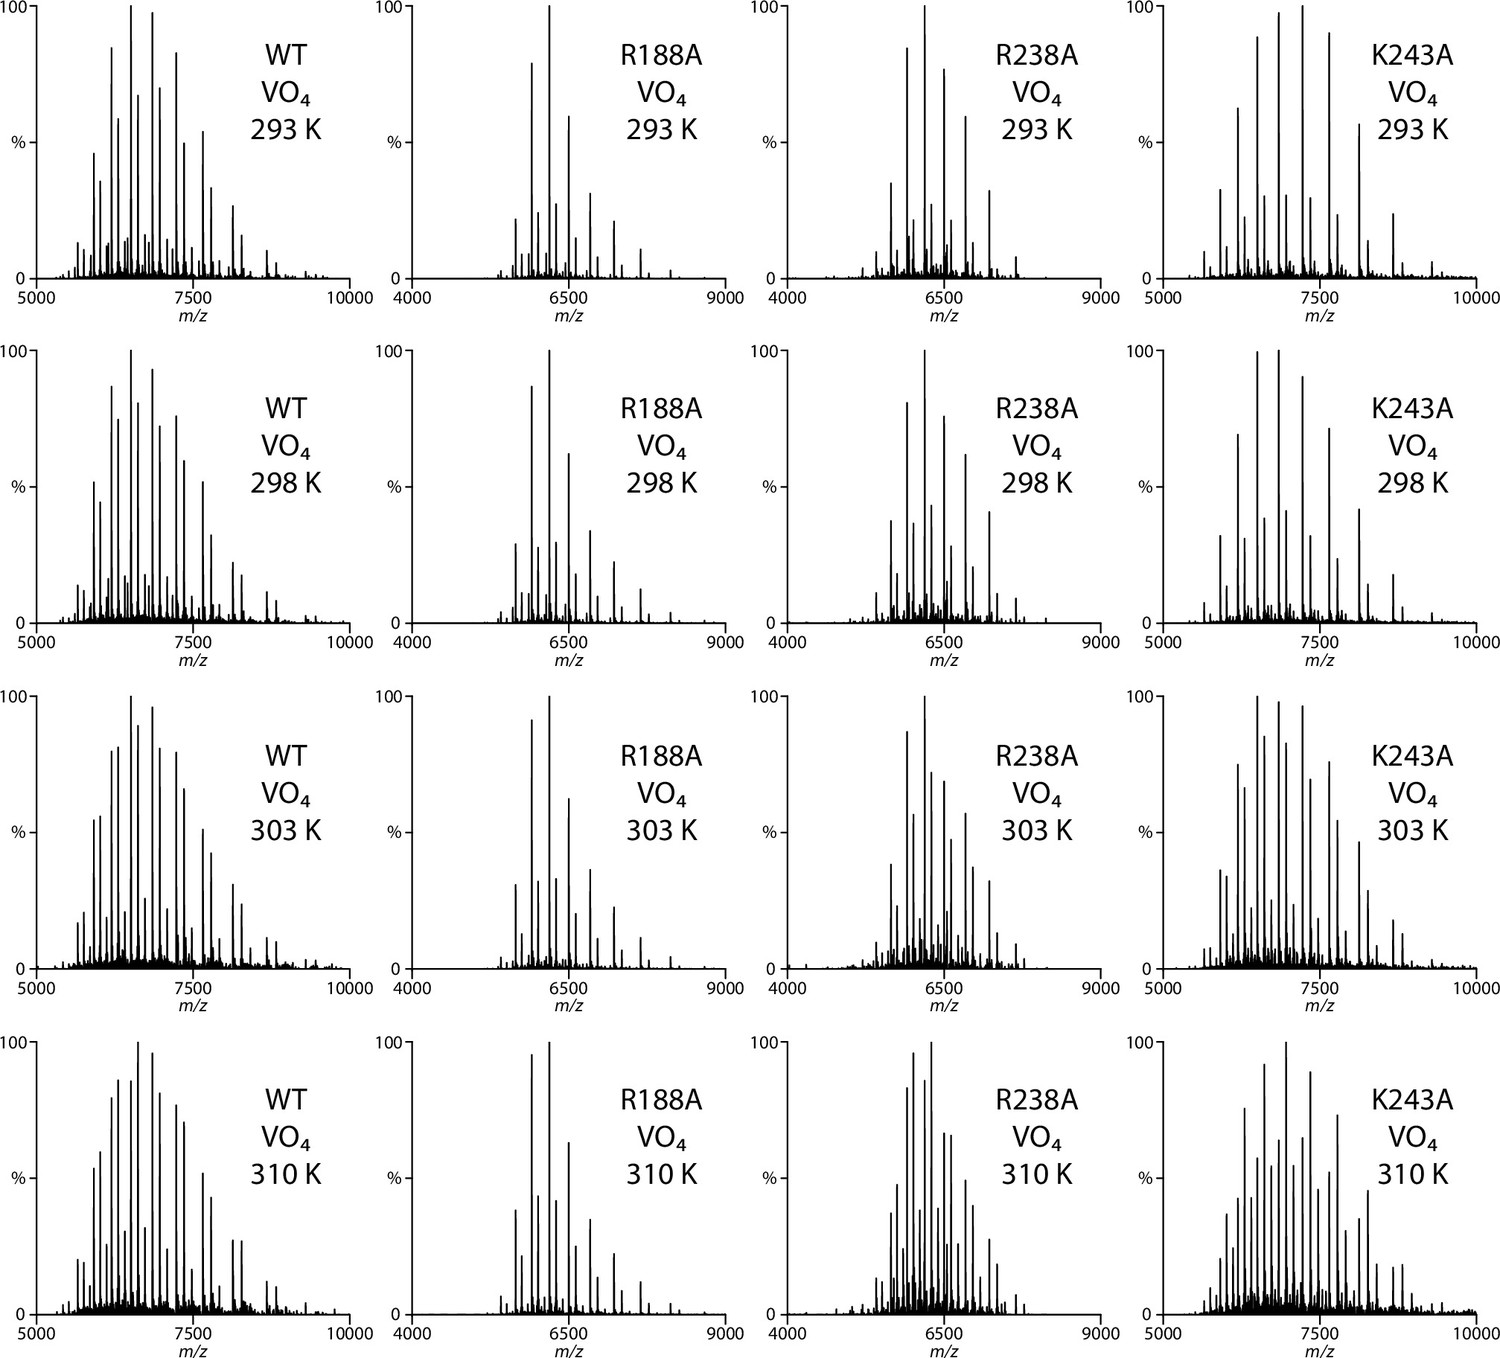
Representative native mass spectra wild-type and mutant MsbA trapped with vanadate and ADP in the presence of 0.8 μM KDL.
The concentration of MsbA, MsbAR188A, MsbAR238A, and MsbAK243A is 0.82, 0.86, 0.78, and 0.57 μM, respectively. The temperature in Celsius is provided in the inset.
Figure 5—figure supplement 2
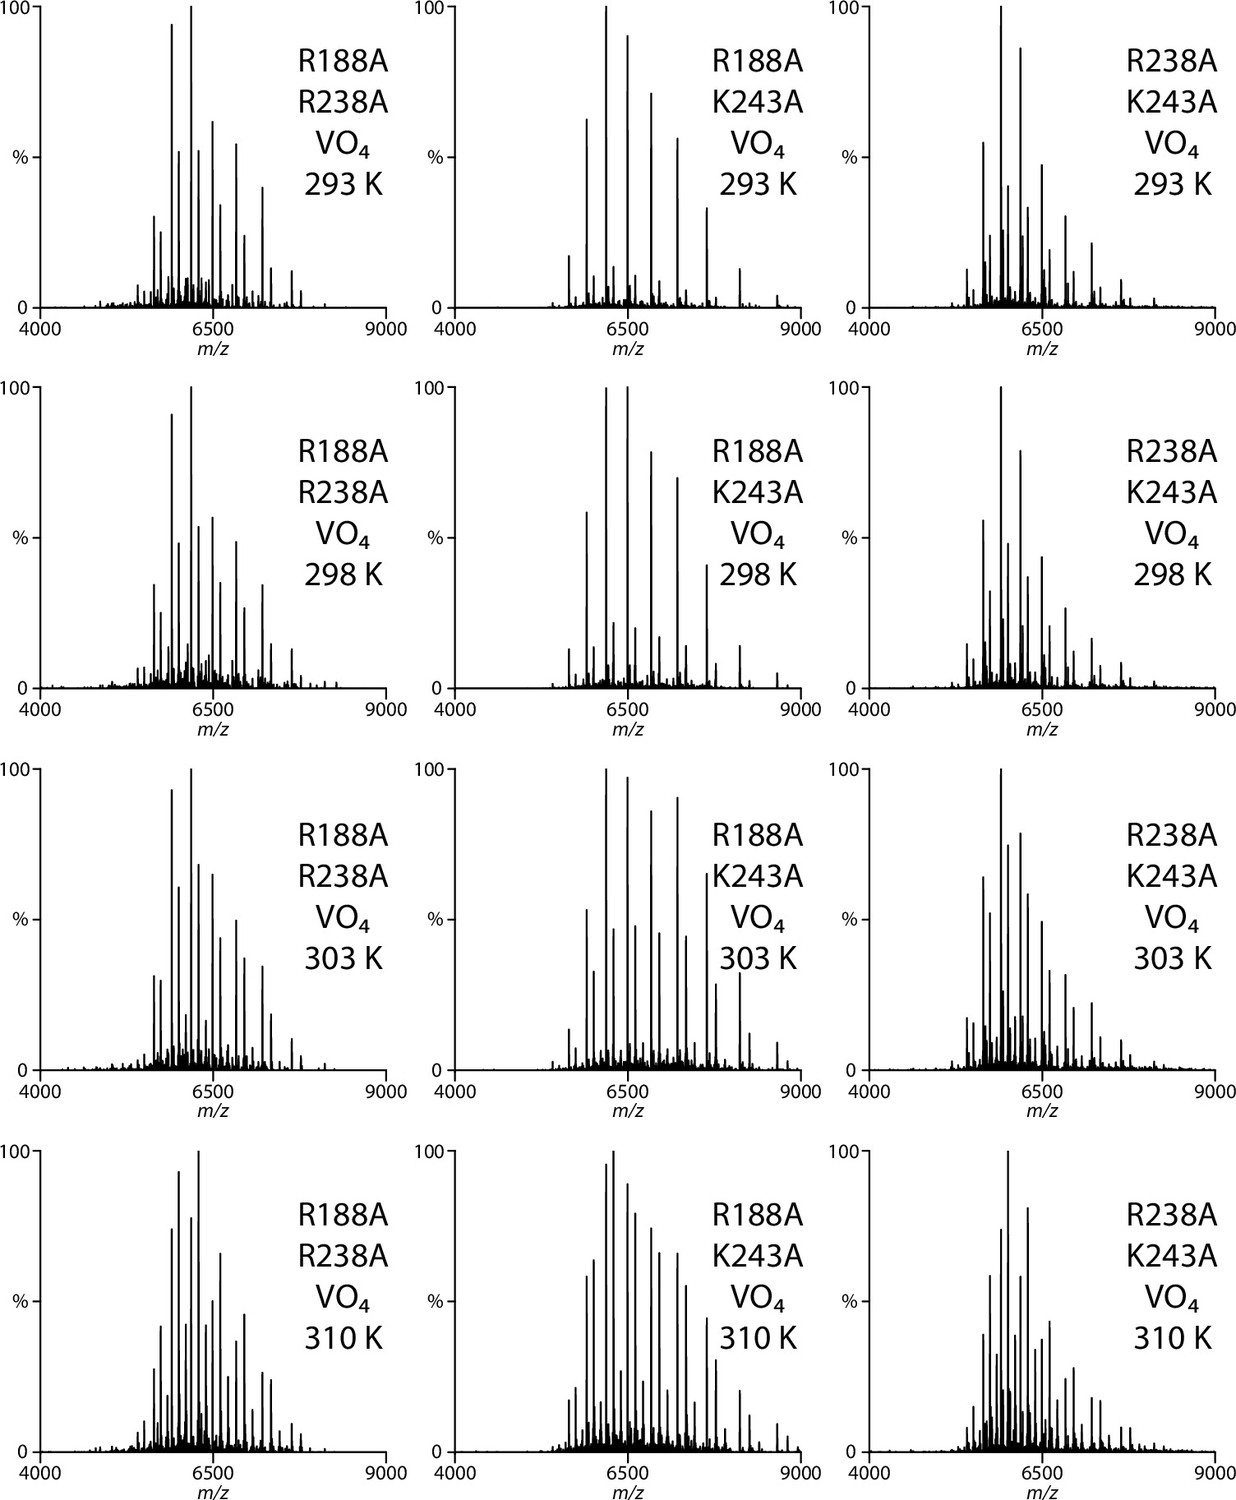
Representative native mass spectra MsbA double mutants trapped with vanadate and ADP in the presence of 0.8 μM KDL.
The concentration of MsbAR188A,R238A, MsbAR188A,R243A, and MsbAR238A,K243A is 0.44, 0.23, and 0.73 μM, respectively. The temperature is provided in the inset.
Figure 5—figure supplement 3
Determination of equilibrium dissociation constants (KD) for KDL binding wild-type and mutant MsbA trapped with ADP and vanadate.
Shown as described in Figure 2—figure supplement 2.
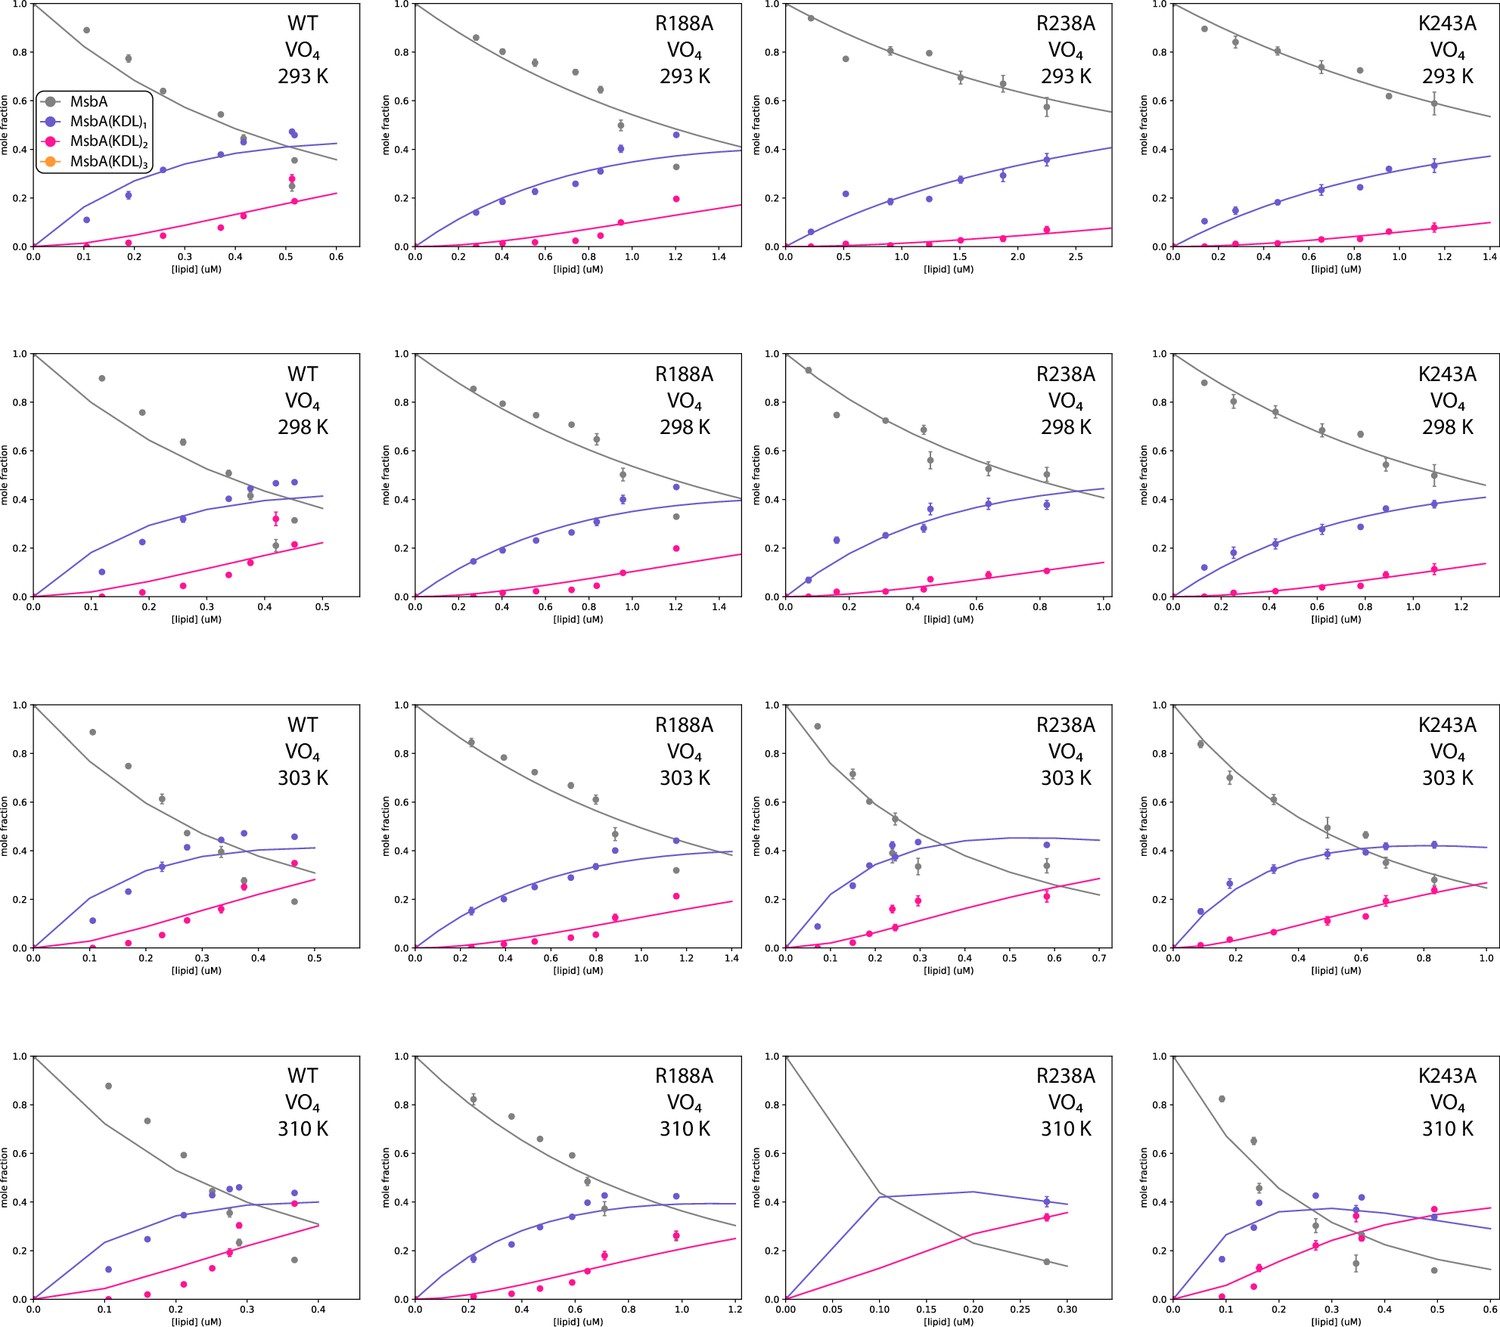
Figure 5—figure supplement 4

Determination of equilibrium dissociation constants (KD) for KDL binding MsbA double mutants trapped with ADP and vanadate.
Shown as described in Figure 2—figure supplement 2.
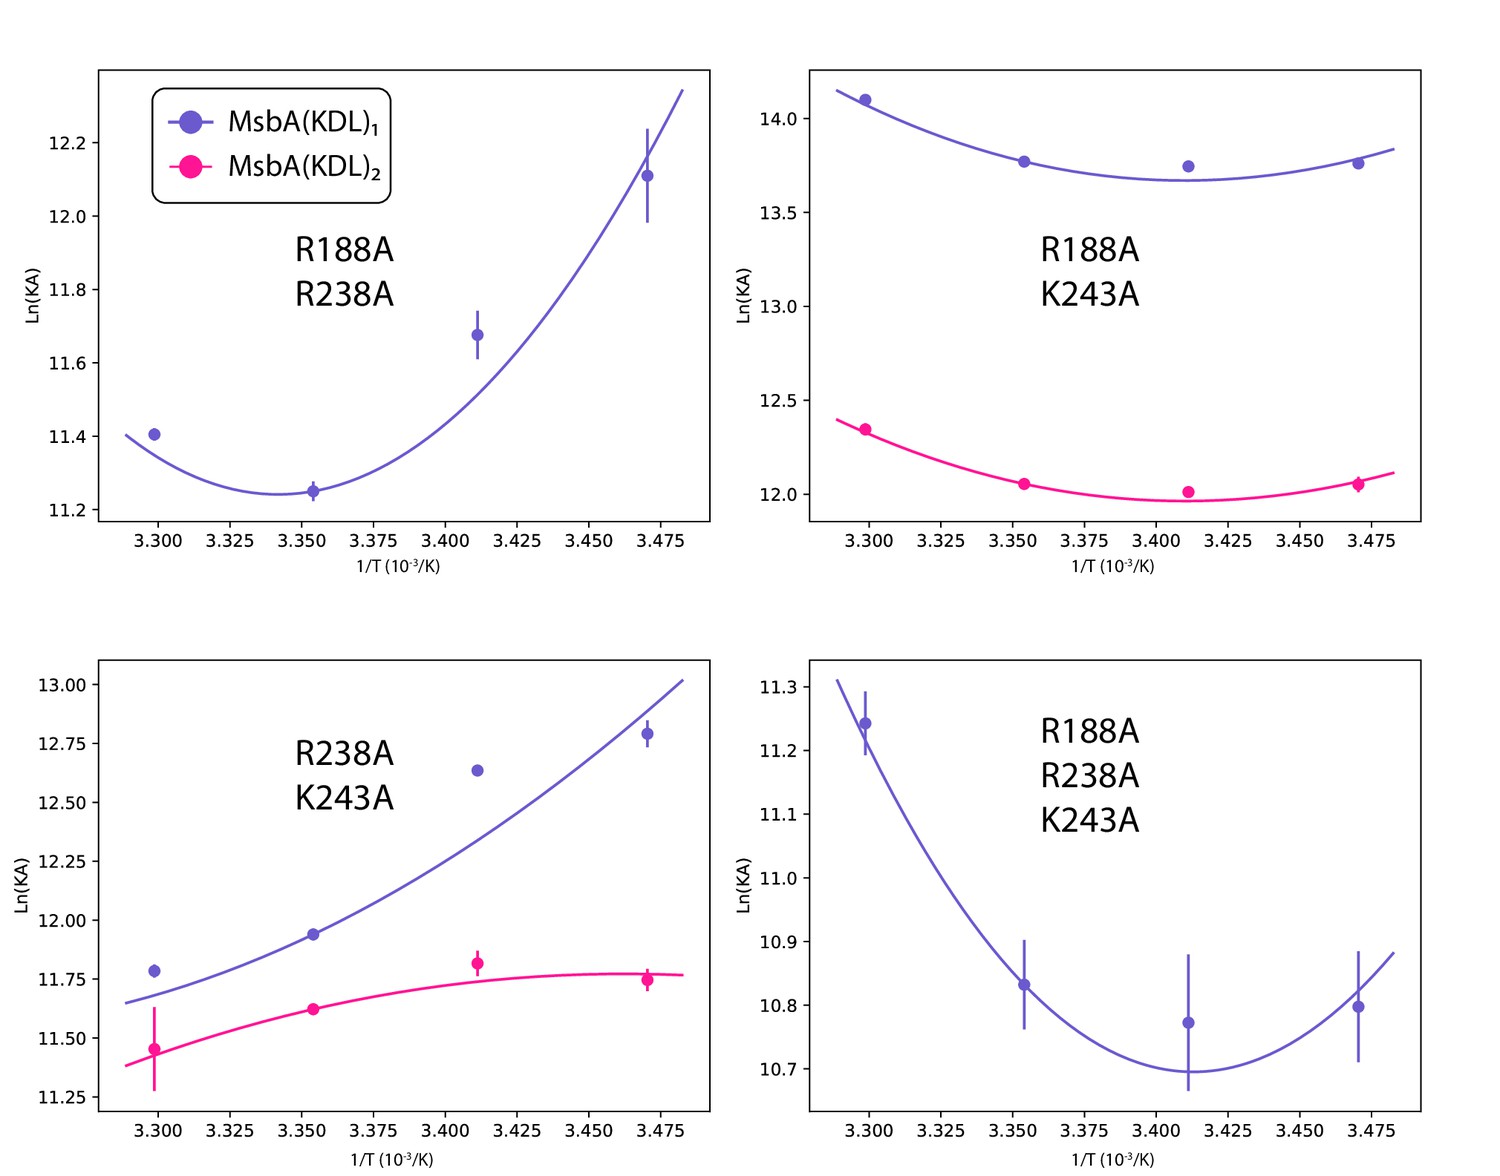
Figure 5—figure supplement 5
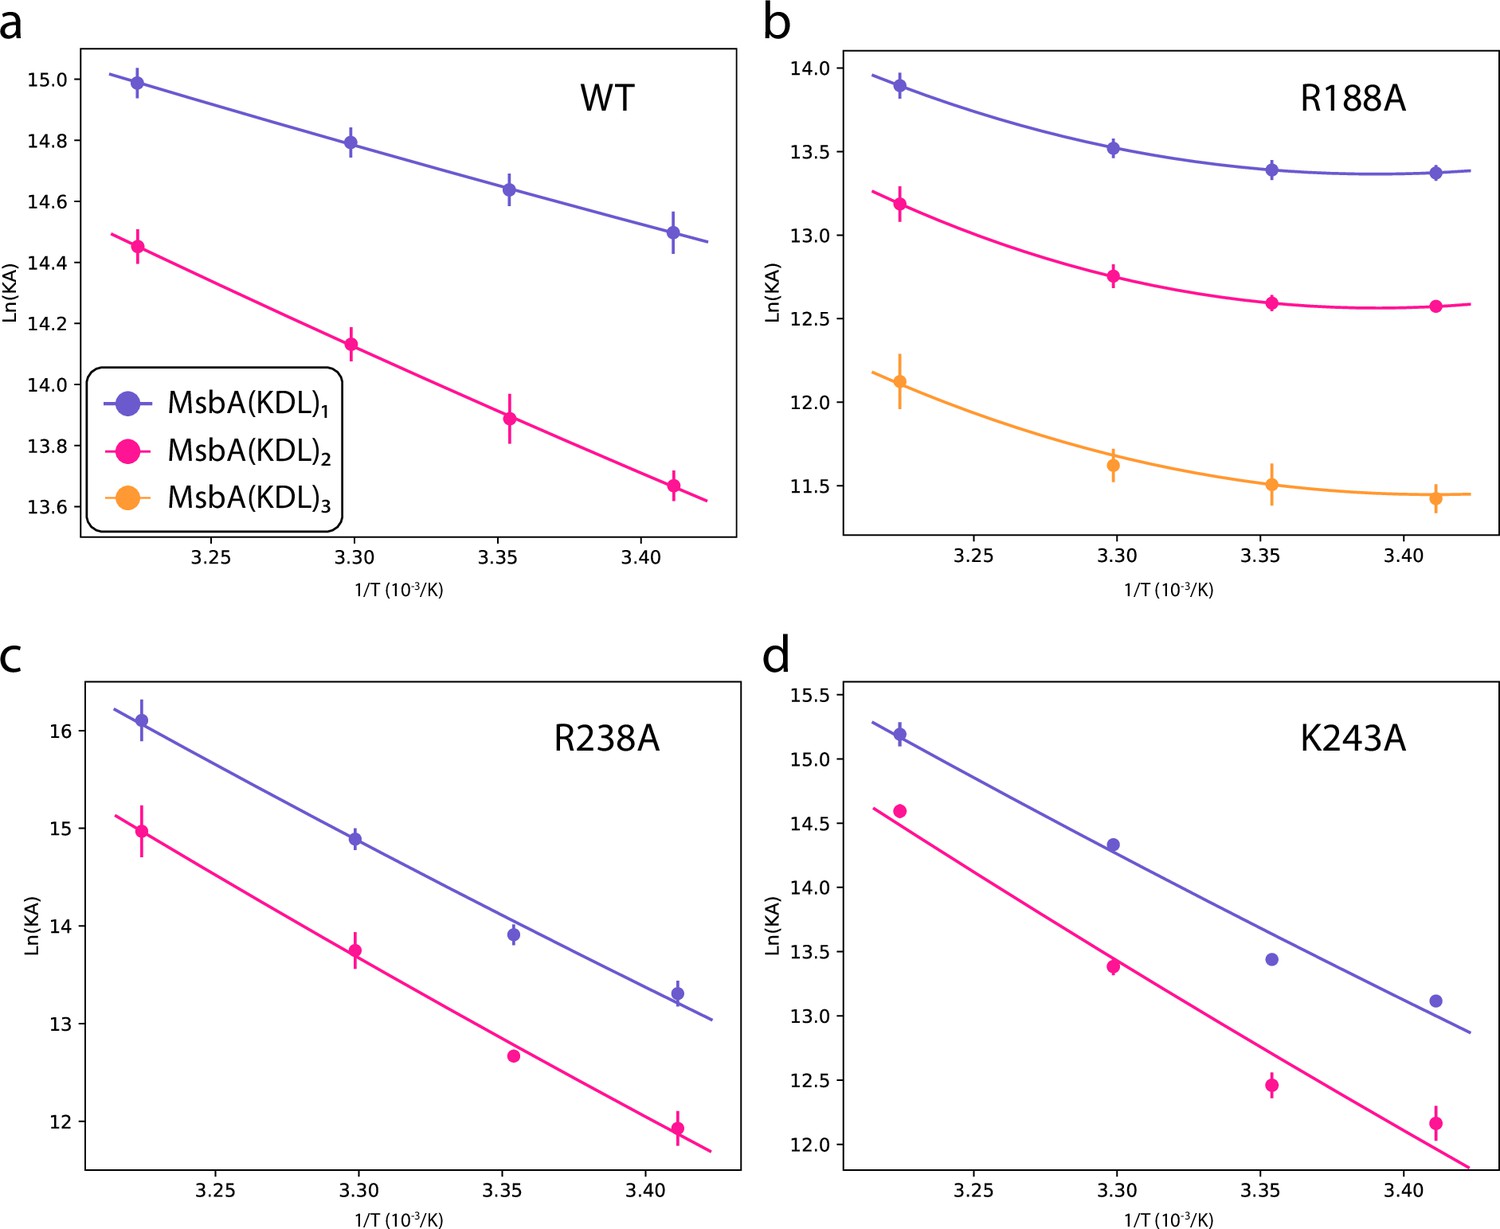
Determination of thermodynamic parameters for KDL binding wild-type and mutant MsbA trapped with ADP and vanadate.
Shown as described in Figure 2—figure supplement 3.
Figure 5—figure supplement 6

Determination of thermodynamic parameters for KDL binding MsbA double mutants trapped with ADP and vanadate.
Shown as described in Figure 2—figure supplement 3.
Figure 6
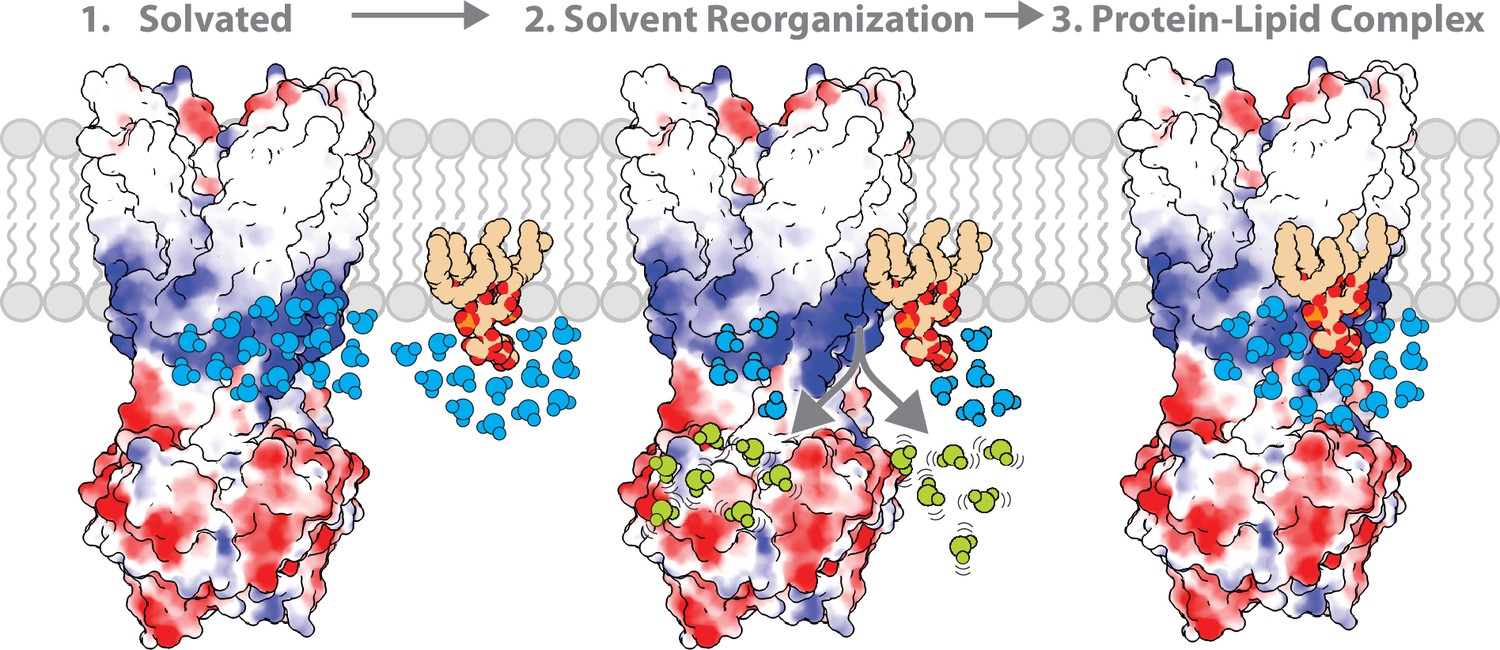
The role of solvent in contributing to the molecular recognition of membrane protein-lipid complexes.
The lipid headgroup and binding pocket (basic patch illustrated in blue) on the membrane protein are solvated. The ordered solvent (shown in light blue) is then displaced upon lipid binding the membrane protein leading to solvent reorganization. The displacement of ordered solvent (show in light green) contributes to favorable entropy. This process enables the formation of a high affinity, stable membrane protein-lipid complex.
Author response image 1

Author response image 2
Tables
Table 1
Equilibrium dissociation constants (KD) for KDL binding MsbA at various temperatures.
Reported are the mean and standard deviation (n=3).
| Temperature(K) | KD1(μM) | KD2(μM) | KD3(μM) | R2* | Χ2* | |
|---|---|---|---|---|---|---|
| WT | 288 | 0.69±0.06 | 2.64±0.16 | 6.60±0.54 | 0.99 | 0.01 |
| 293 | 0.75±0.04 | 2.86±0.23 | 6.94±0.56 | 0.99 | 0.01 | |
| 298 | 0.68±0.05 | 2.53±0.17 | 6.01±0.40 | 0.99 | 0.01 | |
| 303 | 0.43±0.05 | 1.36±0.10 | 3.30±0.23 | 0.96 | 0.06 | |
| R78A | 288 | 1.91±0.17 | 6.18±0.80 | 0.98 | 0.04 | |
| 293 | 1.87±0.18 | 6.18±0.37 | 0.98 | 0.05 | ||
| 298 | 2.00±0.20 | 5.23±0.47 | 0.98 | 0.04 | ||
| 303 | 7.68±0.47 | 5.72±0.21 | 1 | 0 | ||
| R188A | 288 | 2.21±0.17 | 11.01±1.95 | 0.99 | 0.03 | |
| 293 | 2.28±0.12 | 11.62±2.17 | 0.99 | 0.03 | ||
| 298 | 1.98±0.07 | 8.92±0.73 | 0.99 | 0.03 | ||
| 303 | 1.32±0.05 | 4.37±0.13 | 0.95 | 0.12 | ||
| R238A | 288 | 2.48±0.12 | 4.74±0.45 | 0.99 | 0.02 | |
| 293 | 3.55±0.10 | 6.21±0.40 | 1 | 0.01 | ||
| 298 | 4.70±0.07 | 9.66±0.82 | 1 | 0.01 | ||
| 303 | 4.71±0.20 | 9.94±0.40 | 1 | 0.02 | ||
| K243A | 288 | 1.24±0.07 | 7.28±0.78 | 0.99 | 0.03 | |
| 293 | 1.41±0.09 | 7.38±0.53 | 0.99 | 0.02 | ||
| 298 | 1.28±0.05 | 6.65±0.50 | 0.99 | 0.02 | ||
| 303 | 0.74±0.07 | 3.73±0.32 | 0.97 | 0.06 | ||
| K299A | 288 | 2.32±0.06 | 6.07±0.33 | 17.54±6.77 | 1 | 0.01 |
| 293 | 2.35±0.07 | 5.75±0.07 | 16.03±3.18 | 0.99 | 0.02 | |
| 298 | 2.12±0.09 | 5.07±0.12 | 14.01±1.59 | 0.99 | 0.02 | |
| 303 | 1.38±0.01 | 2.91±0.02 | 5.91±0.55 | 0.97 | 0.05 | |
| R78A K299A | 288 | 2.56±0.17 | 7.77±0.11 | 0.98 | 0.06 | |
| 293 | 3.08±0.13 | 8.92±0.39 | 0.99 | 0.03 | ||
| 298 | 3.17±0.17 | 6.78±0.82 | 0.99 | 0.02 | ||
| 303 | 6.91±0.66 | 11.96±2.83 | 0.99 | 0.03 | ||
| R188A R238A | 288 | 5.55±0.87 | 0.99 | 0.02 | ||
| 293 | 8.51±0.67 | 1 | 0.01 | |||
| 298 | 13.01±0.43 | 1 | 0 | |||
| 303 | 11.14±0.23 | 1 | 0 | |||
| R188A K243A | 288 | 1.06±0.02 | 5.84±0.29 | 0.99 | 0.01 | |
| 293 | 1.07±0.02 | 6.07±0.13 | 0.99 | 0.01 | ||
| 298 | 1.05±0.02 | 5.82±0.06 | 0.99 | 0.02 | ||
| 303 | 0.75±0.01 | 4.35±0.17 | 0.99 | 0.03 | ||
| R188A K299A | 288 | 13.86±0.85 | 13.83±3.23 | 0.99 | 0.04 | |
| 293 | 12.55±0.64 | 14.29±2.18 | 0.99 | 0.03 | ||
| 298 | 9.82±0.70 | 11.50±1.04 | 0.98 | 0.05 | ||
| 303 | 4.86±0.44 | 8.56±0.20 | 0.99 | 0.04 | ||
| R238A K243A | 288 | 2.79±0.20 | 7.93±0.47 | 0.98 | 0.06 | |
| 293 | 3.26±0.09 | 7.39±0.50 | 0.99 | 0.03 | ||
| 298 | 6.53±0.2 | 8.97±0.15 | 1 | 0 | ||
| 303 | 7.63±0.26 | 10.78±2.19 | 1 | 0.01 | ||
| R188A R238A K243A | 288 | 20.53±2.25 | 1 | 0 | ||
| 293 | 21.09±2.84 | 1 | 0 | |||
| 298 | 19.80±1.71 | 1 | 0 | |||
| 303 | 13.12±0.81 | 1 | 0 |
-
These values represent the replicates with the poorest fits.
Table 2
Thermodynamic signatures of KDL interacting with wild-type and mutant MsbA.
Reported are the mean with standard deviation (n=3), and the subscript denotes the nth KDL binding event.
| T(K) | ΔG1(kJ/mol) | ΔH1(kJ/mol) | -TΔS1(kJ/mol) | ΔCp1(kJ/mol/K) | ΔG2(kJ/mol) | ΔH2(kJ/mol) | -TΔS2(kJ/mol) | ΔCp2(kJ/mol/K) | ΔG3(kJ/mol) | ΔH3(kJ/mol) | -TΔS3(kJ/mol) | ΔCp3(kJ/mol/K) | |
|---|---|---|---|---|---|---|---|---|---|---|---|---|---|
| WT | 288 | –34.0±0.2 | –36.0±11.6 | 2.0±11.5 | 8.0±1.5 | –30.8±0.1 | –43.2±7.3 | 12.4±7.3 | 10.1±0.9 | –28.6±0.2 | –36.6±8.1 | 8.0±8.0 | 9.4±0.9 |
| 293 | –34.4±0.1 | 4.3±5.4 | –38.6±5.4 | 7.4±1.5 | –31.1±0.2 | 7.9±2.7 | –39.0±2.7 | 9.1±0.8 | –29.0±0.2 | 10.9±3.3 | –39.8±3.3 | 8.5±0.6 | |
| 298 | –35.2±0.2 | 45.0±5.8 | –80.2±5.9 | 8.9±1.4 | –32.0±0.2 | 59.9±2.3 | –91.8±2.2 | 11.7±1.2 | –29.8±0.2 | 59.1±1.8 | –88.9±1.7 | 10.7±1.5 | |
| 303 | –37.0±0.3 | 86.1±12.1 | –123.0±12.4 | 8.3±1.5 | –34.1±0.2 | 112.3±7.1 | –146.4±7.1 | 10.6±1.0 | –31.8±0.2 | 107.7±7.1 | –139.5±7.1 | 9.8±1.1 | |
| R78A | 288 | –31.6±0.2 | 9.6±4.5 | –41.2±4.7 | –2.6±1.1 | –28.8±0.3 | –13.0±19.1 | –15.8±18.8 | 5.0±1.7 | ||||
| 293 | –32.2±0.3 | –3.5±5.1 | –28.6±5.1 | –2.6±1.1 | –29.2±0.1 | 12.0±11.1 | –41.3±11.1 | 5.0±1.7 | |||||
| 298 | –32.5±0.2 | –16.7±9.6 | –15.9±9.6 | –2.6±1.1 | –30.2±0.2 | 37.1±5.9 | –67.2±6.1 | 5.0±1.7 | |||||
| R188A | 288 | –31.2±0.2 | –23.0±8.2 | –8.3±8.1 | 6.4±1.1 | –27.4±0.4 | –39.1±0.5 | 11.8±0.7 | 11.2±1.0 | ||||
| 293 | –31.7±0.1 | 9.4±3.6 | –41.1±3.5 | 6.1±1.2 | –27.7±0.5 | 17.4±4.6 | –45.1±4.2 | 10.7±1.7 | |||||
| 298 | –32.6±0.1 | 42.1±3.7 | –74.6±3.7 | 6.9±0.9 | –28.8±0.2 | 74.4±8.8 | –103.2±8.6 | 12.1±0.7 | |||||
| 303 | –34.1±0.1 | 74.9±8.3 | –109.0±8.3 | 6.6±1.0 | –31.1±0.1 | 131.6±12.8 | –162.7±12.8 | 11.5±0.7 | |||||
| R238A | 288 | –30.9±0.1 | –66.8±3.4 | 35.9±3.3 | 4.8±0.3 | –29.4±0.2 | –57.9±17.9 | 28.6±17.8 | 2.8±2.4 | ||||
| 293 | –30.6±0.1 | –42.6±4.0 | 12.1±3.9 | 4.1±0.3 | –29.2±0.2 | –43.2±6.5 | 13.9±6.5 | 0.9±2.5 | |||||
| 298 | –30.4±0.1 | –17.9±4.8 | –12.6±4.8 | 5.8±0.3 | –28.6±0.2 | –26.8±7.2 | –1.9±7.0 | 5.5±2.4 | |||||
| 303 | –30.9±0.1 | 7.2±5.8 | –38.1±5.9 | 5.1±0.3 | –29.0±0.1 | –9.5±18.6 | –19.5±18.7 | 3.7±2.4 | |||||
| K243A | 288 | –32.6±0.1 | –48.5±7.3 | 15.9±7.2 | 9.9±0.9 | –28.4±0.3 | –31.6±7.3 | 3.3±7.0 | 8.5±0.9 | ||||
| 293 | –32.8±0.2 | 1.5±3.5 | –34.4±3.5 | 9.1±0.8 | –28.8±0.2 | 11.7±3.1 | –40.5±3.0 | 7.3±1.2 | |||||
| 298 | –33.6±0.1 | 52.2±3.9 | –85.9±4.0 | 11.2±1.2 | –29.6±0.2 | 56.0±2.0 | –85.5±2.1 | 10.3±0.6 | |||||
| 303 | –35.6±0.2 | 103.3±8.0 | –138.9±8.2 | 10.3±1.0 | –31.5±0.2 | 100.8±5.6 | –132.3±5.8 | 9.1±0.8 | |||||
| K299A | 288 | –31.1±0.1 | –22.2±9.5 | –8.9±9.4 | 6.4±1.1 | –28.8±0.1 | –18.8±9.6 | –10.0±9.5 | 7.3±1.0 | –26.4±0.9 | –35.6±71.5 | 9.3±70.7 | 11.4±7.1 |
| 293 | –31.6±0.1 | 9.9±3.8 | –41.5±3.9 | 5.6±1.1 | –29.4±0.1 | 18.0±4.6 | –47.4±4.6 | 6.0±1.0 | –27.0±0.5 | 22.7±37.2 | –49.6±37.5 | 9.2±8.6 | |
| 298 | –32.4±0.1 | 42.7±2.1 | –75.1±1.9 | 7.4±1.2 | –30.2±0.1 | 55.9±1.7 | –86.1±1.6 | 9.0±1.1 | –27.7±0.3 | 82.9±7.8 | –110.6±7.9 | 14.7±5.1 | |
| 303 | –34.0±0.1 | 75.8±7.7 | –109.8±7.7 | 6.7±1.2 | –32.1±0.1 | 94.3±6.3 | –126.4±6.3 | 7.8±1.1 | –30.4±0.2 | 144.1±30.5 | –174.5±30.3 | 12.5±6.4 | |
| R78A K299A | 288 | –30.9±0.2 | –36.8±5.6 | 5.9±5.4 | 4.4±0.8 | –28.2±0.1 | –49.1±5.7 | 20.9±5.7 | 12.0±1.4 | ||||
| 293 | –30.9±0.1 | –15.0±2.8 | –16.0±2.8 | 4.4±0.8 | –28.3±0.1 | 10.7±9.6 | –39.1±9.7 | 12.0±1.4 | |||||
| 298 | –31.4±0.1 | 6.8±3.8 | –38.2±3.9 | 4.4±0.8 | –29.5±0.3 | 70.6±15.6 | –100.1±15.9 | 12.0±1.4 | |||||
| R188A R238A | 288 | –29.0±0.4 | –93.3±15.2 | 64.3±14.8 | 7.8±1.3 | ||||||||
| 293 | –28.5±0.2 | –53.3±9.2 | 24.8±9.1 | 5.9±1.6 | |||||||||
| 298 | –27.9±0.1 | –11.6±4.7 | –16.3±4.6 | 10.6±1.0 | |||||||||
| 303 | –28.8±0.1 | 30.9±5.9 | –59.7±5.9 | 8.7±1.2 | |||||||||
| R188A K243A | 288 | –33±0.1 | –20.3±6.0 | –12.6±6.0 | 4.9±0.6 | –28.9±0.1 | –21.3±3.4 | –7.6±3.3 | 4.8±0.5 | ||||
| 293 | –33.5±0.1 | 4.5±3.2 | –38.0±3.2 | 4.0±0.6 | –29.3±0.1 | 2.7±3.4 | –32.0±3.4 | 4.2±0.4 | |||||
| 298 | –34.1±0.1 | 30.1±1.9 | –64.3±1.9 | 6.2±0.7 | –29.9±0.1 | 27.3±5.0 | –57.1±5.0 | 5.6±0.6 | |||||
| 303 | –35.5±0.1 | 56.1±4.1 | –91.7±4.1 | 5.3±0.6 | –31.1±0.1 | 52.0±7.3 | –83.2±7.4 | 5.0±0.5 | |||||
| R188A K299A | 288 | –26.8±0.1 | –15.4±16.2 | –11.4±16.0 | 8.9±2.2 | –26.9±0.6 | –15.7±36.0 | –11.1±35.4 | 5.2±3.8 | ||||
| 293 | –27.5±0.1 | 29.5±5.2 | –57.0±5.2 | 7.8±1.3 | –27.2±0.4 | 10.1±18.9 | –37.3±18.9 | 5.8±6.0 | |||||
| 298 | –28.6±0.2 | 75.2±7.6 | –103.8±7.4 | 10.4±3.5 | –28.2±0.2 | 35.4±6.4 | –63.6±6.3 | 4.4±1.4 | |||||
| 303 | –30.8±0.2 | 121.4±19.9 | –152.2±20.0 | 9.4±2.6 | –29.4±0.1 | 60.5±14.2 | –89.9±14.2 | 5.0±2.8 | |||||
| R238A K243A | 288 | –30.7±0.2 | –42.4±8.3 | 11.8±8.1 | –1.2±0.5 | –28.1±0.1 | 13.2±9.6 | –41.4±9.6 | –3.8±2.4 | ||||
| 293 | –30.8±0.1 | –46.9±6.0 | 16.1±6.0 | –4.7±0.3 | –28.8±0.2 | –5.4±4.5 | –23.4±4.5 | –4.7±1.6 | |||||
| 298 | –29.6±0.1 | –48.4±4.0 | 18.8±4.1 | 3.8±0.8 | –28.8±0.1 | –23.3±17.2 | –5.5±17.2 | –2.5±3.8 | |||||
| 303 | –29.7±0.1 | –48.3±3.4 | 18.6±3.4 | 0.4±0.6 | –28.9±0.6 | –40.7±31 | 11.9±31.5 | –3.4±2.9 | |||||
| R188A R238A K243A | 288 | –25.9±0.3 | –25.2±5.7 | –0.7±5.4 | 6.2±0.3 | ||||||||
| 293 | –26.3±0.3 | 6.5±3.7 | –32.7±3.4 | 5.3±1.4 | |||||||||
| 298 | –26.9±0.2 | 38.9±0.6 | –65.7±0.7 | 7.6±2.5 | |||||||||
| 303 | –28.3±0.2 | 71.7±3.3 | –100±3.3 | 6.7±0.9 |
Table 3
Double mutant cycle analysis of the first KDL binding to wild-type and mutant MsbA.
The ΔΔ values mutant relative to the wild-type protein. Reported are the mean (n=3).
| Temperature(K) | ΔΔG(kJ/mol) | ΔΔH(kJ/mol) | Δ(-TΔS)(kJ/mol) | ΔΔGint(kJ/mol) | ΔΔHint(kJ/mol) | Δ(-ΔTS)int(kJ/mol) | ||
|---|---|---|---|---|---|---|---|---|
| R78A | 288 | 2.4±0.2 | 45.6±12.5 | –43.2±12.4 | ||||
| 293 | 2.2±0.2 | –7.8±7.5 | 10.0±7.5 | |||||
| 298 | 2.7±0.2 | –61.7±11.3 | 64.4±11.3 | |||||
| R188A | 288 | 2.8±0.2 | 13.0±14.2 | –10.2±14.0 | ||||
| 293 | 2.7±0.1 | 5.2±6.5 | –2.5±6.5 | |||||
| 298 | 2.7±0.2 | –3.0±6.9 | 5.6±7.0 | |||||
| 303 | 2.9±0.4 | –11.2±14.7 | 14.1±14.9 | |||||
| R238A | 288 | 3.1±0.2 | –30.9±12.1 | 33.9±11.9 | ||||
| 293 | 3.8±0.1 | –46.9±6.7 | 50.7±6.7 | |||||
| 298 | 4.8±0.1 | –62.9±7.5 | 67.7±7.6 | |||||
| 303 | 6.1±0.4 | –78.8±13.5 | 84.9±13.7 | |||||
| K243A | 288 | 1.4±0.2 | –12.5±13.7 | 13.9±13.5 | ||||
| 293 | 1.5±0.2 | –2.7±6.5 | 4.3±6.5 | |||||
| 298 | 1.6±0.2 | 7.2±7.0 | –5.6±7.1 | |||||
| 303 | 1.4±0.4 | 17.3±14.5 | –15.9±14.8 | |||||
| K299A | 288 | 2.9±0.2 | 13.8±15.1 | –10.9±14.8 | ||||
| 293 | 2.8±0.1 | 5.7±6.6 | –2.9±6.7 | |||||
| 298 | 2.8±0.2 | –2.4±6.1 | 5.2±6.2 | |||||
| 303 | 3.0±0.4 | –10.3±14.3 | 13.3±14.6 | |||||
| R78A | K299A | 288 | 3.2±0.2 | –0.8±12.9 | 4.0±12.6 | 2.2±0.5 | 60.2±23.4 | –58.0±23.1 |
| 293 | 3.4±0.1 | –19.2±6.1 | 22.7±6.1 | 1.6±0.4 | 17.1±11.6 | –15.6±11.8 | ||
| 298 | 3.8±0.2 | –38.2±6.9 | 42.0±7.1 | 1.7±0.4 | –25.8±14.6 | 27.5±14.7 | ||
| R188A | R238A | 288 | 5.0±0.5 | –57.4±19.1 | 62.4±18.7 | 0.9±0.6 | 39.5±26.7 | –38.7±26.2 |
| 293 | 5.9±0.2 | –57.5±10.7 | 63.5±10.5 | 0.6±0.4 | 15.8±14.2 | –15.2±14.1 | ||
| 298 | 7.3±0.2 | –56.6±7.5 | 64.0±7.5 | 0.1±0.4 | –9.2±12.6 | 9.3±12.7 | ||
| 303 | 8.2±0.4 | –55.1±13.5 | 63.4±13.7 | 0.7±0.5 | –34.9±24.0 | 35.6±24.5 | ||
| R188A | K243A | 288 | 1.0±0.2 | 15.7±13.1 | –14.6±12.9 | 3.2±0.5 | –15.1±23.8 | 18.3±23.4 |
| 293 | 0.9±0.1 | 0.3±6.2 | 0.6±6.2 | 3.4±0.2 | 2.2±11.1 | 1.2±11.1 | ||
| 298 | 1.1±0.2 | –14.9±6.0 | 16.0±6.2 | 3.2±0.4 | 19.1±11.5 | –16.0±11.8 | ||
| 303 | 1.4±0.4 | –29.9±12.7 | 31.4±13.0 | 2.8±0.6 | 36.0±24.2 | –33.2±24.7 | ||
| R188A | K299A | 288 | 7.2±0.2 | 20.6±20.0 | –13.4±19.7 | –1.5±0.5 | 6.2±28.8 | –7.7±28.4 |
| 293 | 6.9±0.1 | 25.2±7.5 | –18.3±7.5 | –1.4±0.2 | –14.4±11.9 | 13.0±11.9 | ||
| 298 | 6.6±0.2 | 30.2±9.6 | –23.6±9.6 | –1.1±0.4 | –35.5±13.2 | 34.3±13.3 | ||
| 303 | 6.1±0.4 | 35.3±23.3 | –29.2±23.5 | –0.3±0.6 | –56.8±31.0 | 56.5±31.5 | ||
| R238A | K243A | 288 | 3.4±0.2 | –6.4±14.3 | 9.8±14.1 | 1.1±0.5 | –36.9±23.3 | 38.0±22.8 |
| 293 | 3.6±0.1 | –51.1±8.1 | 54.7±8.1 | 1.8±0.2 | 1.5±12.4 | 0.3±12.4 | ||
| 298 | 5.6±0.2 | –93.4±7.0 | 99.0±7.2 | 0.8±0.4 | 37.7±12.4 | –37.0±12.7 | ||
| 303 | 7.3±0.4 | –134.4±12.5 | 141.6±12.9 | 0.2±0.6 | 72.8±23.4 | –72.6±24.0 | ||
Table 4
Triple mutant cycle analysis of the first KDL binding to wild-type and mutant MsbA.
Shown as described in Table 3.
| Temperature(K) | ΔΔG(kJ/mol) | ΔΔH(kJ/mol) | Δ(-TΔS) (kJ/mol) | ΔΔGint(kJ/mol) | ΔΔHint(kJ/mol) | Δ(-ΔTS)int(kJ/mol) | |||
|---|---|---|---|---|---|---|---|---|---|
| R188A | R238A | 288 | 2.2±0.2 | –70.4±8.9 | 72.6±8.7 | ||||
| 293 | 3.2±0.1 | –62.7±5.4 | 65.9±5.3 | ||||||
| 298 | 4.7±0.1 | –53.7±6.1 | 58.3±6.1 | ||||||
| 303 | 5.4±0.1 | –43.9±10.2 | 49.3±10.3 | ||||||
| K243A | 288 | –1.8±0.2 | 2.6±11.0 | 19.9±10.8 | |||||
| 293 | –1.8±0.2 | –4.9±5.0 | –6.4±5.0 | ||||||
| 298 | –1.6±0.1 | –11.9±5.4 | 10.4±5.4 | ||||||
| 303 | –1.4±0.2 | –18.7±11.5 | 17.3±11.8 | ||||||
| R238A | K243A | 288 | 5.3±0.4 | –2.2±10.0 | 7.5±9.7 | –4.9±0.5 | –65.6±17.4 | 85.0±16.9 | |
| 293 | 5.4±0.4 | –2.9±5.1 | 8.4±4.9 | –4.0±0.5 | –64.7±8.9 | 51.2±8.8 | |||
| 298 | 5.7±0.2 | –3.2±3.8 | 8.9±3.7 | –2.6±0.2 | –62.4±8.9 | 59.8±8.9 | |||
| 303 | 5.8±0.2 | –3.2±8.9 | 9.0±8.9 | –1.8±0.4 | –59.5±17.8 | 57.7±18.0 | |||
| R238A | R188A | 288 | 1.9±0.2 | –26.5±8.9 | 28.4±8.7 | ||||
| 293 | 2.1±0.1 | –10.6±5.4 | 12.8±5.3 | ||||||
| 298 | 2.5±0.1 | 6.3±6.1 | –3.7±6.1 | ||||||
| 303 | 2.2±0.1 | 23.7±10.2 | –21.5±10.3 | ||||||
| K243A | 288 | 0.3±0.2 | 24.4±8.0 | –24.1±7.8 | |||||
| 293 | –0.2±0.1 | –4.2±5.3 | 4.0±5.3 | ||||||
| 298 | 0.8±0.1 | –30.5±6.2 | 31.3±6.2 | ||||||
| 303 | 1.2±0.2 | –55.5±9.9 | 56.7±10.2 | ||||||
| R188A | K243A | 288 | 5.1±0.2 | 41.7±6.6 | –36.6±6.4 | –2.9±0.4 | –43.8±13.7 | 40.9±13.3 | |
| 293 | 4.3±0.4 | 49.1±5.4 | –44.8±5.1 | –2.4±0.4 | –64.0±9.3 | 61.6±9.1 | |||
| 298 | 3.6±0.2 | 56.7±4.9 | –53.2±4.9 | –0.2±0.2 | –81.0±10.0 | 80.8±10.0 | |||
| 303 | 2.6±0.2 | 64.5±6.7 | –61.9±6.9 | 0.8±0.4 | –96.3±15.7 | 97.1±16.0 | |||
| K243A | R188A | 288 | –0.4±0.2 | 28.1±11.0 | –28.5±10.8 | ||||
| 293 | –0.7±0.2 | 3.0±5.0 | –3.7±5.0 | ||||||
| 298 | –0.5±0.1 | –22.1±5.4 | 21.6±5.4 | ||||||
| 303 | 0.1±0.2 | –47.2±11.5 | 47.3±11.8 | ||||||
| R238A | 288 | 1.9±0.2 | 6.1±8.0 | –4.1±7.8 | |||||
| 293 | 2.0±0.1 | –48.4±5.3 | 50.4±5.3 | ||||||
| 298 | 4.0±0.1 | –100.6±6.2 | 104.6±6.2 | ||||||
| 303 | 5.9±0.2 | –151.6±9.9 | 157.5±10.2 | ||||||
| R188A | R238A | 288 | 6.7±0.2 | 23.3±9.2 | –16.6±8.9 | –5.2±0.4 | 10.9±16.4 | –16.0±16.0 | |
| 293 | 6.6±0.4 | 5.0±5.1 | 1.6±4.9 | –5.2±0.5 | –50.4±8.9 | 45.1±8.8 | |||
| 298 | 6.8±0.2 | –13.3±3.9 | 20.1±4.0 | –3.3±0.2 | –109.4±9.2 | 106.1±9.2 | |||
| 303 | 7.3±0.2 | –31.6±8.7 | 38.9±8.9 | –1.3±0.4 | –167.2±17.5 | 165.9±17.9 | |||
Table 5
Equilibrium dissociation constants (KD) for KDL binding MsbA trapped with ADP and vanadate at various temperatures.
Reported are the mean and standard deviation (n=3).
| Temperature(K) | KD1(μM) | KD2(μM) | KD3(μM) | R2* | Χ2* | |
|---|---|---|---|---|---|---|
| WT | 293 | 0.51±0.04 | 1.16±0.07 | 0.97 | 0.08 | |
| 298 | 0.44±0.02 | 0.93±0.09 | 0.94 | 0.17 | ||
| 303 | 0.38±0.02 | 0.73±0.05 | 0.94 | 0.15 | ||
| 310 | 0.31±0.01 | 0.53±0.04 | 0.92 | 0.2 | ||
| R188A | 293 | 1.56±0.09 | 3.46±0.15 | 10.98±1.15 | 0.98 | 0.07 |
| 298 | 1.53±0.11 | 3.40±0.21 | 10.15±1.62 | 0.98 | 0.06 | |
| 303 | 1.35±0.10 | 2.90±0.26 | 9.02±1.11 | 0.98 | 0.05 | |
| 310 | 0.93±0.09 | 1.89±0.24 | 5.50±1.10 | 0.97 | 0.07 | |
| R238A | 293 | 1.67±0.23 | 6.71±1.38 | 0.99 | 0.05 | |
| 298 | 0.91±0.10 | 3.15±0.12 | 0.98 | 0.06 | ||
| 303 | 0.34±0.04 | 1.09±0.23 | 3.75±0.60 | 0.95 | 0.11 | |
| 310 | 0.10±0.02 | 0.33±0.11 | 0.92±0.38 | 1 | 0 | |
| K243A | 293 | 2.01±0.06 | 5.26±0.85 | 0.99 | 0.02 | |
| 298 | 1.46±0.01 | 3.90±0.48 | 0.99 | 0.03 | ||
| 303 | 0.60±0.02 | 1.54±0.12 | 3.72±0.54 | 0.98 | 0.04 | |
| 310 | 0.25±0.02 | 0.46±0.02 | 1.06±0.04 | 0.89 | 0.2 | |
| R188A R238A | 293 | 1.24±0.10 | 4.82±0.16 | 0.99 | 0.03 | |
| 298 | 1.17±0.11 | 4.65±0.92 | 0.99 | 0.02 | ||
| 303 | 0.87±0.06 | 3.05±0.26 | 0.98 | 0.04 | ||
| 310 | 0.39±0.05 | 1.28±0.09 | 6.36±1.07 | 0.98 | 0.04 | |
| R188A K243A | 293 | 3.64±0.28 | 15.66±4.76 | 0.99 | 0.03 | |
| 298 | 2.23±0.07 | 6.68±0.17 | 0.99 | 0.03 | ||
| 303 | 1.06±0.05 | 3.10±0.33 | 19.33±3.70 | 0.99 | 0.03 | |
| 310 | 0.66±0.02 | 1.56±0.04 | 5.70±0.93 | 0.98 | 0.04 | |
| R238A K243A | 293 | 1.31±0.04 | 4.35±0.07 | 0.99 | 0.03 | |
| 298 | 1.03±0.09 | 3.65±0.15 | 0.99 | 0.02 | ||
| 303 | 0.48±0.05 | 1.97±0.09 | 0.97 | 0.09 | ||
| 310 | 0.10±0.02 | 0.58±0.06 | 0.74 | 0.93 |
-
These values represent the replicates with the poorest fits.
Table 6
Thermodynamic signatures of KDL interacting with wild-type and mutant MsbA trapped with ADP and vanadate.
Reported are the mean with standard deviation (n=3), and the subscript denotes the nth KDL binding event.
| T(K) | ΔG1(kJ/mol) | ΔH1(kJ/mol) | -TΔS1(kJ/mol) | ΔCp1 (kJ/mol/K) | ΔG2(kJ/mol) | ΔH2(kJ/mol) | -TΔS2(kJ/mol) | ΔCp2 (kJ/mol/K) | ΔG3(kJ/mol) | ΔH3(kJ/mol) | -TΔS3(kJ/mol) | ΔCp3 (kJ/mol/K) | |
|---|---|---|---|---|---|---|---|---|---|---|---|---|---|
| WT | 293 | –35.3±0.1 | 21.9±1.5 | –57.2±1.3 | –33.3±0.2 | 35.0±0.6 | –68.3±0.6 | ||||||
| 298 | –36.3±0.1 | 21.9±1.5 | –58.2±1.3 | –34.4±0.2 | 35.0±0.6 | –69.4±0.6 | |||||||
| 303 | –37.3±0.1 | 21.9±1.5 | –59.2±1.3 | –35.6±0.2 | 35.0±0.6 | –70.6±0.6 | |||||||
| 310 | –38.6±0.1 | 21.9±1.5 | –60.5±1.3 | –37.2±0.2 | 35.0±0.6 | –72.2±0.6 | |||||||
| R188A | 293 | –32.6±0.1 | –6.6±2.6 | –26.0±2.7 | 3.6±0.1 | –30.7±0.1 | –7.2±2.4 | –23.4±2.5 | 4.1±0.2 | –27.8±0.3 | –3.2±21.3 | –24.7±21.1 | 4.1±2.7 |
| 298 | –33.2±0.2 | 11.3±2.6 | –44.5±2.7 | 3.5±0.1 | –31.2±0.1 | 13.4±3.3 | –44.7±3.4 | 4.2±0.3 | –28.5±0.4 | 17.6±12.4 | –46.1±12.3 | 3.6±4.2 | |
| 303 | –34.1±0.2 | 29.2±2.5 | –63.3±2.6 | 3.6±0.1 | –32.2±0.2 | 34.1±4.3 | –66.3±4.5 | 4.1±0.2 | –29.3±0.3 | 37.8±14.8 | –67.1±15.1 | 4.9±1.4 | |
| 310 | –35.8±0.2 | 54.3±2.6 | –90.2±2.8 | 3.6±0.1 | –34.0±0.3 | 63.0±5.8 | –97.0±6.1 | 4.1±0.2 | –31.3±0.5 | 67.9±26.1 | –99.2±26.6 | 4.3±2.2 | |
| R238A | 293 | –32.1±0.2 | 126.8±5.8 | –158.9±5.9 | –28.9±0.4 | 137.7±10.8 | –166.5±10.8 | ||||||
| 298 | –34.8±0.4 | 126.8±5.8 | –161.6±6.0 | –31.7±0.4 | 137.7±10.8 | –169.4±11.0 | |||||||
| 303 | –37.6±0.4 | 126.8±5.8 | –164.3±6.1 | –34.6±0.5 | 137.7±10.8 | –172.2±11.1 | |||||||
| 310 | –41.4±0.5 | 126.8±5.8 | –168.1±6.2 | –38.5±0.7 | 137.7±10.8 | –176.2±11.4 | |||||||
| K243A | 293 | –31.6±0.1 | 96.2±5.1 | –127.9±5.1 | –29.1±0.2 | 111.7±6.9 | –140.8±6.6 | ||||||
| 298 | –33.8±0.1 | 96.2±5.1 | –130.0±5.1 | –31.5±0.1 | 111.7±6.9 | –143.2±6.7 | |||||||
| 303 | –36.0±0.1 | 96.2±5.1 | –132.2±5.3 | –33.9±0.1 | 111.7±6.9 | –145.6±6.9 | |||||||
| 310 | –39.1±0.2 | 96.2±5.1 | –135.3±5.4 | –37.3±0.2 | 111.7±6.9 | –149±7.1 | |||||||
| R188A R238A | 293 | –33.2±0.2 | –10.2±3.0 | –23.0±3.1 | 7.5±1.0 | –29.8±0.1 | –8.2±30.4 | –21.7±30.3 | 8.1±3.5 | ||||
| 298 | –33.9±0.2 | 27.2±2.5 | –61.0±2.6 | 7.5±0.3 | –30.5±0.5 | 31.9±13.7 | –62.4±14.2 | 8.6±4.6 | |||||
| 303 | –35.2±0.2 | 64.5±7.3 | –99.7±7.2 | 7.5±2.1 | –32.0±0.2 | 72.5±4.9 | –104.5±4.8 | 7.4±1.9 | |||||
| 310 | –38.1±0.4 | 116.9±16.4 | –155.0±16.8 | 7.5±1.3 | –35.0±0.2 | 127.7±25.9 | –162.7±25.9 | 7.9±3.0 | |||||
| R188A K243A | 293 | –30.5±0.2 | 92.4±8.6 | –122.9±8.4 | –1.8±0.9 | –27.0±0.7 | 135.4±44.8 | –162.4±44.1 | –4.0±4.0 | ||||
| 298 | –32.3±0.1 | 82.1±4.4 | –114.4±4.3 | –0.1±0.9 | –29.5±0.1 | 114.7±25.2 | –144.2±25.2 | –3.4±4.5 | |||||
| 303 | –34.7±0.1 | 73.4±0.1 | –108.0±0.1 | –4.4±0.8 | –32.0±0.3 | 94.5±5.7 | –126.5±5.6 | –4.9±3.8 | |||||
| 310 | –36.7±0.1 | 55.6±5.7 | –92.3±5.7 | –2.6±0.8 | –34.5±0.1 | 64.4±22.9 | –98.9±22.9 | –4.3±3.9 | |||||
| R238A K243A | 293 | –33.0±0.1 | 8.9±14.2 | –41.9±14.2 | 12.7±2.7 | –30.1±0.1 | 6.5±2.2 | –36.6±2.1 | 10.0±0.7 | ||||
| 298 | –34.2±0.2 | 71.8±7.2 | –106.0±7.4 | 13.2±2.1 | –31.0±0.1 | 56.1±2.1 | –87.1±2.2 | 10.5±0.9 | |||||
| 303 | –36.7±0.2 | 135.3±16.2 | –171.9±16.3 | 11.9±3.5 | –33.1±0.1 | 106.2±5.4 | –139.3±5.5 | 9.1±1.0 | |||||
| 310 | –41.6±0.8 | 222.4±35.8 | –264.0±36.5 | 12.4±2.9 | –37.0±0.3 | 174.4±10.5 | –211.4±10.8 | 9.7±0.7 |
Table 7
Double mutant cycle analysis of the first KDL binding to wild-type and mutant MsbA trapped with ADP and vanadate.
Shown as described in Table 3.
| Temperature(K) | ΔΔG(kJ/mol) | ΔΔH(kJ/mol) | Δ(-TΔS)(kJ/mol) | ΔΔGint(kJ/mol) | ΔΔHint(kJ/mol) | Δ(-ΔTS)int(kJ/mol) | ||
|---|---|---|---|---|---|---|---|---|
| R188A | 293 | 2.7±0.1 | –28.5±3.1 | 31.2±3.1 | ||||
| 298 | 3.1±0.2 | –10.6±2.9 | 13.7±3.1 | |||||
| 303 | 3.2±0.2 | 7.3±2.9 | –4.1±2.9 | |||||
| 310 | 2.8±0.2 | 32.4±2.9 | –29.7±3.1 | |||||
| R238A | 293 | 3.2±0.2 | 104.9±6.0 | –101.7±6.0 | ||||
| 298 | 1.5±0.4 | 104.9±6.0 | –103.4±6.1 | |||||
| 303 | –0.3±0.4 | 104.9±6.0 | –105.1±6.2 | |||||
| 310 | –2.8±0.5 | 104.9±6.0 | –107.6±6.4 | |||||
| K243A | 293 | 3.7±0.1 | 74.3±5.4 | –70.7±5.3 | ||||
| 298 | 2.5±0.1 | 74.3±5.4 | –71.8±5.3 | |||||
| 303 | 1.3±0.1 | 74.3±5.4 | –73.0±5.4 | |||||
| 310 | –0.5±0.2 | 74.3±5.4 | –74.8±5.5 | |||||
| R188A | R238A | 293 | 2.2±0.2 | –32.1±3.3 | 34.2±3.4 | 3.8±0.4 | 108.5±7.0 | –104.7±7.2 |
| 298 | 2.4±0.2 | 5.3±2.9 | –2.8±2.9 | 2.2±0.5 | 89.0±6.9 | –86.9±7.1 | ||
| 303 | 2.1±0.2 | 42.6±7.5 | –40.5±7.3 | 0.8±0.5 | 69.6±9.6 | –68.7±9.8 | ||
| 310 | 0.5±0.4 | 95.0±16.5 | –94.5±16.8 | –0.5±0.6 | 42.4±17.6 | –42.8±18.1 | ||
| R188A | K243A | 293 | 4.8±0.2 | 70.5±8.7 | –65.7±8.6 | 1.6±0.2 | –24.7±10.4 | 26.3±10.3 |
| 298 | 4.0±0.1 | 60.2±4.7 | –56.2±4.5 | 1.6±0.2 | 3.5±7.2 | –1.9±7.2 | ||
| 303 | 2.6±0.1 | 51.5±1.5 | –48.8±1.3 | 1.9±0.2 | 30.1±5.8 | –28.2±5.9 | ||
| 310 | 1.9±0.1 | 33.7±5.9 | –31.8±5.9 | 0.4±0.4 | 73.0±8.1 | –72.7±8.3 | ||
| R238A | K243A | 293 | 2.3±0.1 | –13.0±14.3 | 15.3±14.2 | 4.6±0.2 | 192.2±16.2 | –187.7±16.2 |
| 298 | 2.1±0.2 | 49.9±7.3 | –47.8±7.6 | 1.9±0.4 | 129.3±10.5 | –127.4±10.9 | ||
| 303 | 0.6±0.2 | 113.4±16.3 | –112.7±16.4 | 0.4±0.5 | 65.8±17.9 | –65.4±18.2 | ||
| 310 | –3.0±0.9 | 200.5±35.8 | –203.5±36.5 | –0.4±1.0 | –21.3±36.6 | 21.1±37.5 | ||
Table 8
Double mutant cycle analysis of the second KDL binding to wild-type and mutant MsbA trapped with ADP and vanadate.
Shown as described in Table 3.
| Temperature(K) | ΔΔG(kJ/mol) | ΔΔH(kJ/mol) | Δ(-TΔS)(kJ/mol) | ΔΔGint(kJ/mol) | ΔΔHint(kJ/mol) | Δ(-ΔTS)int(kJ/mol) | ||
|---|---|---|---|---|---|---|---|---|
| R188A | 293 | 2.7±0.2 | –42.2±2.4 | 44.9±2.6 | ||||
| 298 | 3.2±0.2 | –21.6±3.3 | 24.8±3.4 | |||||
| 303 | 3.5±0.4 | –0.9±4.4 | 4.3±4.5 | |||||
| 310 | 3.2±0.4 | 28.0±5.9 | –24.8±6.1 | |||||
| R238A | 293 | 4.4±0.5 | 102.7±10.8 | –98.2±10.8 | ||||
| 298 | 2.7±0.5 | 102.7±10.8 | –100.0±11.0 | |||||
| 303 | 1.0±0.5 | 102.7±10.8 | –101.6±11.1 | |||||
| 310 | –1.3±0.7 | 102.7±10.8 | –104.0±11.4 | |||||
| K243A | 293 | 4.2±0.4 | 76.7±6.9 | –72.5±6.6 | ||||
| 298 | 2.9±0.2 | 76.7±6.9 | –73.8±6.7 | |||||
| 303 | 1.7±0.2 | 76.7±6.9 | –75.0±6.9 | |||||
| 310 | –0.1±0.4 | 76.7±6.9 | –76.8±7.1 | |||||
| R188A | R238A | 293 | 3.5±0.2 | –43.2±30.4 | 46.7±30.3 | 3.6±0.4 | 103.7±32.3 | –100.0±32.2 |
| 298 | 3.9±0.5 | –3.1±13.7 | 7.0±14.2 | 2.0±0.6 | 84.2±17.8 | –82.3±18.2 | ||
| 303 | 3.6±0.4 | 37.5±4.9 | –33.9±4.8 | 0.9±0.6 | 64.3±12.6 | –63.3±13.0 | ||
| 310 | 2.2±0.2 | 92.7±25.8 | –90.5±25.8 | –0.3±0.9 | 38.0±28.7 | –38.3±28.9 | ||
| R188A | K243A | 293 | 6.3±0.7 | 100.4±44.8 | –94.1±44.1 | 0.6±0.7 | –65.9±45.4 | 66.5±44.7 |
| 298 | 4.9±0.2 | 79.7±25.2 | –74.8±25.2 | 1.2±0.2 | –24.6±26.3 | 25.8±26.3 | ||
| 303 | 3.6±0.4 | 59.5±5.8 | –55.9±5.6 | 1.5±0.4 | 16.3±9.9 | –14.7±9.9 | ||
| 310 | 2.7±0.2 | 29.4±22.9 | –26.7±22.9 | 0.4±0.4 | 75.3±24.6 | –74.9±24.7 | ||
| R238A | K243A | 293 | 3.2±0.2 | –28.5±2.2 | 31.7±2.2 | 5.4±0.5 | 207.9±13.0 | –202.4±12.9 |
| 298 | 3.4±0.2 | 21.1±2.2 | –17.7±2.3 | 2.2±0.4 | 158.3±13.0 | –156.1±13.1 | ||
| 303 | 2.5±0.2 | 71.2±5.4 | –68.7±5.5 | 0.2±0.5 | 108.2±13.8 | –107.9±14.2 | ||
| 310 | 0.2±0.4 | 139.4±10.5 | –139.2±10.8 | –1.6±0.9 | 40.0±16.5 | –41.6±17.3 | ||
Key resources table
| Reagent type (species) or resource | Designation | Source or reference | Identifiers | Additional information |
|---|---|---|---|---|
| Strain, strain background (Escherichia coli) | BL21-AI | Invitrogen | C607003 | Chemically Competent E. coli |
| Strain, strain background (Escherichia coli) | 5-alpha | NEB | C2987H | Chemically Competent E. coli |
| Recombinant DNA reagent | pCDF-His_TEV_MsbA (plasmid) | DOI: 10.1038 /s41467-022-34905-2 | MsbA expression construct | |
| Sequence-based reagent | MsbA_R78A_F | This Paper | PCR primers | gcgGGTATCACCAGCTATGTC |
| Sequence-based reagent | MsbA_R78A_R | This Paper | PCR primers | CAAAATCATCAGCCCGATC |
| Sequence-based reagent | MsbA_R188A_F | DOI: 10.1038 /s41467-022-34905-2 | PCR primers | gcgTTTCGCAACATCAGTAAAAAC |
| Sequence-based reagent | MsbA_R188A_R | DOI: 10.1038 /s41467-022-34905-2 | PCR primers | CTTCGATACTACGCGAATC |
| Sequence-based reagent | MsbA_R238A_F | DOI: 10.1038 /s41467-022-34905-2 | PCR primers | gcgCTTCAGGGGATGAAAATG |
| Sequence-based reagent | MsbA_R238A_R | DOI: 10.1038 /s41467-022-34905-2 | PCR primers | CATTCGGTTGCTGACTTTATC |
| Sequence-based reagent | MsbA_K243A_F | DOI: 10.1038 /s41467-022-34905-2 | PCR primers | gcgATGGTTTCAGCCTCTTCC |
| Sequence-based reagent | MsbA_K243A_R | DOI: 10.1038 /s41467-022-34905-2 | PCR primers | CATCCCCTGAAGACGCAT |
| Sequence-based reagent | MsbA_K299A_F | This Paper | PCR primers | gcgTCGCTGACTAACGTTAACGC |
| Sequence-based reagent | MsbA_K299A_R | This Paper | PCR primers | CAGCGGACGCATCAGTGC |
| Commercial assay or kit | DC Protein Assay | Bio-Rad | 5000112 | |
| Chemical compound, drug | Kdo2-Lipid A (KLA) | Avanti | 699500 |
Additional files
Download links
A two-part list of links to download the article, or parts of the article, in various formats.
Downloads (link to download the article as PDF)
Open citations (links to open the citations from this article in various online reference manager services)
Cite this article (links to download the citations from this article in formats compatible with various reference manager tools)
Double and triple thermodynamic mutant cycles reveal the basis for specific MsbA-lipid interactions
eLife 12:RP91094.
https://doi.org/10.7554/eLife.91094.3


