Associations of combined phenotypic aging and genetic risk with incident cancer: A prospective cohort study
- Department of Epidemiology, Center for Global Health, School of Public Health, Nanjing Medical University, China
- Jiangsu Key Lab of Cancer Biomarkers, Prevention and Treatment, Collaborative Innovation Center for Cancer Personalized Medicine and China International Cooperation Center for Environment and Human Health Nanjing Medical University, China
- Department of Chronic Non-Communicable Disease Control, The Affiliated Wuxi Center for Disease Control and Prevention of Nanjing Medical University, Wuxi Center for Disease Control and Prevention, Wuxi Medical Center, Nanjing Medical University, China
- Research Units of Cohort Study on Cardiovascular Diseases and Cancers, Chinese Academy of Medical Sciences, China
Figures
Figure 1
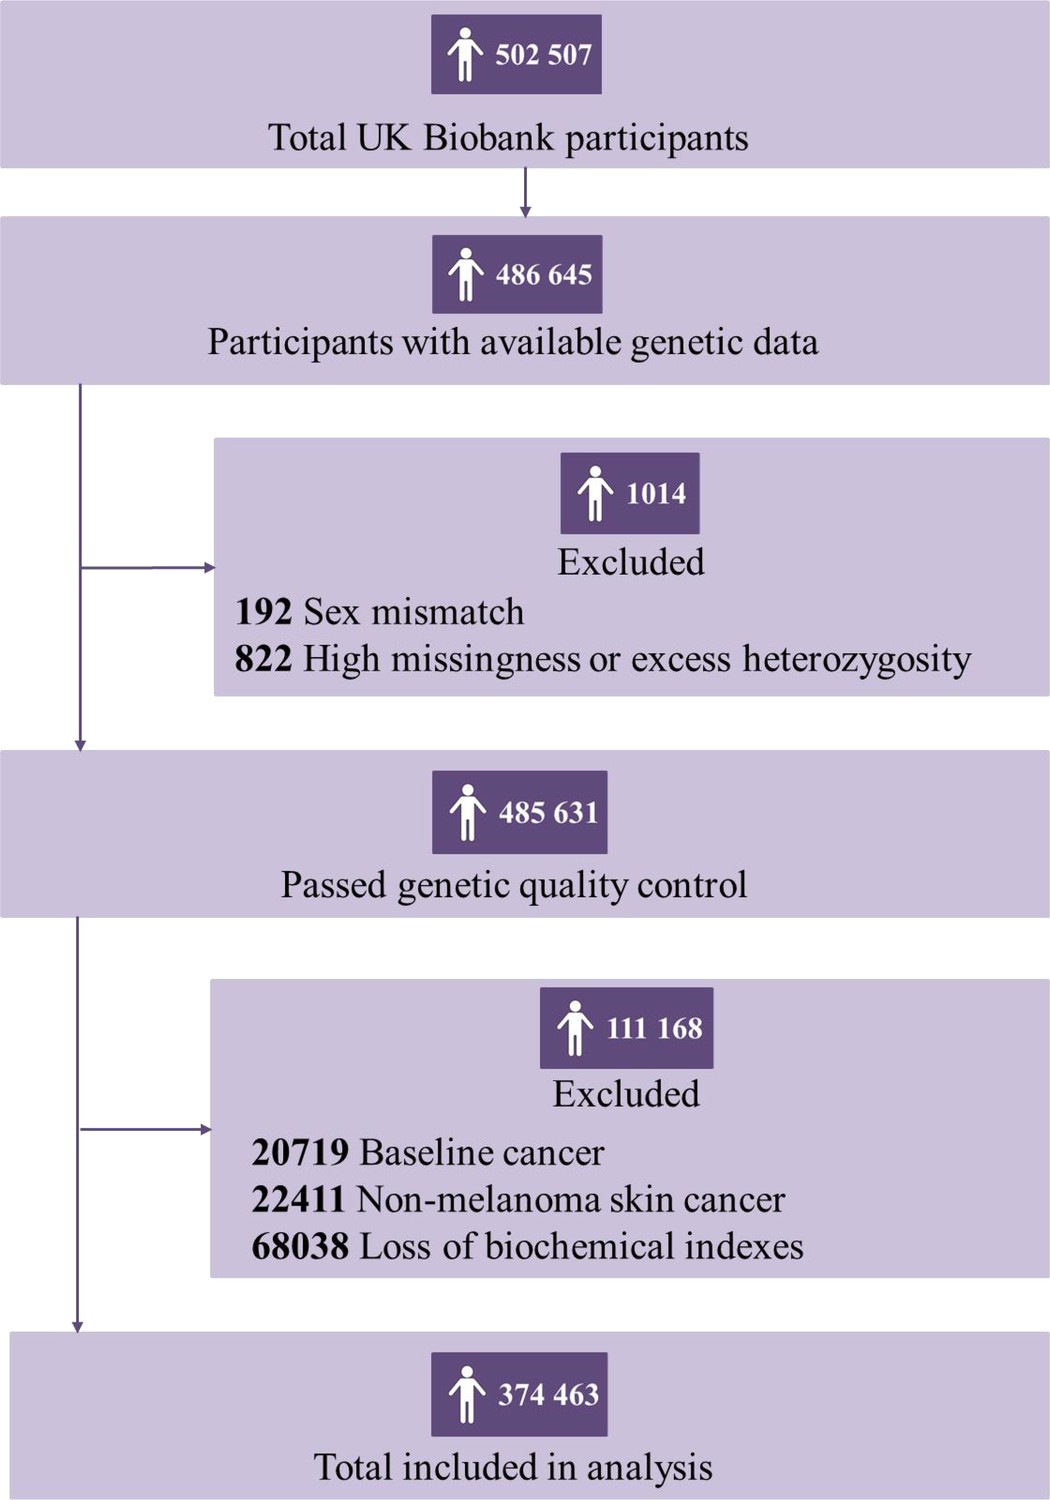
Flowchart for filtering participants from the UK Biobank cohort.
Participants who had withdrawn their consent, had been diagnosed with cancer before baseline, failed to be genotyped, reported a mismatch sex with genetic data, or with missing data on Phenotypic Age (PhenoAge) were excluded.
Figure 2
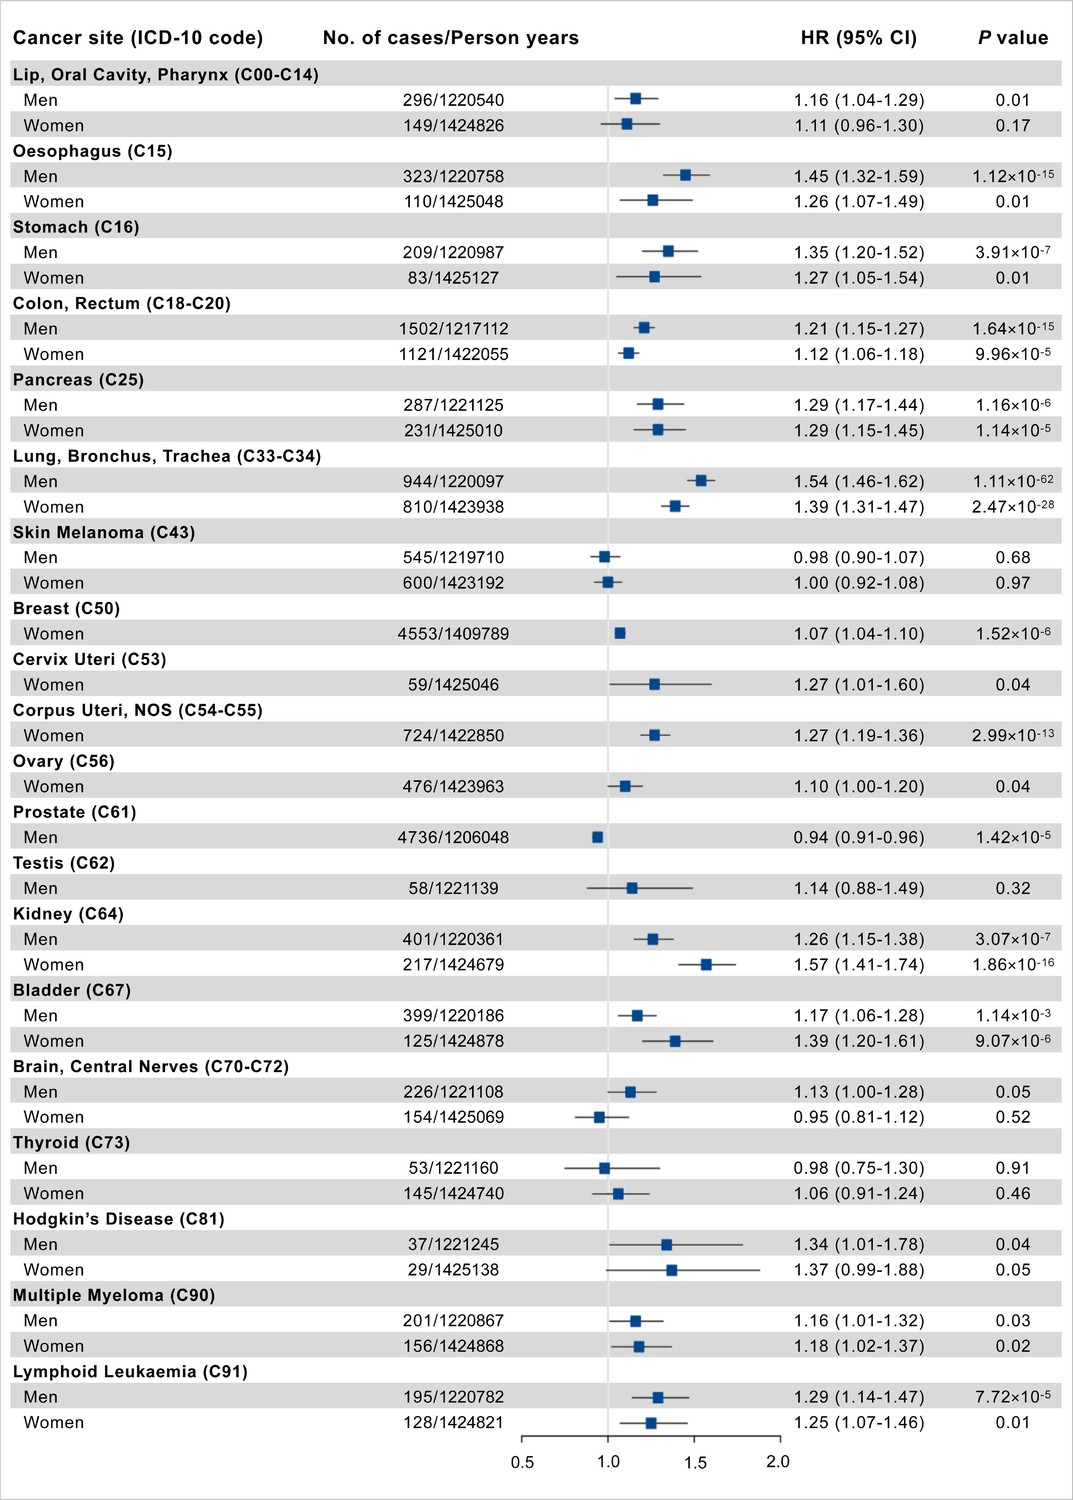
Association results of Phenotypic Age Acceleration (PhenoAgeAccel) with site-specific cancer risk per 5 years increased.
Cox proportional hazards regression adjusted for age, height, cancer family history, Townsend deprivation index at recruitment, and the first 10 principal components of ancestry. Error bars are 95% confidence intervals (CIs).
Figure 3
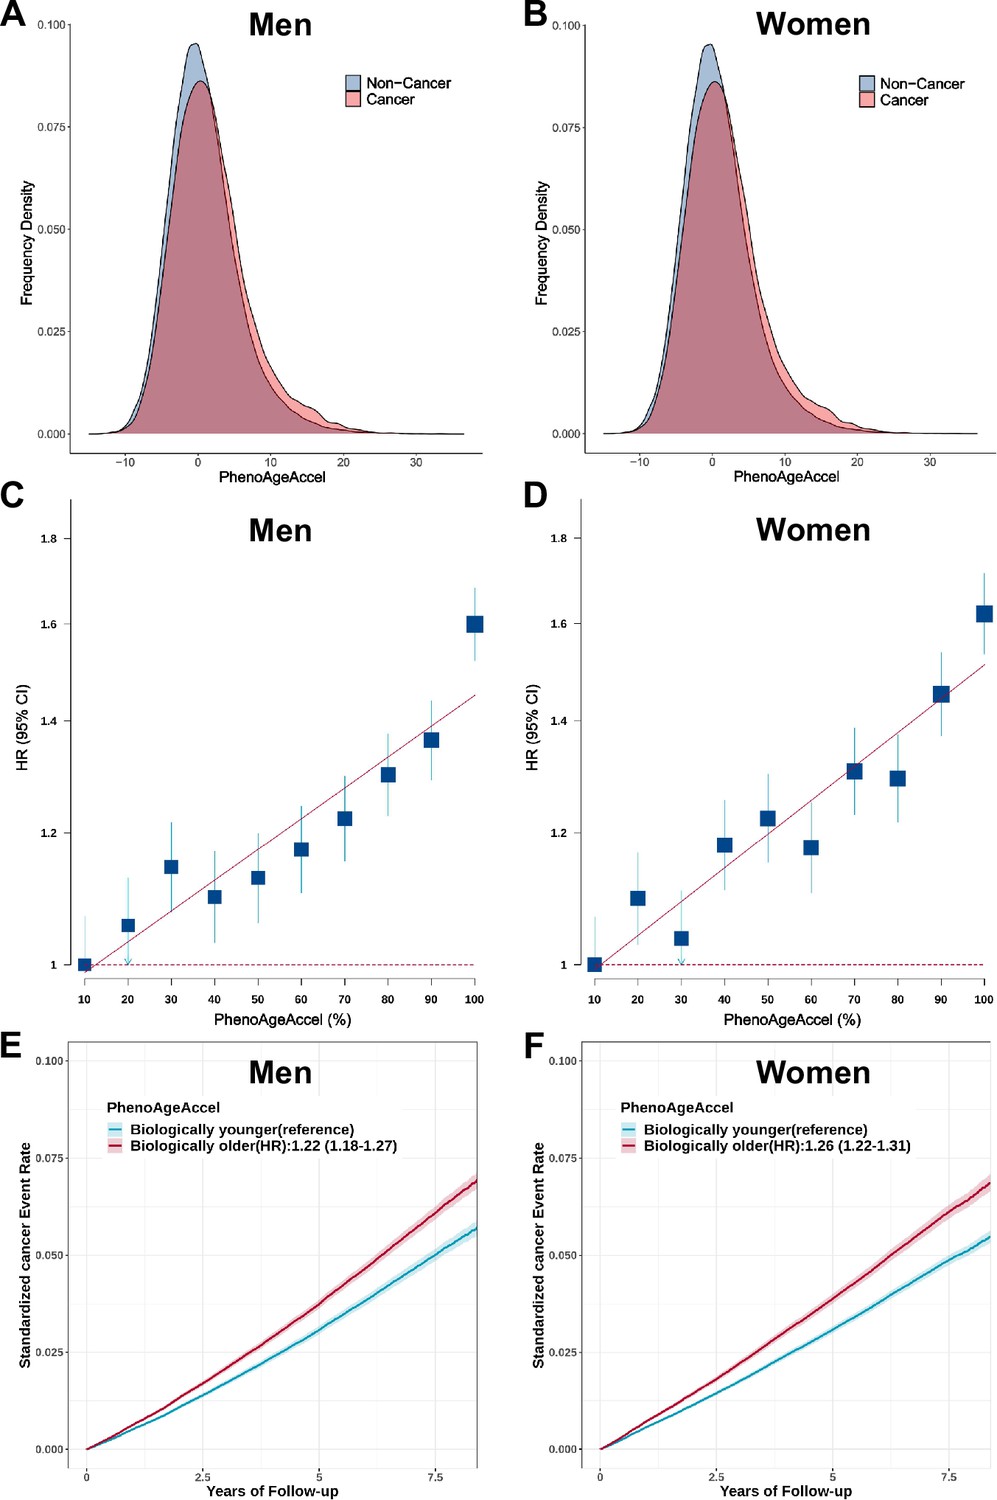
Effect of Phenotypic Age Acceleration (PhenoAgeAccel) on the risk of incident cancer in the UK Biobank.
The distribution of PhenoAgeAccel between participants with incident cancer and those without incident cancer in the UK Biobank for men(A) and women (B). Participants in the UK Biobank were divided into ten equal groups according to the PhenoAgeAccel for men (C) and women (D), and the hazard ratios (HRs) of each group were compared with those in the bottom decile of PhenoAgeAccel. Error bars are 95% confidence intervals (CIs). Standardized rates of cancer events in younger and older PhenoAge groups in the UK Biobank for men (E) and women (F). HRs and 95% CIs were estimated using Cox proportional hazard models with adjustment for age, height, family history of cancer, Townsend deprivation index, and the first 10 principal components of ancestry. Shaded areas are 95% CIs.
Figure 4 with 1 supplement
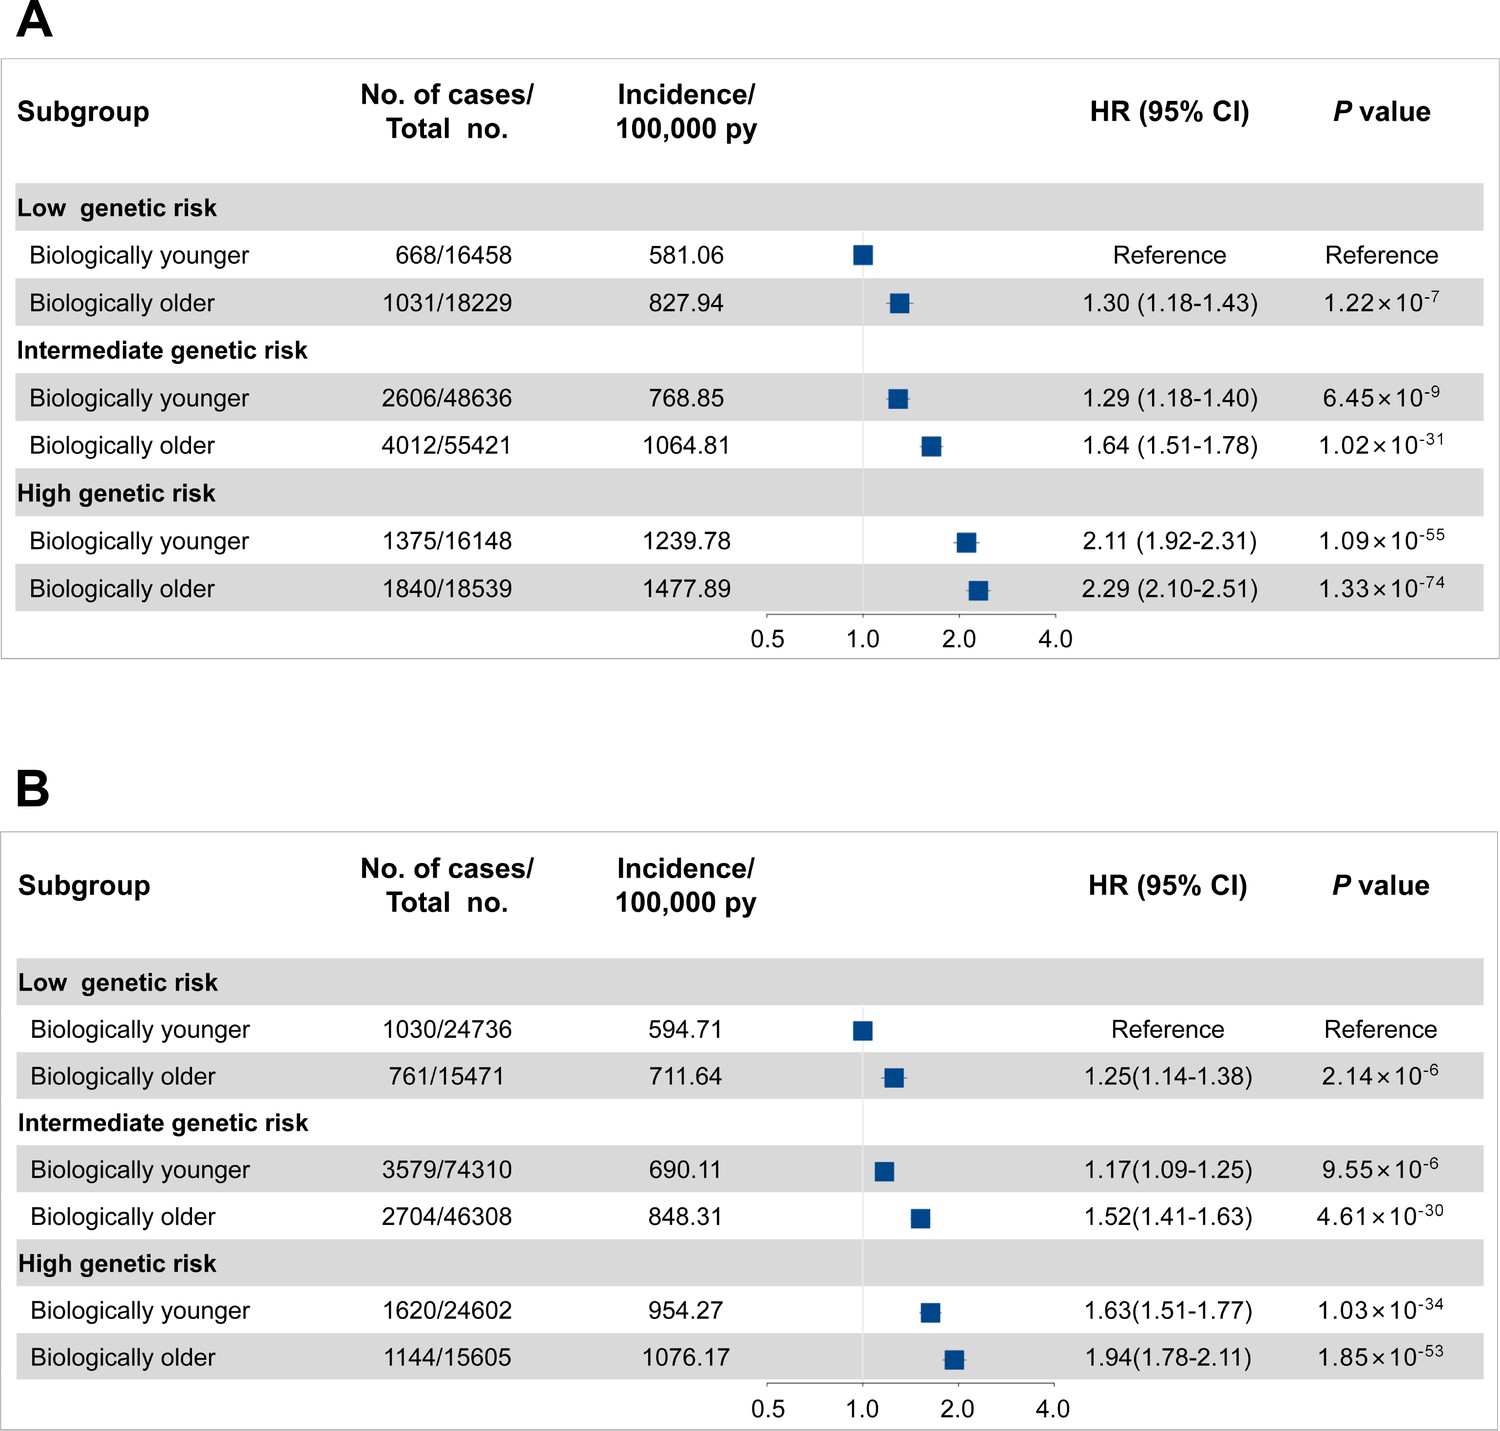
Risk of incident cancer according to genetic and Phenotypic Age Acceleration (PhenoAgeAccel) categories in the UK Biobank for men (A) and women (B).
The hazard ratios (HRs) were estimated using Cox proportional hazard models with adjustment for age, height, family history of cancer, Townsend deprivation index, and the first 10 principal components of ancestry. Participants were divided into younger and older PhenoAge under different genetic risk groups. Error bars are 95% confidence intervals (CIs).
Figure 4—figure supplement 1
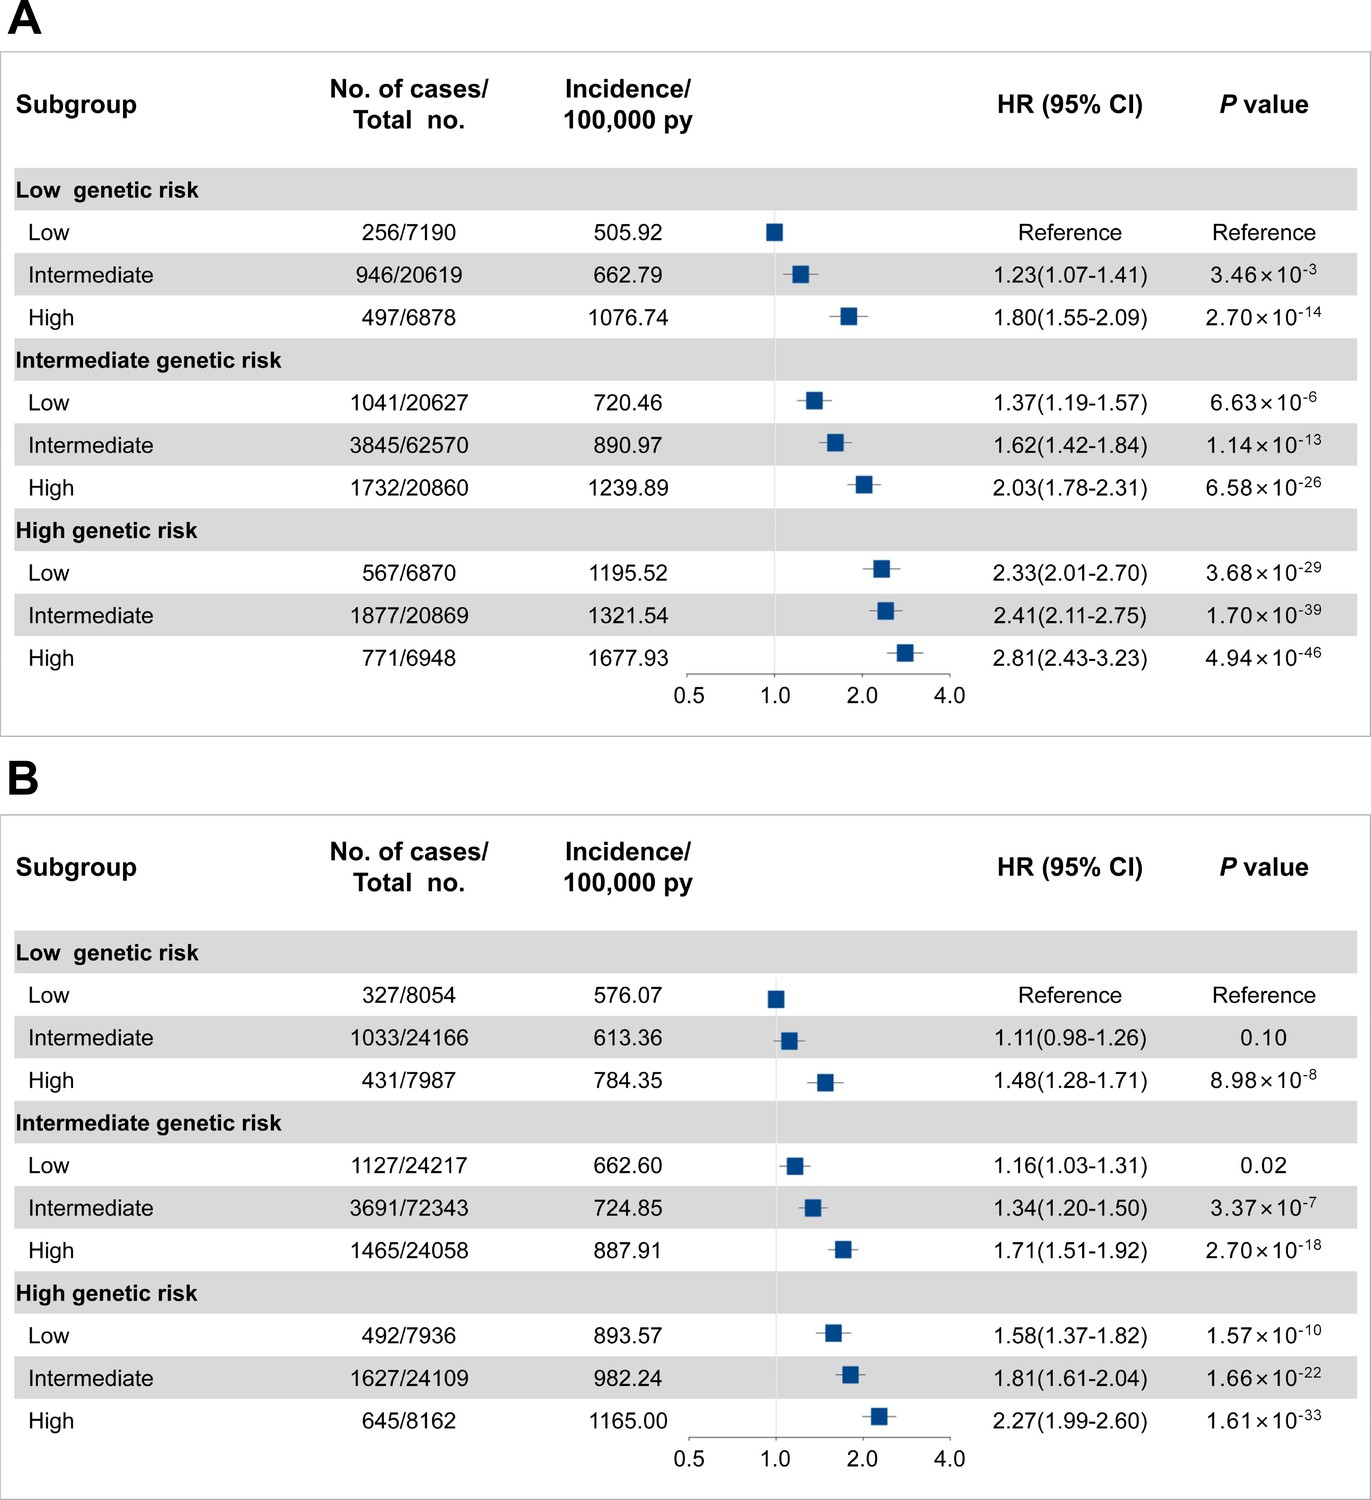
Risk of incident cancer according to genetic and Phenotypic Age Acceleration (PhenoAgeAccel) categories (quintiles) in the UKB cohort for men (A) and women (B).
The hazard ratios (HRs) were estimated using Cox proportional hazard models with adjustment for age, height, family history of cancer, Townsend deprivation index, and the first 10 principal components of ancestry. Participants were divided into low (the bottom quintile of PhenoAgeAccel), intermediate (quintiles 2–4), and high (the top quintile) accelerated aging under different genetic risk groups. Error bars are 95% confidence intervals (CIs).
Figure 5
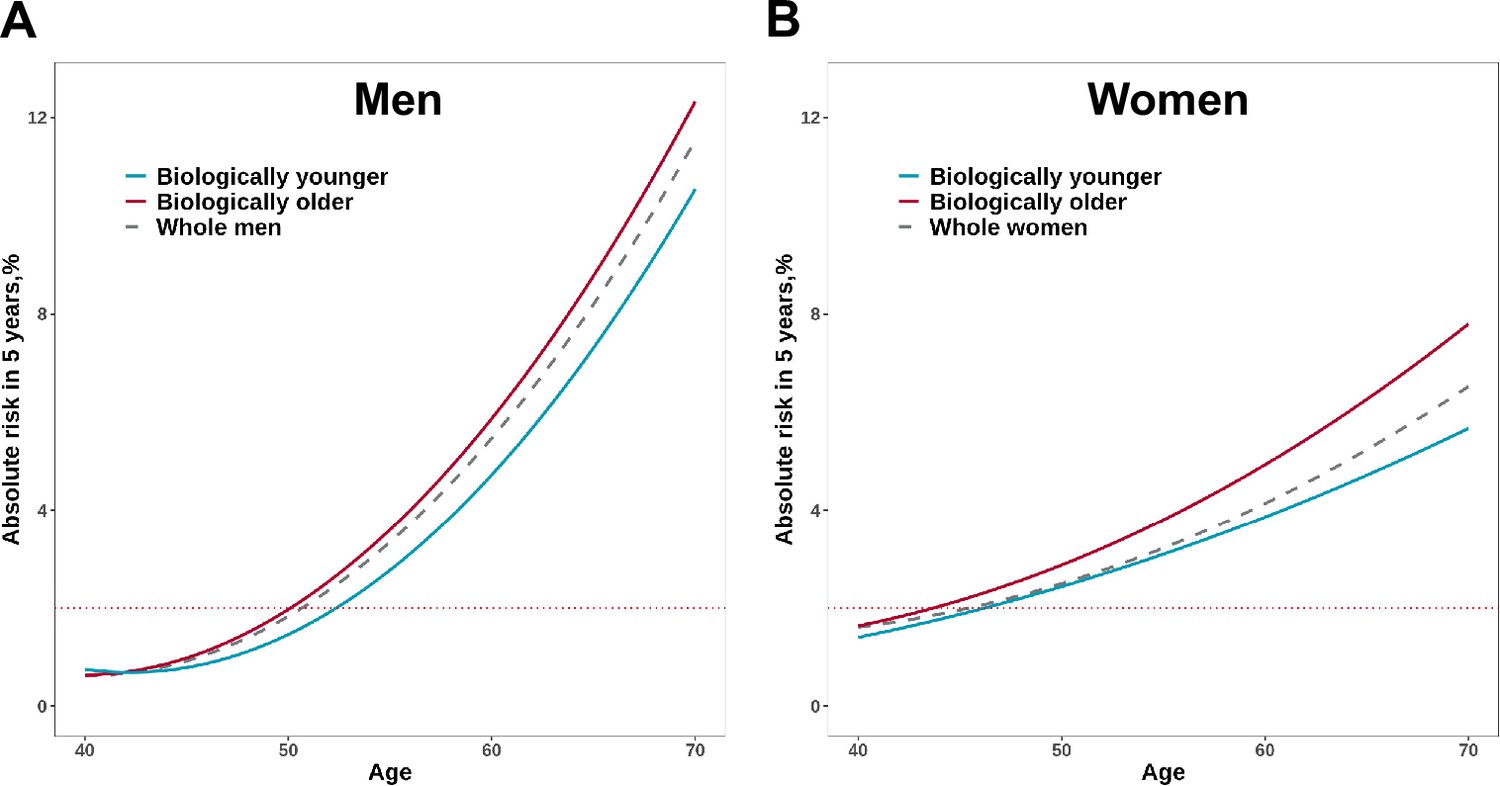
Absolute risk estimates of overall cancer based on the UK Biobank for men (A) and women (B).
The x-axis is chronological age. The curves describe the average risk of participants in younger and older Phenotypic Age (PhenoAge) groups. The dashed curve represents the average risk of the whole population at different ages. The red horizontal dotted line represents 2% of 5 year absolute risks of overall cancer.
Tables
Table 1
Baseline characteristics of participants stratified by Phenotypic Age Acceleration (PhenoAgeAccel) categories.
| Men (n=173,431) | Women (n=201,032) | |||
|---|---|---|---|---|
| Biologically younger n=81,242 | Biologically older n=92,189 | Biologically younger n=123,648 | Biologically older n=77,384 | |
| PhenoAgeAccel, median (IQR), years | –2.61 (−4.35–-1.25) | 3.28 (1.50–6.06) | –3.55 (−5.64–-1.81) | 3.07 (1.33–5.79) |
| Age at baseline, median (IQR), years | 57.00 (49.00–62.00) | 58.00 (50.00–64.00) | 58.00 (51.00–63.00) | 56.00 (48.00–62.00) |
| Height, median (IQR), centimeters | 176.00 (171.00–181.00) | 175.00 (171.00–180.00) | 162.50 (158.00–167.00) | 162.00 (158.00–166.50) |
| Townsend deprivation index, median (IQR) | –2.34 (−3.76–0.16) | –1.86 (−3.52–1.10) | –2.33 (−3.73–0.07) | –1.79 (−3.44–1.10) |
| Family history of cancer, n (%) | ||||
| No | 53907 (66.35) | 60654 (65.79) | 79800 (64.54) | 50924 (65.81) |
| Yes | 27335 (33.65) | 31535 (34.21) | 43848 (35.46) | 26460 (34.19) |
| Healthy lifestyle factors, n (%) | ||||
| No current smoking | 46412 (57.13) | 43216 (46.88) | 78743 (63.68) | 45416 (58.69) |
| No alcohol consumption | 2064 (2.54) | 2828 (3.07) | 6221 (5.03) | 5459 (7.05) |
| Normal BMI | 66120 (81.39) | 62654 (67.96) | 103054 (83.34) | 49003 (63.32) |
| Regular physical activity | 54346 (66.89) | 57733 (62.62) | 80629 (65.21) | 46468 (60.05) |
| Healthy diet | 18540 (22.82) | 15486 (16.80) | 39547 (31.98) | 19826 (25.62) |
| Healthy lifestyle*, n (%) | ||||
| Favorable | 7781 (9.58) | 5255 (5.70) | 17781 (14.38) | 7178 (9.28) |
| Intermediate | 57683 (71.00) | 57489 (62.36) | 87272 (70.58) | 49324 (63.74) |
| Unfavorable | 15778 (19.42) | 29445 (31.94) | 18595 (15.04) | 20882 (26.98) |
| Albumin, median (IQR), (g/L) | 46.20 (44.62–47.85) | 44.95 (43.28–46.64) | 45.47 (43.87–47.12) | 44.04 (42.42–45.70) |
| Alkaline phosphatase, median (IQR), (U/L) | 75.00 (64.30–87.40) | 82.80 (70.10–97.90) | 78.70 (65.10–93.90) | 86.20 (70.60–104.00) |
| Creatinine, median (IQR), (umol/L) | 77.60 (70.90–84.70) | 82.50 (74.40–91.60) | 61.70 (56.00–67.90) | 65.50 (58.90–73.20) |
| Glucose, median (IQR), (mmol/l) | 4.82 (4.49–5.14) | 5.09 (4.72–5.60) | 4.84 (4.54–5.14) | 5.05 (4.70–5.55) |
| C-reactive protein, median (IQR), (mg/dL) | 0.09 (0.05–0.16) | 0.19 (0.10–0.36) | 0.10 (0.05–0.20) | 0.25 (0.12–0.51) |
| Lymphocyte percent, median (IQR), (%) | 29.86 (25.48–34.48) | 25.60 (21.22–30.24) | 31.09 (26.58–35.80) | 27.00 (22.62–31.61) |
| Mean cell volume, median (IQR), (fL) | 90.90 (88.46–93.30) | 91.90 (89.10–94.74) | 91.10 (88.60–93.54) | 90.98 (87.64–94.02) |
| Red cell distribution width, median (IQR), (%) | 13.01 (12.70–13.37) | 13.63 (13.21–14.11) | 13.10 (12.71–13.50) | 13.90 (13.40–14.55) |
| White blood cell count, median (IQR), (1000 cells/uL) | 6.12 (5.29–7.10) | 7.27 (6.17–8.51) | 6.24 (5.37–7.26) | 7.41 (6.30–8.73) |
-
*
Healthy lifestyle was defined as favorable (4–5 healthy lifestyle factors), intermediate (2–3 healthy lifestyle factors), and unfavorable (0–1 healthy lifestyle factor).
Table 2
Association between Phenotypic Age Acceleration (PhenoAgeAccel) and cancer risk.
| Model 1* | Model 2† | ||||||
|---|---|---|---|---|---|---|---|
| n (cases) | Person-Years | HR (95% CI) | p value | HR (95% CI) | value | ||
| Men | Per 5 years increase | 173431 (11532) | 1190628 | 1.15 (1.13–1.17) | 1.55×10–54 | 1.13 (1.11–1.15) | 5.46×10–44 |
| Category | |||||||
| Biologically younger | 81242 (4649) | 564818 | Ref. | Ref. | |||
| Biologically older | 92189 (6883) | 625810 | 1.22 (1.18–1.27) | 5.31×10⁻²⁶ | 1.19 (1.15–1.24) | 3.18×10⁻²⁰ | |
| Quintiles† | |||||||
| Low | 34687 (1864) | 242519 | Ref. | Ref. | |||
| Intermediate | 104058 (6668) | 716312 | 1.15 (1.09–1.21) | 2.17×10⁻⁷ | 1.12 (1.07–1.18) | 8.01×10⁻⁶ | |
| High | 34686 (3000) | 231797 | 1.44 (1.36–1.53) | 1.01×10⁻³⁴ | 1.39 (1.31–1.47) | 1.99×10⁻²⁷ | |
| p for trend | 3.03×10–37 | 1.65×10⁻²⁹ | |||||
| Women | Per 5 years increase | 201032 (10838) | 1393562 | 1.15 (1.13–1.17) | 1.80×10–53 | 1.13 (1.11–1.15) | 1.35×10–41 |
| Category | |||||||
| Biologically younger | 123648 (6229) | 861570 | Ref. | Ref. | |||
| Biologically older | 77384 (4609) | 531993 | 1.26 (1.22–1.31) | 5.91×10⁻³³ | 1.23 (1.18–1.28) | 2.71×10⁻²⁵ | |
| Quintiles‡ | |||||||
| Low | 40207 (1946) | 281912 | Ref. | Ref. | |||
| Intermediate | 120618 (6351) | 836341 | 1.15 (1.09–1.21) | 1.46×10⁻⁷ | 1.13 (1.07–1.18) | 5.89×10⁻⁶ | |
| High | 40207 (2541) | 275309 | 1.46 (1.38–1.55) | 2.54×10–36 | 1.40 (1.32–1.49) | 5.94×10⁻²⁸ | |
| p for trend | 4.23×10–37 | 1.36×10⁻²⁸ | |||||
-
*
Cox proportional hazards regression adjusted for Model 1, as well as cancer polygenic risk score and healthy lifestyle.
-
†
Defined by quintiles of PhenoAgeAccel: low (the bottom quintile), intermediate (quintiles 2–4), and high (the top quintile).
-
‡
Cox proportional hazards regression adjusted for age, height, cancer family history, Townsend deprivation index at recruitment, and the first 10 principal components of ancestry.
-
CI, confidence interval; HR, hazards ratio; Ref, reference.
Table 3
Risk of incident cancer according to Phenotypic Age Acceleration (PhenoAgeAccel) categories within each genetic risk level*.
| Gender | PhenoAgeAccel category | Low genetic risk | Intermediate genetic risk | High genetic risk | |||||
|---|---|---|---|---|---|---|---|---|---|
| Biologically younger | Biologically older | Biologically younger | Biologically older | Biologically younger | Biologically older | ||||
| Men | No. of cases/Person years | 668/114962 | 1031/124526 | 2606/338950 | 4012/376782 | 1375/110907 | 1840/124502 | ||
| Hazards ratio | Ref. | 1.29 (1.17–1.42) | Ref. | 1.27 (1.21–1.33) | Ref. | 1.10 (1.02–1.18) | |||
| (95% CI) | |||||||||
| p value | 3.53×10⁻⁷ | 3.15×10⁻²¹ | 1.07×10⁻² | ||||||
| Absolute risk (%)- 5 years (95% CI) | 2.71 (2.49–2.94) | 3.87 (3.60–4.14) | 3.57 (3.41–3.72) | 4.95 (4.78–5.13) | 5.78 (5.44–6.11) | 6.90 (6.55–7.26) | |||
| Absolute risk increase (%)- 5 years (95% CI) | Ref. | 1.16 (0.84–1.46) | Ref. | 1.39 (1.19–1.60) | Ref. | 1.13 (0.68–1.52) | |||
| Women | No. of cases/Person years | 1030/173195 | 761/106937 | 3579/518611 | 2704/318753 | 1620/169764 | 1144/106303 | ||
| Hazards ratio | Ref. | 1.25 (1.14–1.38) | Ref. | 1.30 (1.24–1.37) | Ref. | 1.19 (1.10–1.28) | |||
| (95% CI) | |||||||||
| p value | 2.65×10⁻⁶ | 1.84×10⁻²⁴ | 8.19×10⁻⁶ | ||||||
| Absolute risk (%) - 5 years (95% CI) | 2.83 (2.63–3.02) | 3.39 (3.12–3.65) | 3.27 (3.15–3.39) | 4.02 (3.86–4.19) | 4.58 (4.33–4.83) | 5.17 (4.84–5.49) | |||
| Absolute risk increase (%)- 5 years (95% CI) | Ref. | 0.56 (0.26–0.86) | Ref. | 0.76 (0.57–0.93) | Ref. | 0.59 (0.23–0.98) | |||
-
*
Cox proportional hazards regression is adjusted for age, height, family history of cancer, Townsend deprivation index, height, and the first 10 principal components of ancestry.
-
CI, confidence interval; Ref, reference.
Additional files
-
Supplementary file 1
Supplementary Tables a - k for additional results.
(a) Association results of Phenotypic Age Acceleration (PhenoAgeAccel) with site-specific cancer risk per 5 years increased. (b) Sensitivity analysis of association between different risk levels of PhenoAgeAccel and cancer risk. (c) Sensitivity analysis of association between PhenoAgeAccel and cancer risk by excluding of patients diagnosed in the first two follow-ups. (d) Sensitivity analysis of association between PhenoAgeAccel and cancer risk in unimputed data. (e) Sensitivity analysis of association between PhenoAgeAccel and cancer risk in the unrelated white British population. (f) Sensitivity analysis of association between PhenoAgeAccel and cancer risk using retrained PhenoAge in cancer-free participants. (g) Relative excess risk due to interaction (RERI) and attributable proportion (AP) for additive interaction between genetic and PhenoAgeAccel categories. (h) Risk of incident cancer according to PhenoAgeAccel categories within each genetic risk level. (i) PhenoAgeAccel of participants stratified by lifestyle factors. (j) Association results of PhenoAgeAccel with lifestyle factors of participants. (k) RERI and AP for additive interaction between genetic and lifestyle factors on PhenoAgeAccel.
- https://cdn.elifesciences.org/articles/91101/elife-91101-supp1-v1.docx
-
MDAR checklist
- https://cdn.elifesciences.org/articles/91101/elife-91101-mdarchecklist1-v1.docx
Download links
A two-part list of links to download the article, or parts of the article, in various formats.
Downloads (link to download the article as PDF)
Open citations (links to open the citations from this article in various online reference manager services)
Cite this article (links to download the citations from this article in formats compatible with various reference manager tools)
Associations of combined phenotypic aging and genetic risk with incident cancer: A prospective cohort study
eLife 13:RP91101.
https://doi.org/10.7554/eLife.91101.3


