UFMTrack, an Under-Flow Migration Tracker enabling analysis of the entire multi-step immune cell extravasation cascade across the blood-brain barrier in microfluidic devices
- Theodor Kocher Institute, Switzerland
- Data Science Lab, Switzerland
- Laboratory for High Energy Physics, University of Bern, Switzerland
Figures
Figure 1
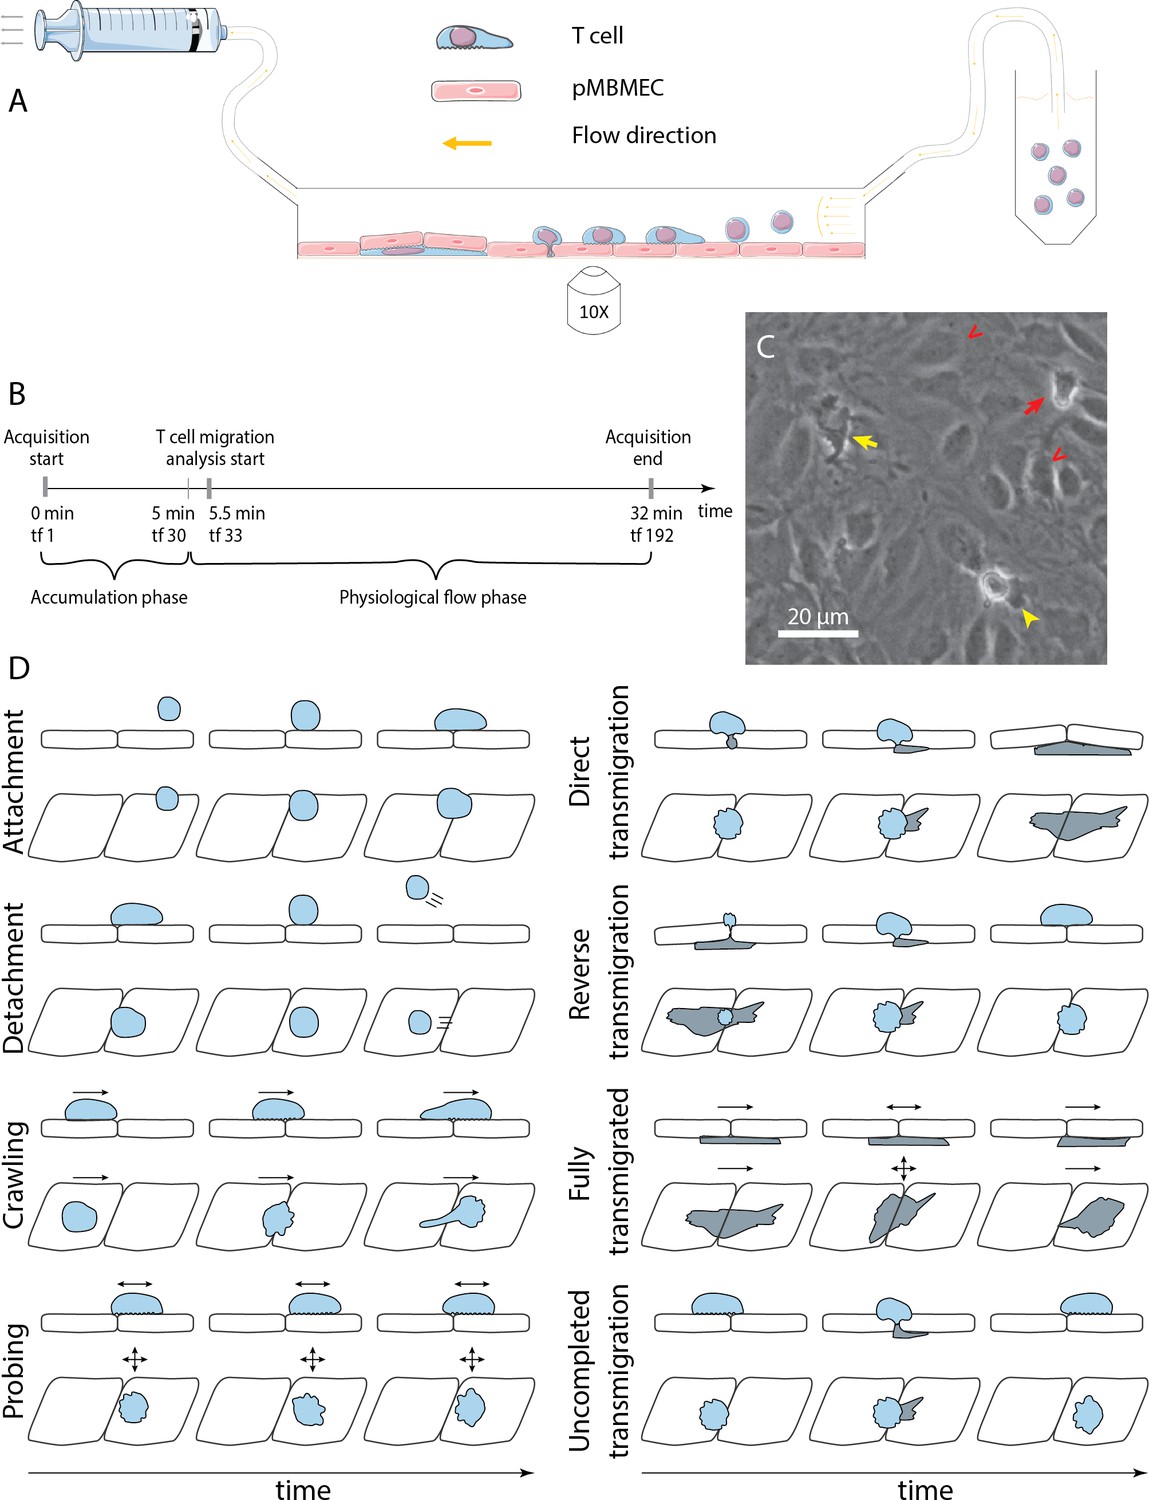
In vitro analysis of the multistep cascade of T-cell migration across the blood-brain barrier (BBB) model under physiological flow.
(A) In vitro under-flow assay setup. T cells were perfused on top of the primary mouse brain microvascular endothelial cell (pMBMEC) monolayer, and their migration under flow was observed using phase-contrast imaging modality. Imaging was performed with a time step of 10 s/time frame. (B) In vitro flow assay timeline. During the accumulation phase under flow with the shear stress of 0.1 dynes/cm2, T cells adhered to the pMBMEC monolayer. After 5 min (time frame 30), the shear stress was increased to 1.5 dynes/cm2, leading to rapid detachment of not firmly adhering T cells. Analysis of the post-arrest T-cell behavior was thus starting at 5.5 min (time frame 33). tf = time frame. (C) Example of phase-contrast imaging data. Red arrow – crawling T cell; yellow arrow – fully transmigrated T cell; yellow arrowhead – transmigrated part of a partially transmigrated T cell; red V arrowheads – pMBMECs. Scale bar is 20 µm. (D) Schematic representation of distinct T-cell behavior regimes detected and analyzed using the developed under-flow migration tracker (UFMTrack) framework. Crawling cells migrate continuously while probing cells interact with the pMBMECs and move around the interaction point within two cell size (20 µm) as indicated by the arrows. Side and top views are shown.
Figure 2
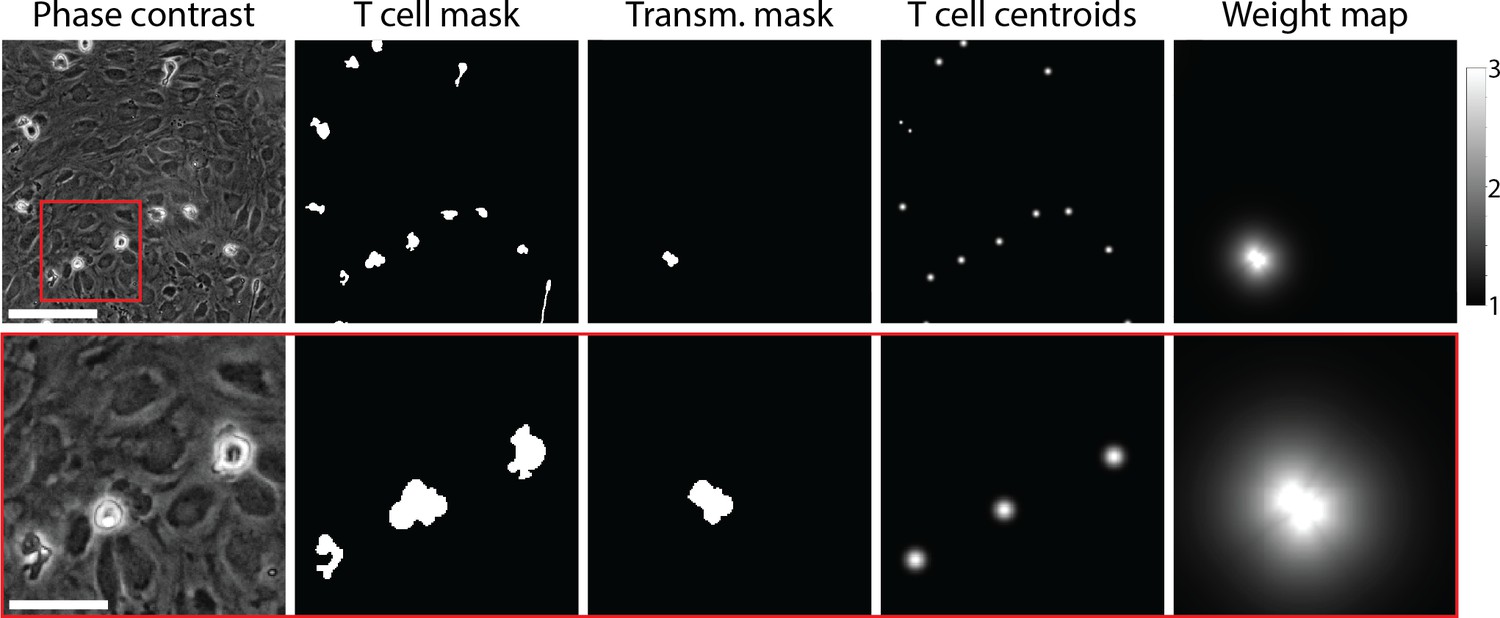
Example of data used for training of the T-cell segmentation model.
From left to right: Phase-contrast microscopy image of T cells migrating on top of the primary mouse brain microvascular endothelial cell (pMBMEC) monolayer; annotated T-cell mask; annotated mask of transmigrated part of T cells; T-cell centroids; weight map. The bottom row shows zoom-in on the highlighted area. Scale bars are 50 µm in the top row and 20 µm in the bottom row.
Figure 3 with 1 supplement

The T-cell tracking pipeline.
(A) Segmentation and centroids of two migrating T cells under flow over time. (B) Nodes corresponding to segmented T cells. Node sizes and colors denote the multiplicity estimate of a node. (C) Nodes, together with links between adjacent in space and time nodes, form a graph. (D) Selected links are obtained with global optimization on the graph. (E) Graph of segments and vertices obtained according to node multiplicity. (F) Resolving global segment multiplicity consistency with global optimization on the graph. Additionally, a search for rapid displacement of segmented T cells due to under-segmentation or flow is performed. (G) Extension of tracks of individual T cells into the track intersection. (H) Resolving track intersections.
Figure 3—figure supplement 1
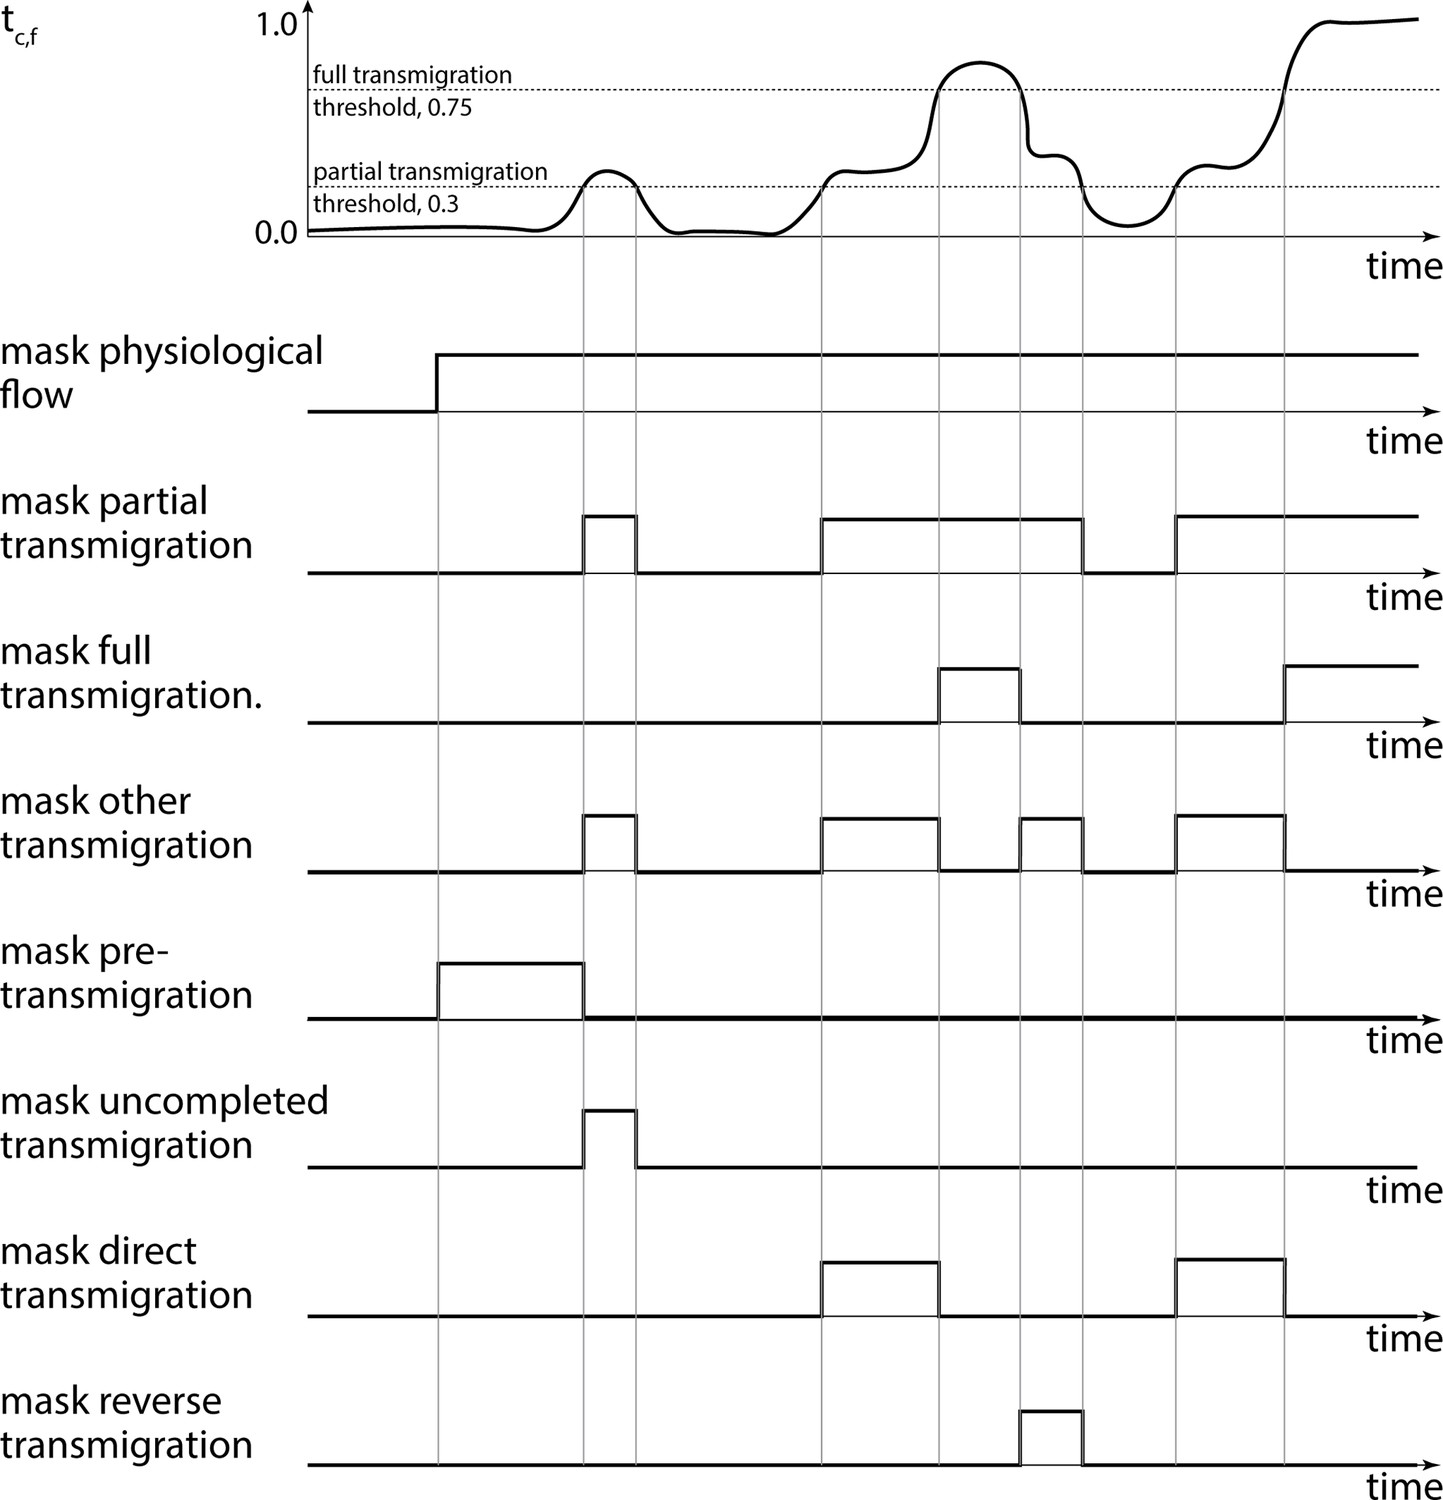
Transmigration detection.
Based on the filtered transmigration factor we obtained Boolean masks for partial and full transmigration. Next, we obtained Boolean masks for T-cell migration before and during uncompleted, direct, full, and reverse transmigrations.
Figure 4
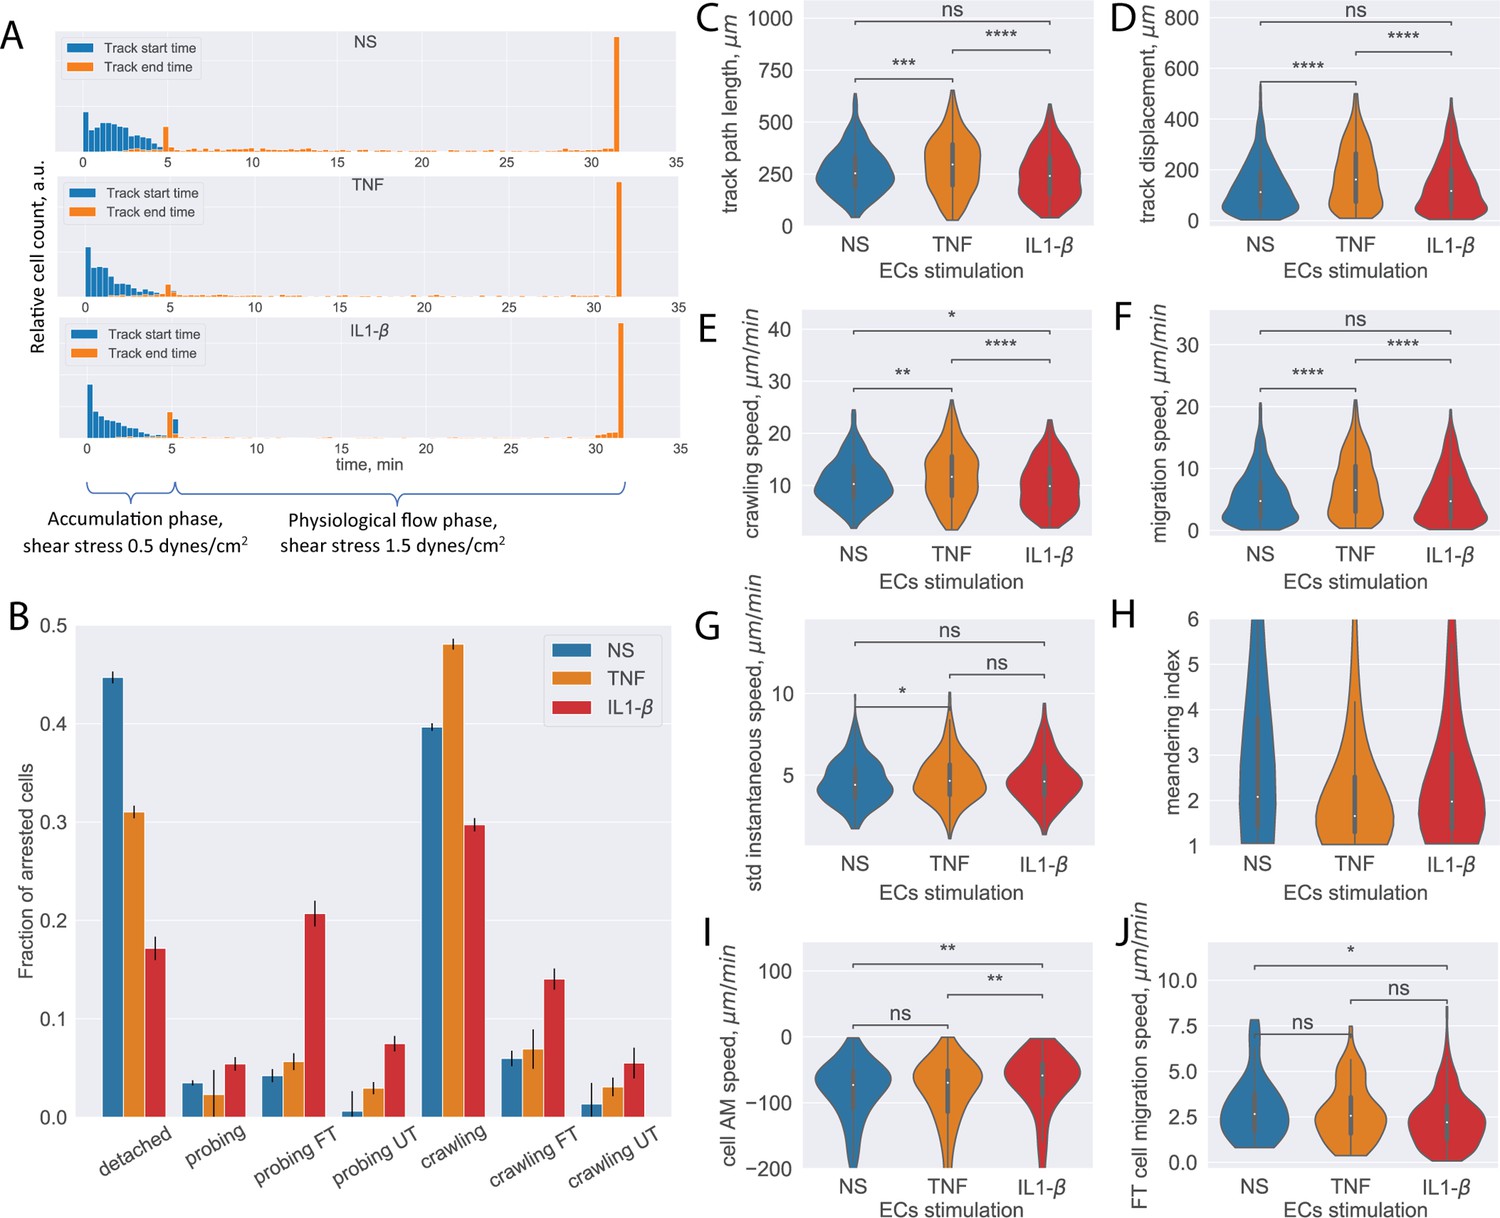
Analysis of CD4+ T-cell tracks.
(A) Start and end time distribution of CD4+ T-cell tracks on non-stimulated or TNF- or IL-1β-stimulated primary mouse brain microvascular endothelial cells (pMBMECs). Under-flow migration tracker (UFMTrack) correctly captures increased T-cell detachment from the non-stimulated pMBMECs after 5 min when the flow is increased to physiological levels. (B) Quantification of CD4+ T-cell behavior in the respective categories obtained on non-stimulated and TNF- and IL-1β-stimulated pMBMECs. Error bars show the statistical error of the mean (see text for details). (C–H) Motility parameters of the crawling CD4+ T cells were obtained for the three endothelial stimulatory conditions. Distributions of T-cell path length (C), displacement (D), crawling speed (path/time) (E), migration speed (displacement/time) (F), variability of instantaneous T-cell crawling speed along the track (standard deviation, G), and meandering index (H). (I) Distribution of CD4+ T-cell accelerated movement (AM) speed is a proxy metric for the T-cell adhesion to the healthy or inflamed endothelium. (J) Migration speed distribution of the transmigrated CD4+ T cells. Stimulation applied to the luminal side of pMBMECs affects T-cell migration at the abluminal side of pMBMECs after their transmigration. FT – T cells performed full transmigration; UT – T cells performed uncompleted transmigration. Statistical tests are performed with the Mann-Whitney U test. Statistical significance is indicated as follows: ns – Not significant (p > 0.05); * – p ≤ 0.05; ** – p ≤ 0.01; *** – p ≤ 0.001; **** – p ≤ 0.0001.
Figure 5 with 1 supplement
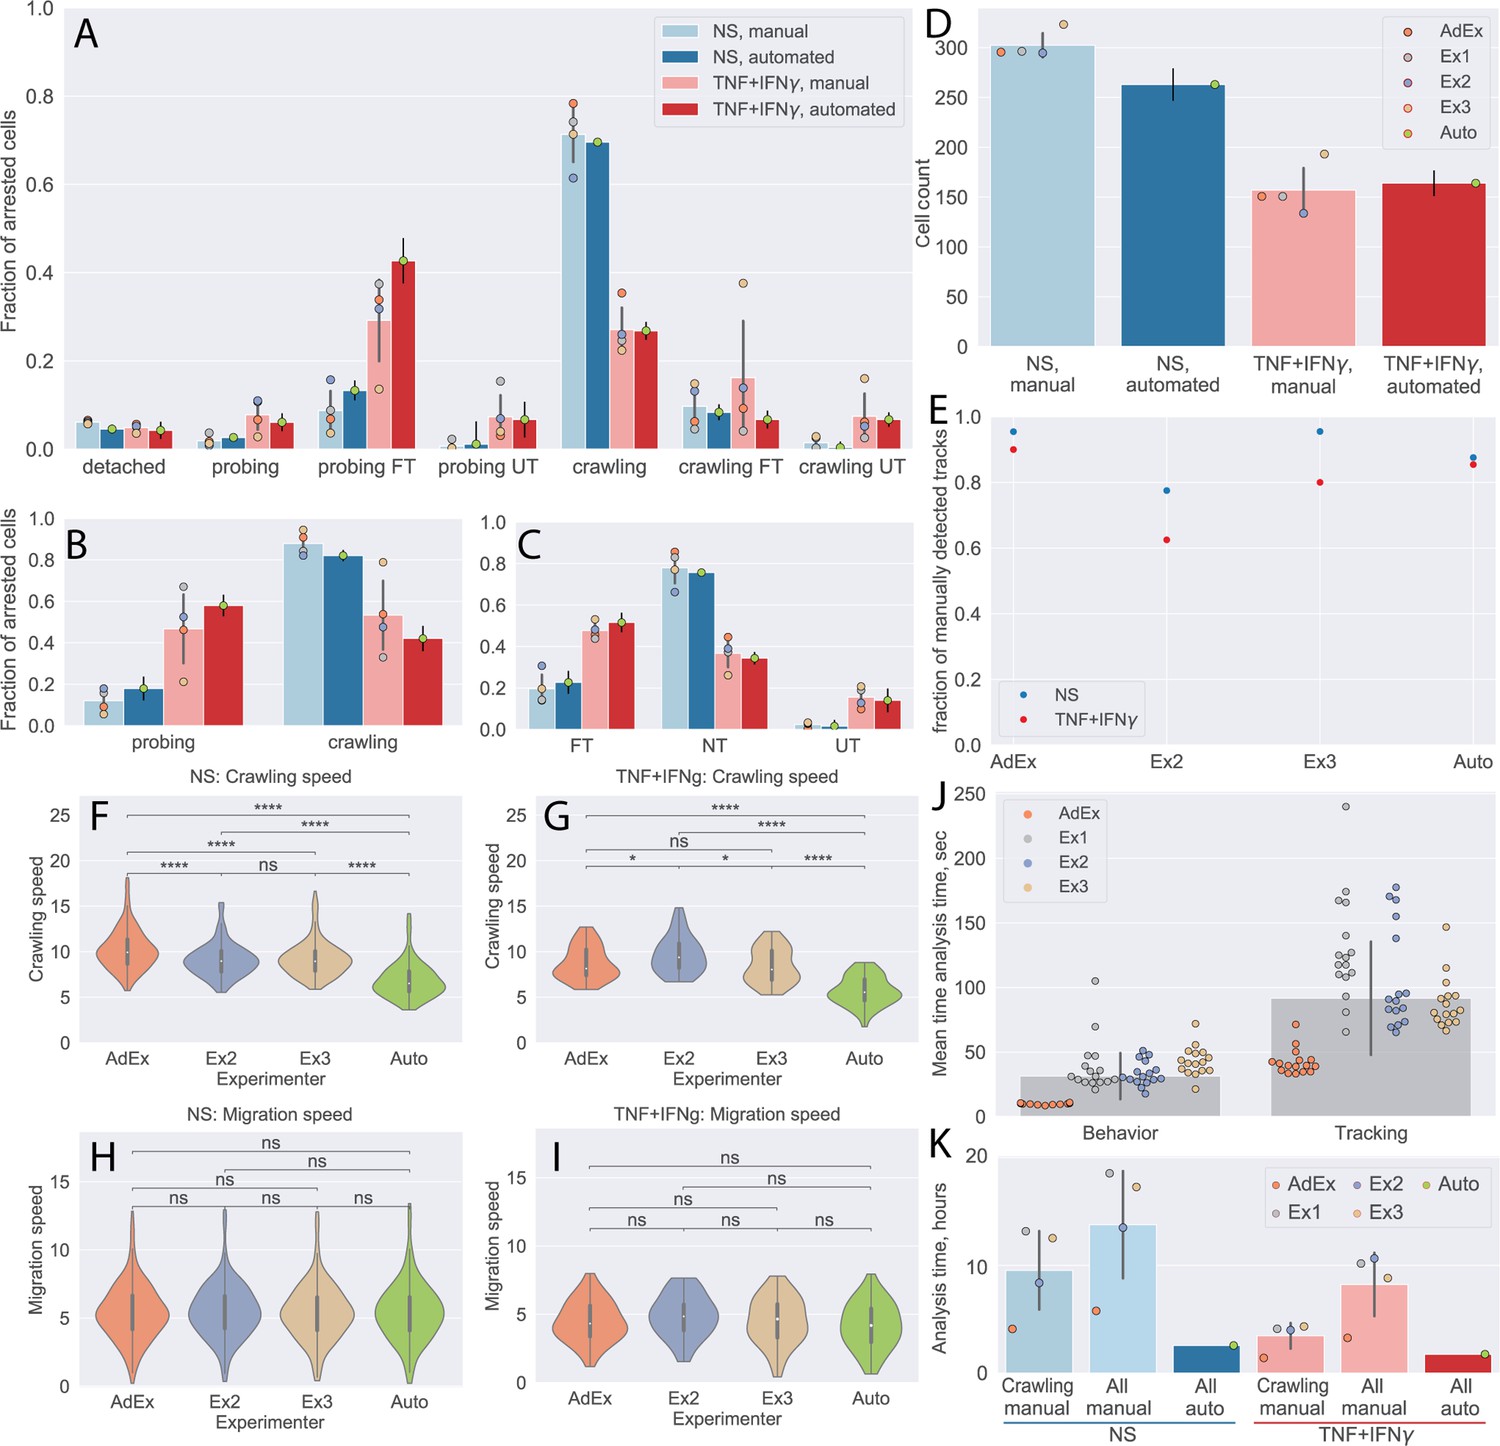
Comparison of automated analysis with under-flow migration tracker (UFMTrack) and manual analysis of the CD8+ T-cell tracks.
(A–C) CD8+ T-cell behavior statistic obtained for non-stimulated (NS) and cytokine-stimulated primary mouse brain microvascular endothelial cells (pMBMECs) as obtained manually by four experimenters, as well as automatically with UFMTrack. (A) Quantification of CD8+ T-cell behavior in the respective categories obtained on non-stimulated and TNF/interferon-gamma (TNF/IFN-γ)-stimulated pMBMECs is consistent with results obtained by manual frame-by-frame analysis. Cytokine stimulation of pMBMECs increases T-cell probing behavior (B) and T-cell transmigration rate (C). Error bars show the standard deviation of the manual analysis and the statistical error of the mean for automated analysis. Points correspond to individual experimenters. (D) Counts of CD8+ T cells were obtained manually by four experimenters and automatically by UFMTrack. The T-cell detection efficiency is above 90%. Error bars show the standard deviation of the manual analysis and the statistical error of the mean for the automated analysis. Points correspond to individual experimenters. (E) Detection efficiency of crawling CD8+ T-cell tracks between the manual and automated analysis. (F–I) Comparison of CD8+ T-cell crawling speed (path/time) (F, G) and migration speed (displacement/time) (H, I) on non-stimulated (F, H) and cytokine-stimulated (G, I) pMBMECs. The T-cell position assignment error in manual tracking leads to biased crawling speed estimation. (J) Comparison of the analysis time (per cell) required for behavior analysis and tracking of CD8+ T cells. (K) Total analysis time (per dataset) for behavior analysis and tracking of CD8+ T cells. Comparison is shown for manual analysis with tracking of crawling cells only (crawling manual), the time estimate for manual analysis with tracking of all cells (all manual), and the in-depth automated analysis of all cell tracks with UFMTrack (all auto). FT – T cells performed full transmigration; UT – T cells performed uncompleted transmigration; NT – T cells did not perform transmigration. Statistical tests are performed with the Mann-Whitney U test. Statistical significance is indicated as follows: ns – Not significant (p > 0.05); * – p ≤ 0.05; ** – p ≤ 0.01; *** – p ≤ 0.001; **** – p ≤ 0.0001.
Figure 5—figure supplement 1
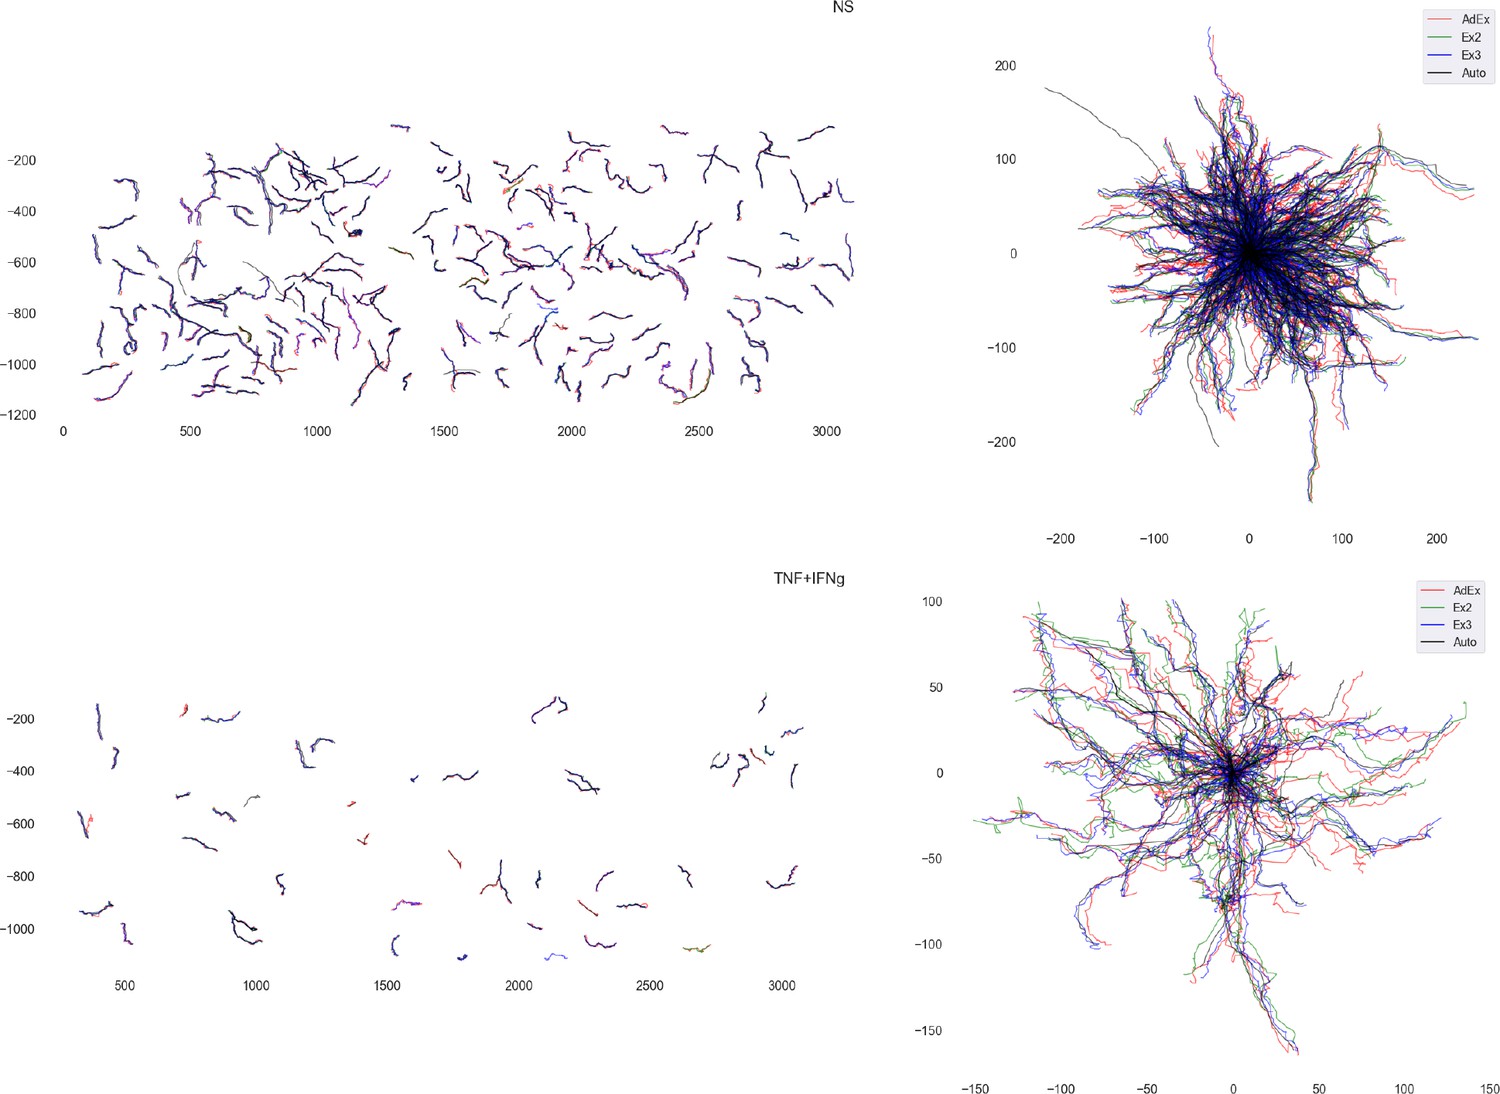
Comparison of reconstructed T-cell tracks with the result of manual analysis.
Overlay of crawling CD8+ T-cell crawling tracks on top of non-stimulated (top) and TNF/interferon-gamma (TNF/IFNγ)-stimulated primary mouse brain microvascular endothelial cells (pMBMECs) (bottom) tracked manually by three experimenters as well as automatically. Errors in manual tracking led to a jittery pattern in the T-cell tracks. This lead, in turn, to the overestimation of the T-cell crawling speed.
Figure 6 with 1 supplement
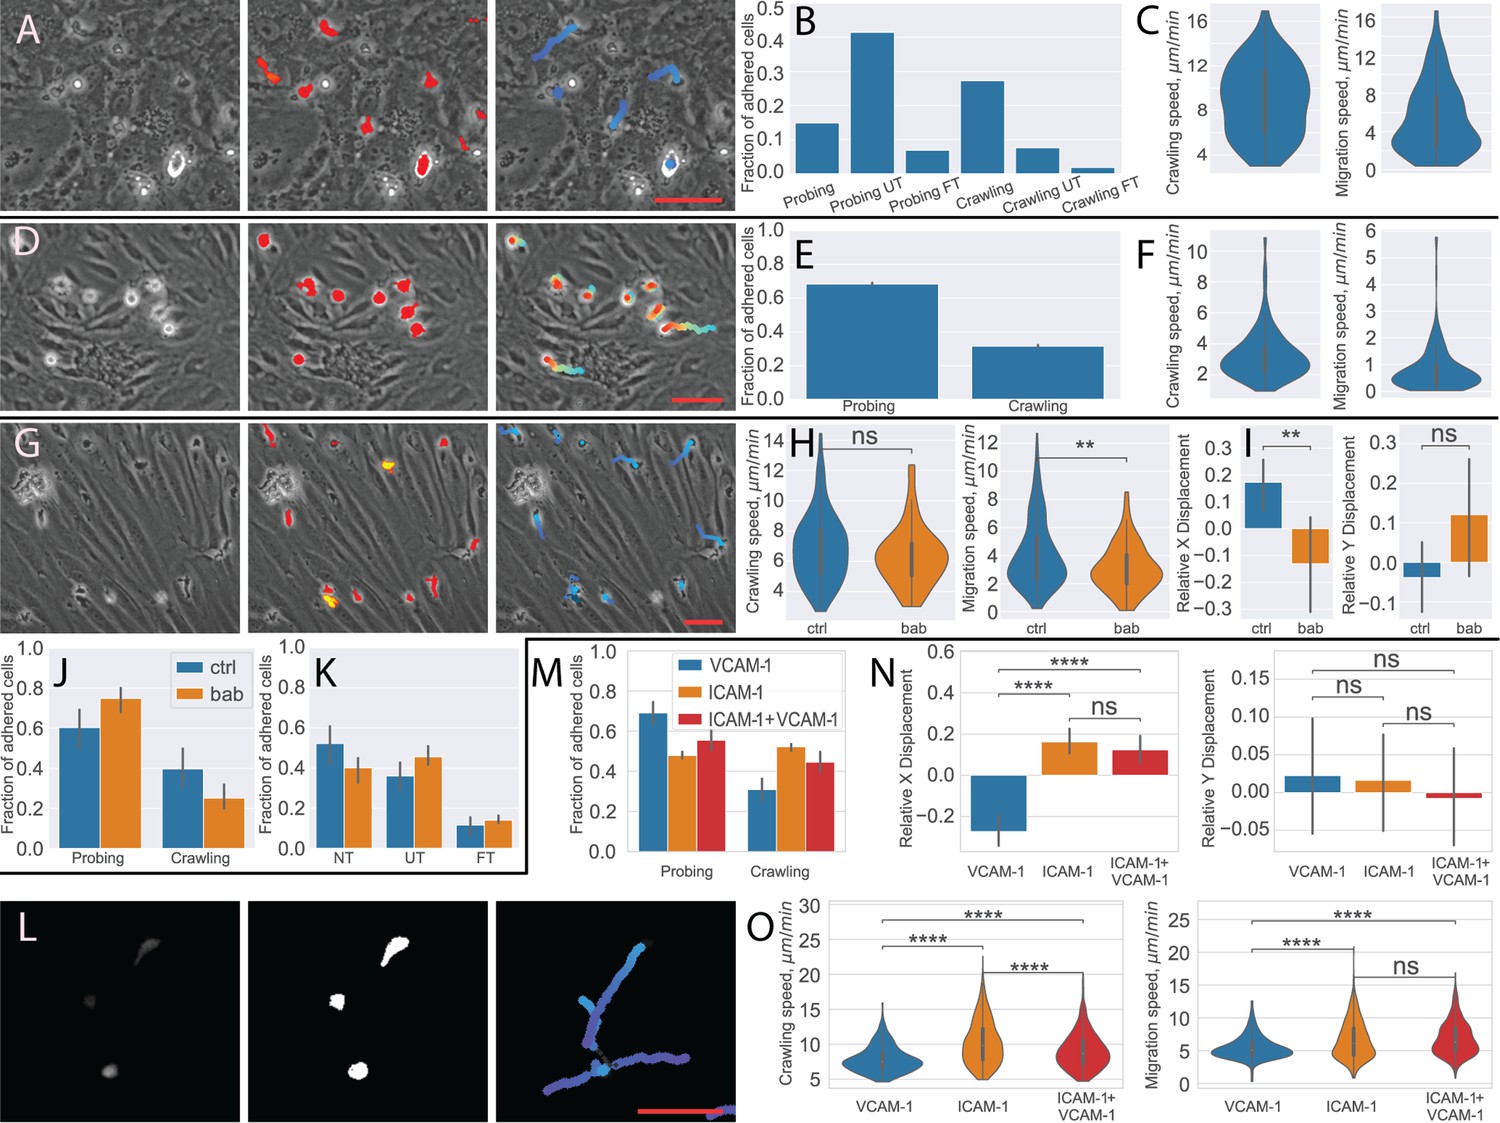
Analysis of different blood-brain barrier (BBB) models with under-flow migration tracker (UFMTrack).
(A–C) Human peripheral blood mononuclear cells (PBMCs) interacting with human brain microvascular endothelial cells (HBMEC). (A) Raw image frame, segmentation, and tracking results. (B) PBMCs behavior distribution. (C) Crawling and migration speed distribution. (D–F) Bone marrow-derived macrophages (BMDM) interacting with the primary mouse brain microvascular endothelial cell (pMBMEC) monolayer. (D) Raw image frame, segmentation, and tracking results. (E) BMDM crawling vs probing behavior distribution. (F) Crawling and migration speed distribution. (G–K) Human T cells interacting with the extended endothelial cell culture method brain microvascular endothelial cell (EECM-BMEC) monolayer. (G) Raw image frame, segmentation, and tracking results. (H) Crawling and migration speed distributions for the control condition (ctrl) and with the blocking anti-bodies (bab). (I) X and Y relative cell displacement. (J) Crawling vs probing behavior comparison. (K) Transmigrations behavior comparison. (L–O) Human T cells interacting with immobilized recombinant BBB adhesion molecules. (L) Raw fluorescent image frame, thresholding-based segmentation, and tracking results. (M) Crawling vs probing behavior distribution. (N) X and Y relative displacement (O). Crawling vs probing speed comparison. Scale bars = 50 µm. Statistical tests are performed with the Mann-Whitney U test. Statistical significance is indicated as follows: ns – Not significant (p > 0.05); * – p ≤ 0.05; ** – p ≤ 0.01; *** – p ≤ 0.001; **** – p ≤ 0.0001.
Figure 6—figure supplement 1

Comparison of sizes of crawling cells.
Under-flow migration tracker (UFMTrack) is able to successfully reconstruct tracks of migrating cells of different sizes. CD4 and CD8 – mouse CD4+ and CD8+ cells, BMDM – bone marrow-derived macrophages, hT – human T cells, hPBMC – human peripheral blood mononuclear cells. The statistical tests are performed with the Mann-Whitney U test. Statistical significance is indicated as follows: ns – Not significant (p > 0.05); * – p ≤ 0.05; ** – p ≤ 0.01; *** – p ≤ 0.001; **** – p ≤ 0.0001.
Appendix 1—figure 1
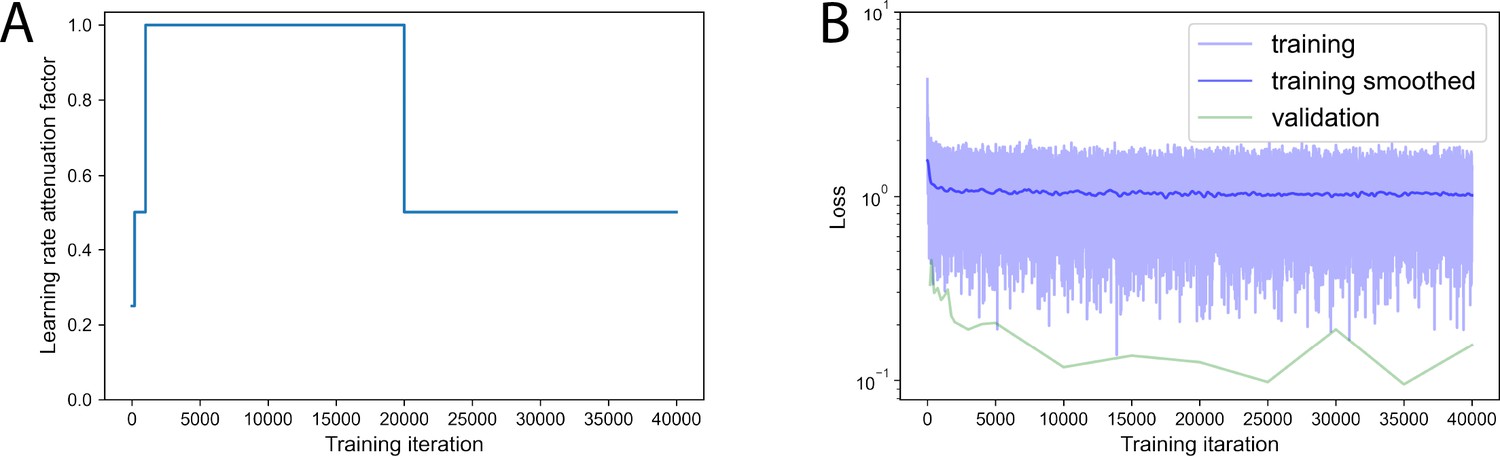
Training curves.
(A) Learning rate attenuation along model training. (B) Loss value evolution along model training.
Appendix 1—figure 2
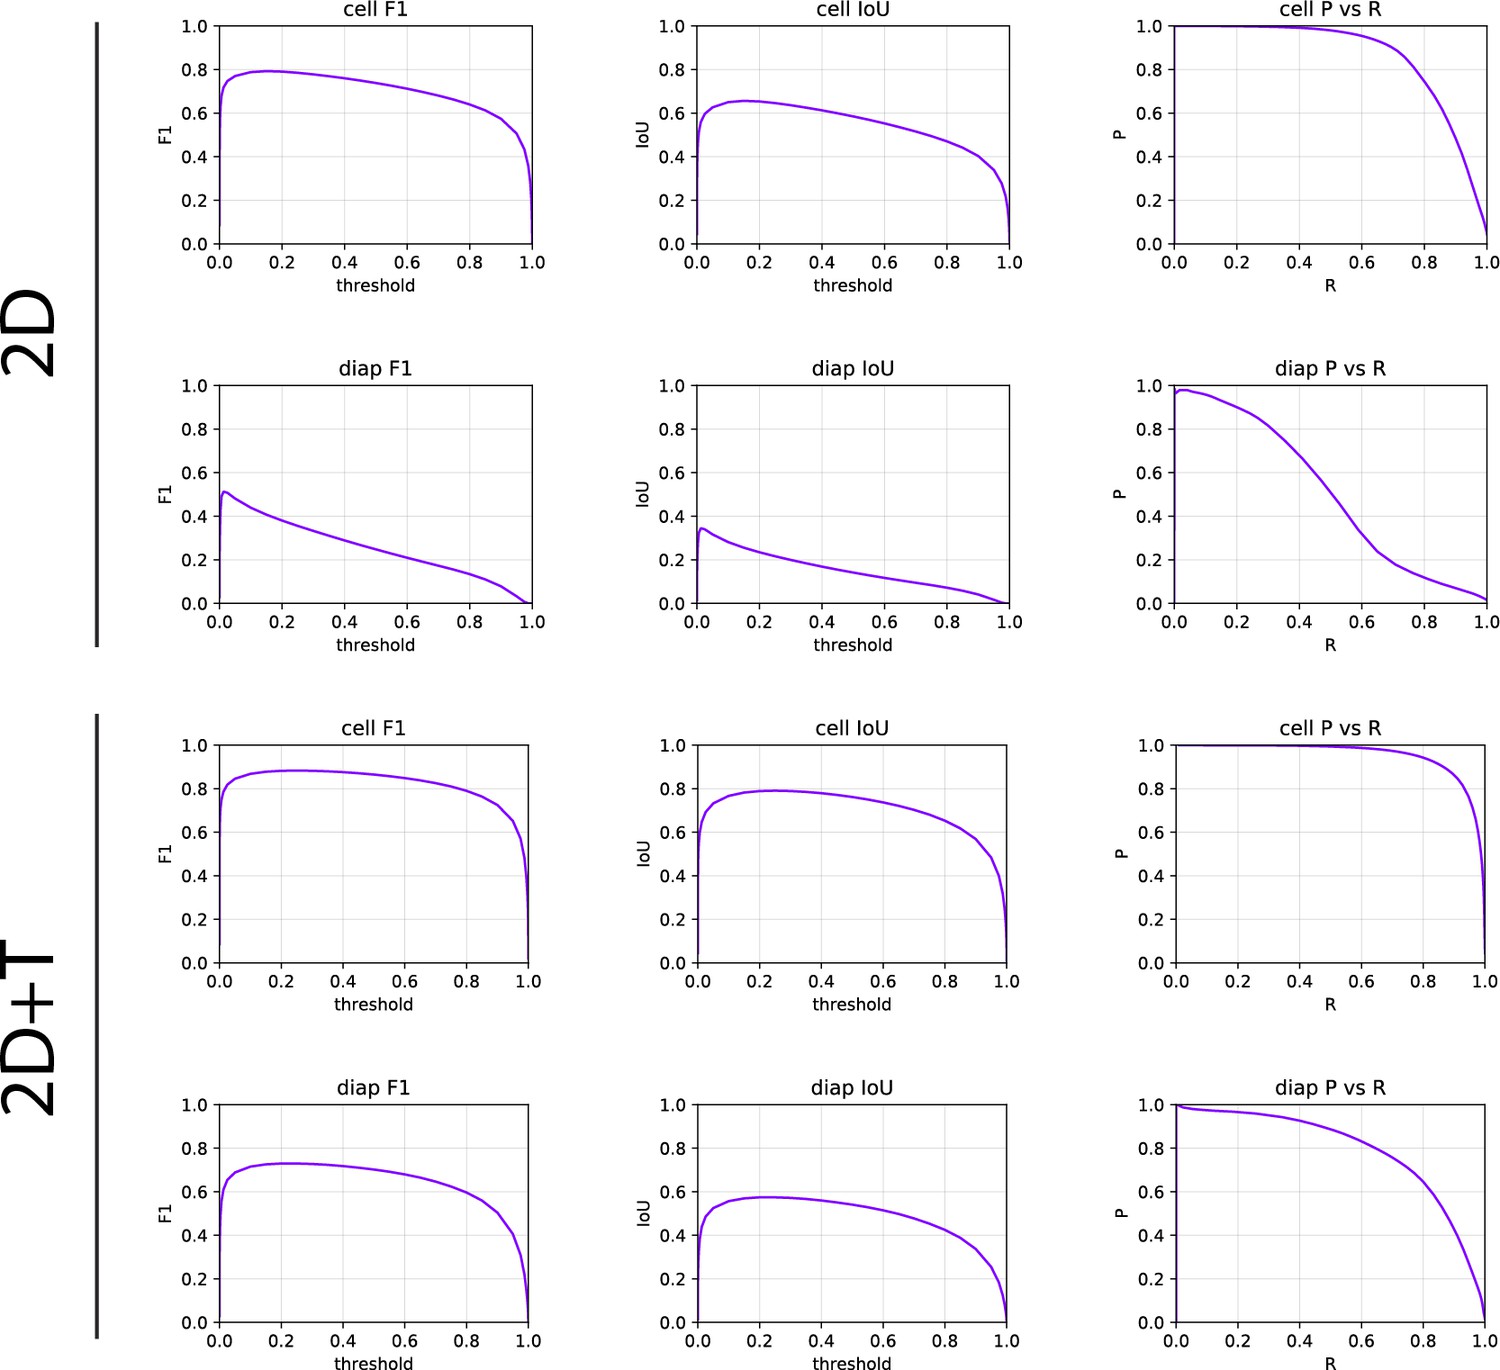
Comparison of the 2D and 2D+T-cell segmentation models’ performance for the T-cell mask and transmigration mask prediction.
F1, Jaccard index and AP metrics are shown.
Appendix 2—figure 1
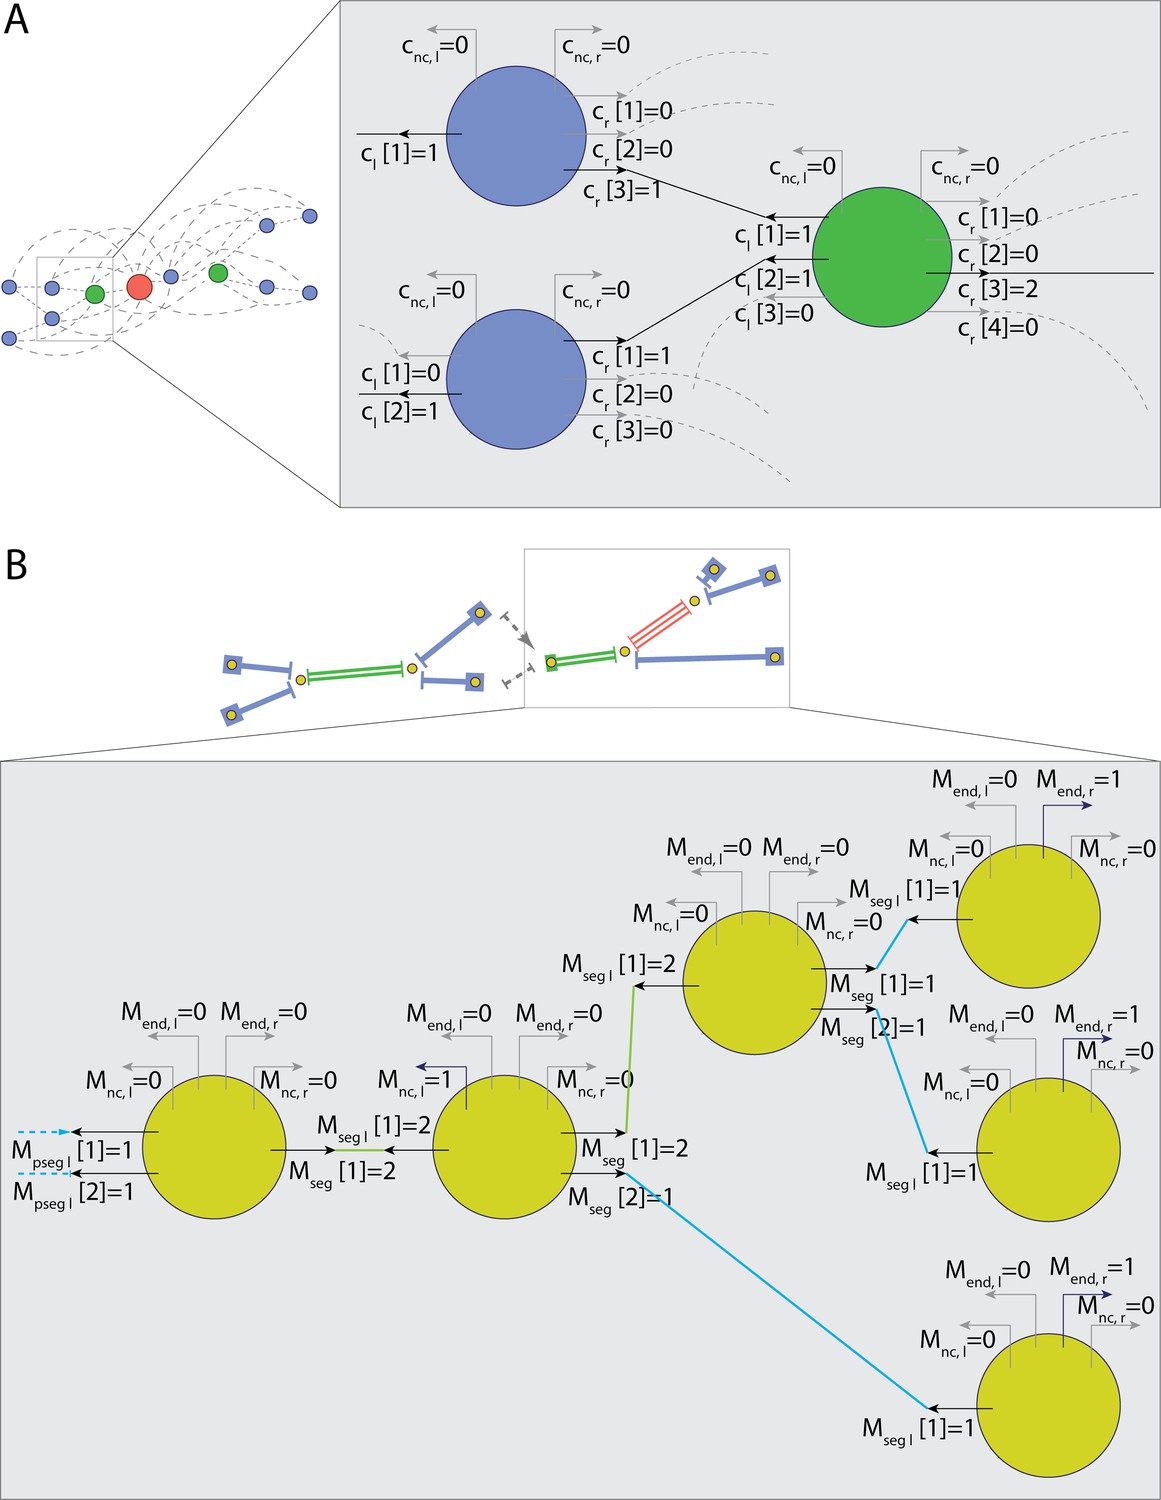
Parametrization of nodes connections for tracking.
(A) Representation of nodes for track segment search. Connection multiplicity for each link is obtained with global optimization. (B) Representation of vertices and segments for global multiplicity consistency optimization. Connection multiplicity for each segment attached to a vertex is obtained with global optimization.
Appendix 2—figure 2
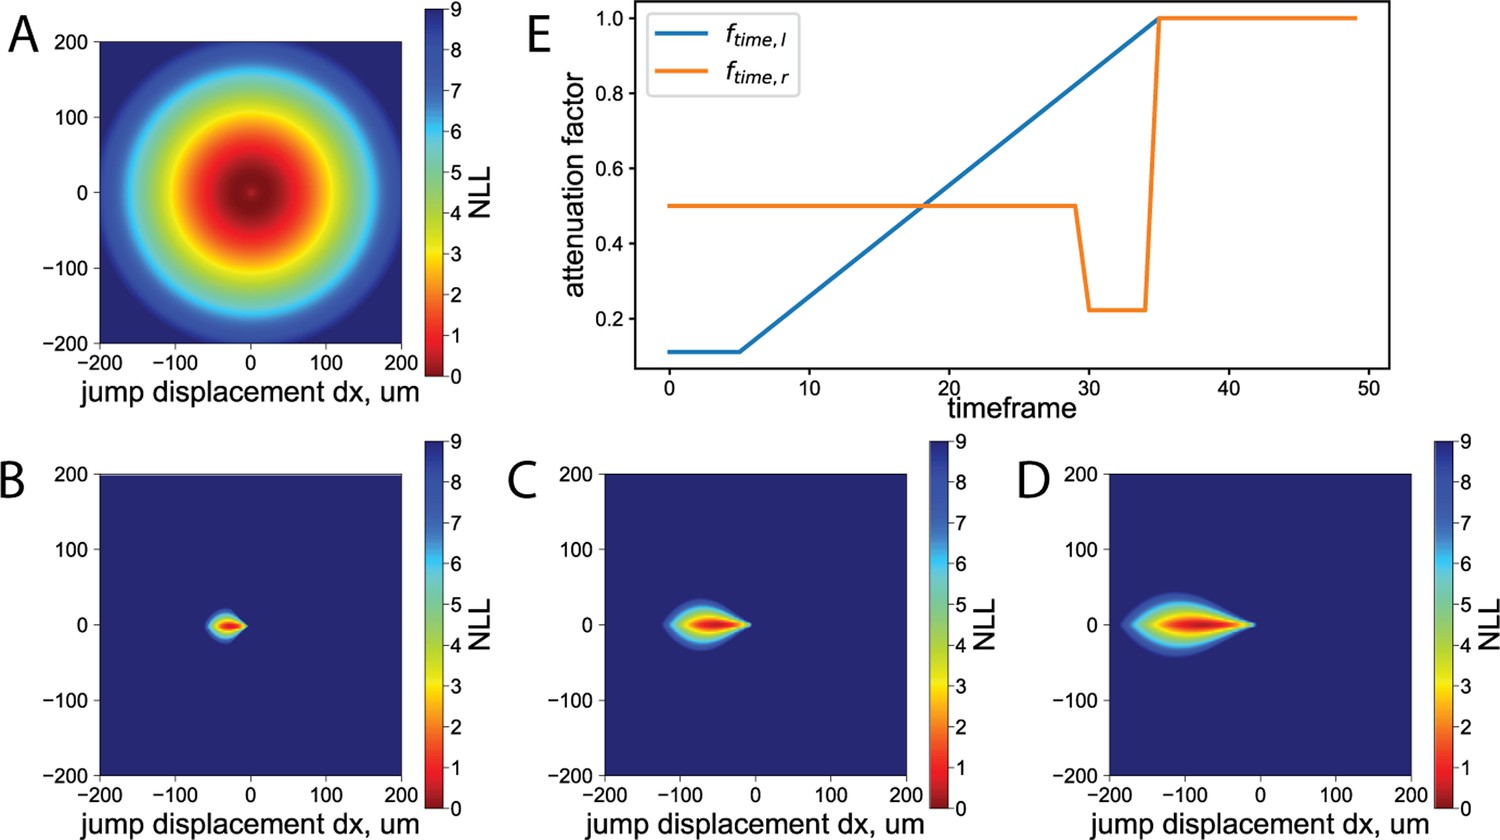
Under-flow tracking parametrization.
(A) Negative log‐likelihood of the potential T-cell jump segments due to under‐segmentation. (B–D) Negative log‐likelihood of the potential T-cell jump segments due to the flow. (B) dt=1, (C) dt=2, (D) dt=3. (E) Attenuation of the vertex ‘not‐connected’ weight with time allows accounting for the T‐cell accumulation phase at time frames 5–30 and increase of the flow to physiological level at time frame 30. The blue curve shows an attenuation factor on the left side, i.e., corresponding to track start, and the orange curve shows an attenuation factor on the right side corresponding to the end of the track due to cell detachment under the flow.
Videos
Video 1
Phase-contrast time-lapse image sequence of CD4 T cells interacting with IL-1β-stimulated endothelium.
Eight tiles of the imaging are aligned and stitched together.
Video 2
Segmented T cells in the phase-contrast time-lapse image sequence of CD4 T cells interacting with IL-1β-stimulated endothelium.
The mask of the segmented T cell is overlayed in red. The transmigration probability map is overlayed in yellow.
Video 3
Tracks of T cells reconstructed in the phase-contrast time-lapse image sequence of CD4 T cells interacting with IL-1β-stimulated endothelium.
Tracks are shown after the flow was increased to a shear stress level of 1.5 dynes/cm2. All videos are shown accelerated by a factor of 96 as can be seen on the timestamp label. Only tracks included in the analysis are shown (see text for details). Scale bar = 200 µm.
Tables
Table 1
Comparison of the performance of the 2D and 2D+T models for T-cell segmentation.
| Performance, AP | ||
|---|---|---|
| 2D | 2D+T | |
| T-cell mask | 86.12% | 95.26% |
| Transmigration mask | 50.56% | 82.74% |
Appendix 1—table 1
Architecture of the 2D fully convolutional model for T-cell segmentation.
| # | Operation | Kernel | Stride | DO rate | Output size | Diagram | |
|---|---|---|---|---|---|---|---|
| 1 | Input | 256 × 256 × 1 | 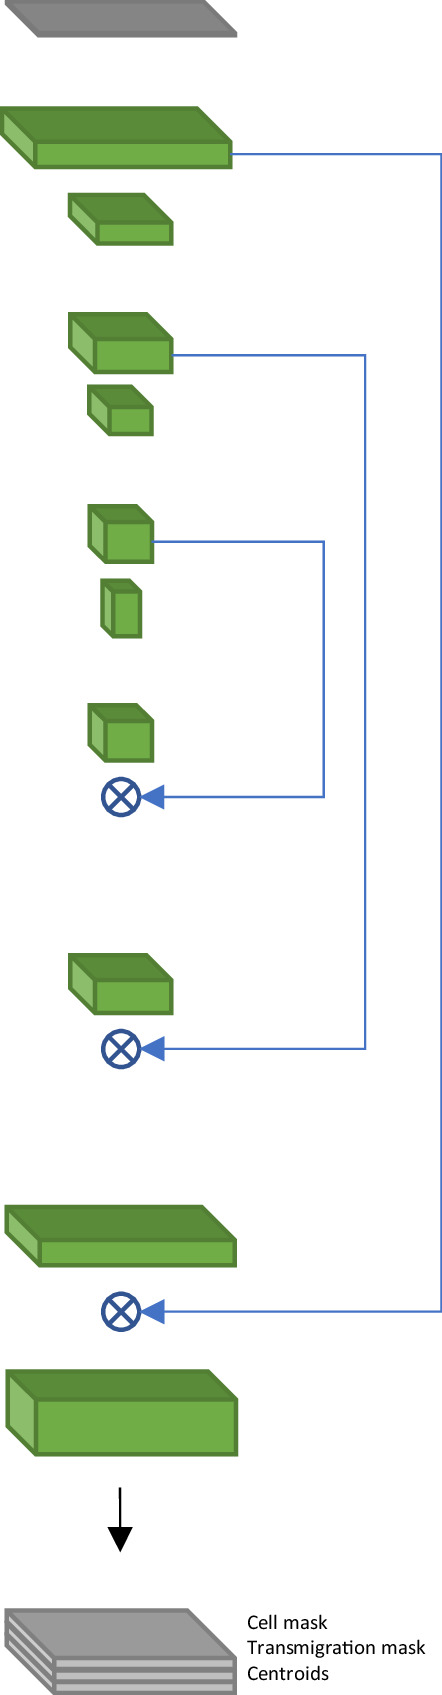  | ||||
| 2 | Conv+LReLU | 7 × 7 | 256 × 256 × 64 | ||||
| 3 | Conv+BN+DO+LReLU | 3 × 3 | 0.2 | 256 × 256 ×64 | |||
| 4 | MP | 2 × 2 | 128 × 128 × 64 | ||||
| 5 | Conv+BN+DO +LReLU | 3 × 3 | 0.2 | 128 × 128 ×128 | |||
| 6 | Conv+BN+DO+LReLU | 3 × 3 | 0.2 | 128 × 128 ×128 | |||
| 7 | MP | 2 × 2 | 64 × 64 × 128 | ||||
| 8 | Conv+BN+DO +LReLU | 3 × 3 | 0.2 | 64 × 64 × 256 | |||
| 9 | Conv+BN+DO +LReLU | 3 × 3 | 0.2 | 64 × 64 × 256 | |||
| 10 | MP | 2 × 2 | 32 × 32 × 256 | ||||
| 11 | Conv+BN+DO+LReLU | 3 × 3 | 0.2 | 32 × 32 × 512 | |||
| 12 | TConv+BN+LReLU | 3 × 3 | 2 × 2 | 64 × 64 × 256 | |||
| 13 | Concat(12, 9) | 64 × 64 × 512 | |||||
| 14 | Conv+BN+DO +LReLU | 3 × 3 | 0.2 | 64 × 64 × 256 | |||
| 15 | Conv+BN+DO +LReLU | 3 × 3 | 0.2 | 64 × 64 × 256 | |||
| 16 | TConv+BN+LReLU | 3 × 3 | 2 × 2 | 128 × 128 ×128 | |||
| 17 | Concat(16, 6) | 128 × 128 ×256 | |||||
| 18 | Conv+BN+ DO +LReLU | 3 × 3 | 0.2 | 128 × 128 ×128 | |||
| 19 | Conv+BN+DO +LReLU | 3 × 3 | 0.2 | 128 × 128 ×128 | |||
| 20 | TConv+BN+LReLU | 3 × 3 | 2×2 | 256×256 × 64 | |||
| 21 | Concat(20, 3) | 256 × 256 ×128 | |||||
| 22 | Conv+BN+DO +LReLU | 3 × 3 | 0.2 | 256 × 256 × 64 | |||
| 23 | Conv+BN+DO +LReLU | 3 × 3 | 0.2 | 256 × 256 ×64 | |||
| 24 | └ | Conv +Sigmoid | 1 × 1 | 256 × 256 × 2 | |||
| 25 | └ | Conv+BN + DO+LReLU | 3 × 3 | 0.1 | 256 × 256 ×16 | ||
| 26 | Conv +SSigmoid | 3 × 3 | 256 × 256 × 1 | ||||
| 27 | Concat(24, 26) | 256 × 256 × 3 | |||||
-
DO – dropout, Conv – Convolution, TConv – transposed convolution, MP – max pooling, BN – batch normalization, Concat – concatenation of outputs of the specified layers, LReLU – leaky rectified linear unit with α=0.05. For the centroids prediction, we scale the output to prevent saturation: SSigmoid(x)=1.1 * Sigmoid(x) – 0.5.
Appendix 1—table 2
Architecture of the 2D+T fully convolutional model for T-cell segmentation.
| # | Operation | Kernel | Stride | DO rate | Output size | Diagram | |
|---|---|---|---|---|---|---|---|
| 1 | Input | 5 × 256 × 256 × 1 | 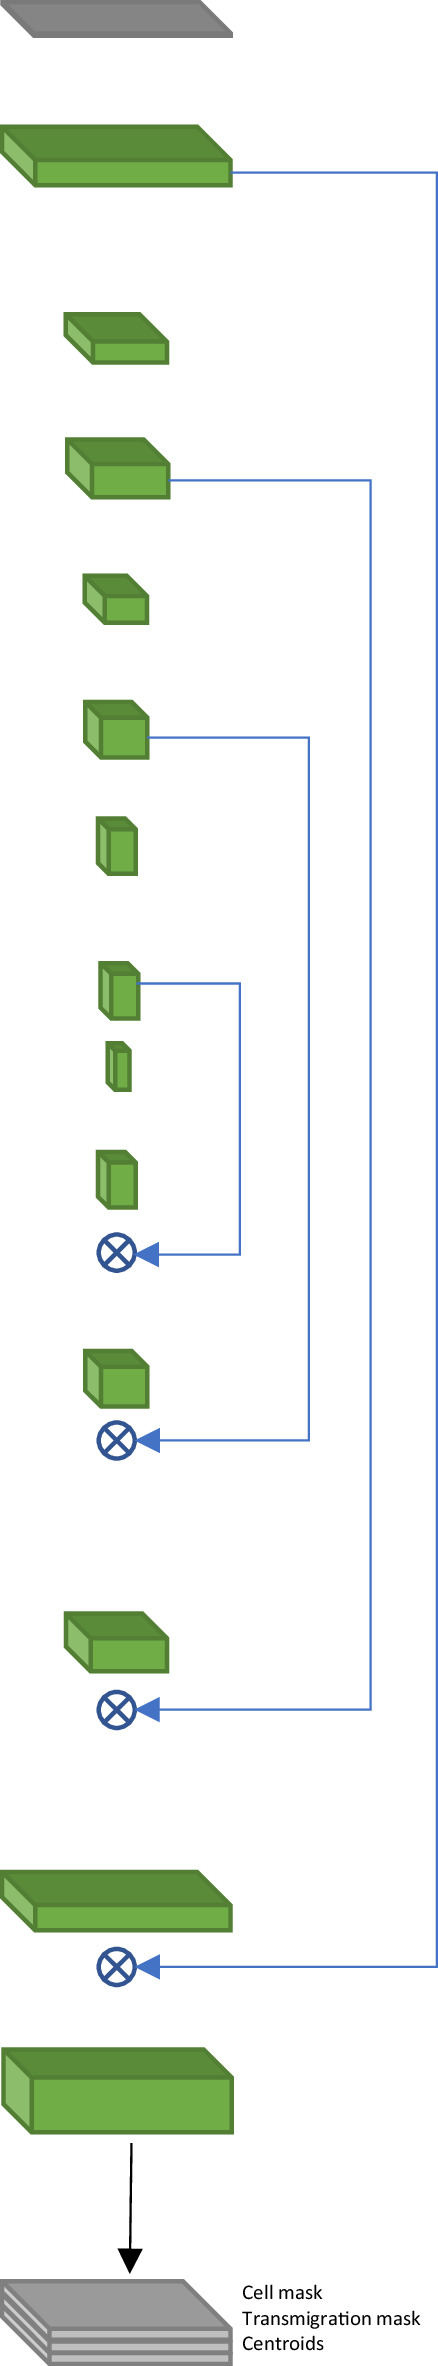 | ||||
| 2 | Conv+LReLU | 1 × 7 × 7 | 5 × 256 × 256 × 64 | ||||
| 3 | Conv+BN+DO+LReLU | 3 × 3 × 3 | 0.2 | 5 × 256 × 256 ×128 | |||
| 4 | └ | ZCrop | 1 × 256 ×256 ×128 | ||||
| 5 | └ | ZCrop | 3 × 256 ×256 ×128 | ||||
| 6 | MP | 1 × 2 × 2 | 3 × 128 × 128 × 128 | ||||
| 7 | Conv+BN+DO +LReLU | 1 × 3 × 3 | 0.2 | 3 × 128 × 128 ×128 | |||
| 8 | Conv+BN+DO+LReLU | 1 × 3 × 3 | 0.2 | 3 × 128 × 128 ×128 | |||
| 9 | └ | ZCrop | 1 ×128 ×128 ×128 | ||||
| 10 | └ | MP | 1×2 × 2 | 3 × 64 × 64 × 128 | |||
| 11 | Conv+BN+DO +LReLU | 1 × 3 × 3 | 0.2 | 3 × 64 × 64 × 256 | |||
| 12 | Conv+BN+DO+LReLU | 3 × 3 × 3 | 0.2 | 3 × 64 × 64 × 512 | |||
| 13 | ZCrop | 1 × 64 × 64 × 512 | |||||
| 14 | MP | 1 × 2× 2 | 1 × 32 × 32 × 512 | ||||
| 15 | Conv+BN+DO +LReLU | 1 × 3 × 3 | 0.2 | 1 × 32 × 32 × 256 | |||
| 16 | Conv+BN+DO+LReLU | 1 × 3 × 3 | 0.2 | 1 × 32 × 32 × 256 | |||
| 17 | MP | 1 × 2 × 2 | 1 × 16 ×16 × 256 | ||||
| 18 | Conv+BN+DO+LReLU | 1 × 3 × 3 | 0.2 | 1 × 16 × 16 × 512 | |||
| 19 | TConv +BN + LReLU | 1 × 3 × 3 | 1 × 2 × 2 | 1 × 32 × 32 × 256 | |||
| 20 | Concat(19, 16) | 1 × 32 × 32 × 512 | |||||
| 21 | Conv +BN + DO +LReLU | 1 × 3 × 3 | 0.2 | 1 × 32 × 32 × 256 | |||
| 22 | TConv +BN + LReLU | 1 × 3 × 3 | 1 × 2 × 2 | 1 × 64 × 64 × 128 | |||
| 23 | Concat(22, 13) | 1 × 64 × 64 × 256 | |||||
| 24 | Conv +BN + DO +LReLU | 1 × 3 × 3 | 0.2 | 1 × 64 × 64 ×128 | |||
| 25 | Conv +BN + DO +LReLU | 1 × 3 × 3 | 0.2 | 1 × 64 × 64 ×128 | |||
| 26 | TConv +BN + LReLU | 1 × 3 × 3 | 1 × 2 × 2 | 1 × 128 ×128×128 | |||
| 27 | Concat(26, 9) | 1 × 128 × 128 × 256 | |||||
| 28 | Conv +BN + DO +LReLU | 1 × 3 × 3 | 0.2 | 1 × 128 × 128 × 128 | |||
| 29 | Conv +BN + DO +LReLU | 1 × 3 × 3 | 0.2 | 1 × 128 × 128 × 128 | |||
| 30 | TConv +BN + LReLU | 1 × 3 × 3 | 1 × 2 × 2 | 1 × 256 × 256 × 64 | |||
| 31 | Concat (30, 4) | 1 × 256 × 256 × 192 | |||||
| 32 | Conv +BN + DO +LReLU | 1 × 3 × 3 | 0.2 | 1 × 256 × 256 × 64 | |||
| 33 | Conv +BN + DO +LReLU | 1 × 3 × 3 | 0.2 | 1×256 × 256 × 64 | |||
| 34 | └ | Conv +Sigmoid | 1 × 1 × 1 | 1 × 256 × 256 × 2 | |||
| 35 | └ | Conv +BN + DO +LReLU | 1 × 3 × 3 | 0.1 | 1 × 256 × 256 × 16 | ||
| 36 | Conv +SSigmoid | 1 × 3 × 3 | 1 × 256 × 256 × 1 | ||||
| 37 | Concat (34, 36) | 1 × 256 × 256 × 3 | |||||
-
DO – dropout, Conv – Convolution, TConv – transposed convolution, MP – max pooling, BN – batch normalization, Concat – concatenation of outputs of the specified layers, ZCrop – crop center along depth dimension, LReLU – leaky rectified linear unit with . For the centroids prediction, we scale the output to prevent saturation: SSigmoid(x)=1.1 * Sigmoid(x) – 0.5.
Appendix 2—table 1
Node variables used in global optimization during link search.
| Name | Description | Type | Range |
|---|---|---|---|
| Multiplicity of the [i]th node connection on the left/right side | Int | 0–m | |
| ith connection on the left/right is selected | Int | 0–1 | |
| Not-connected (NC) connection on the left/right is selected | Int | 0–1 | |
| Absolute difference between right and left multiplicity sum | Int | 0–m |
Additional files
Download links
A two-part list of links to download the article, or parts of the article, in various formats.
Downloads (link to download the article as PDF)
Open citations (links to open the citations from this article in various online reference manager services)
Cite this article (links to download the citations from this article in formats compatible with various reference manager tools)
UFMTrack, an Under-Flow Migration Tracker enabling analysis of the entire multi-step immune cell extravasation cascade across the blood-brain barrier in microfluidic devices
eLife 13:RP91150.
https://doi.org/10.7554/eLife.91150.4


