ESCRT-III-dependent adhesive and mechanical changes are triggered by a mechanism detecting alteration of septate junction integrity in Drosophila epithelial cells
- Univ Rennes, CNRS, IGDR (Institut de Génétique et Développement de Rennes) – UMR 6290, France
- Global Health Institute, School of Life Science, Ecole Polytechnique Fédérale de Lausanne (EPFL), Switzerland
- Department of Developmental Biology and Invertebrate Morphology, Institute of Zoology and Biomedical Research, Jagiellonian University in Krakow, Poland
Figures
Figure 1 with 1 supplement
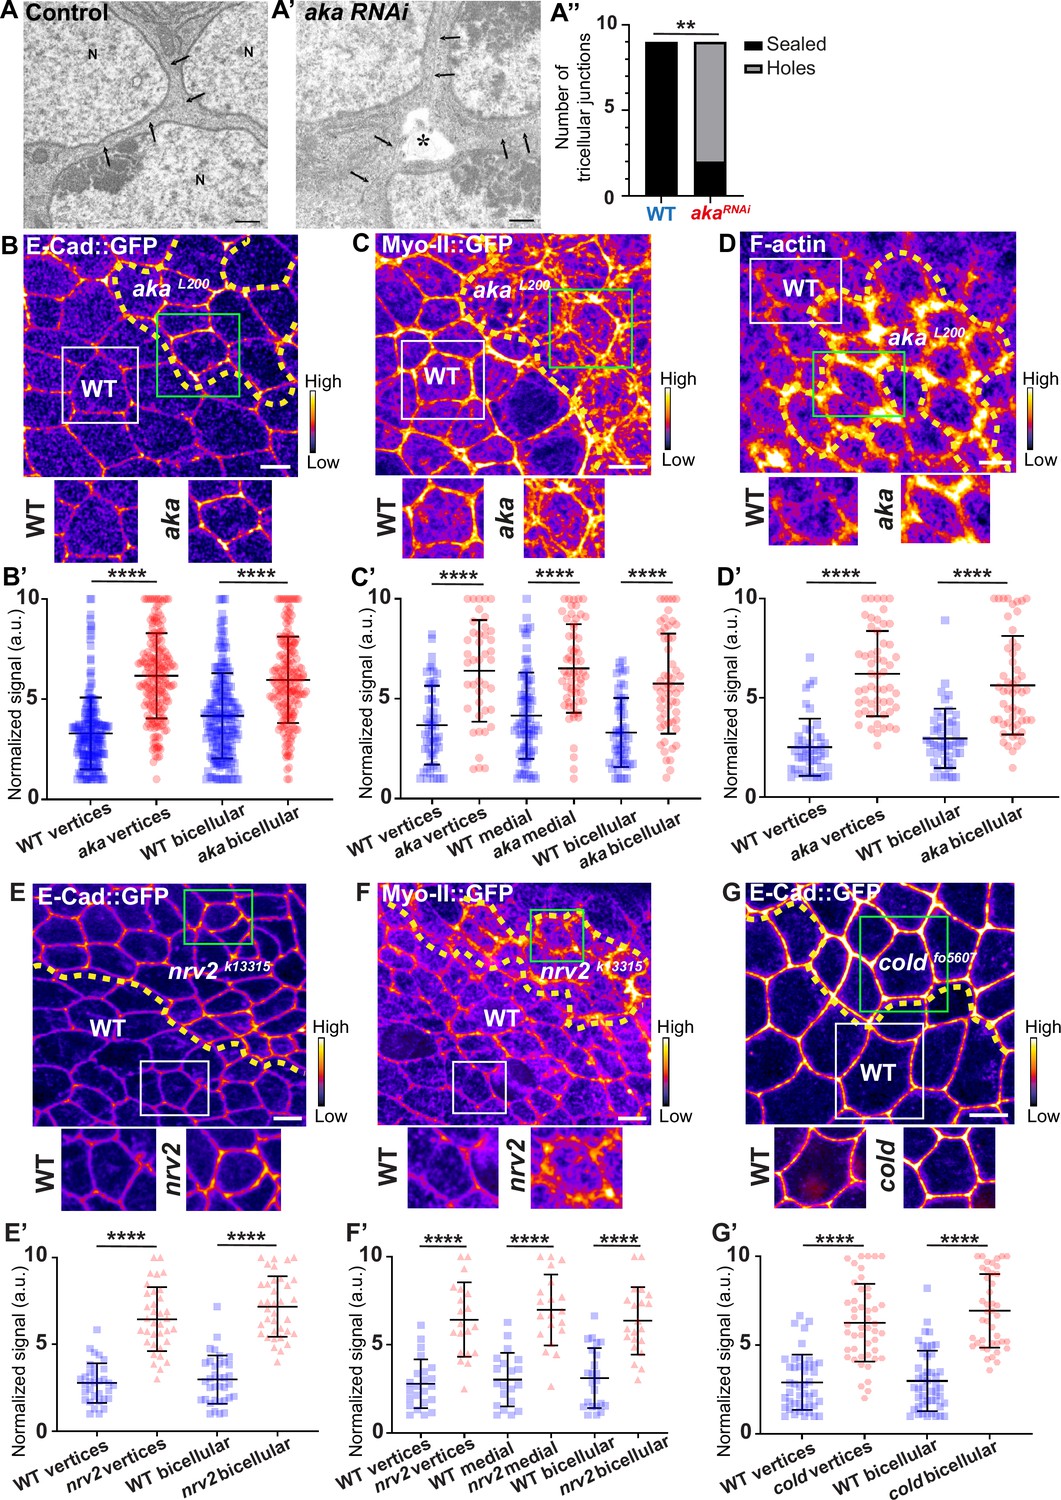
Consequence of loss of Anakonda on tricellular septate junction morphology and adherens junction components.
Transmission electron microscopy of wild-type (A) and aka RNAi (A’) pupal notum. Note that Aka-depleted cells are separated by a large intercellular gap (asterisk) at the tricellular junction at the level of the nucleus. N: cell nucleus; arrows: cell membranes. (A’’) Histogram representing the number of tricellular junctions being sealed (black) or not (grey) (n=9 and n=9 in WT (wild-type) and pnr>Aka-RNAi conditions respectively; n=3 pupae for each conditions). (B–B’, C–C’, D–D’, E–E’, F–F’, and G–G’) Localisation of E-cad::GFP (B, E, and G, fire colour), Myo-II::GFP (C and F, fire colour) or F-actin (D, phalloidin, fire colour) in wild-type, akaL200, nrv2k13315, and coldf05607cells. Wild-type cells are separated from mutant cells by the dashed yellow line. (B’) Plot of the standardised E-cad::GFP signal at bicellular junctions and vertices in wild-type (blue squares) and akaL200 cells (red circles) (n=201 and 193 vertices and n=208 and 188 bicellular junctions for wild-type and akaL200 respectively; >5 pupae for each condition). (C’) Plot of the standardised Myo-II::GFP signal at bicellular junctions, vertices as well as medial network in wild-type (blue squares) and akaL200 cells (red circles) (n=54 and 42 vertices and n=84 and 61 cellular medial networks and n=55 and 56 bicellular junctions for wild-type and akaL200, respectively; n=5 pupae for each condition). (D’) Plot of the standardised F-actin signal at bicellular junctions and vertices in wild-type (blue squares) and akaL200 cells (red circles) (n=45 and 55 vertices and n=47 and 54 bicellular junctions for wild-type and akaL200, respectively; n=5 pupae for each condition). (E’) Plot of the standardised E-cad::GFP signal at tricellular and bicellular junctions in wild-type (blue squares) and nrv2k13315cells (red triangles) (n=33 and 35 vertices and n=35 and 36 bicellular junctions for wild-type and nrv2k13315, respectively; 2 pupae for each condition). (F’) Plot of the standardised Myo-II::GFP signal at bicellular junctions, vertices as well as medial network in wild-type (blue squares) and nrv2k13315cells (red triangles) (n=23 and 20 vertices and n=20 cellular medial networks and n=23 and 21 bicellular junctions for wild-type and nrv2k13315, respectively; n=2 pupae for each condition). (G’) Plot of the standardised E-cad::GFP signal at tricellular and bicellular junctions in wild-type (blue squares) and coldf05607 cells (red hexagons) (n=45 and 47 vertices and n=46 and 42 bicellular junctions for wild-type and coldf05607, respectively; 3 pupae for each condition). Bars show mean ± SD, **p<0.01, ****p<0.0001, Mann–Whitney test. A calibration bar shows LUT for grey value range. The scale bars represent 500 nm for panels A–A’ and 5 µm for panels B–G. White squares represent close-up of WT and green squares of mutant situations for panels B, C, D, E, F, and G.
Figure 1—figure supplement 1
Consequence of loss of Nervana2 and Anakonda on E-cad and Myo-II localisation, and on cell–cell junction mechanical properties.
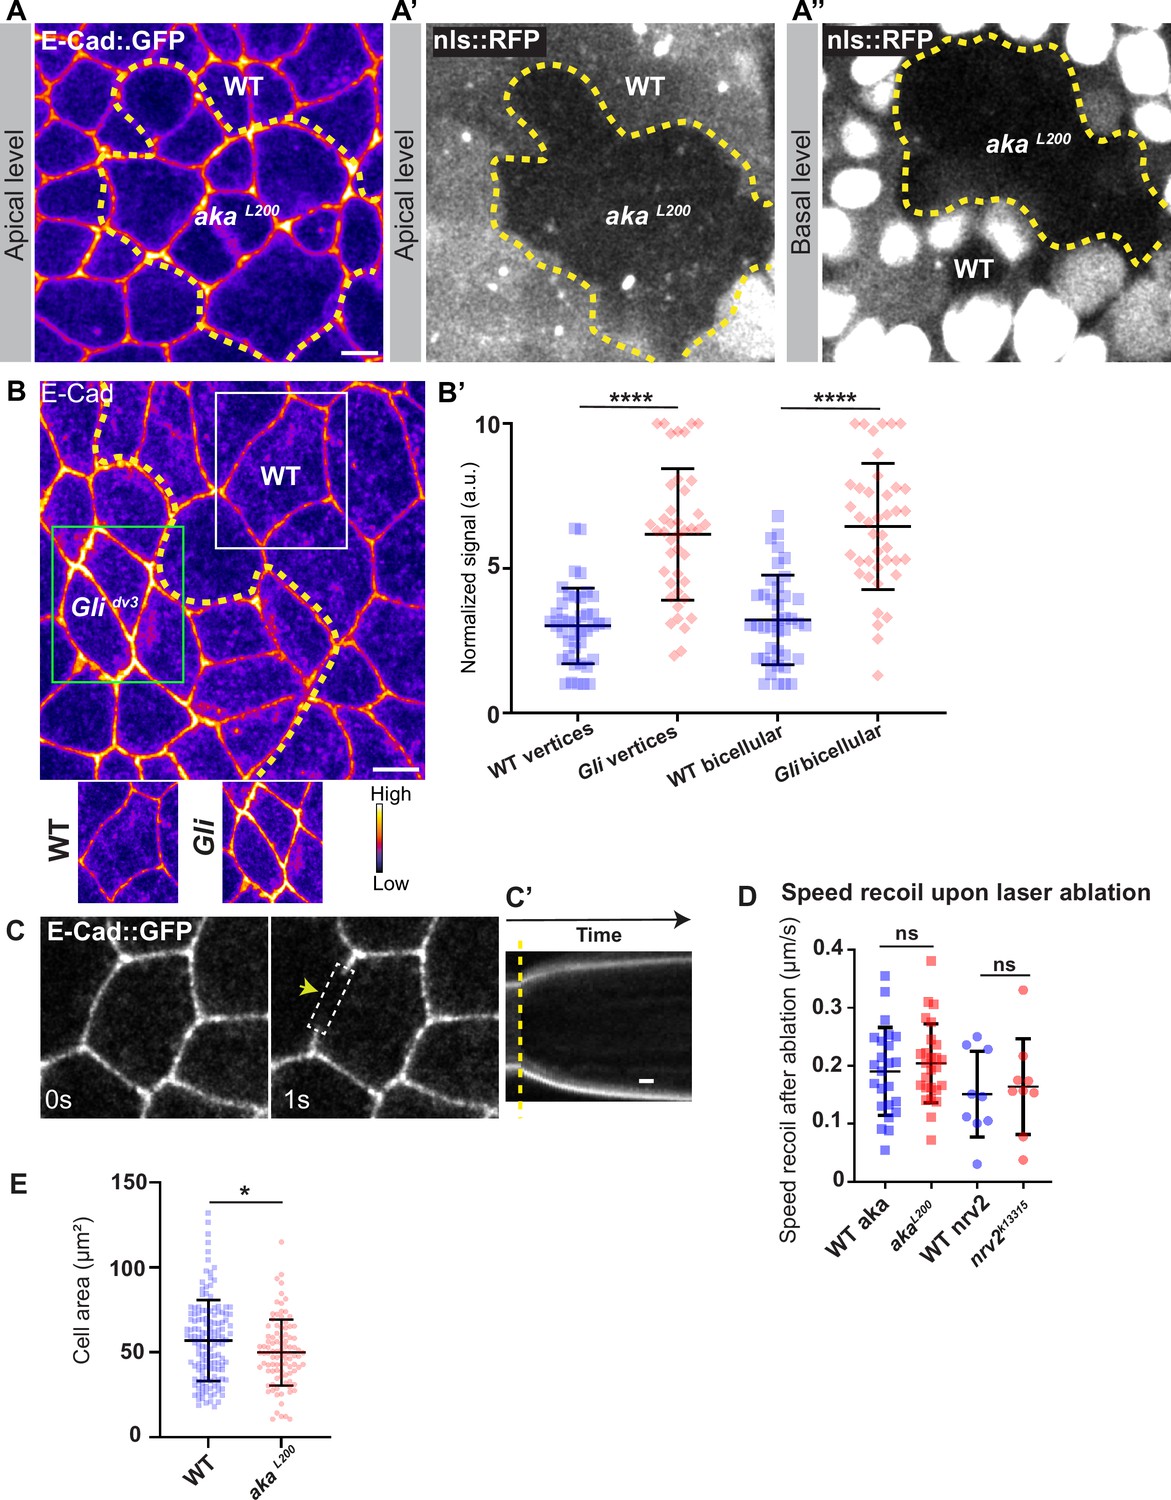
(A–A’’) shows example of a notum expressing E-cad::GFP (fire colour) and nls::RFP, between 16 hr and 19 hr after puparium formation (APF), after heat-shock to induce clone of wild-type (nls::RFP positive) and mutant cells for Aka (nls::RFP negative). Comparison between apical and basal levels shows differences of cell clones shape according to the cellular plane. (B) Localisation of E-cad stained with an E-cad antibody (fire colour) in wild-type and Glidv3 mutant cells. Wild-type and Glidv3 cells are separated by the dashed yellow line. White square represents close-up of WT (wild-type) and green square of Glidv3 situations. (B’) Plot of the standardised E-cad signal at tricellular and bicellular junctions in wild-type (blue squares) and Glidv3 cells (red diamonds) (n=41 and 42 vertices and n=40 and 41 bicellular junctions for wild-type and Glidv3, respectively; 3 pupae for each condition). (C) Example of wild-type laser-based nanoablation in the adherens junction (AJ) plane identified using E-cad::GFP. Yellow arrowhead shows the nanoablation area. (C’) Kymograph of the ablation area depicted in panel C showing vertices’ recoil upon ablation. Scale bar shows 5 s. (D) Plot of the mean recoil velocities upon nanoablation for wild-type (blue squares, n>20 ablations, n>5 pupae; circles, n=9 ablations, n=3 pupae) and akaL200 (red squares, n>20 ablations, n>5 pupae) or nrv2k13315 cells (red circles, n=9 ablations, n=3 pupae), respectively. (E) Quantification of the cell area (in µm2) of WT (blue squares, n=137 cells, n>5 pupae) and akaL200 cells (red circles, n=96 cells, n>5 pupae). Bars show mean ± SD, ****p<0.0001, unpaired t test for panels B, D, and F. *p<0.05, Welch’s t test for panel E. A calibration bar shows LUT for grey value range. The scale bars represent 5 µm for panels A and B.
Figure 2 with 1 supplement
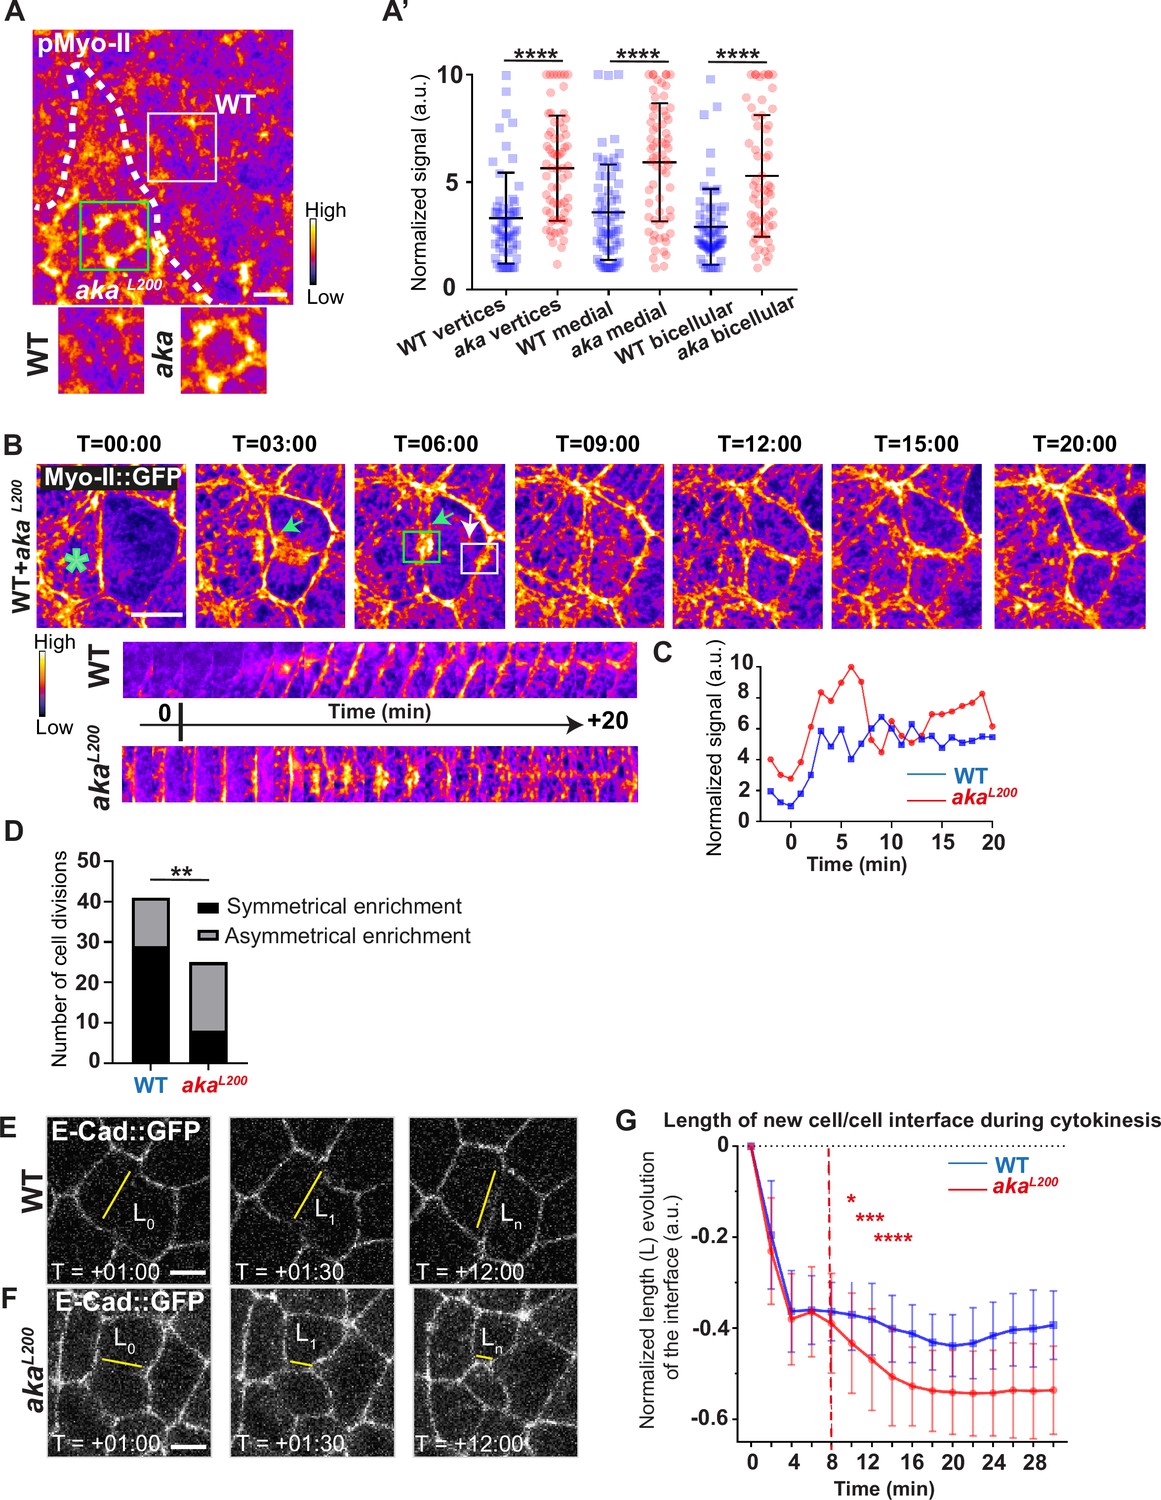
Loss of Anakonda promotes Myo-II activation and mechanical disturbances at adherens junction level during interphase and cytokinesis.
(A) Shows example of a notum stained with anti-phospho-Myo-II (pMyo-II; fire colour), between 16 hr and 19 hr after puparium formation (APF), after heat-shock to induce clone of wild-type (WT) and mutant cells for Aka. (A’) Plot of the standardised pMyo-II signal at tri- and bicellular junctions as well as medial network in WT (blue squares) and akaL200 cells (red circles) (n=57 and 67 vertices, n=65 and 66 cellular medial networks and n=62 and 61 bicellular junctions for WT and akaL200, respectively; n>5 pupae for each condition). (B) Cytokinesis of a WT cell expressing Myo-II::GFP between 16 hr and 19 hr APF, after heat-shock to induce clone of WT and mutant cells for Aka. Representation of a WT cell cytokinesis with recruitment of a higher amount of Myo-II::GFP at the contact with akaL200 cell (marked by the green asterisk, green arrow for Myo-II::GFP signal) compared to the WT one (white arrow). Myo-II::GFP recruitment is asymmetrical in terms of Myo-II::GFP signal intensity. Kymograph represents the asymmetric enrichment of Myo-II::GFP of the WT and akaL200 newly formed vertices depicted above. (C) Plot representing the Myo-II::GFP signal during cytokinesis at the WT (blue line) and akaL200 (red line) newly formed vertices depicted in C. Time is min:s with t=0 corresponding to the anaphase onset. (D) Histogram representing the number of cells displaying symmetrical (black) or asymmetrical (dark grey) Myo-II::GFP recruitment during cytokinesis of WT with WT neighbours and of WT with one WT and one akaL200 neighbours (n=29 and n=12; n=8 and n=17 for symmetrical and asymmetrical enrichment in WT and akaL200 conditions respectively; n>5 pupae for each conditions). (E–F) Cytokinesis of notum cells expressing E-cad::GFP at 16 hr APF, after heat-shock to induce clone of WT (E) and akaL200 mutant cells (F). Time is min:s with t=0 corresponding to the anaphase onset. L represents the length of the new cell/cell interface. (G) Plot of the mean length interface at each corresponding time points. WT situation is represented by blue squares and akaL200 situation is represented by red circles. Bars show mean ± SD, *p<0.05, **p<0.005, ***p=0.0001, ****p<0.0001, unpaired t test and Mann–Whitney test for panels A’, Fisher t test for panel D, and Multiple t test for panel G. A calibration bar shows LUT for grey value range. The scale bars represent 5 µm. White square represents close-up of WT and green square of akaL200 situations for panel A.
Figure 2—figure supplement 1
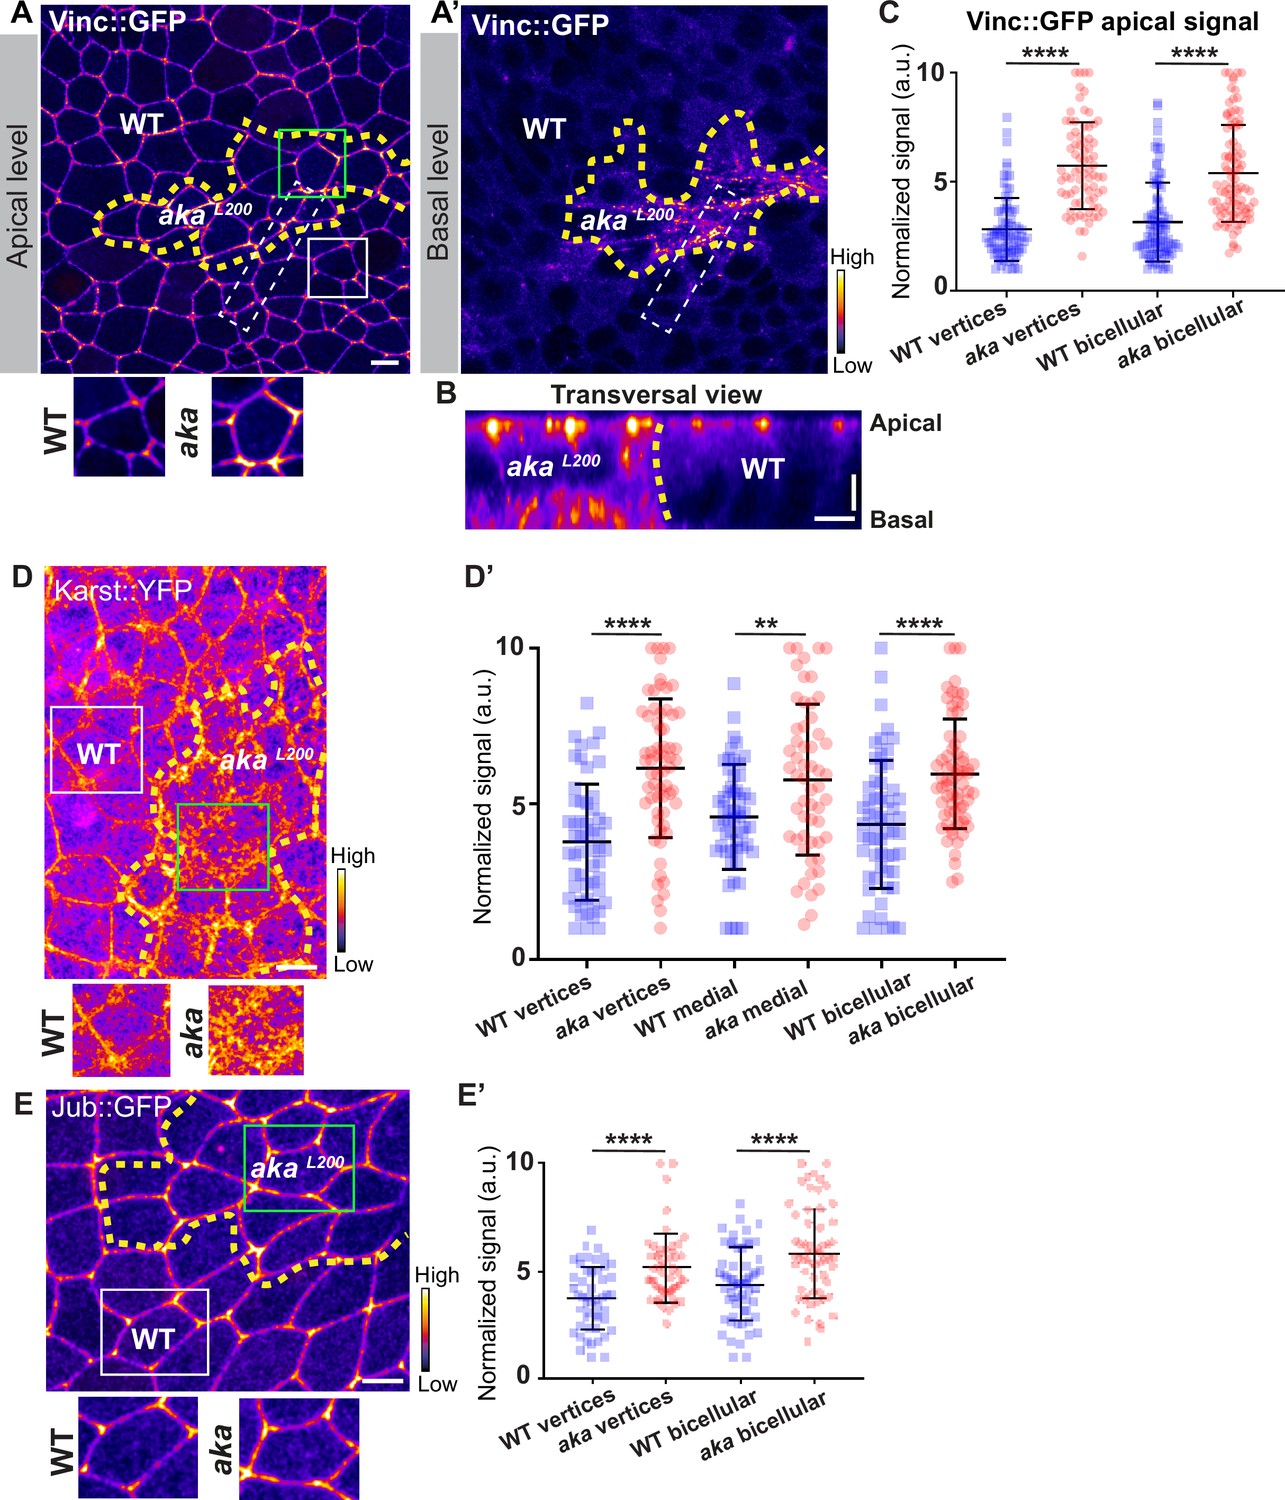
Loss of Anakonda leads to enrichment of Vinculin, Karst, and Ajuba at bi- and tricellular junctions.
(A, A’, B, D, and E) show nota expressing Vinc::GFP (A–B, fire colour), Karst::YFP (D, fire colour), and Jub::GFP (E, fire colour) between 16 hr and 19 hr after puparium formation (APF), after heat-shock to induce clone of wild-type and mutant cells for Aka. (A–B) Localisation of Vinc::GFP in both wild-type and akaL200 cells, at apical (A) and basal level (A’) in a planar view or in a transversal view (B), separated by the dashed yellow line. (C) Plot of the standardised Vinc::GFP signal at tricellular and bicellular junctions in wild-type (blue squares) and akaL200 cells (red circles) (n=84 and 76 vertices and n=92 bicellular junctions for wild-type and akaL200 respectively, n=4 pupae for each condition). (D) Localisation of Karst::YFP in both wild-type and akaL200 cells, separated by the dashed yellow line. (D’) Plot of the standardised Karst::YFP signal at tricellular and bicellular junctions as well as medial network in wild-type (blue squares) and akaL200 cells (red circles) (n=54 and 64 vertices and n=55 and 56 cellular medial networks and n=59 and 68 bicellular junctions for wild-type and akaL200 respectively, n=4 pupae for each condition). (E) Localisation of Jub::GFP (fire colour) in both wild-type and akaL200 cells, separated by the dashed yellow line. (E’) Plot of the standardised Jub::GFP signal at tricellular and bicellular junctions in wild-type (blue squares) and akaL200 cells (red circles) (n=50 vertices and n=60 bicellular junctions for wild-type and akaL200 respectively, n=2 pupae for each condition). Bars show mean ± SD, **p<0.01 ****, p<0.0001, unpaired t test and Mann–Whitney test. A calibration bar shows LUT for grey value range. White dotted rectangle on A–A’ shows area depicted in B. The scale bars represent 5 µm for panels A, D, and E and 3 µm for panel B. White squares represent close-up of WT (wild-type) and green squares of akaL200 situations for panels A, D, and E.
Figure 3 with 1 supplement
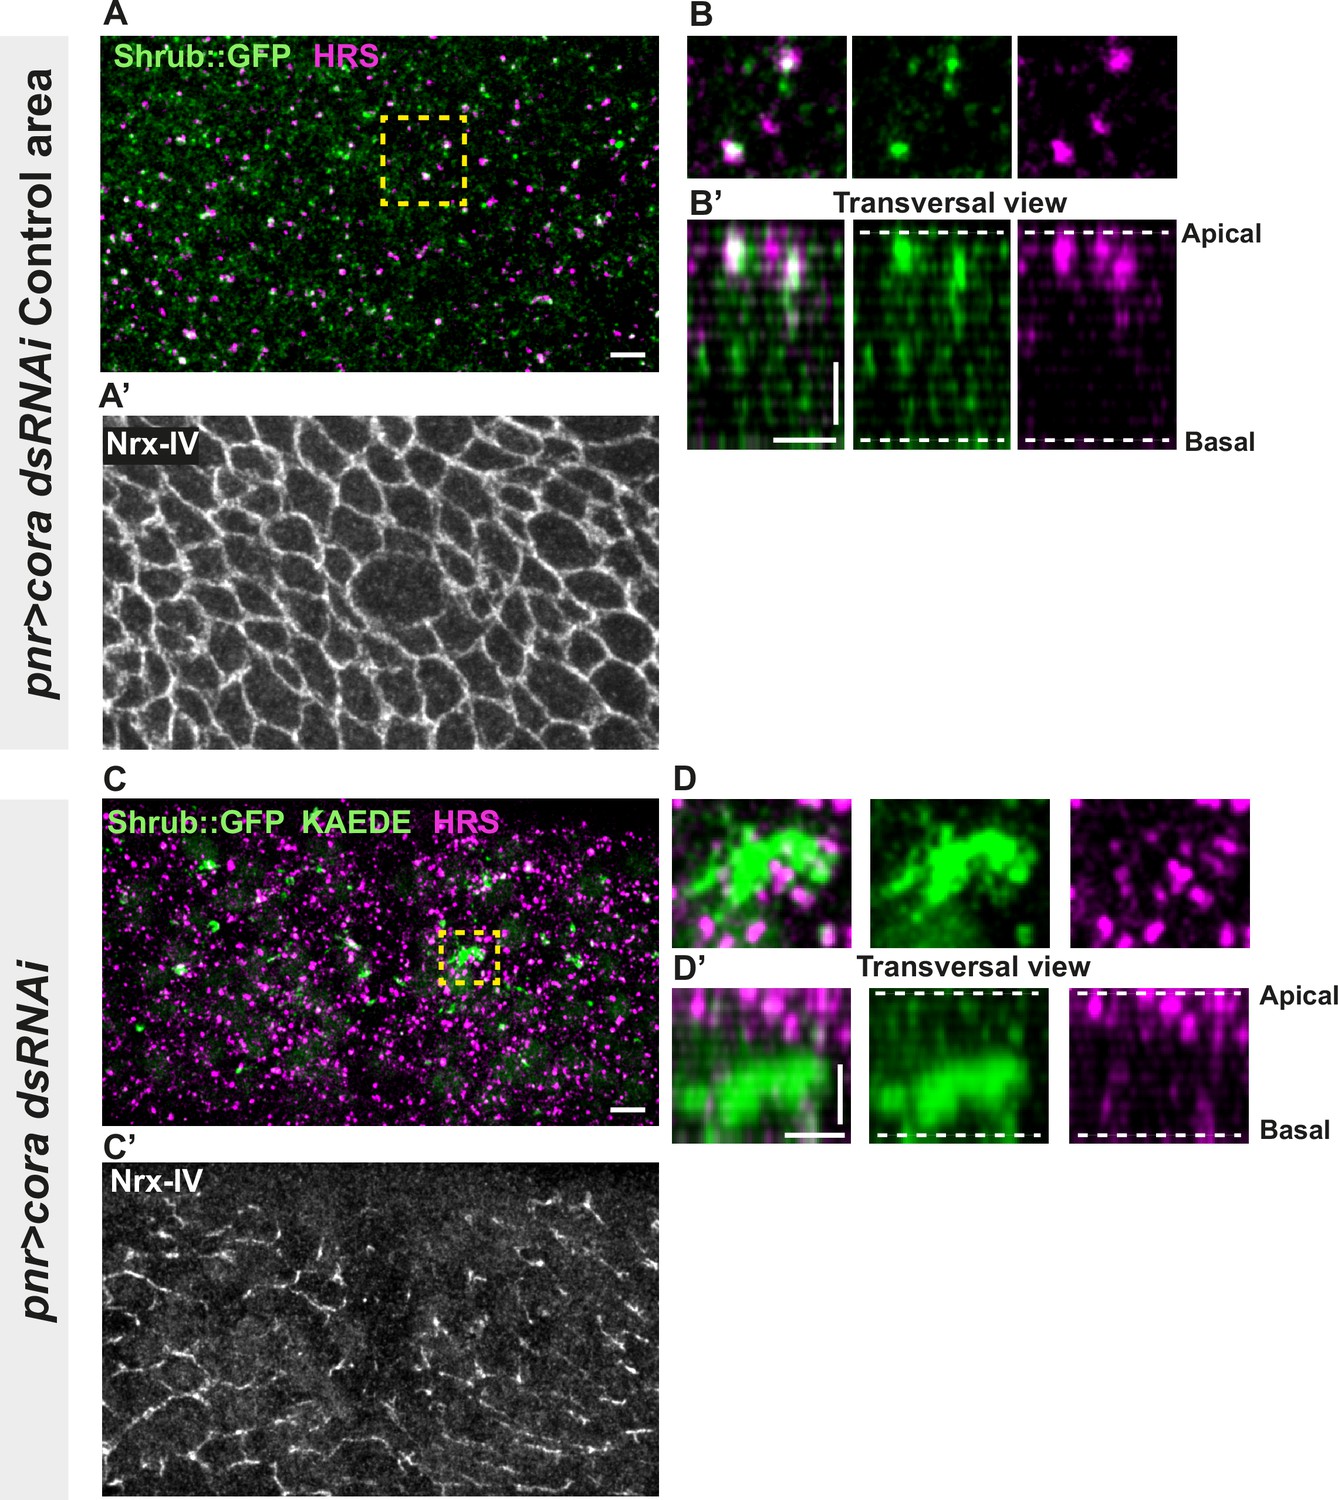
Septate junction (SJ) defects are associated with increased number of HRS- and ESCRT III protein Shrub-positive structures.
(A–B’ and C–D’) Localisation of Shrub::GFP+GFP antibody (green), KAEDE (C–D’) in cells marked by Nrx-IV (anti-Nrx-IV, grey) and HRS (anti-HRS, magenta) in wild-type and cells expressing UAS::cora-RNAi together with UAS::KAEDE under pnr-Gal4 control. (A–B’) Localisation of Shrub::GFP+GFP antibody and HRS in a wild-type area of a tissue expressing UAS::cora-RNAi and UAS::KAEDE under pnr-Gal4 control (KAEDE negative) and regular Nrx-IV signal in (A’) in a planar view (A, A’, and B) or in a transversal view (B’). Yellow dashed square shows (B and B’) magnification of wild-type cell with colocalisation between Shrub::GFP and HRS at SJ level shown by Nrx-IV. (C–D’) Localisation of Shrub::GFP+GFP antibody and HRS in cells expressing UAS::cora-RNAi and UAS::KAEDE under pnr-Gal4 control (KAEDE-positive) cells and Nrx-IV reduced signal in (C’) in a planar view (C, C’, and D) or in a transversal view (D’). Yellow dashed squares show (D–D’) magnification of aggregates of Shrub::GFP surrounded by HRS staining. The scale bar represents 5 µm (A and C) and 3 µm in (B’ and D’). Dashed white lines highlight apical and basal limits of the notum.
Figure 3—figure supplement 1
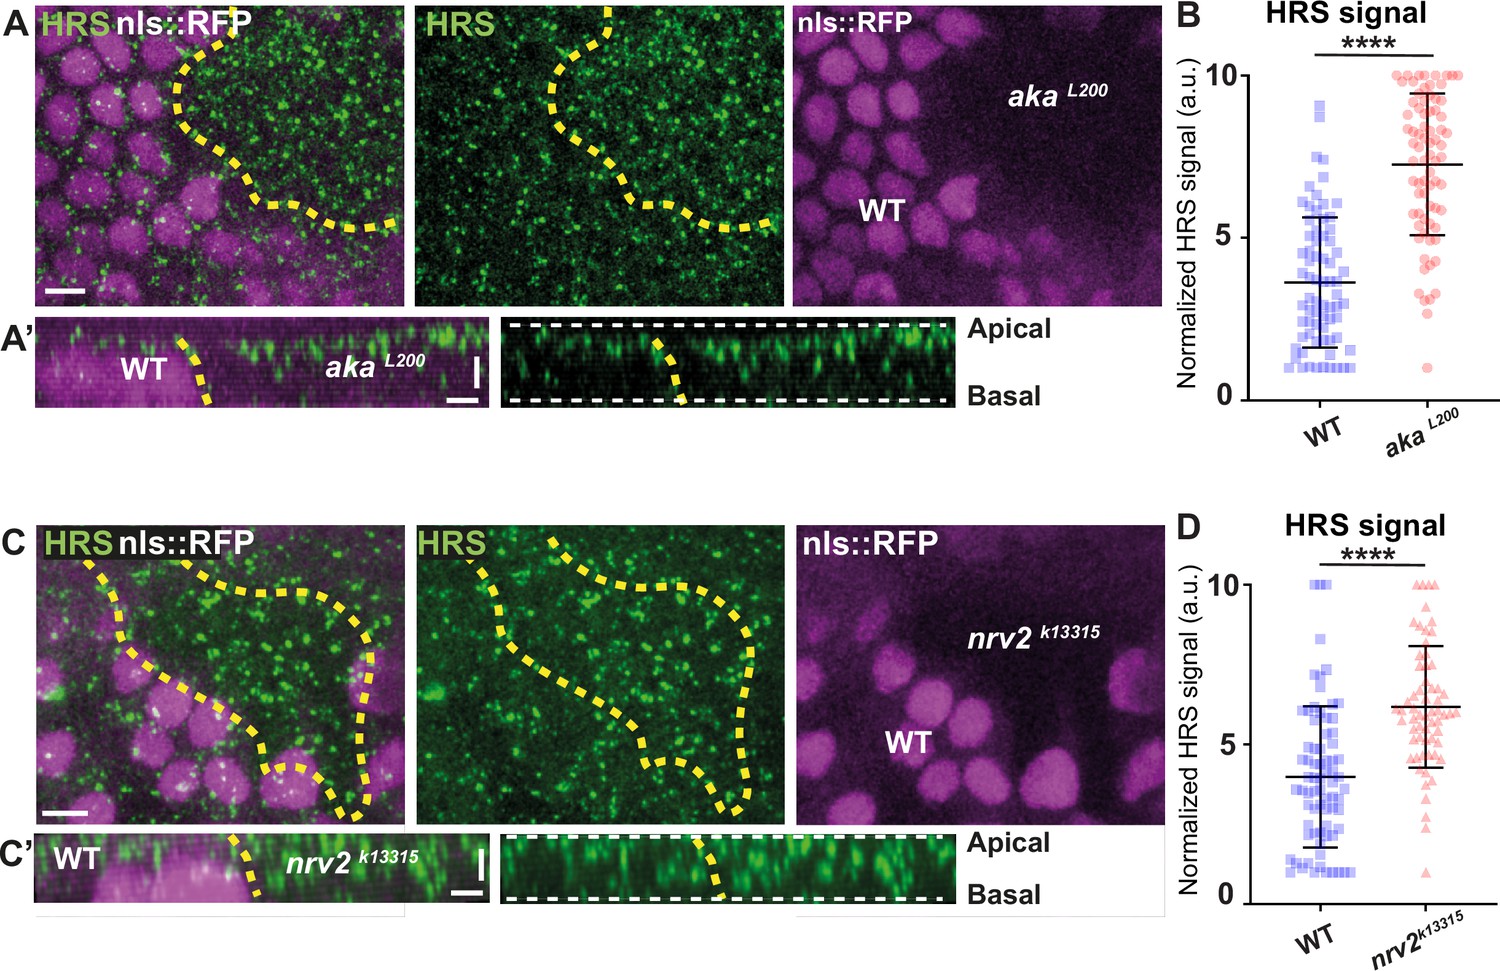
Loss of Anakonda or Nervana 2 triggers increased number of HRS-positives vesicles.
(A–A’ and C–C’) show nota stained for HRS (anti-HRS, green), between 16 hr and 19 hr after puparium formation (APF), after heat-shock to induce clone of wild-type (nls::RFP positive) and mutant cells for Aka or Nrv2 (nls::RFP negative). (A) Localisation of HRS (green) in both wild-type and akaL200 cells, separated by the dashed yellow line. Clones of wild-type and akaL200 cells identified by nls::RFP marking (magenta). (A’) Transversal view of (A). (B) Plot of the standardised HRS signal wild-type (blue squares) and akaL200 cells (red circles). (n=72 and n=75 for wild-type and akaL200 cells respectively, n>5 pupae for each condition). (C) Localisation of HRS (green) in both wild-type and nrv2k13315 cells, separated by the dashed yellow line. Clones of wild-type and nrv2k13315 cells identified by nls::RFP marking (magenta). (C’) Transversal view of (C). Plot of the standardised HRS signal wild-type (blue squares) and nrv2k13315 cells (red triangle). (n=74 and n=62 for wild-type and nrv2k13315 cells respectively, n=5 pupae for each condition). Bars show mean ± SD, ****p<0.0001, unpaired t test and Mann–Whitney test. The scale bar represents 5 µm (A and C) and 3 µm in (A’ and C’). Dashed white lines highlight apical and basal limits of the notum.
Figure 4
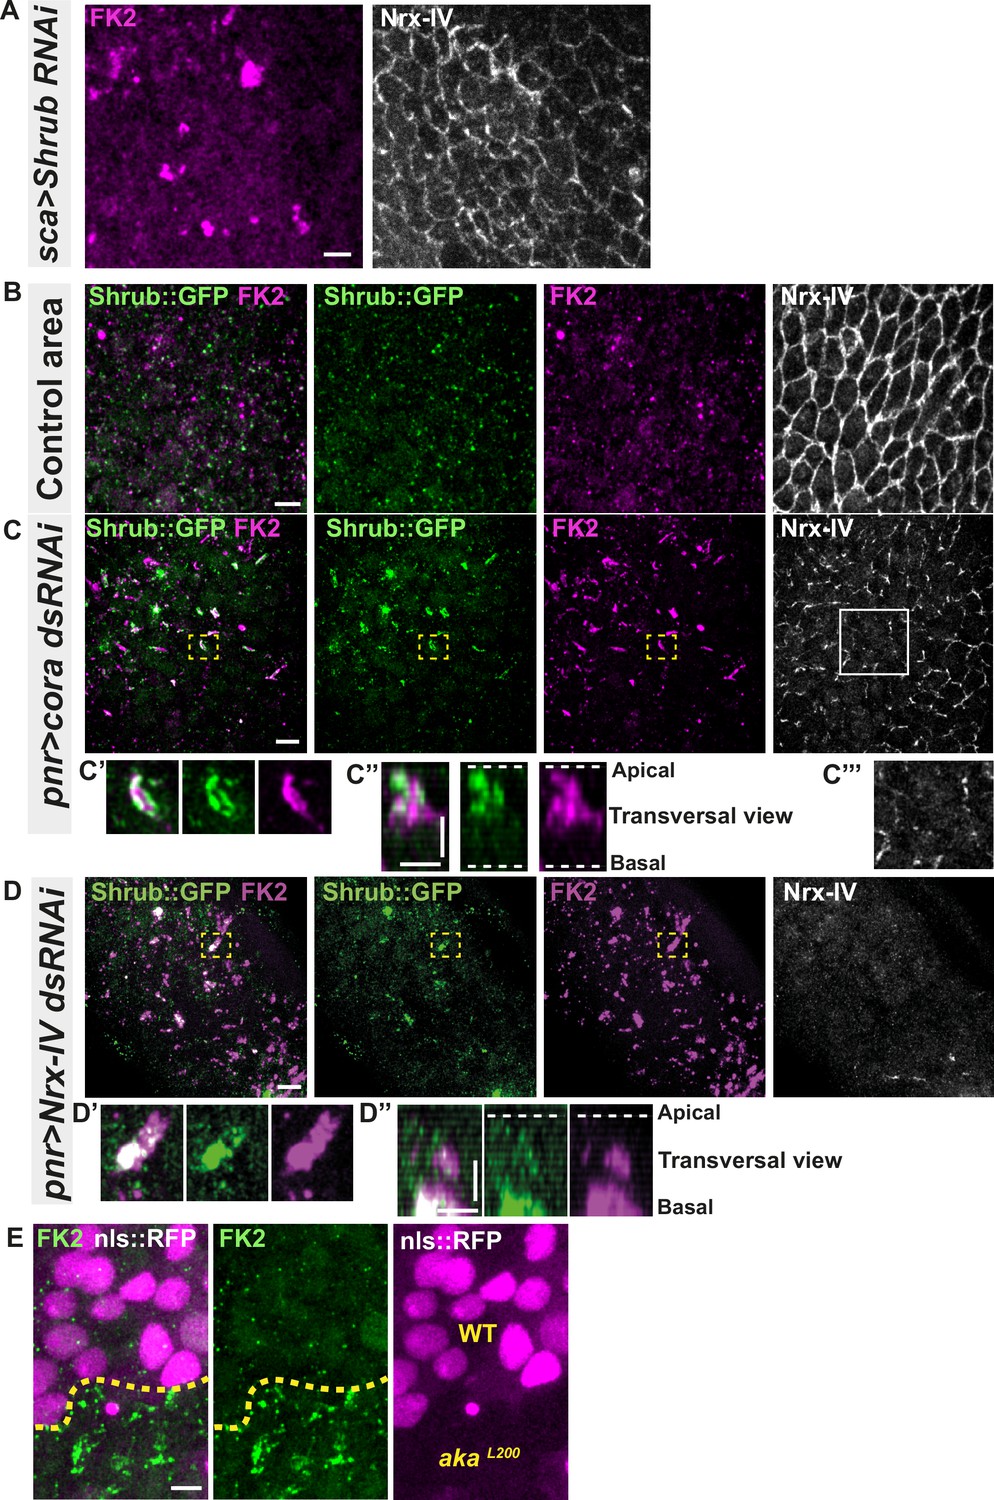
Septate junction defects leads to the enlargement of ESCRT III protein Shrub- and ubiquitinylated proteins-positives structures.
(A) Localisation of FK2 (anti-ubiquitinylated proteins, magenta) in cells marked by Nrx-IV (anti-Nrx-IV, white) expressing UAS::Shrub-RNAi under sca-Gal4 control. (B–C’’’) Localisation of Shrb::GFP+anti-GFP antibody and FK2 in a wild-type area (regular Nrx-IV signal in (B)) or in cells expressing UAS::cora-RNAi under pnr-Gal4 control (Nrx-IV reduced signal in (C)). Yellow dashed square shows (C’ and C’’) magnification of cells with partial or no colocalisation between Shrb::GFP and FK2 as well as aggregates of FK2 surrounded by Shrb::GFP staining in a planar view (C’) and transversal view (C’’). White square shows the magnification of cells without Nrx-IV aggregates (C’’’). (D–D’’) Localisation of Shrub::GFP+anti-GFP antibody and FK2 in cells expressing UAS::Nrx-IV-RNAi under pnr-Gal4 control (Nrx-IV signal disappearance in (D)). Yellow dashed square shows (D’ and D’’) magnification of cells with partial or no colocalisation between Shrb::GFP and FK2 in a planar view (D’) and transversal view (D’’). (E) Localisation of FK2 in both wild-type and akaL200 cells, separated by the dashed yellow line. Clones of wild-type and akaL200 cells identified by nls::RFP marking (magenta). The scale bar represents 5 µm (A, B, C, D, and E) and 3 µm in (C’’ and D’’). Dashed white lines highlight apical and basal limits of the notum.
Figure 5 with 2 supplements
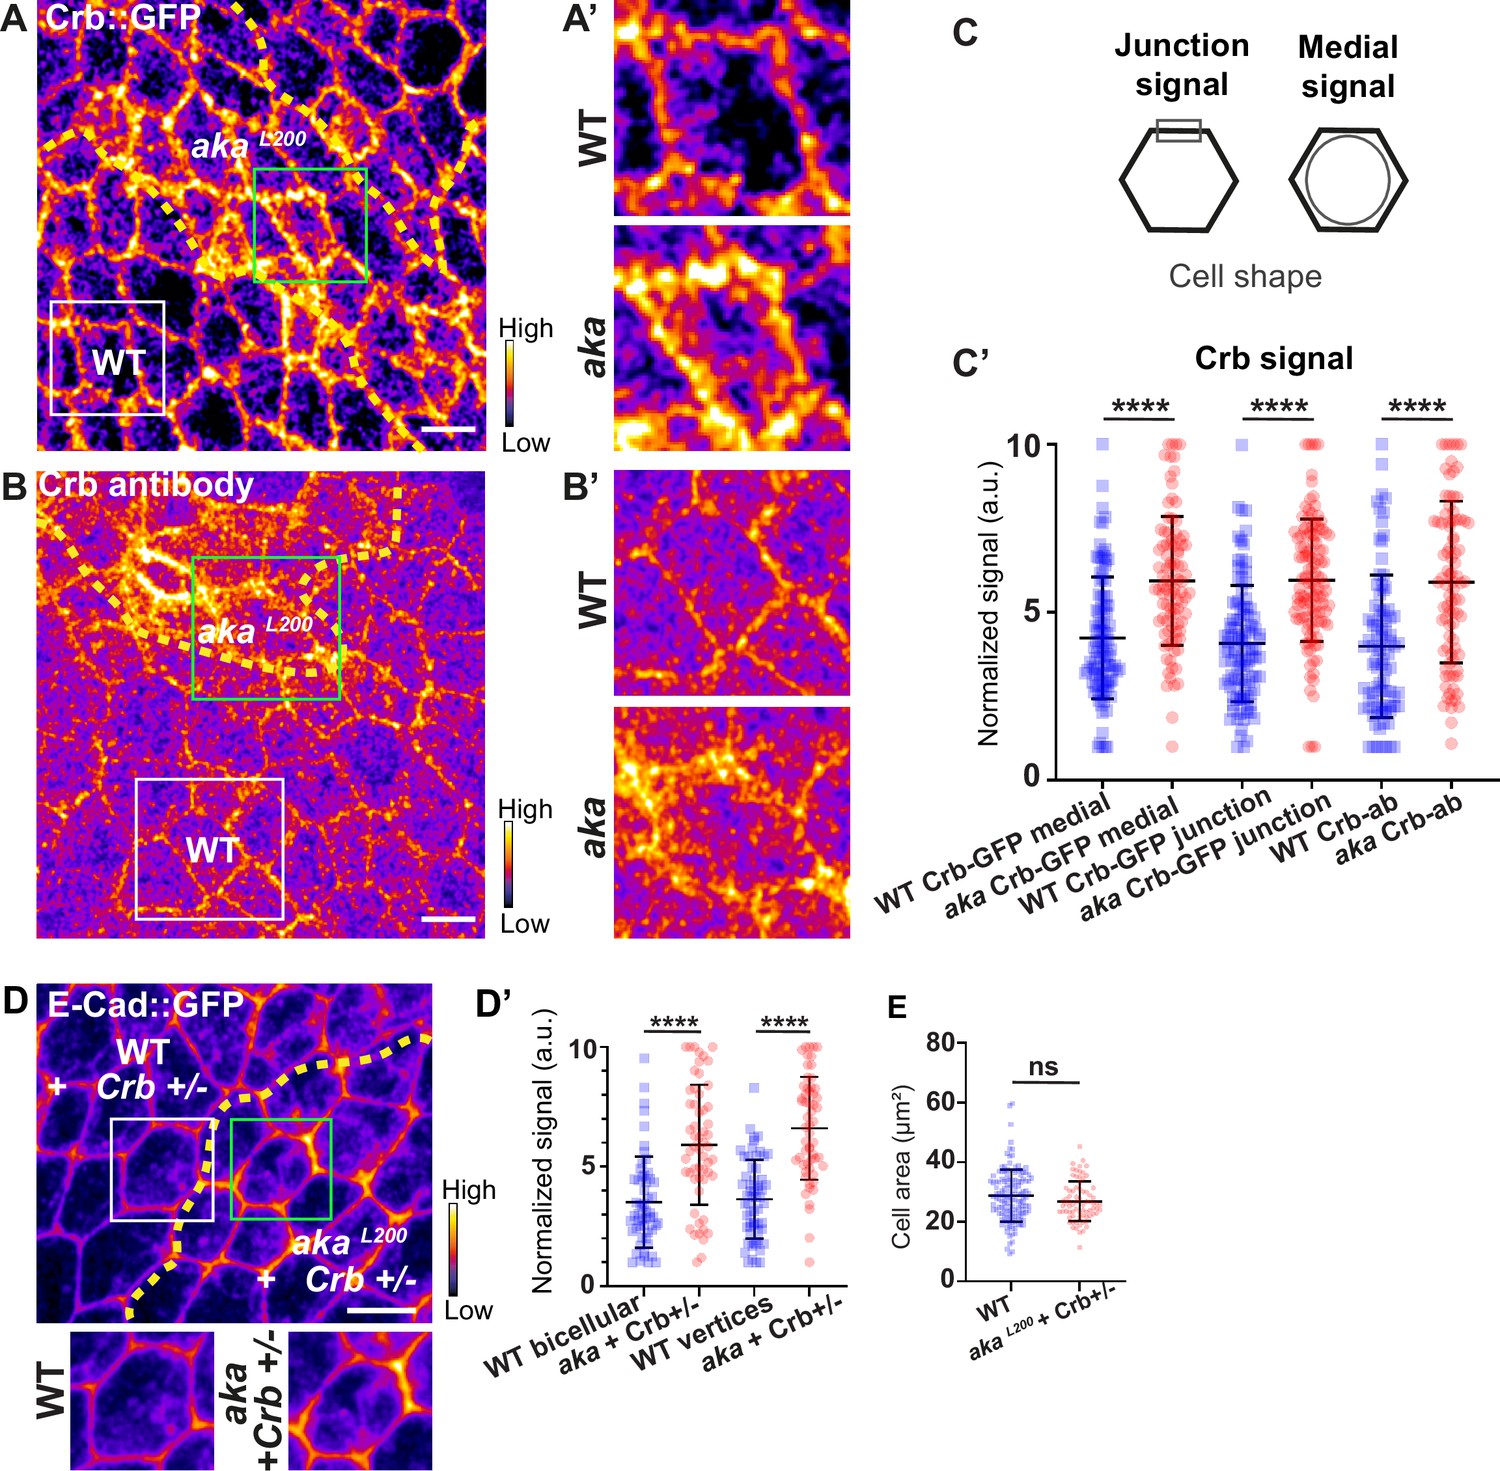
Loss of Anakonda leads to higher level of Crumbs at both junctional and medial part of the cell.
(A–B’) show nota, expressing Crb::GFP (A and A’, fire colour) or stained for Crb (anti-Crb; B and B’, fire colour), between 16 hr and 19 hr after puparium formation (APF), after heat-shock to induce clone of wild-type and mutant cells for Aka. (A–A’) Localisation of Crb::GFP in both wild-type and akaL200 cells, separated by the dashed yellow line. (B–B’) Localisation of anti-Crb in both wild-type and akaL200 cells, separated by the dashed yellow line. (C) Scheme representing junctional and medial population of Crb staining. (C’) Plot of the standardised Crb::GFP signal at the medial and junctional part of the cell or anti-Crb only at the medial part, in wild-type (blue squares) and akaL200 cells (red circles) (n=100 and 96 cellular medial networks with Crb::GFP, n=110 and 119 junctions with Crb::GFP and n=90 and 88 cellular medial networks with anti-Crb for wild-type and akaL200 respectively, n=5 pupae for each condition). (D–D’) Localisation of E-cad::GFP (D, fire colour) in wild-type and akaL200 cells lacking one copy of Crb (Crb+/-). Wild-type and akaL200 cells are separated by the dashed yellow lines in (D). (D’) Plot of the standardised E-cad::GFP signal at bicellular junctions and vertices in wild-type (blue squares) and akaL200 (red circles) cells lacking one copy of Crb (n=55 and 57 bicellular junctions and n=59 and 58 vertices for wild-type and akaL200 cells respectively; n=4 pupae for each condition). (E) Quantification of the cell area (in µm2) of WT (wild-type) (blue squares, n=136 cells, n=4 pupae) and akaL200 cells lacking one copy of Crb (red circles, n=75 cells, n=4 pupae). Bars show mean ± SD, ****p<0.0001, Mann–Whitney test. A calibration bar shows LUT for grey value range. The scale bars represent 5 µm. White squares represent close-up of WT and green squares of akaL200 situations for panels A, B, and D.
Figure 5—figure supplement 1
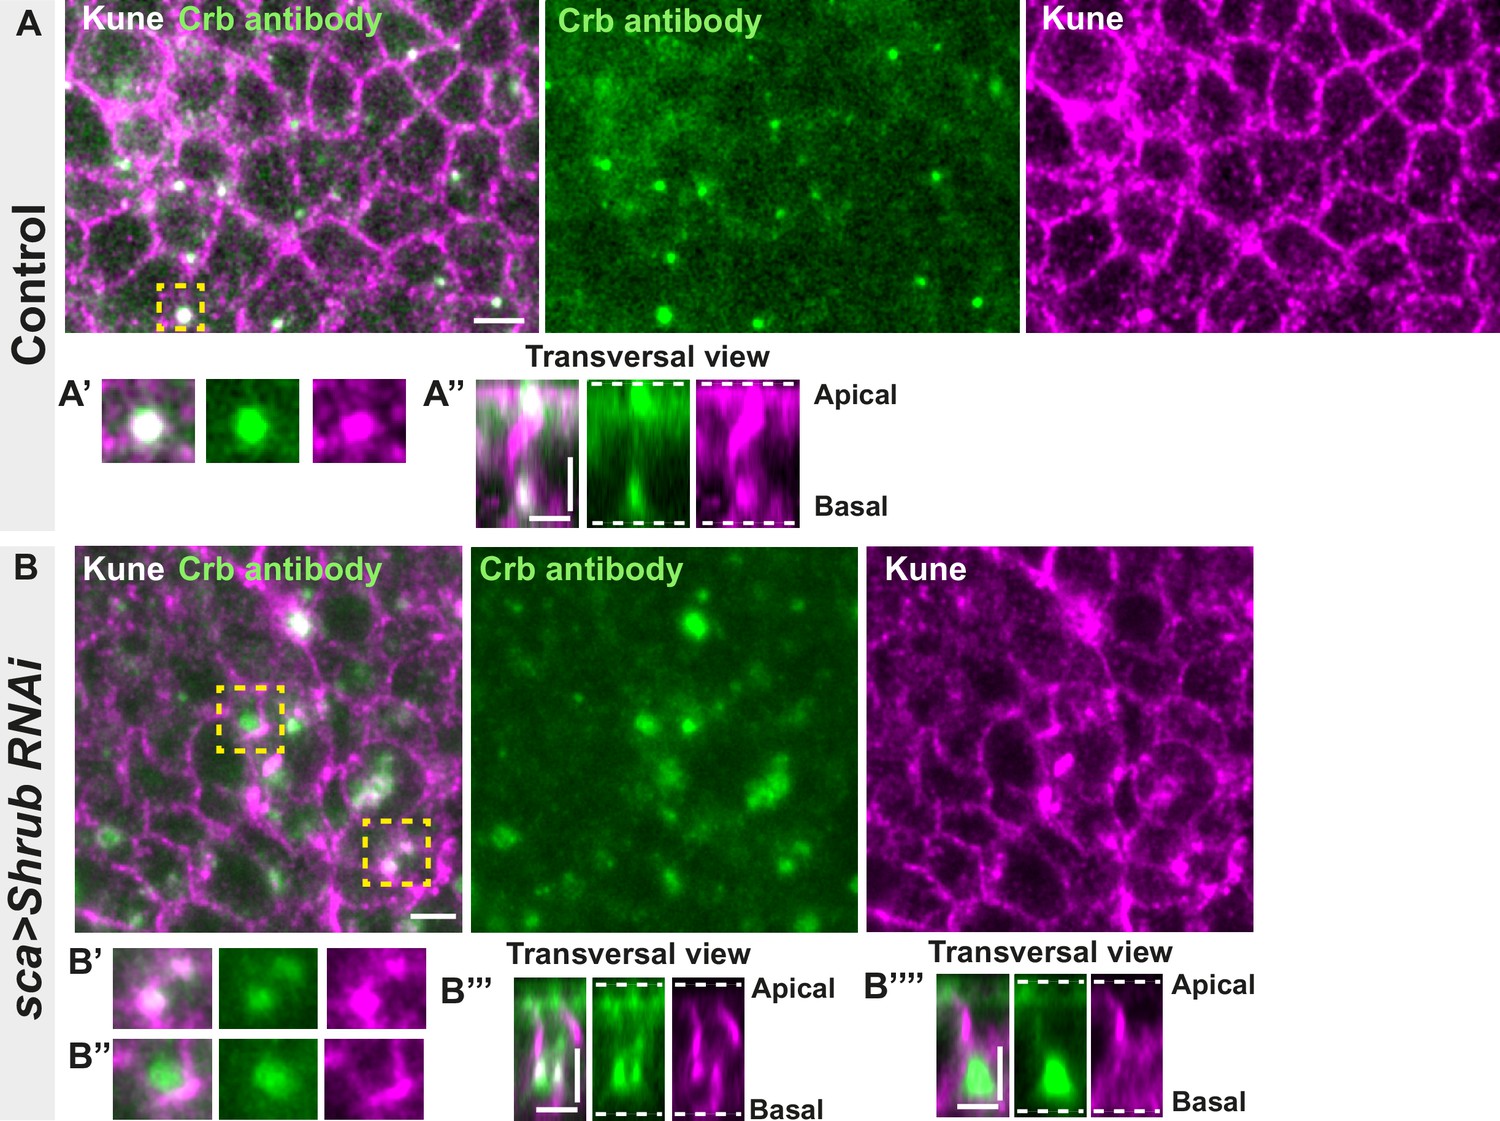
Loss of function of ESCRT III protein Shrub in notum cells leads to Crumbs and septate junction (SJ) protein Kune-Kune abnormal localisation.
(A–A’’) Localisation of Crb (anti-Crb, green) in a wild-type area of cells expressing UAS::Shrub-RNAi under sca-Gal4 control and marked by SJ protein Kune Kune (anti-Kune, magenta). Yellow dashed square shows (A’ and A’’) magnification of cells with colocalisation between Crb and Kune in vesicles at basal cell level in a planar view (A’) and transversal view (A’’). (B–B’’’’) Localisation of Crb (anti-Crb, green) in cells expressing UAS::Shrub-RNAi under sca-Gal4 control and marked by SJ protein Kune-Kune (anti-Kune, magenta, Kune disrupted signal). Yellow dashed square shows (B’–B’’’’) magnification of cells with partial (B’) or no colocalisation (B’’) between Crb and Kune at basal cell level in a planar view (B’–B’’) and transversal view (B’’’–B’’’’). The scale bar represents 5 µm (A and B) and 3 µm in (A’’, B’’’, and B’’’’). Dashed white lines highlight apical and basal limits of the notum.
Figure 5—figure supplement 2
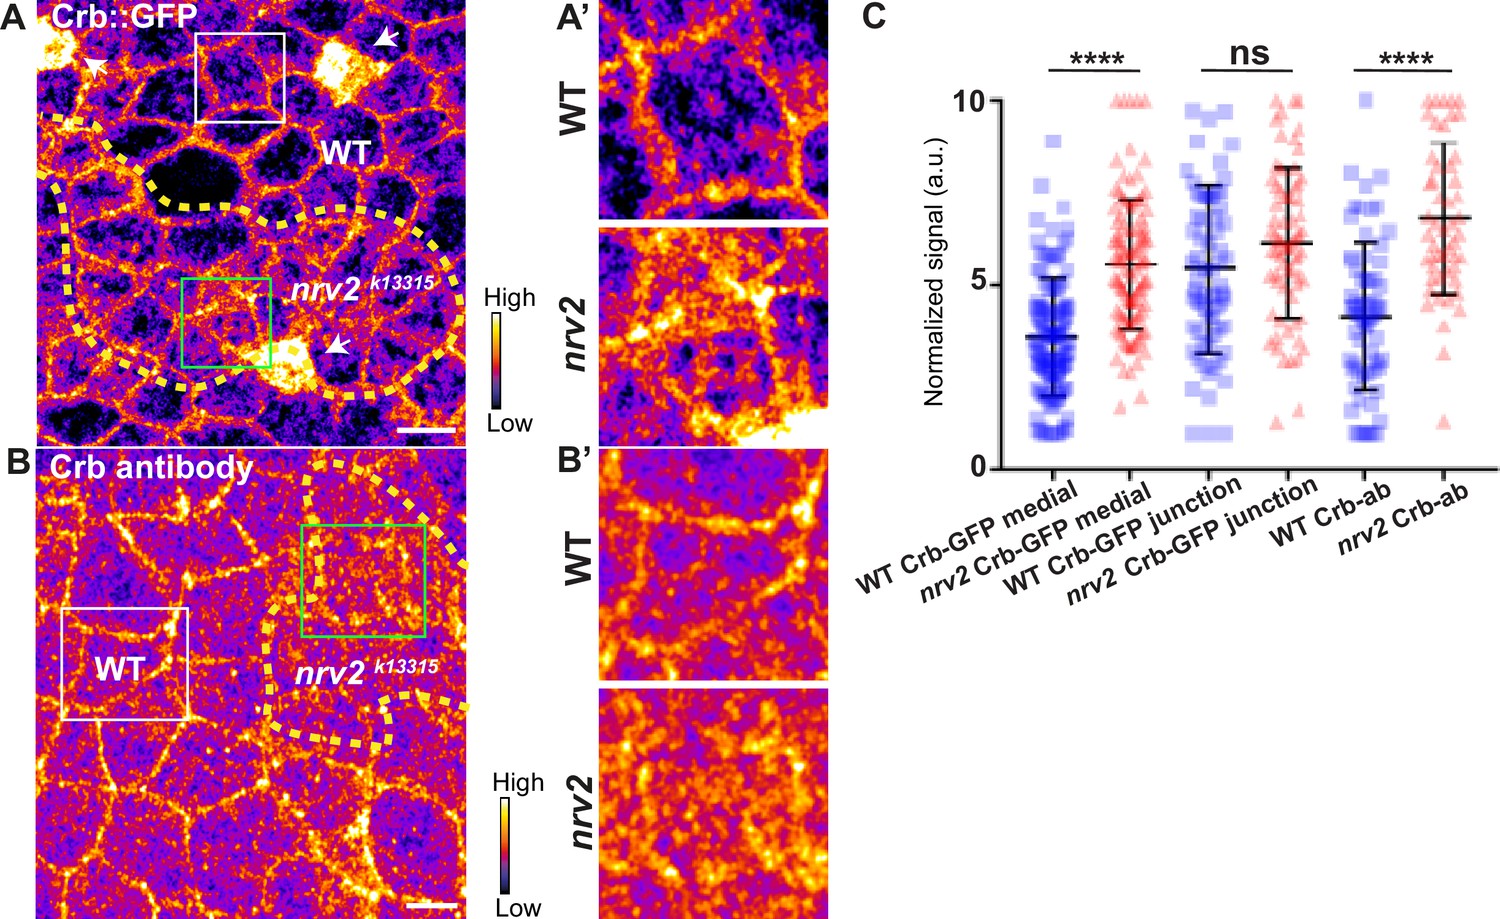
Loss of Nervana 2 leads to higher level of Crumbs at adherens junction level.
(A–B’) show nota, expressing Crb::GFP (A and A’, fire colour) or stained for Crb (anti-Crb; B and B’, fire colour), between 16 hr and 19 hr after puparium formation (APF), after heat-shock to induce clone of wild-type and mutant cells for Nrv2. (A–A’) Localisation of Crb::GFP in both wild-type and nrv2k13315 cells, separated by the dashed yellow line. (B–B’) Localisation of anti-Crb in both wild-type and nrv2k13315 cells, separated by the dashed yellow line. (C) Plot of the standardised Crb::GFP signal at the medial and junctional part of the cell or anti-Crb only at the medial part, in wild-type (blue squares) and nrv2k13315 cells (red triangles) (n=75 cellular medial networks, n=70 junctions and n=68 and 52 cellular medial networks with Crb-ab for wild-type and nrv2k13315 respectively, n=3 pupae for Crb::GFP and n>5 pupae for Crb-ab). Bars show mean ± SD, ****p<0.0001, Mann–Whitney test. A calibration bar shows LUT for grey value range. The scale bars represent 5 µm. White squares represent close-up of WT (wild-type) and green squares of nrv2k13315 situations for panels A and B.
Figure 6 with 1 supplement
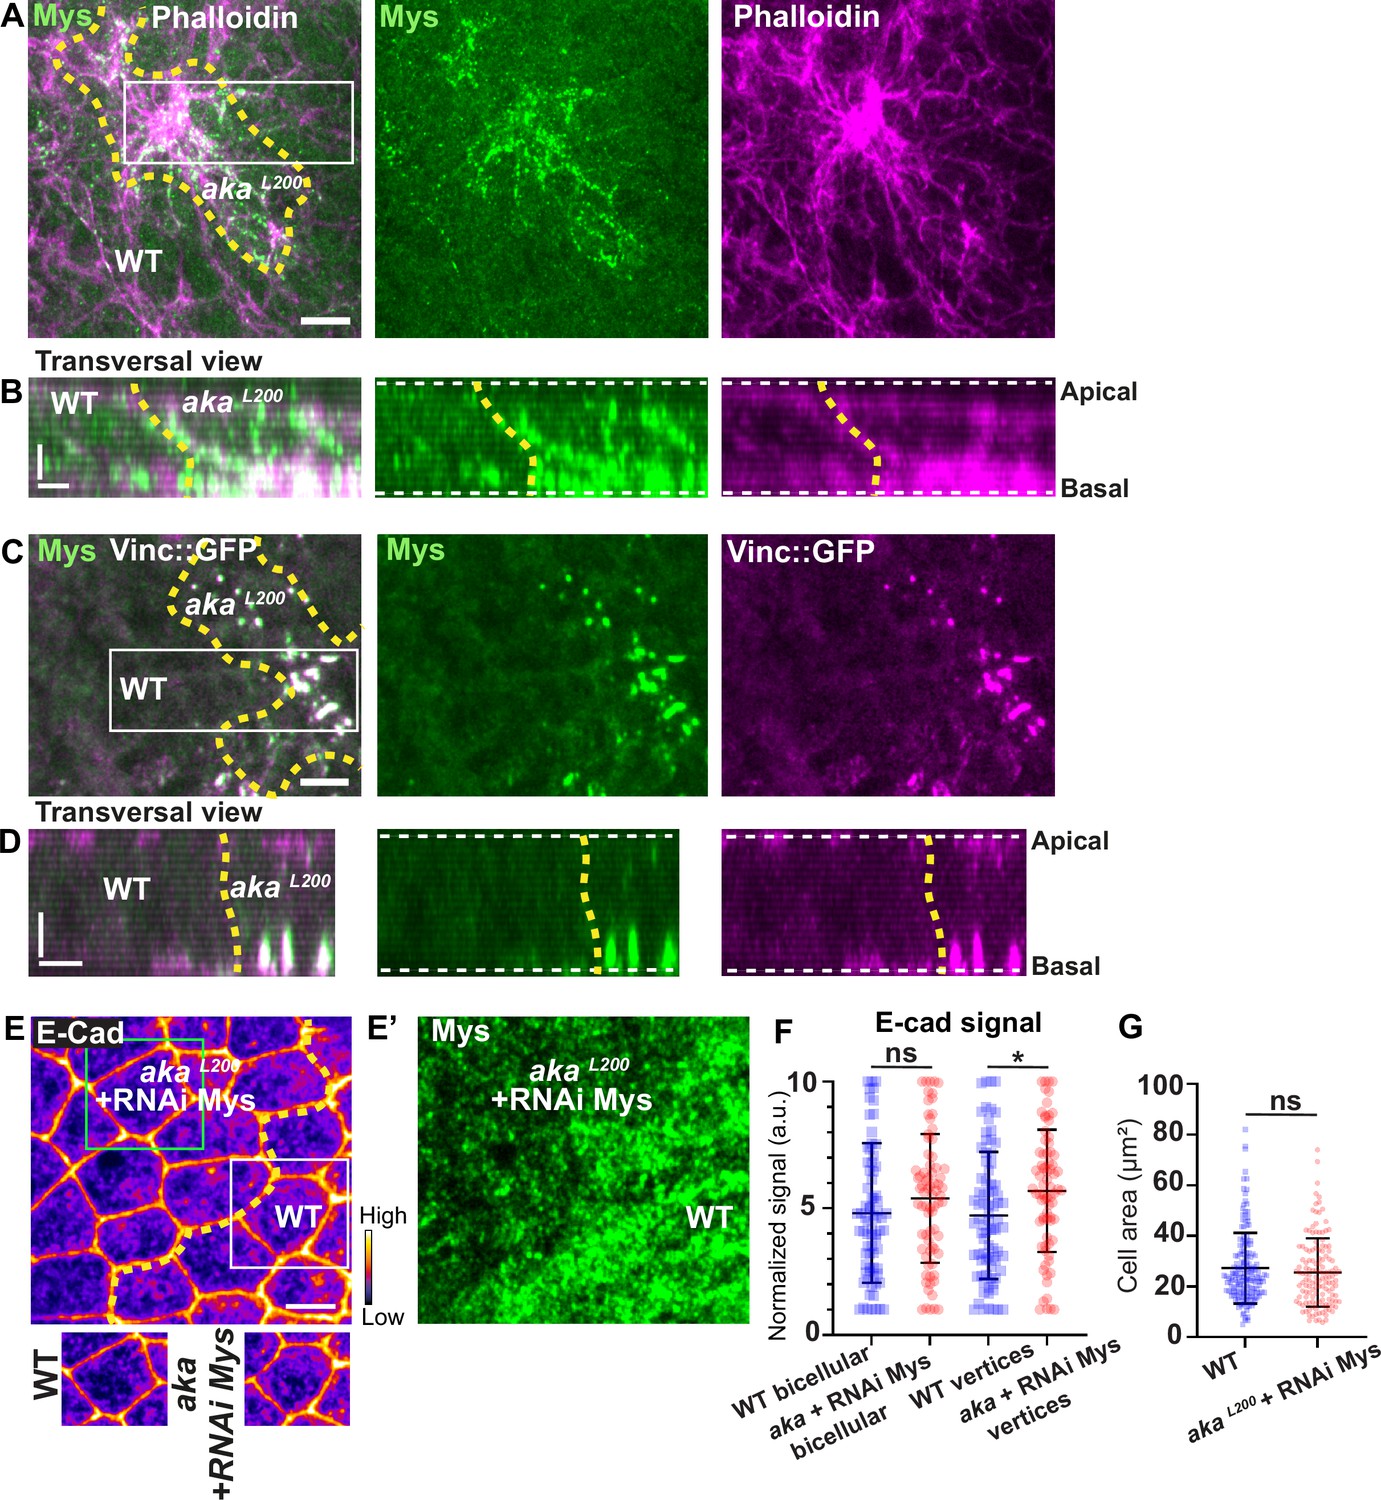
Loss of Anakonda triggers formation of focal adhesions contact.
(A–D) show nota stained with Mys (A–B, green) and F-actin (A–B, Phalloidin, magenta) or expressing Vinc::GFP (C–D, magenta) and stained with Mys (C–D, green) between 16 hr and 19 hr after puparium formation (APF), after heat-shock to induce clone of wild-type and mutant cells for Aka. (A) Localisation of Mys (green) and F-actin (magenta) in both wild-type and akaL200 cells in a planar view at the basal level, separated by the dashed yellow line. (B) Transversal view of images depicted in A. (C) Localisation of Mys (green) and Vinc::GFP (magenta) in both wild-type and akaL200 cells in a planar view at the basal level, separated by the dashed yellow line. (D) Transversal view of images depicted in C (n>5 pupae for each condition). (E–E’) Localisation of E-cad (anti-E-cad; E, fire colour) and Mys stained with Mys antibody (E’, green colour) in wild-type and akaL200 cells in which Mys is knocked down (RNAi-Mys). Wild-type and akaL200 cells are separated by the dashed yellow lines in (E). (F) Plot of the standardised E-cad signal at bicellular junctions and vertices in wild-type (blue squares) and akaL200+Mys knock-down cells (red circles) (n=76 and 76 bicellular junctions and n=81 and 76 vertices for wild-type and akaL200 cells respectively; n>5 pupae for each condition). (G) Quantification of the cell area (in µm2) of WT (wild-type) (blue squares, n=171 cells, n>5 pupae) and akaL200+Mys knock-down cells (red circles, n=139 cells, n>5 pupae). Bars show mean ± SD, *p<0.05, Mann–Whitney test. A calibration bar shows LUT for grey value range. The scale bars represent 5 µm in A and C and E and 3 µm in B and D. White square represents close-up of WT and green square of akaL200 situations for panel E. Dashed white lines in (D) highlight apical and basal limits of the notum.
Figure 6—figure supplement 1
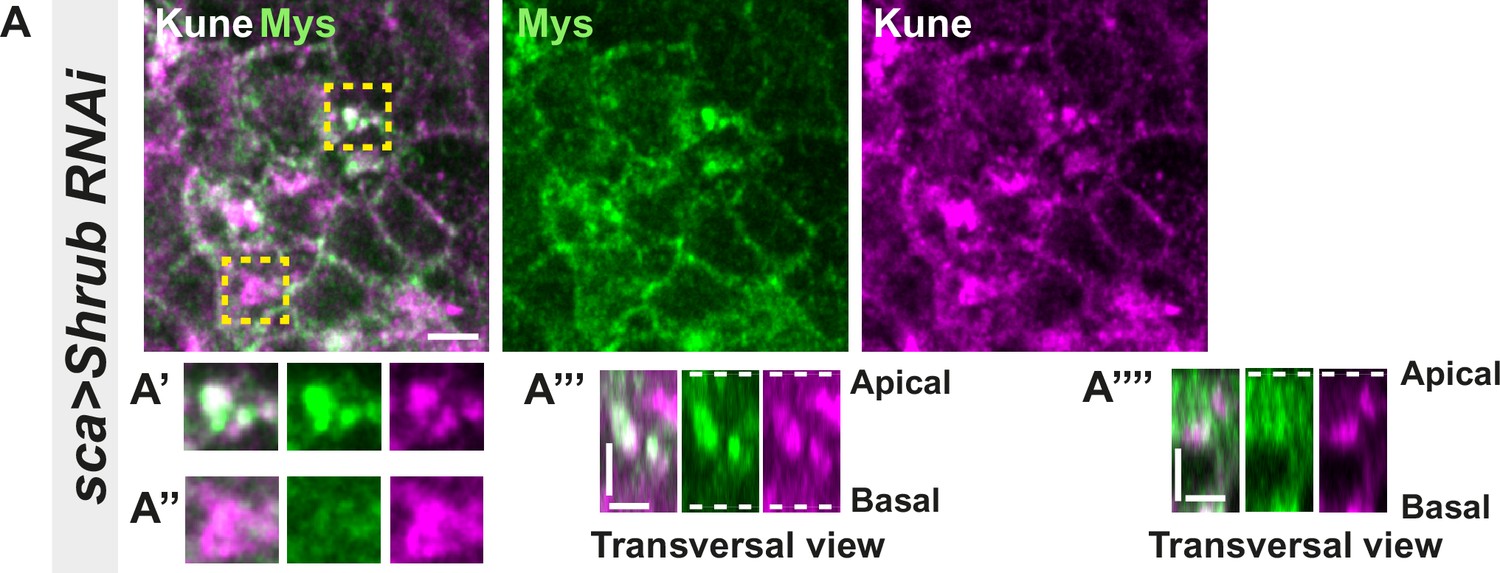
Loss of function of Shrub in notum cells leads to Myospheroid and Kune-Kune abnormal localisation; related to Figure 6.
(A–A’’’’) Localisation of Mys (anti-Mys, green) and Kune (anti-Kune, magenta) in cells expressing UAS::Shrub-RNAi under sca-Gal4 control. Yellow dashed square shows (A’–A’’’’) magnification of cells with (A’) or without colocalisation (A’’) between Mys and Kune at basal cell level in a planar view (A’–A’’) and transversal view (A’’’–A’’’’). The scale bar represents 5 µm (A) and 3 µm in (A’’’ and A’’’’). Dashed white lines in (A’’’ and A’’’’) highlight apical and basal limits of the notum.
Figure 7
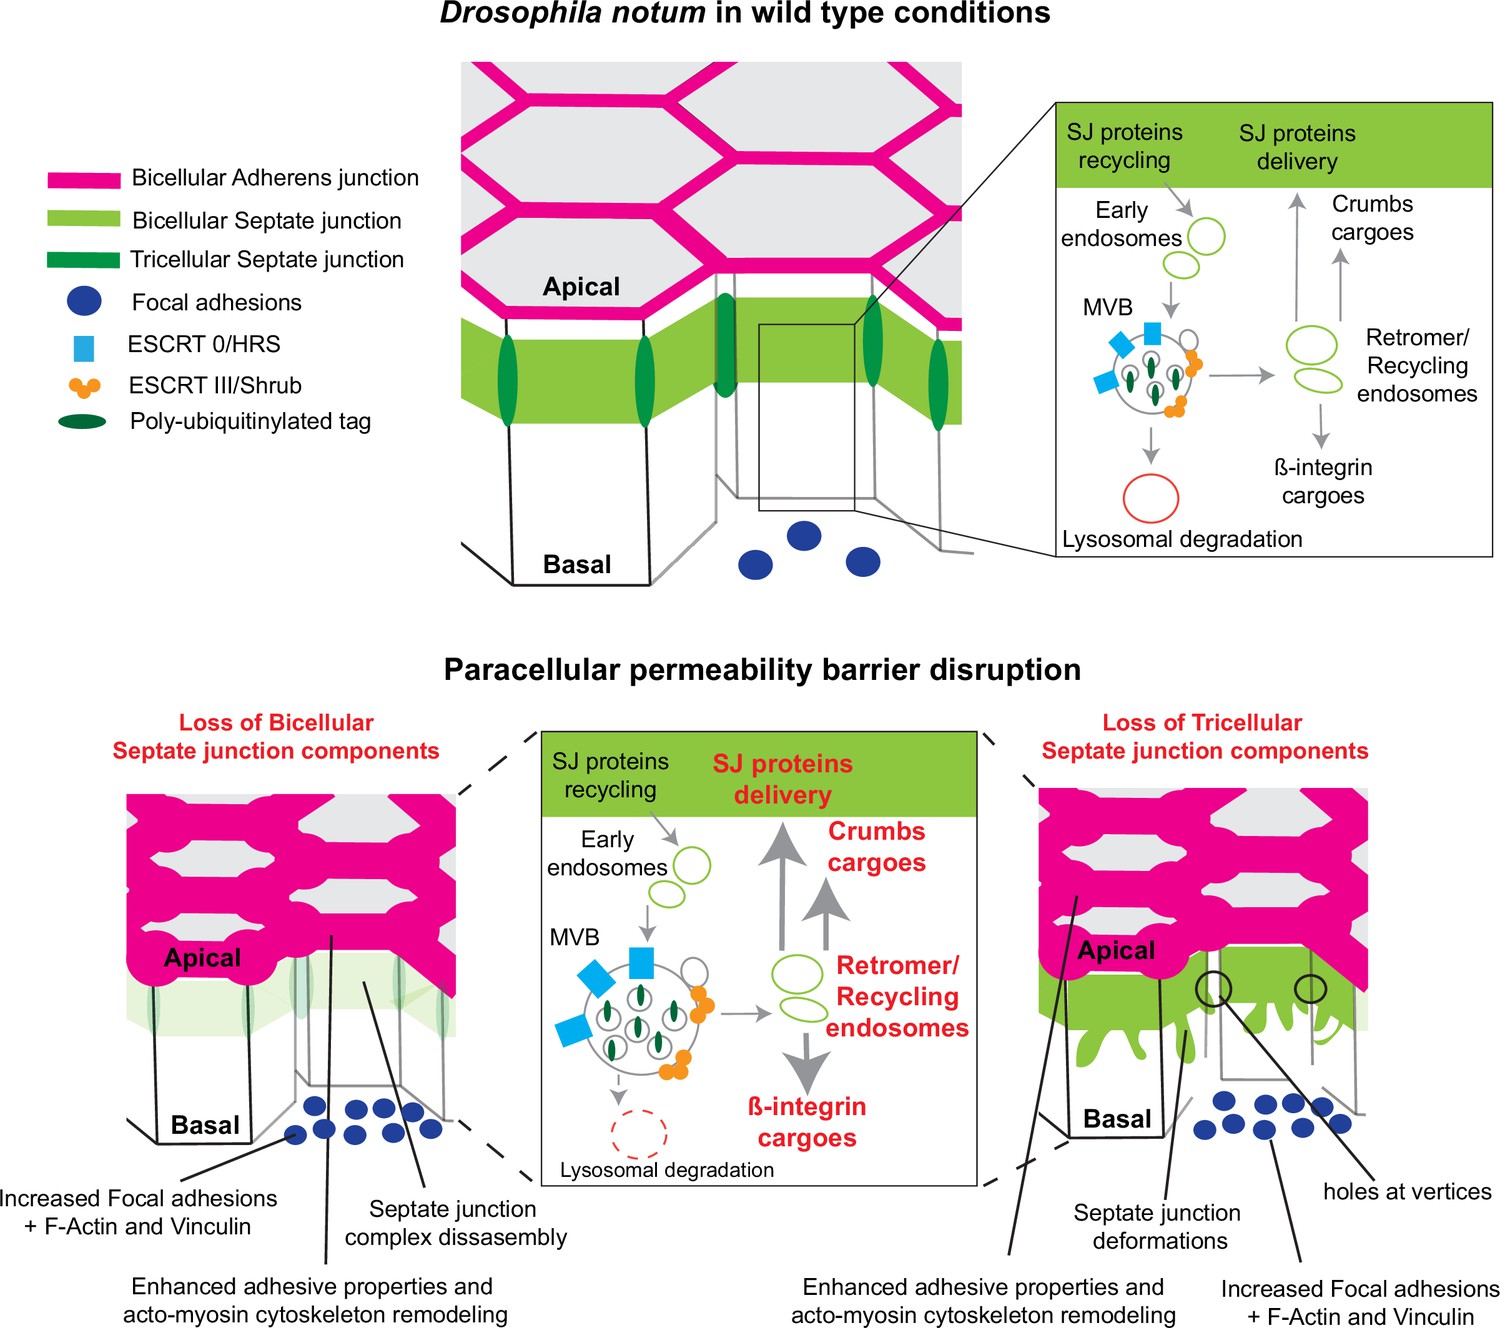
Model summarising the effects of the disruption of septate junction (SJ) integrity in pupal notum.
In wild-type conditions, bicellular SJ (bSJ) proteins, β-integrin, and Crumbs are recycled to the membrane, thanks to the endosomal–retromer complex. When the paracellular permeability function is compromised due to the loss of bSJ or tricellular SJ (tSJ) components, cells favour recycling over degradation, leading to increased levels of β-integrin and Crumbs at the cell membrane. The accumulation of β-integrin and Crumbs leads to a strengthening of the adhesive structure as shown by increased quantity of adherens junction (AJ) proteins but also by the appearance of focal adhesion contacts. We propose that the cell compensates the lack of bSJ contacts by increasing its adhesive properties.
Tables
Key resources table
| Reagent type (species) or resource | Designation | Source or reference | Identifiers | Additional information |
|---|---|---|---|---|
| Genetic reagent (Drosophila melanogaster) | Myo-II::GFPcrispr | Esmangart de Bournonville and Le Borgne, 2020 | N/A | |
| Genetic reagent (D. melanogaster) | hs-FLP; akaL200, FRT40A / CyO | Esmangart de Bournonville and Le Borgne, 2020 | N/A | |
| Genetic reagent (D. melanogaster) | ; E-cad::GFP; | Huang et al., 2009 | N/A | |
| Genetic reagent (D. melanogaster) | ; nrv2k13315, FRT40A / CyO | Chen et al., 2005 | DGRC 114351 | |
| Genetic reagent (D. melanogaster) | ; coldf05607, FRT40A / CyO | Kyoto Stock Center | Stock: 114 662 | |
| Genetic reagent (D. melanogaster) | ; Glidv3, FRT40A / CyO | Schulte et al., 2003 | Gift from Vanessa Auld | |
| Genetic reagent (D. melanogaster) | ;; FRT 82B, Crb 11A22 | Tepaß and Knust, 1990 | Gift from Ulrich Tepass | |
| Genetic reagent (D. melanogaster) | hs-FLP, UAS-GFP, y[1] w[*]; tub-GAL80 FRT40A; tub-GAL4/TM6C, Sb1, Tb1 | Lee and Luo, 2001 | BDSC Stock: 5192 | |
| Genetic reagent (D. melanogaster) | ; Shrub::GFP/CyO; | N/A | Gift from Juliette Mathieu | |
| Genetic reagent (D. melanogaster) | w;; Jub::GFP/TM2 | Rauskolb et al., 2014 | BDSC Stock: 56806 | |
| Genetic reagent (D. melanogaster) | w;; UAS-KAEDE | BDSC | BDSC Stock: 26161 | |
| Genetic reagent (D. melanogaster) | ;; Crb::GFP | Huang et al., 2009 | Crb::GFP-A GE24 | |
| Genetic reagent (D. melanogaster) | ;; Vinc::GFP | Kale et al., 2018 | Gift from Thomas Lecuit | |
| Genetic reagent (D. melanogaster) | w1118;; Karst::YFP | Kyoto Stock Center | Stock: 115 518 | |
| Genetic reagent (D. melanogaster) | hs-FLP; ubi-RFP nls, FRT40A / (CyO) | Claret et al., 2014 | Gift from Antoine Guichet | |
| Genetic reagent (D. melanogaster) | ; UAS-Aka-RNAi-TRiP; | Perkins et al., 2015 | BDSC Stock: 67014 | |
| Genetic reagent (D. melanogaster) | ; UAS-Nrx-IV-RNAi; | VDRC | Stock: 108 128 | |
| Genetic reagent (D. melanogaster) | ;; UAS-Cora-RNAi-TRiP | Perkins et al., 2015 | BDSC Stock: 9788 | |
| Genetic reagent (D. melanogaster) | ;; UAS-Shrub-RNAi-TRiP | Perkins et al., 2015 | BDSC Stock: 38305 | |
| Genetic reagent (D. melanogaster) | ;; UAS-Mys-RNAi-TRiP/TM3, Sb | Perkins et al., 2015 | BDSC Stock: 27735 | |
| Genetic reagent (D. melanogaster) | ;; pnr-Gal4/TM6, Tb1 | Calleja et al., 1996 | N/A | |
| Genetic reagent (D. melanogaster) | ;; sca-Gal4 | Mlodzik et al., 1990 | N/A | |
| Antibody | Anti-Coracle (Mouse, monoclonal) | DSHB | C615.16, RRID:AB_1161644 | (1:200) |
| Antibody | Anti-E-cad (Rat, monoclonal) | DSHB | DCAD2; AB_528120 | (1:500) |
| Antibody | Anti-Kune (Rabbit, polyclonal) | Nelson et al., 2010 | Gift from Mikio Furuse | (1:1000) |
| Antibody | Anti-HRS (Mouse, monoclonal) | DSHB | 27-4 | (1:100) |
| Antibody | Anti-Nrx-IV (Rabbit, polyclonal) | Stork et al., 2009 | Gift from Christian Klämbt | (1:1000) |
| Antibody | Anti-GFP (Goat, polyclonal) | Abcam | Cat#ab5450 | (1:1000) |
| Antibody | Anti-FK2 (Mouse, monoclonal) | Sigma-Aldrich | Cat#04-263 | (1:1000) |
| Antibody | Anti-Crb (Rat, polyclonal) | Richard et al., 2006 | Gift from Elisabeth Knust | (1:1000) |
| Antibody | Anti-Mys (Rabbit, monoclonal) | DSHB | CF.6G1, RRID:AB_528310 | (1:200) |
| Antibody | Anti phospho-Myo-II (Mouse, monoclonal) | Cell Signalling | Cat#mab 3675 | (1:1000) |
| Antibody | Cy2-, Cy3-, and Cy5-coupled secondary antibodies | The Jackson Laboratory | N/A | (1:300) |
| Antibody | Alexa Fluor 647 Phalloidin | Thermo Fisher Scientific | Cat#A22287 | (1:1000) |
| Chemical compound, drug | Paraformaldehyde | EMS | 19340-72 | |
| Chemical compound, drug | Triton X-100 | Euromedex | 2000B | |
| Chemical compound, drug | Phosphate Buffered Saline | Lonza | BE17-515F | |
| Chemical compound, drug | Voltalef | VWR | 24627.188 | |
| Software, algorithm | Fiji | Schindelin et al., 2012 | https://imagej.net/Fiji | |
| Software, algorithm | Prism 8 | GraphPad | GraphPad RRID:SCR_002798 | |
| Software, algorithm | RStudio | RStudio Team (2020). RStudio: Integrated Development for R. RStudio, PBC, Boston | http://www.rstudio.com RRID:SCR_000432 | |
| Software, algorithm | MATLAB | MATLAB and Statistics Toolbox Release 2012b | The MathWorks, Inc, Natick, MA, USA RRID:SCR_001622 | |
| Other | Confocal Microscope | Leica | LSM TCS SPE, TCS SP5 and TCS SP8 | |
| Other | Confocal Microscope | Zeiss | Confocal LSM 880 Airyscan |
Additional files
Download links
A two-part list of links to download the article, or parts of the article, in various formats.
Downloads (link to download the article as PDF)
Open citations (links to open the citations from this article in various online reference manager services)
Cite this article (links to download the citations from this article in formats compatible with various reference manager tools)
ESCRT-III-dependent adhesive and mechanical changes are triggered by a mechanism detecting alteration of septate junction integrity in Drosophila epithelial cells
eLife 13:e91246.
https://doi.org/10.7554/eLife.91246


