Differential interaction patterns of opioid analgesics with µ opioid receptors correlate with ligand-specific voltage sensitivity
- Department of Pharmacology and Clinical Pharmacy, University of Marburg, Germany
- Division of Physiology, Pharmacology and Neuroscience, School of Life Sciences, Queen's Medical Centre, University of Nottingham, United Kingdom
- Centre of Membrane Protein and Receptors, Universities of Birmingham and Nottingham, United Kingdom
- Department of Pharmaceutical Chemistry, University of Marburg, Germany
Figures
Figure 1 with 1 supplement
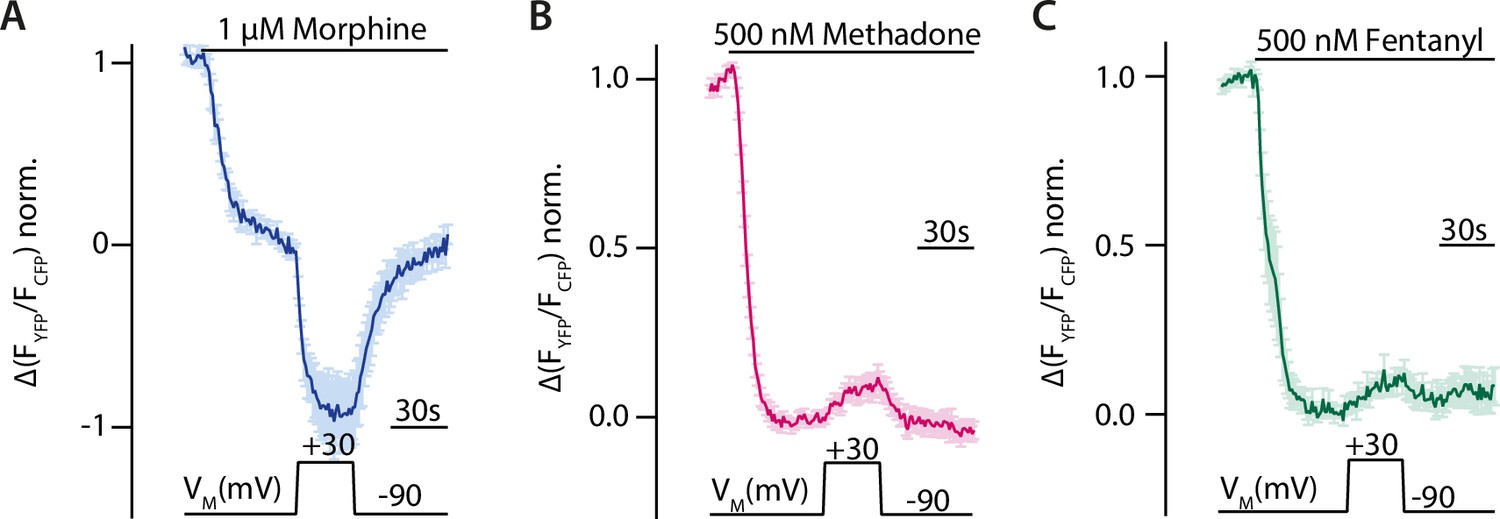
Voltage sensitivity of the µ opioid receptor (MOR) is ligand-specific.
(A–C) Averaged Förster resonance energy transfer (FRET)-based single-cell recordings of MOR-induced Gαi activation under voltage clamp conditions with wild-type (WT) receptor, Gαi-mTurquoise, cpVenus-Gγ2, and Gβ in HEK293T cells are plotted for the indicated agonists (mean ± SEM; A: n=8, B: n=13, C: n=12). The applied voltage protocol is indicated below. Depolarization to +30 mV increased the morphine-induced Gαi activation (A) and decreased the methadone- (B) or fentanyl- (C) induced Gαi activation.
-
Figure 1—source data 1
Source Data to Figure 1A.
- https://cdn.elifesciences.org/articles/91291/elife-91291-fig1-data1-v2.xlsx
-
Figure 1—source data 2
Source Data to Figure 1B.
- https://cdn.elifesciences.org/articles/91291/elife-91291-fig1-data2-v2.xlsx
-
Figure 1—source data 3
Source Data to Figure 1C.
- https://cdn.elifesciences.org/articles/91291/elife-91291-fig1-data3-v2.xlsx
Figure 1—figure supplement 1
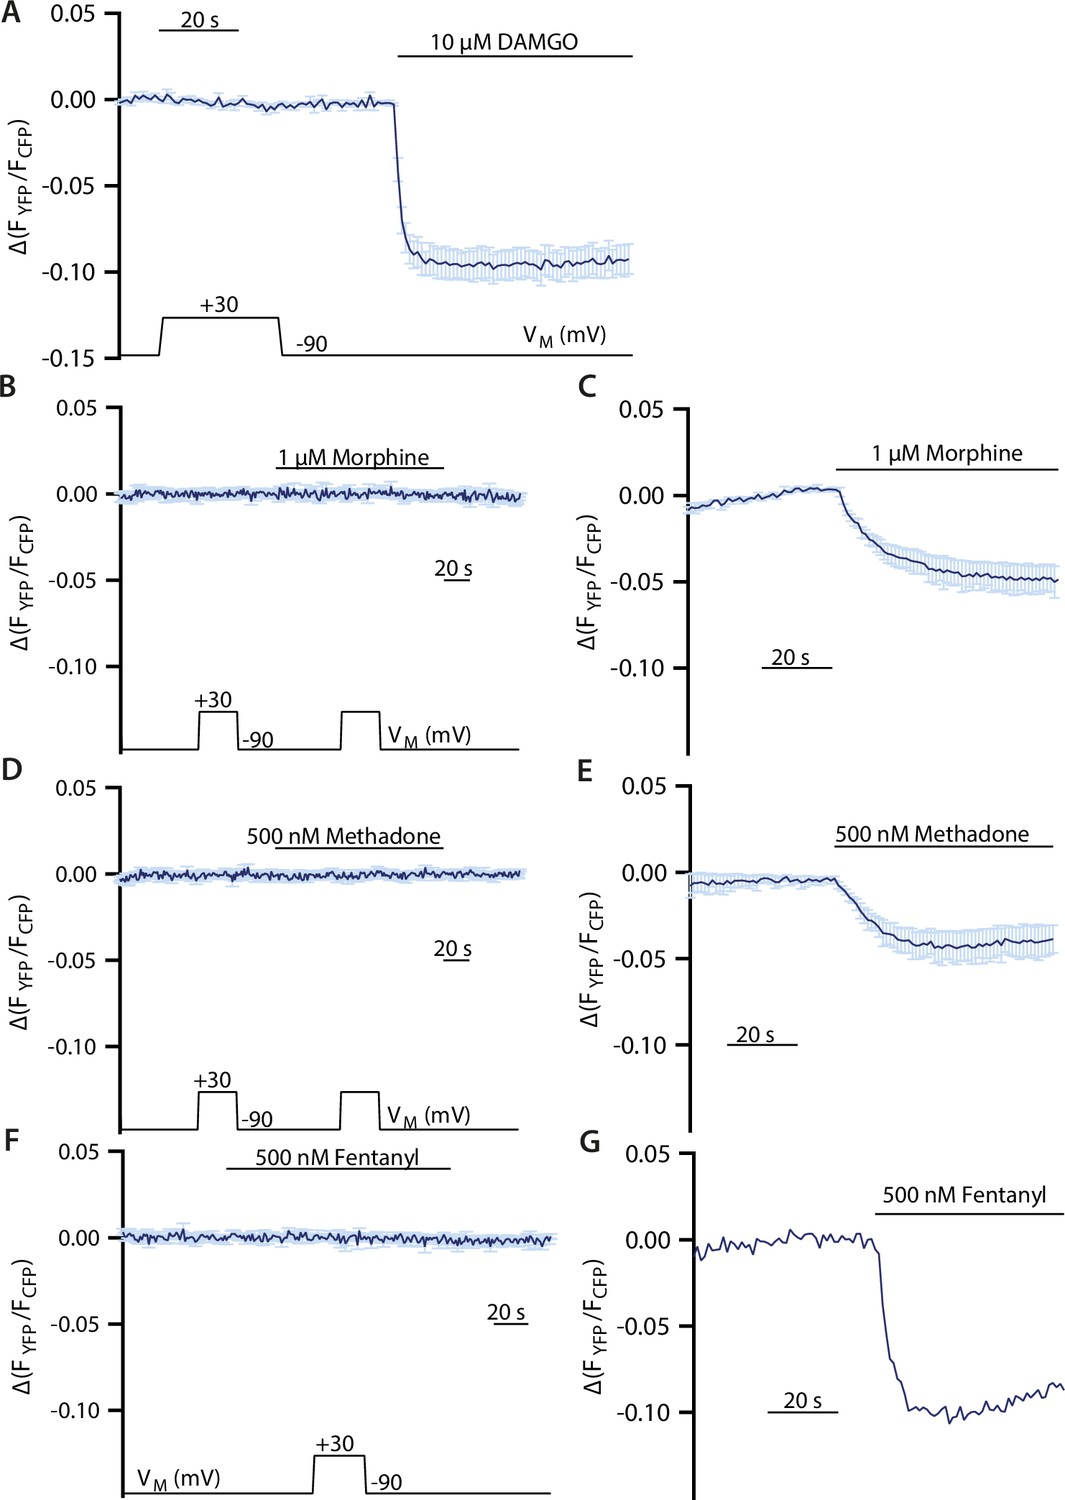
Control measurements for voltage effect of µ opioid receptor (MOR) in Gαi activation assay.
(A) Averaged Förster resonance energy transfer (FRET)-based single-cell recordings of MOR-induced Gαi activation under voltage clamp conditions with wild-type (WT) receptor in HEK293T cells (mean ± SEM; n=8). The applied voltage protocol is indicated below. Depolarization during application of buffer and without application of agonists has no effect. (B, D, F) Averaged FRET-based single-cell recordings of Gαi activation under voltage clamp conditions without transfection of the MOR receptor in HEK293T cells (mean ± SEM B: n=7, D: n=7, F: n=6). Neither a depolarization under application of buffer nor the depolarization under application of agonist showed an effect. (C, E) Averaged FRET-based single-cell recordings of Gαi activation induced by MOR-WT in HEK293T cells (mean ± SEM, E: n=4, E: n=4). Measurements were performed in parallel to the experiments depicted in B and D as positive control. (G) Representative FRET-based single-cell recording of Gαi activation induced by MOR-WT in HEK293T cells. Measurements were performed in parallel to the experiments depicted in F as positive control.
Figure 2 with 2 supplements
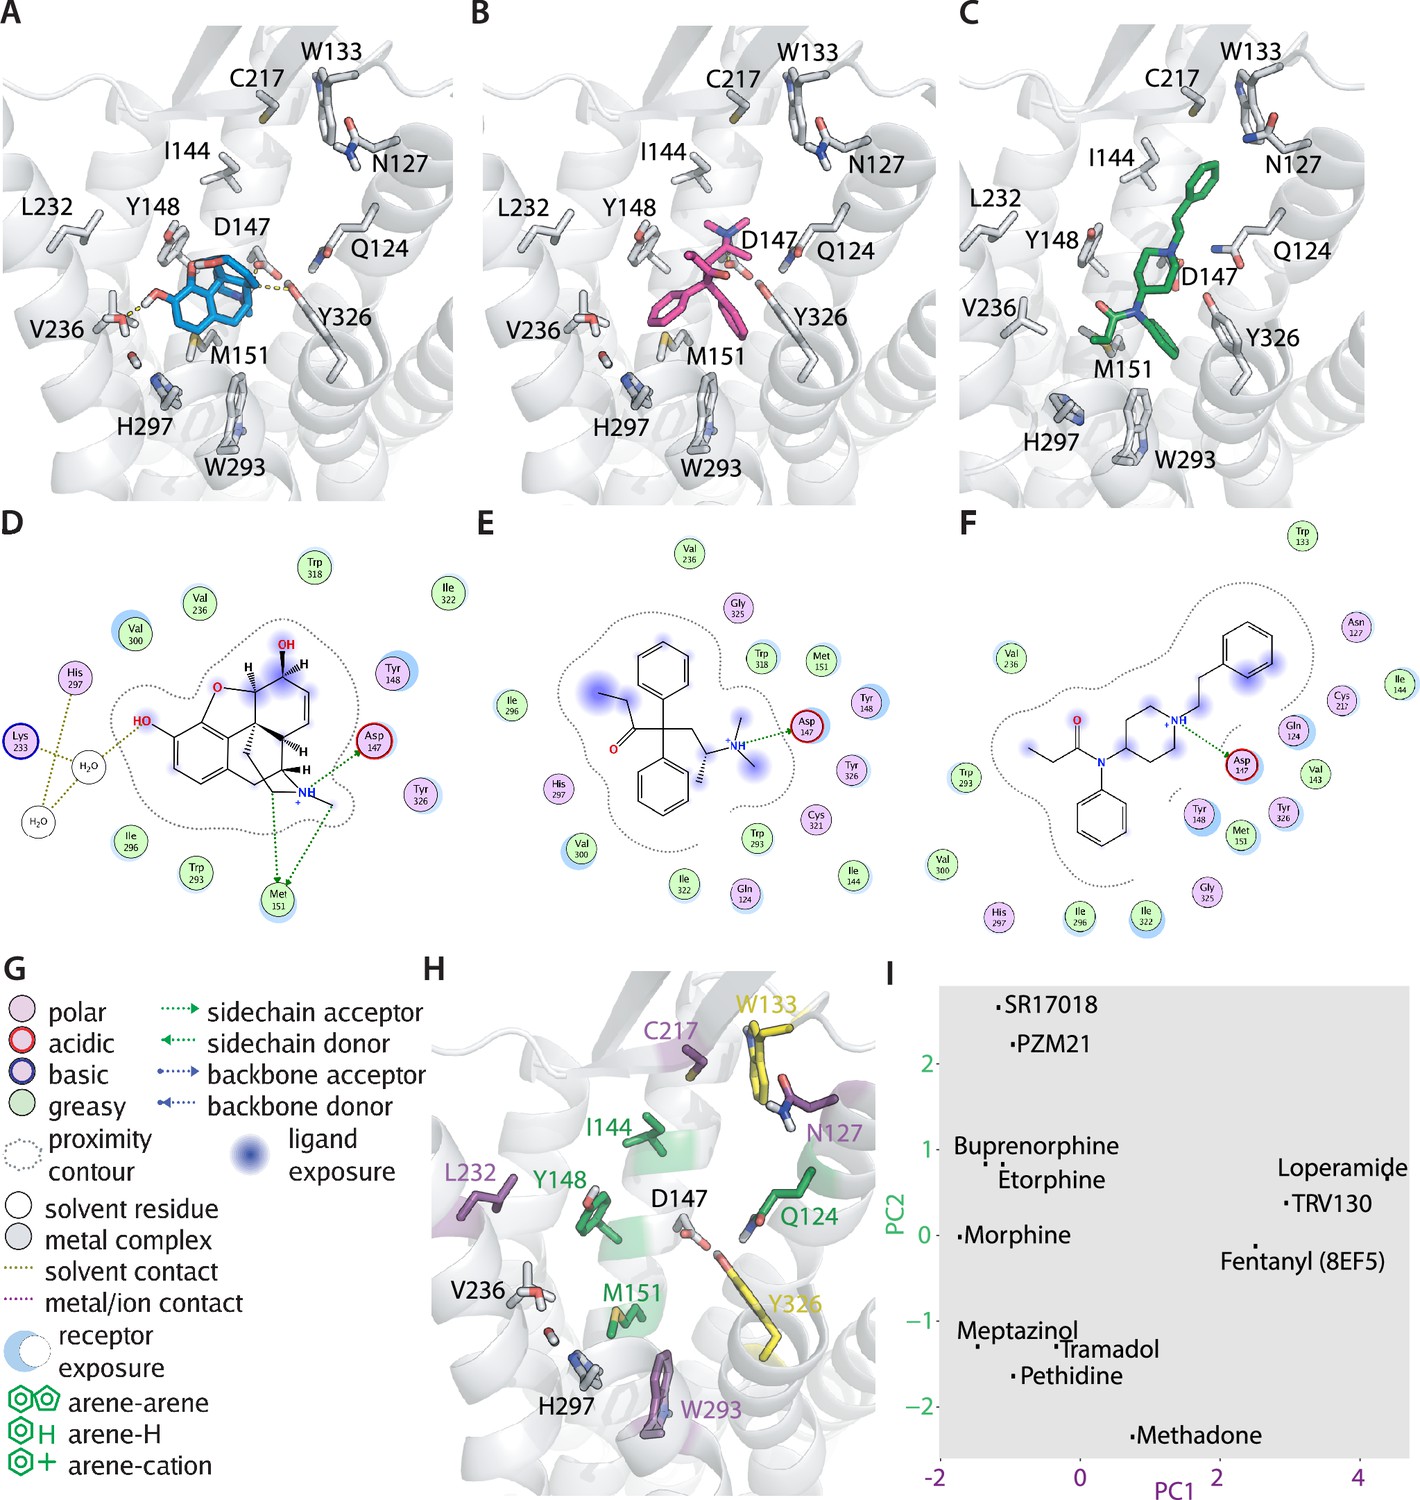
Predicted binding poses of different opioids at the µ opioid receptor (MOR) reveal differential interaction patterns.
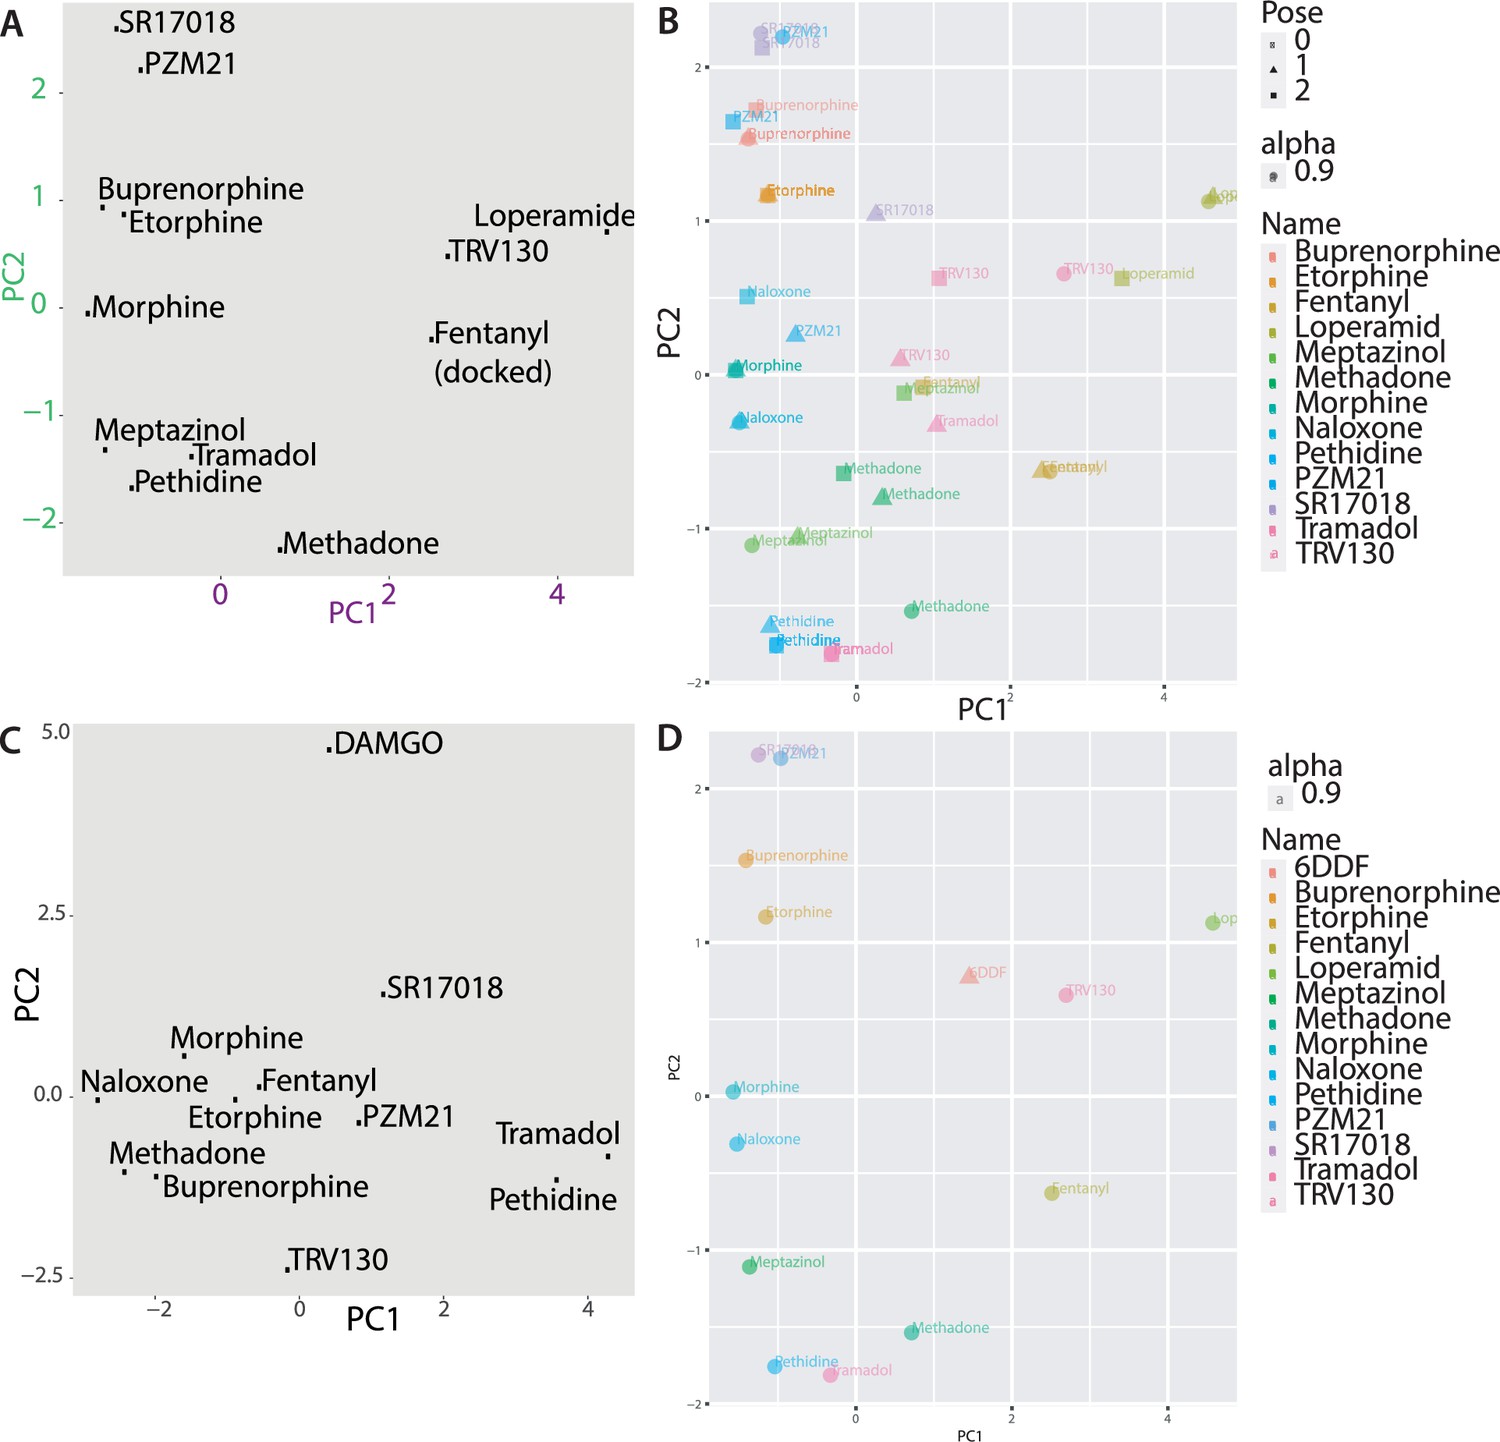
(A–B) Binding poses of morphine (A) and methadone (B) docked to the MOR are illustrated as a view from the extracellular side, H-bonds are indicated as dotted lines. (C) Binding mode of fentanyl taken from the experimental structure (PDB 8EF5). (D–G) 2D interaction maps displaying the calculated interactions for morphine (D), methadone (E), and fentanyl (F) based on the docking-derived poses shown in A–C. Key for the interaction maps is depicted in G. (H) Important interactions of several opioid ligands docked to MOR were identified by a fingerprint analysis, which led to the definition of the principal components plotted in (I). Interactions contributing strongest to component 1 (PC1) can be found within helices 2, 5, and 6 and extracellular loop 2 (N1272.50, C21745.50, L2325.38, and W2936.48, depicted in violet), whereas important interactions contributing strongest to component 2 (PC2) are mostly found in helices 2 and 3 (Q1242.60, I1443.29, Y1483.33, and M1513.36, depicted in green). Residues depicted in yellow (W13323.50 and Y3267.43) are important interactions for both components. (I) PC1 and PC2 from the principal component analysis of the interaction fingerprints of all agonists were plotted.
-
Figure 2—source data 1
Source Data to Figure 2I.
- https://cdn.elifesciences.org/articles/91291/elife-91291-fig2-data1-v2.zip
Figure 2—figure supplement 1
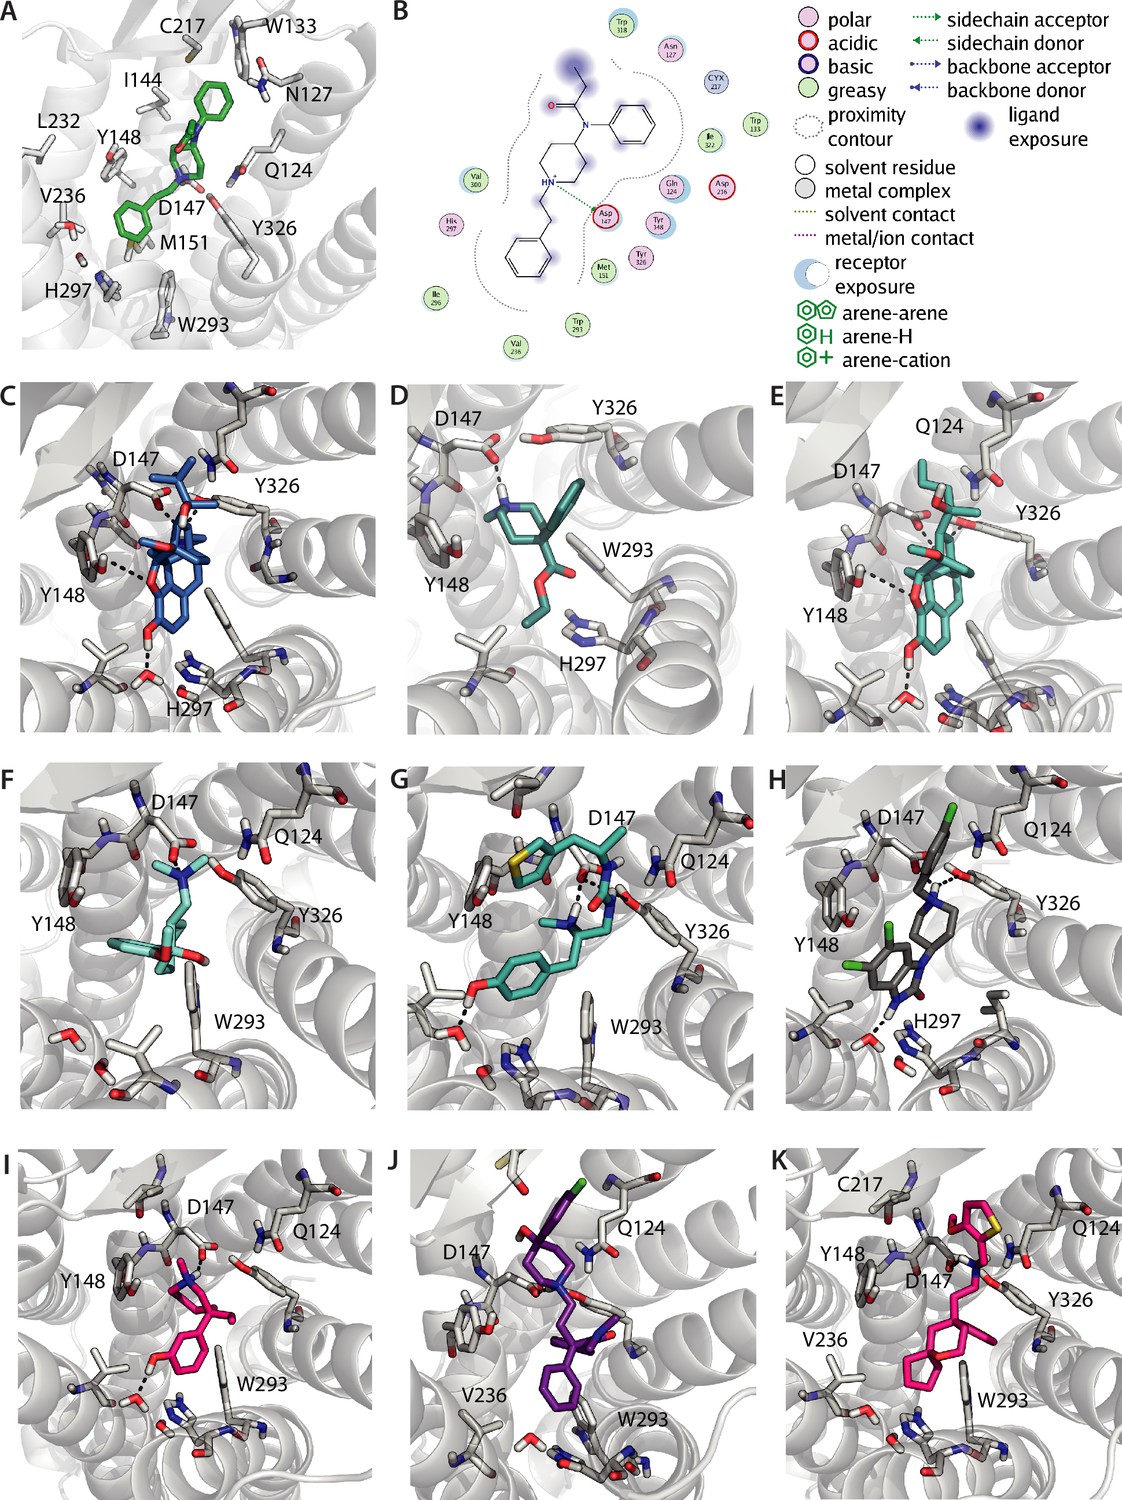
Binding poses of different opioids docked to µ opioid receptor (MOR).
(A) Binding pose of fentanyl resolved by docking. (B) 2D interaction map displaying calculated interactions for the docked pose of fentanyl. (C–K) The binding poses of different opioids were analyzed regarding their fingerprints in Figure 2I. The fingerprints were calculated based on the binding poses of buprenorphine (C), pethidine (D), etorphine (E), tramadol (F), PZM21 (G), SR17018 (H), meptazinol (I), loperamide (J), and TRV130 (K).
Figure 2—figure supplement 2
Binding poses of different opioids docked to µ opioid receptor (MOR).
(A) Principal component analysis using the docked fentanyl-binding pose. (B) Principal component analysis of the top three poses for every ligand. (C) The binding mode of DAMGO resolved in PDB 6DDE was aligned to the conformation used for our docking calculations and the fingerprints were analyzed. As DAMGO is a large peptide, its fingerprint differs substantially from the other evaluated opioid ligands. (D) Principal component analysis for the different ligands with DAMGO transformed into the already described space. DAMGO (from the PDB 6DDF) does not cluster with any of the other ligands, confirming the substantially different behavior of DAMGO in the docking and fingerprint analysis.
Figure 3 with 4 supplements

Effects on function.
and ligand binding of point mutations corroborate binding poses of different opioids at the µ opioid receptor (MOR).
(A) Concentration-response curve for Gαi activation induced by the depicted agonist were fitted for MOR wild-type (WT) and the pEC50-values (morphine = 9.35, methadone = 6.62, fentanyl = 9.51) were calculated. Data was collected by single-cell Förster resonance energy transfer (FRET) measurements and each data point represents mean ± SEM. (B) Representative live-cell confocal image of 50 nM sulfo-Cy5-bearing fluorescent buprenorphine-based ligand (red) (Schembri et al., 2015) in cells expressing MOR-WT. Cells were co-stained with Hoechst33342 (blue). (C) Competition-binding curves for displacement of fluorescent ligand for WT MOR. Cy5 intensity was normalized to the number of cells calculated through Hoechst-staining, normalized to maximum binding and pIC50-values (morphine = 6.35, methadone = 9.1, fentanyl = 7.66) were calculated. Each data point represents mean ± SEM of a minimum of three independent experiments performed in triplicate. (D) The pEC50-values for Gαi activation and pIC50-values for competition binding were plotted in a bar graph (± SEM) showing the loss or gain in pEC50 and pIC50 depending on the point mutation. The mutants M151A, K233A, K233E, W293F, H297A, H297F, V300F, and V300L couldn’t be evaluated regarding competition binding as some mutants showed no detectable binding of the fluorescent ligand (M151A, W293F, H297A, H297F, V300F, and V300L) or showed no displacement of the fluorescent ligand (K233A and K233E), as shown in Figure 3—figure supplement 2 and Figure 3—figure supplement 3. All calculated pEC50 and pIC50 values and the corresponding 95% confidence intervals are listed in Supplementary file 2.
-
Figure 3—source data 1
Source Data to Figure 3A.
- https://cdn.elifesciences.org/articles/91291/elife-91291-fig3-data1-v2.xlsx
-
Figure 3—source data 2
Source Data to Figure 3C.
- https://cdn.elifesciences.org/articles/91291/elife-91291-fig3-data2-v2.xlsx
-
Figure 3—source data 3
Source Data to Figure 3D.
- https://cdn.elifesciences.org/articles/91291/elife-91291-fig3-data3-v2.xlsx
Figure 3—figure supplement 1
Functional effects of the mutations displayed by Gαi activation and GRK2 interaction.
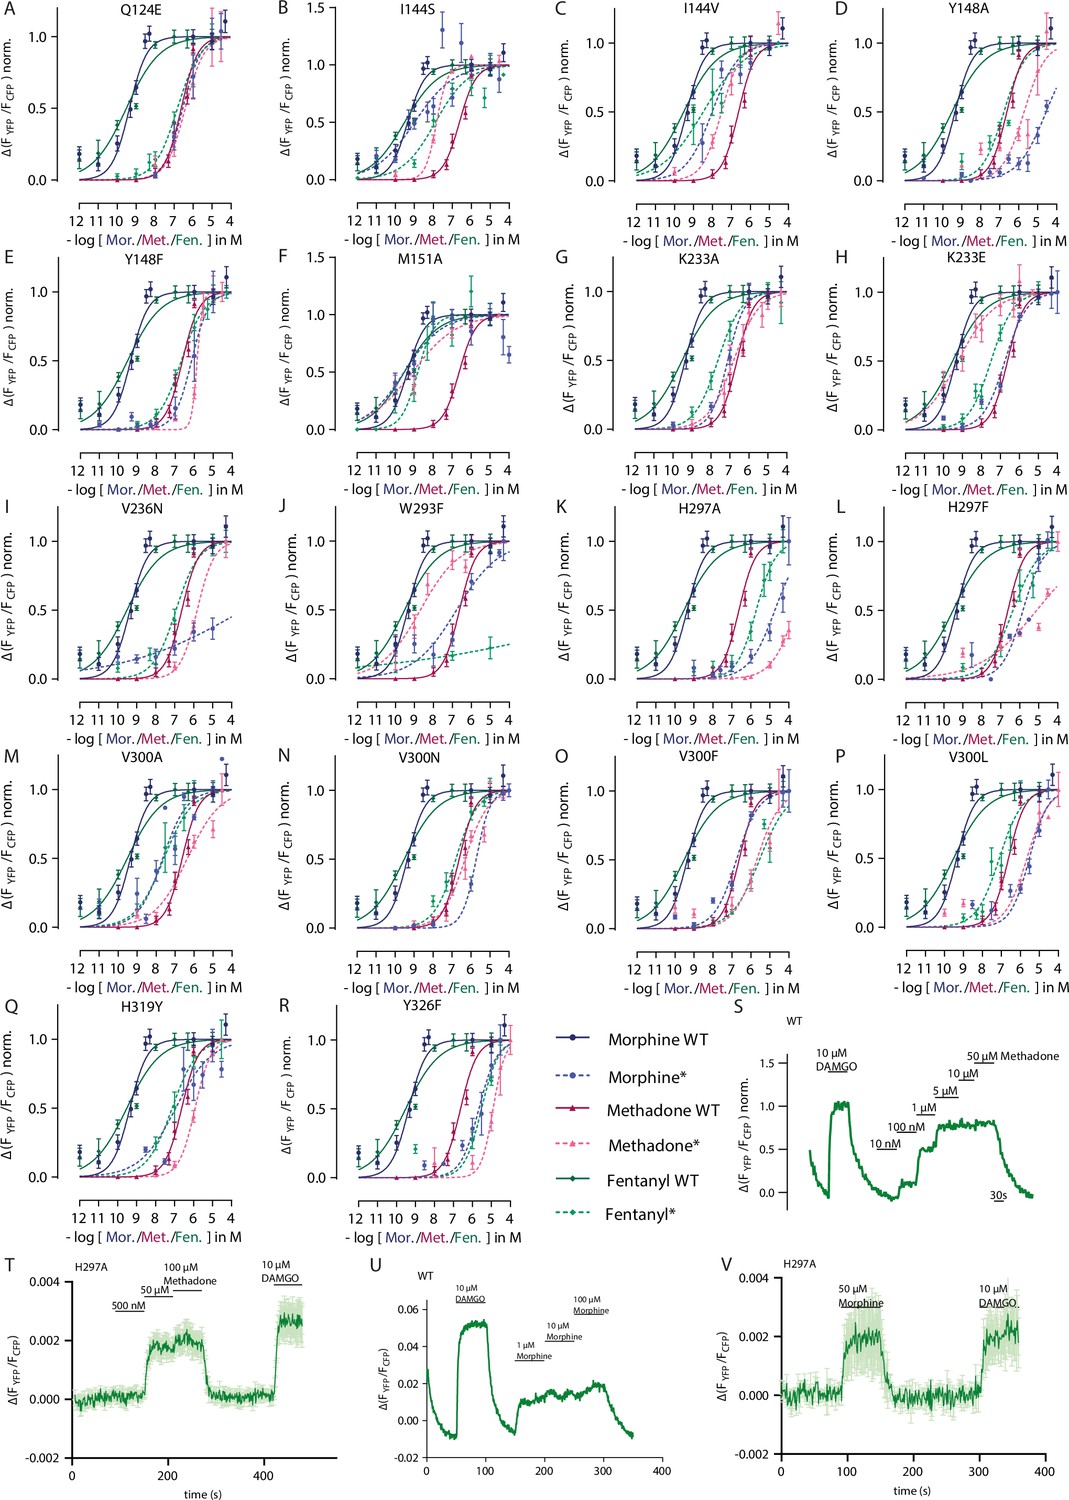
(A–R) Concentration-response curves for Gαi activation induced by mutated versions of µ opioid receptor (MOR) measured by single-cell Förster resonance energy transfer (FRET). Cells expressing MOR wild-type (WT) or mutated versions of the receptor were stimulated with morphine (blue), methadone (magenta), or fentanyl (green). Mutated versions of receptor are shown as dotted line. Data shown as mean ± SEM. For simplification, maximum Gαi activation induced by the respective agonist is set to 1. EC50-values were calculated (Supplementary file 2), normalized to WT and plotted in Figure 3D. (S, U) Representative FRET-based single-cell recording of MOR-GRK2 interaction induced by agonist application. Maximum activation for normalization was induced by 10 µM DAMGO. (T, V) Average single-cell recording of MOR-H297A mutant. For methadone (T), a saturation of the assay can be achieved with extremely high concentrations of methadone. For morphine (V), there’s an interaction detectable as well. As the Gαi activation displays a strong amplification, conclusions on efficacy changes induced by mutants can only be evaluated by direct one-to-one interactions like the GRK interaction. However, as the efficacy of activation induced by DAMGO seems to be weakened by this mutation, reliable efficacy values for the mutations can’t be calculated as there was no normalization possible.
Figure 3—figure supplement 2
Effects on fluorescent ligand binding of the mutations.
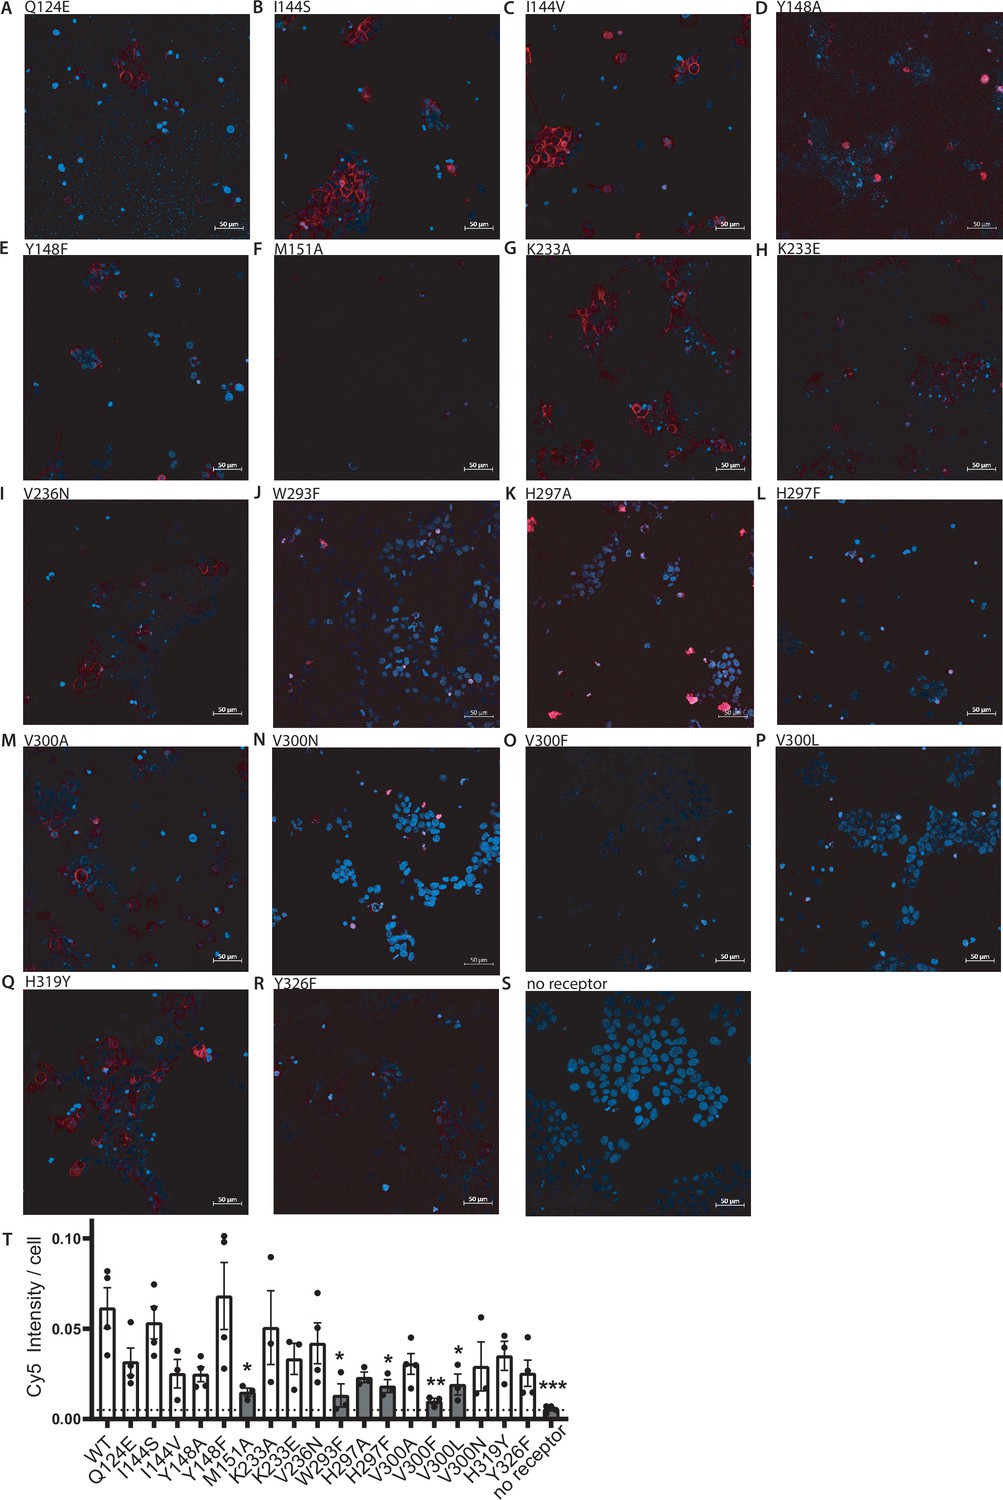
(A–S) Representative live-cell confocal images of 50 nM sulfo-Cy5-bearing fluorescent buprenorphine-based ligand (red) in cells expressing the respective µ opioid receptor (MOR) mutant (A–R) or without transfection of the receptor (S). Cells were co-stained with Hoechst33342 (blue). (T) Comparison of maximum Cy5 intensity/cell of the different variants of the MOR and without receptor. Significance in comparison to wild-type (WT) by an ordinary one-way ANOVA (p<0.001; *p<0.05, **p<0.005, ***p<0.0005). The bars marked in gray, no binding of the fluorescent ligand could be detected and were excluded for further evaluation.
Figure 3—figure supplement 3
Effects of the mutations on ligand binding determined by fluorescent ligand-binding competition assays.
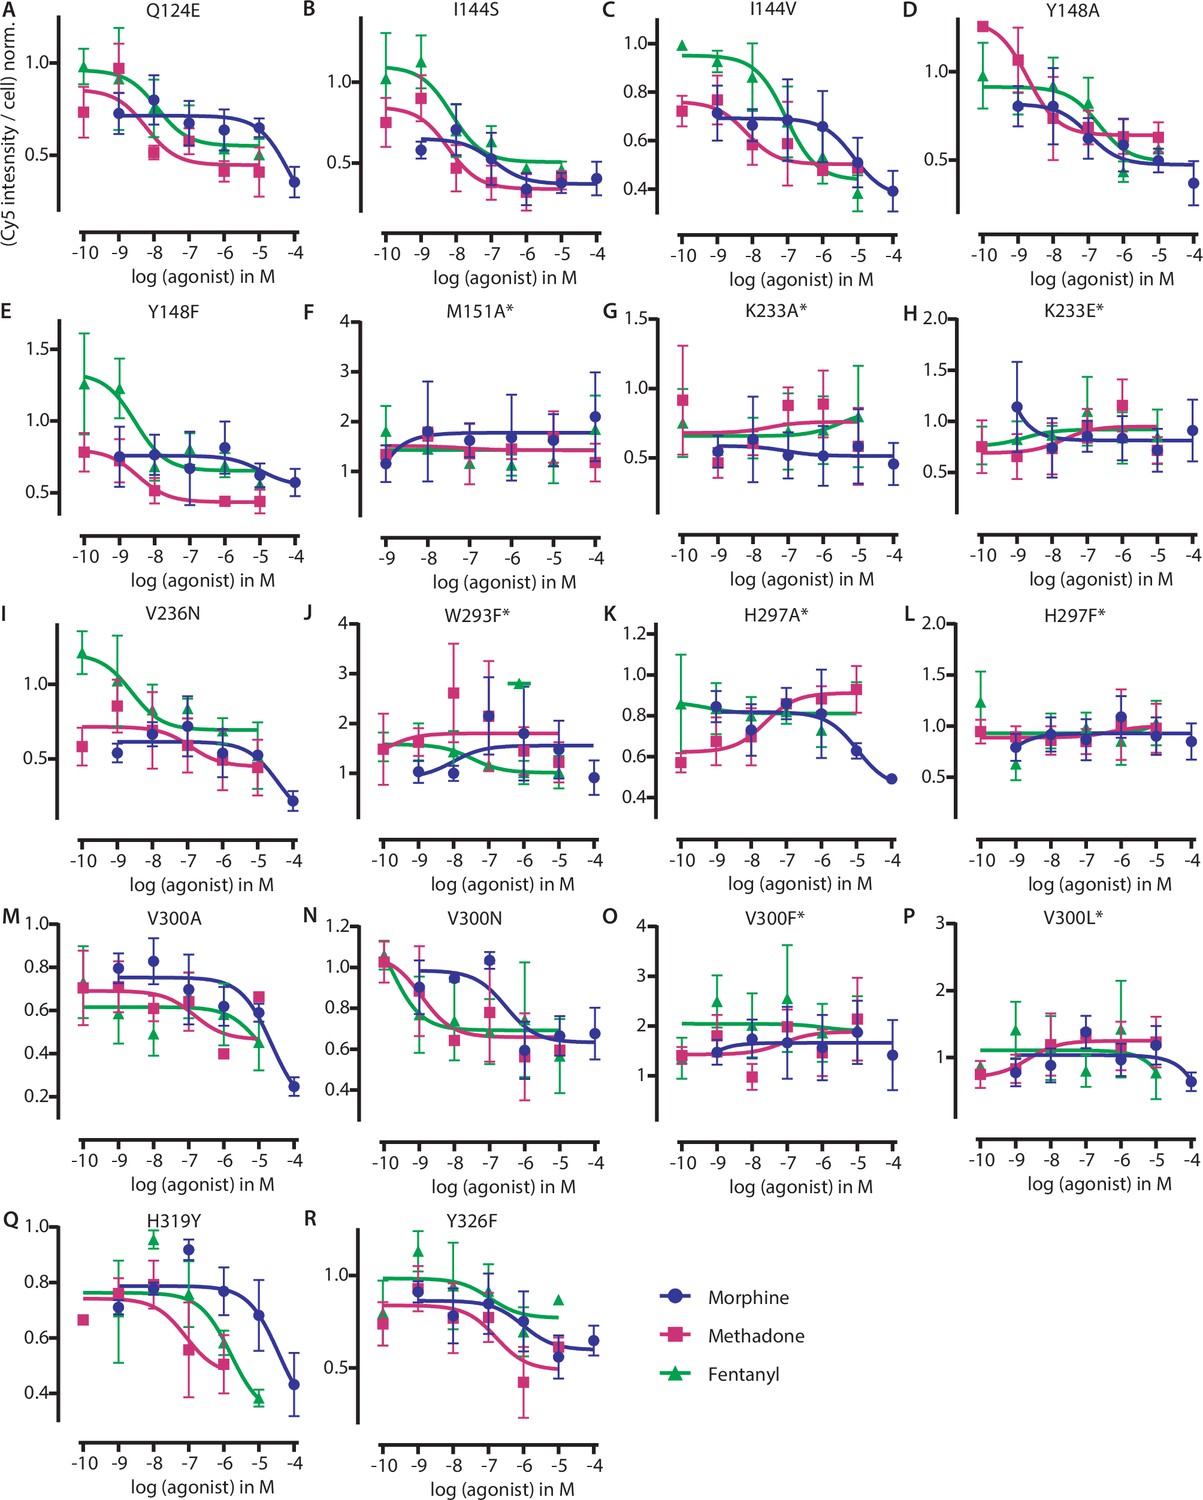
(A–R) Competition-binding curves for displacement of fluorescent ligand for mutated versions of µ opioid receptor (MOR). Cy5 intensities (relative to the number of cells measured by Hoechst-staining) were normalized to maximum binding and fitted by a non-linear least squares fit. The corresponding pIC50-values were calculated (Supplementary file 2). The same data were normalized to wild-type (WT) and plotted in Figure 3D. Each data point represents mean ± SEM of minimum three independent experiments performed in triplets. The curves marked with * weren’t evaluated further as the fluorescent ligand wasn’t binding to this mutant or the ligand couldn’t be displaced.
Figure 3—figure supplement 4
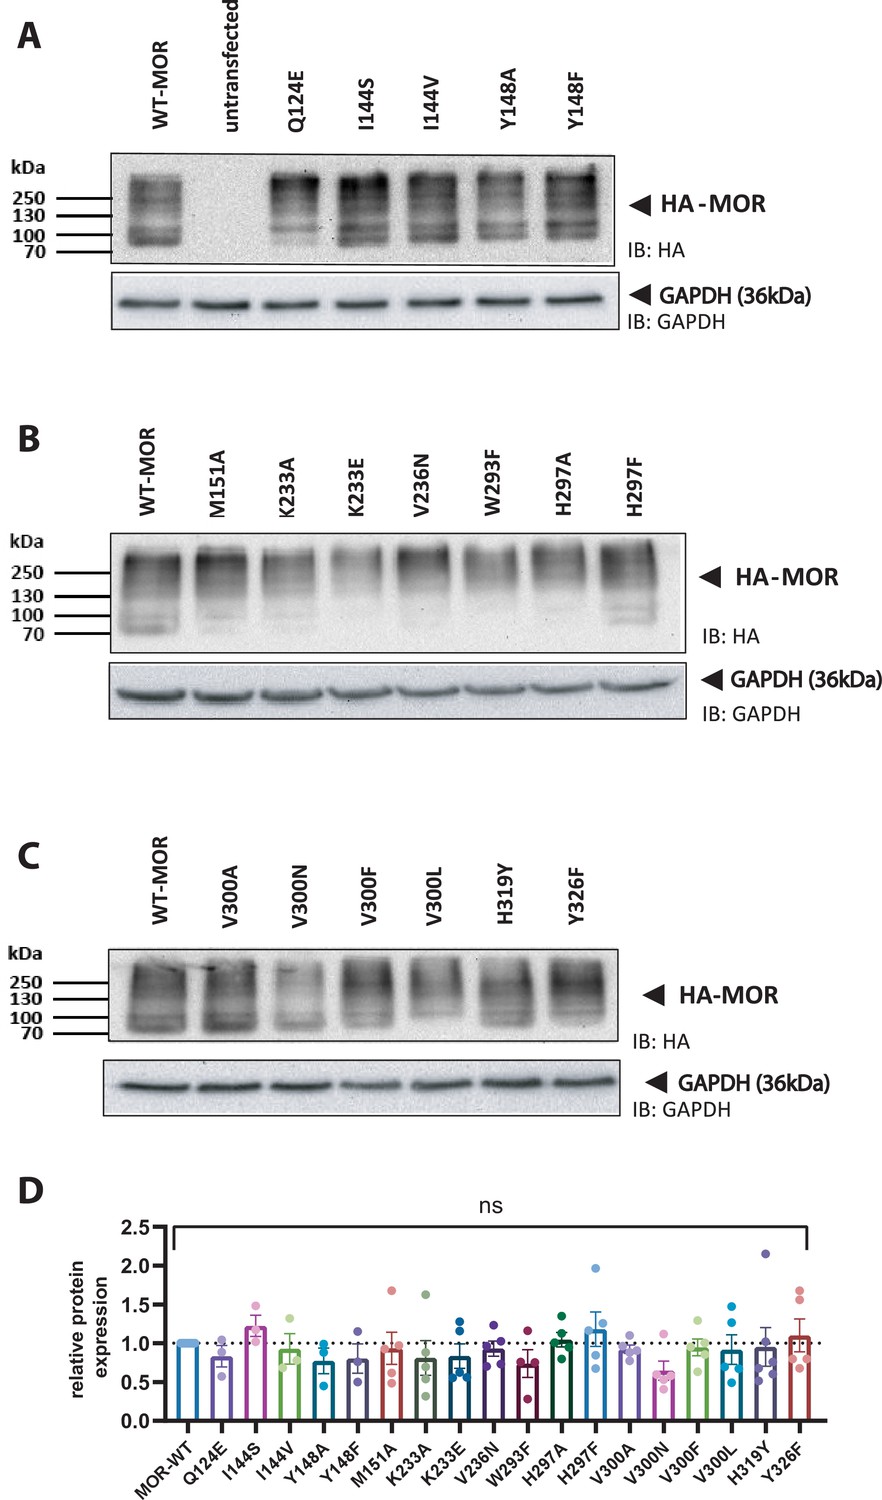
Expression levels of the receptor variants analyzed with western blot.
(A–C) Representative western blots for HEK293T cells transfected with HA-tagged wild-type (WT) or mutated receptor (n=3–5, with min. 3 independent transfections) illustrating comparable expression levels of the receptor variants. (D) Evaluation of the expression levels of the receptor variants normalized to the expression of GAPDH. No significant difference could be observed between the different variants (ordinary one-way ANOVA).
-
Figure 3—figure supplement 4—source data 1
Source Data to Figure 3—figure supplement 4A–C.
- https://cdn.elifesciences.org/articles/91291/elife-91291-fig3-figsupp4-data1-v2.pdf
-
Figure 3—figure supplement 4—source data 2
Source Data to Figure 3—figure supplement 4D.
- https://cdn.elifesciences.org/articles/91291/elife-91291-fig3-figsupp4-data2-v2.pdf
-
Figure 3—figure supplement 4—source data 3
Source Data to Figure 3—figure supplement 4D.
- https://cdn.elifesciences.org/articles/91291/elife-91291-fig3-figsupp4-data3-v2.pdf
-
Figure 3—figure supplement 4—source data 4
Source Data to Figure 3—figure supplement 4D.
- https://cdn.elifesciences.org/articles/91291/elife-91291-fig3-figsupp4-data4-v2.pdf
-
Figure 3—figure supplement 4—source data 5
Source Data to Figure 3—figure supplement 4D.
- https://cdn.elifesciences.org/articles/91291/elife-91291-fig3-figsupp4-data5-v2.pdf
-
Figure 3—figure supplement 4—source data 6
Source Data to Figure 3—figure supplement 4D.
- https://cdn.elifesciences.org/articles/91291/elife-91291-fig3-figsupp4-data6-v2.pdf
-
Figure 3—figure supplement 4—source data 7
Source Data to Figure 3—figure supplement 4D.
- https://cdn.elifesciences.org/articles/91291/elife-91291-fig3-figsupp4-data7-v2.pdf
-
Figure 3—figure supplement 4—source data 8
Source Data to Figure 3—figure supplement 4D.
- https://cdn.elifesciences.org/articles/91291/elife-91291-fig3-figsupp4-data8-v2.pdf
-
Figure 3—figure supplement 4—source data 9
Source Data to Figure 3—figure supplement 4D.
- https://cdn.elifesciences.org/articles/91291/elife-91291-fig3-figsupp4-data9-v2.xlsx
Figure 4 with 1 supplement
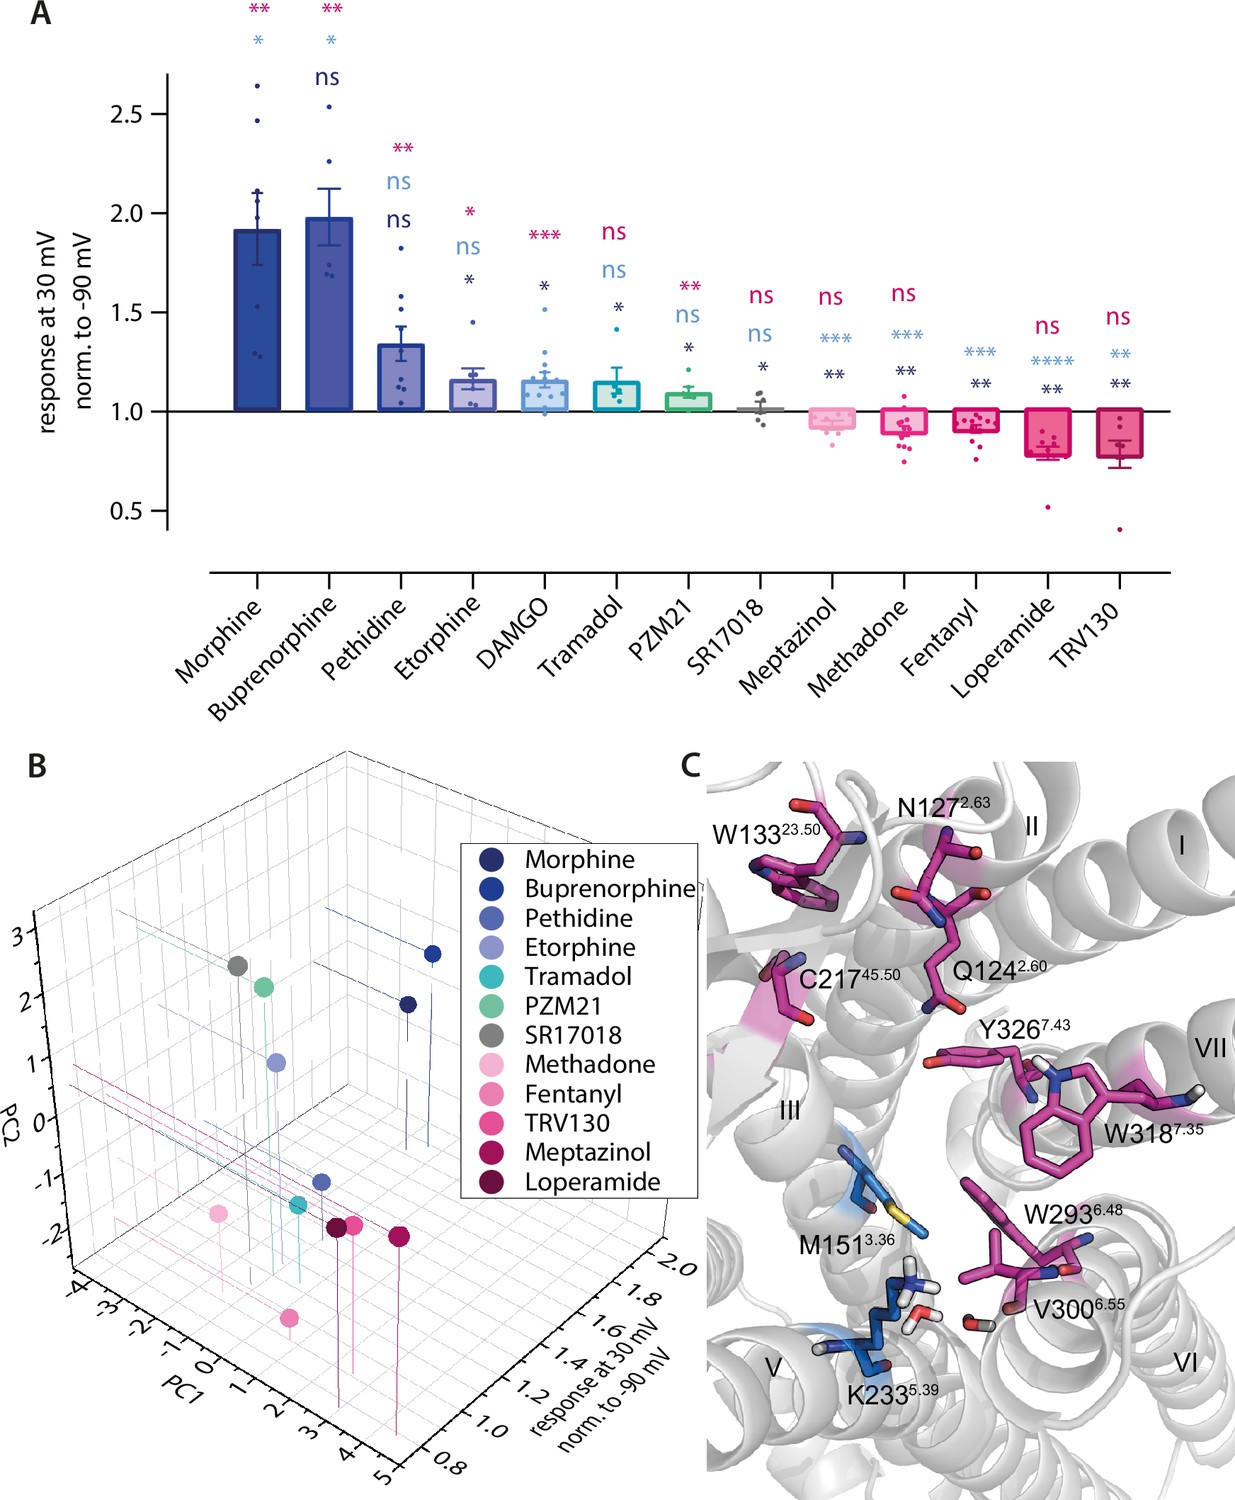
Predicted binding poses correlate with agonist-specific voltage sensitivity of µ opioid receptor (MOR).
(A) Förster resonance energy transfer (FRET)-based single-cell recordings of Gαi activation under voltage clamp conditions induced by different opioid agonist were analyzed for agonist-specific voltage-sensitive behavior (Figure 1 and Figure 4—figure supplement 1A–J). For this, the response of agonist-induced Gαi activation at +30 mV was normalized to the response at –90 mV. The applied agonist concentrations induced approximately the same Gαi activation level for all used agonists. Statistical significance was calculated compared to depolarization effect induced by morphine (dark blue), DAMGO (bright blue), and fentanyl (magenta) by an ordinary one-way ANOVA (p<0.0001) with Dunnett’s T3 multiple comparisons test (ns p>0.05, *p<0.05, **p<0.005, ***p<0.0005). (B) Fingerprint analysis (Figure 2I) was combined with the effects voltage displayed on the agonists and plotted as 3D plot. The agonists fell into groups with a group arrangement comparable to the voltage-sensitive effect, with morphine, buprenorphine, pethidine, tramadol, and PZM21 in the group activating upon depolarization (blue and green spheres) and methadone, fentanyl, loperamide, and TRV130 deactivating upon depolarization (magenta spheres). SR17018 showed no voltage sensitivity and also showed a different binding mode compared to the other agonists (gray). (C) Detailed analysis of fingerprints split into groups regarding their voltage-sensitive behavior resulted in the possibility to define the main predicted interaction partners for both groups. The group showing increased activation induced by depolarization mainly interacts with helix 3 (M1513.36) and helix 5 (K2335.39) and the water network, depicted in blue. The group showing decreased activation induced by depolarization mainly interacts with ECL1 and -2 (W13323.50 and C21745.50), helix 2 (Q1242.60 and N1272.63), helix 6 (W2936,48 and V3006.55), and helix 7 (W3187,35 and Y3267.43), depicted in magenta.
-
Figure 4—source data 1
Source Data to Figure 4A.
- https://cdn.elifesciences.org/articles/91291/elife-91291-fig4-data1-v2.xlsx
-
Figure 4—source data 2
Source Data to Figure 4B.
- https://cdn.elifesciences.org/articles/91291/elife-91291-fig4-data2-v2.xlsx
Figure 4—figure supplement 1
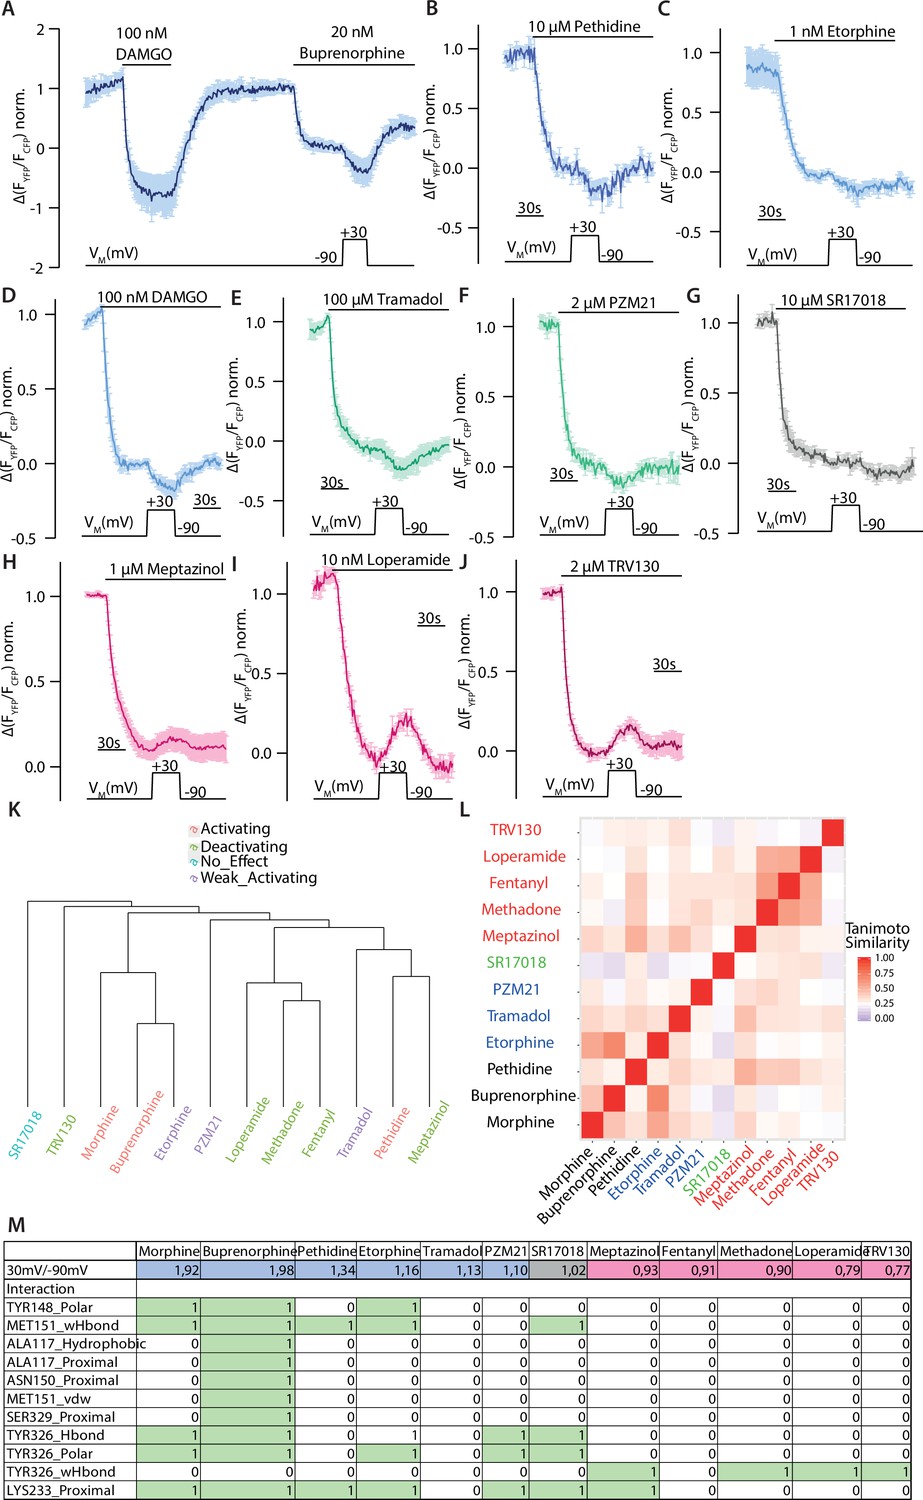
Agonist-specific voltage-sensitive behavior of the µ opioid receptor (MOR).
(A–J) Average Förster resonance energy transfer (FRET)-based single-cell recording of MOR-induced Gαi activation under voltage clamp conditions plotted for the indicated agonists (mean ± SEM; A: n=6, B: n=6; C: n=8; D: n=13; E: n=5; F: n=6; G: n=6; H: n=7; I: n=9, J: n=7). The applied voltage protocol is indicated below. All agonists were applied at a non-saturating concentration inducing approximately the same Gi activation level, as indicated by the application of DAMGO in panel A in a representative way. (K) Dendrogram of ligands based on Tanimoto similarity calculated using Morgan fingerprint with features of the ligands. Clusters are generated with hierarchical clustering algorithm using average Tanimoto similarity between clusters. (L) Heatmap of Tanimoto similarity calculated using Morgan fingerprint with features of the ligands. The ligand names are colored based on their effect upon depolarization. (M) Association analysis. A linear model of the fingerprints of all agonists was fitted to the activation ratio upon depolarization for each interacting residue using R programming. F-test p-values were computed and ranked. The identified interactions are marked in green.
Figure 5 with 1 supplement
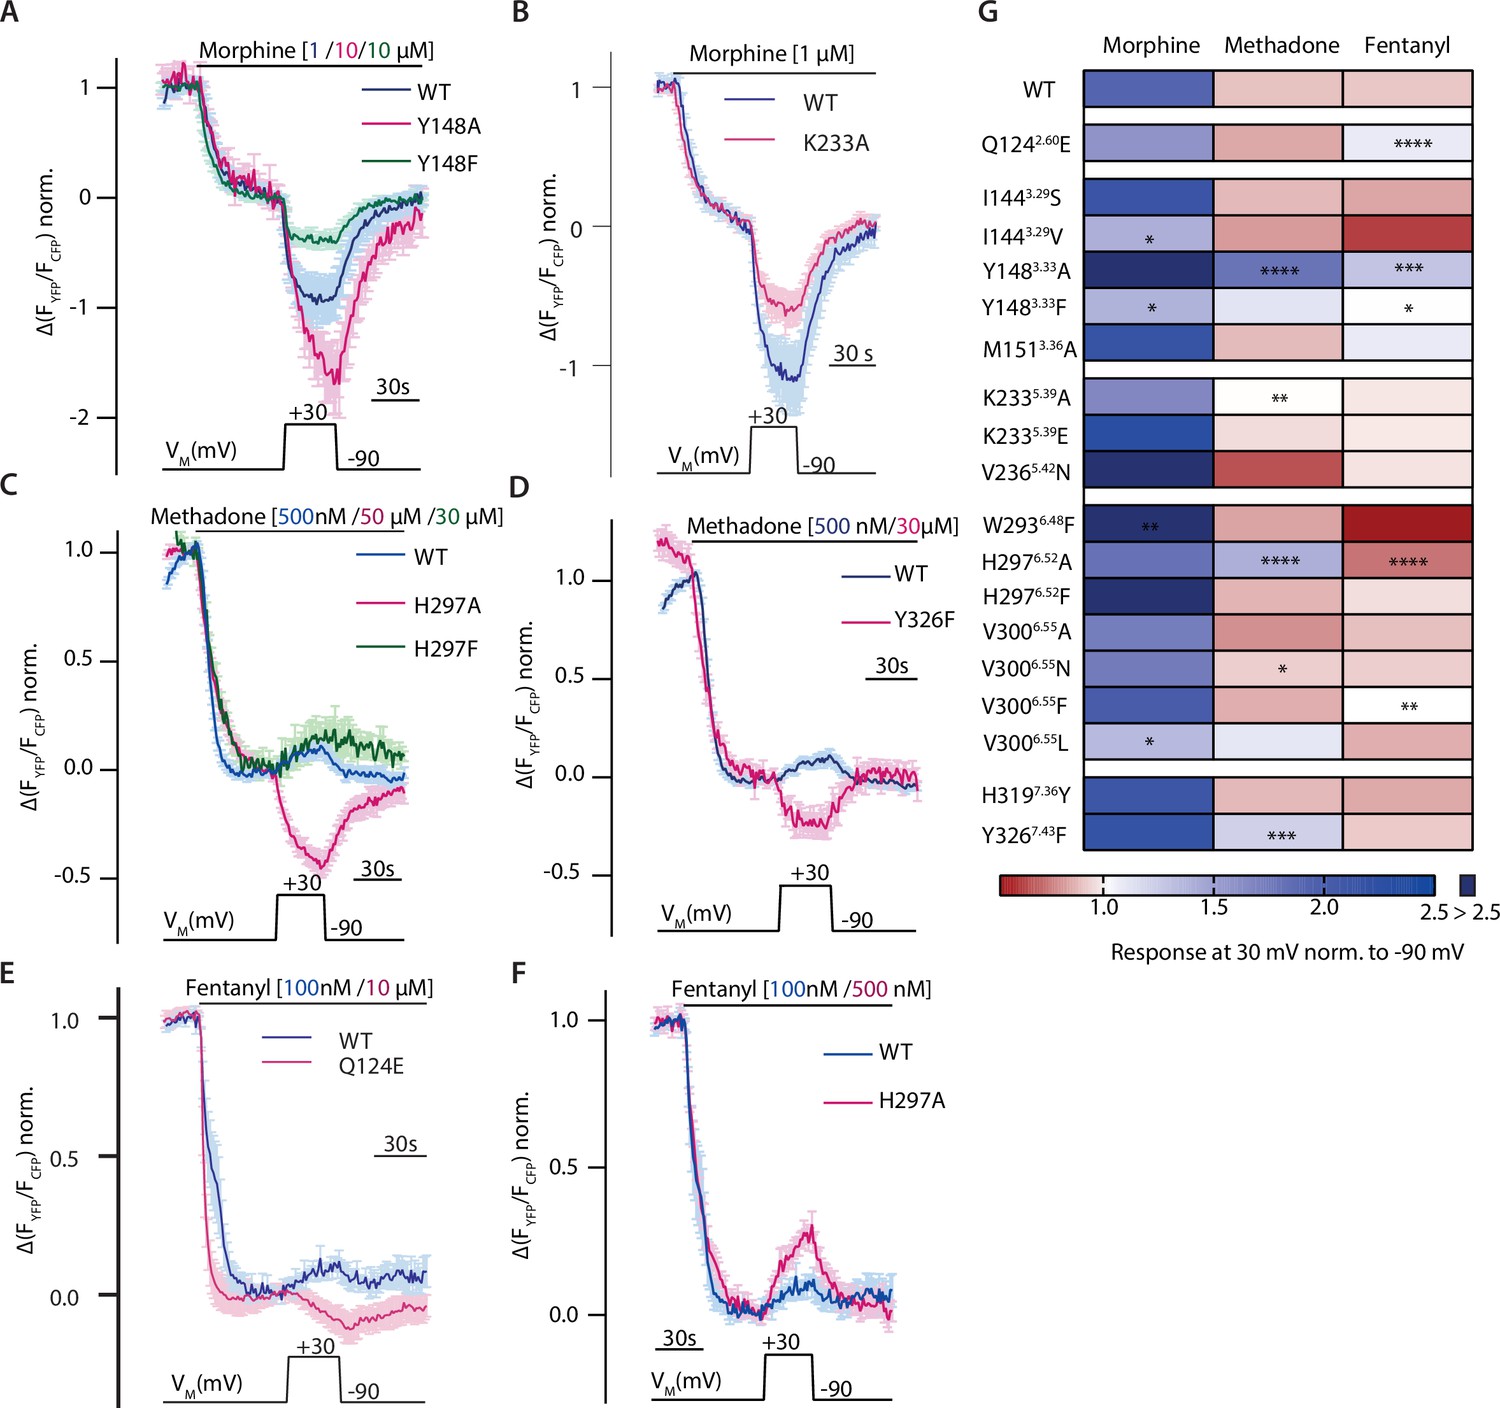
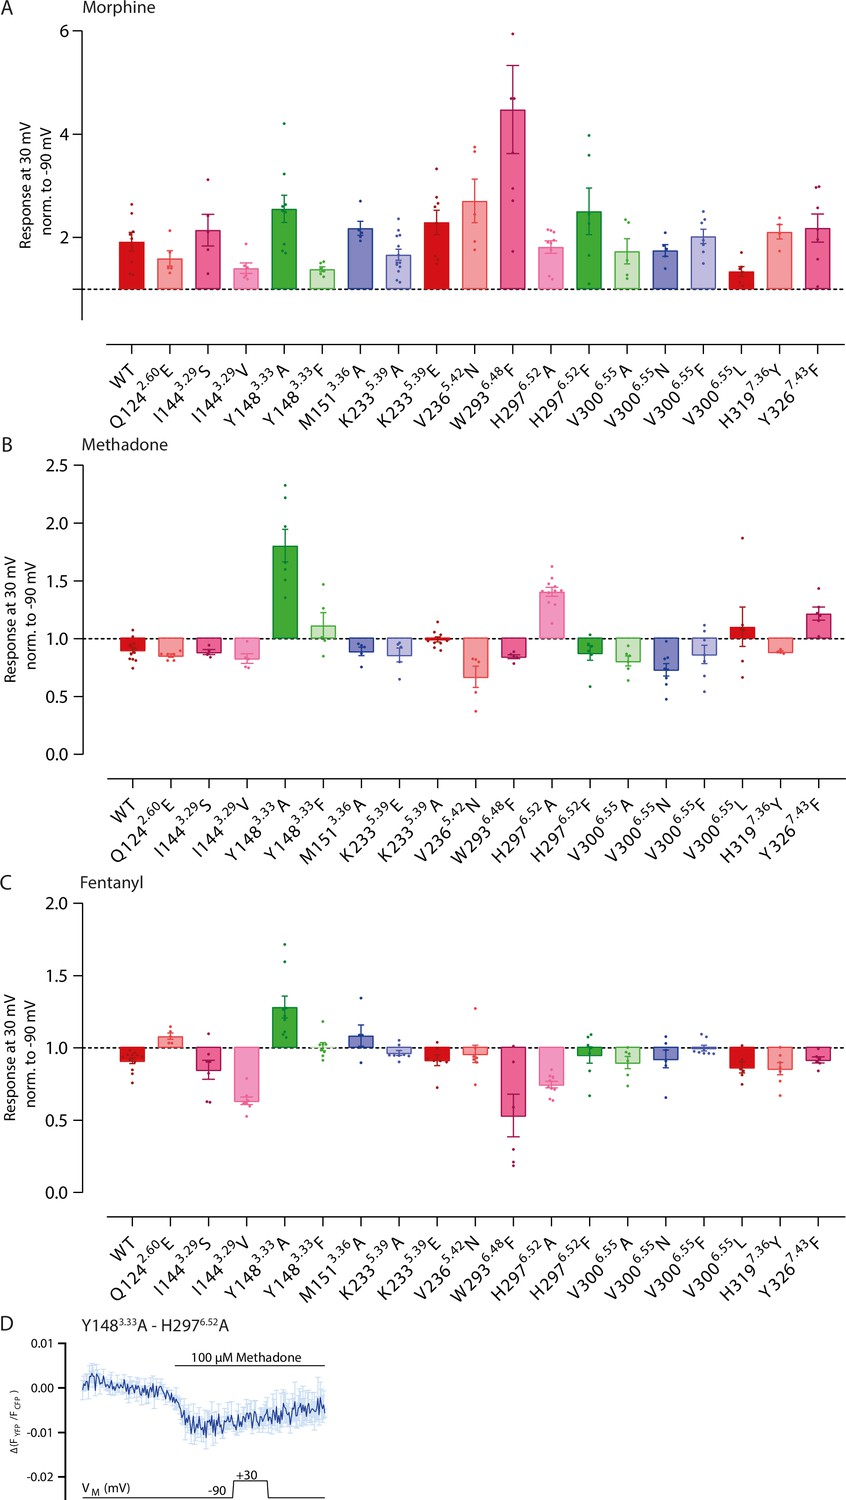
Altered ligand-receptor interactions influence agonist-specific voltage sensitivity at the µ opioid receptor (MOR).
(A–F) Average (mean ± SEM) Förster resonance energy transfer (FRET)-based single-cell recordings of Gαi activation measured in HEK293T cells under voltage clamp conditions are plotted for the indicated agonist and mutation, with blue depicting wild-type (WT) condition and magenta or green depicting the effect of the mutant (A: MOR-WT [blue, n=8], MOR-Y1483.33A [magenta, n=9], MOR-Y1483.33F [green, n=6]; B: MOR-WT [blue, n=8], MOR-K2335.39A [magenta, n=12], C: MOR-WT [blue, n=13], MOR-H2976.52A [magenta, n=11], H2976.52F [green, n=6]; D: MOR-WT [blue, n=13], MOR-Y3267.43F [magenta, n=6]; E: MOR-WT [blue, n=12], MOR-Q1242.60E [magenta, n=5]; F: MOR-WT [blue, n=12], MOR-H2976.52A [magenta, n=10]). The applied voltage protocol is indicated below each trace. (G) The analyzed depolarization effects on Gαi activation induced by mutations were plotted in a heatmap regarding the applied agonist (the applied concentrations induced approximately the same Gαi activation levels for all used agonists). Response of agonist-induced Gαi activation at +30 mV was normalized to response at –90 mV, a value smaller than 1 indicates a decreased Gαi activation induced by depolarization (depicted in red), a value larger than 1 indicates an increased Gαi activation induced by depolarization (depicted in blue). Absence of a discernable voltage effect is indicated by a value around 1 (depicted in white). Significance was calculated compared to depolarization effects of the WT receptor and the respective agonist (unpaired t-test with Welch’s correction [ns p>0.05, *p<0.05, **p<0.005, ***p<0.0005, ****p<0.0001]).
-
Figure 5—source data 1
Source Data to Figure 5A.
- https://cdn.elifesciences.org/articles/91291/elife-91291-fig5-data1-v2.xlsx
-
Figure 5—source data 2
Source Data to Figure 5B.
- https://cdn.elifesciences.org/articles/91291/elife-91291-fig5-data2-v2.xlsx
-
Figure 5—source data 3
Source Data to Figure 5C.
- https://cdn.elifesciences.org/articles/91291/elife-91291-fig5-data3-v2.xlsx
-
Figure 5—source data 4
Source Data to Figure 5D.
- https://cdn.elifesciences.org/articles/91291/elife-91291-fig5-data4-v2.xlsx
-
Figure 5—source data 5
Source Data to Figure 5E.
- https://cdn.elifesciences.org/articles/91291/elife-91291-fig5-data5-v2.xlsx
-
Figure 5—source data 6
Source Data to Figure 5F.
- https://cdn.elifesciences.org/articles/91291/elife-91291-fig5-data6-v2.xlsx
-
Figure 5—source data 7
Source Data to Figure 5G.
- https://cdn.elifesciences.org/articles/91291/elife-91291-fig5-data7-v2.xlsx
Figure 5—figure supplement 1
Altered binding modes influence voltage sensitivity of the µ opioid receptor (MOR) activated by morphine.
(A–C) Average Förster resonance energy transfer (FRET)-based single-cell recording of MOR-induced Gαi activation under voltage clamp conditions were measured as displayed in Figure 5A–F, analyzed and plotted in a bar graph regarding the inserted mutation and the induced voltage effect. Agonists (A: morphine, B: methadone, C: fentanyl) were applied in a non-saturating concentration inducing approx. same Gi activation level, determined for every mutation in Figure 3—figure supplement 1. Effects are summarized in a heatmap in Figure 5G. (D) Average FRET-based single-cell recording of MOR-induced Gαi activation under voltage clamp conditions plotted for methadone with the double-mutant Y148A-H297A. The double mutation displays a very low activity, as there’s just a weak FRET-ratio change by extreme high methadone concentrations (mean ± SEM; n=4). For this reason, double mutations weren’t analyzed further.
Figure 6 with 1 supplement
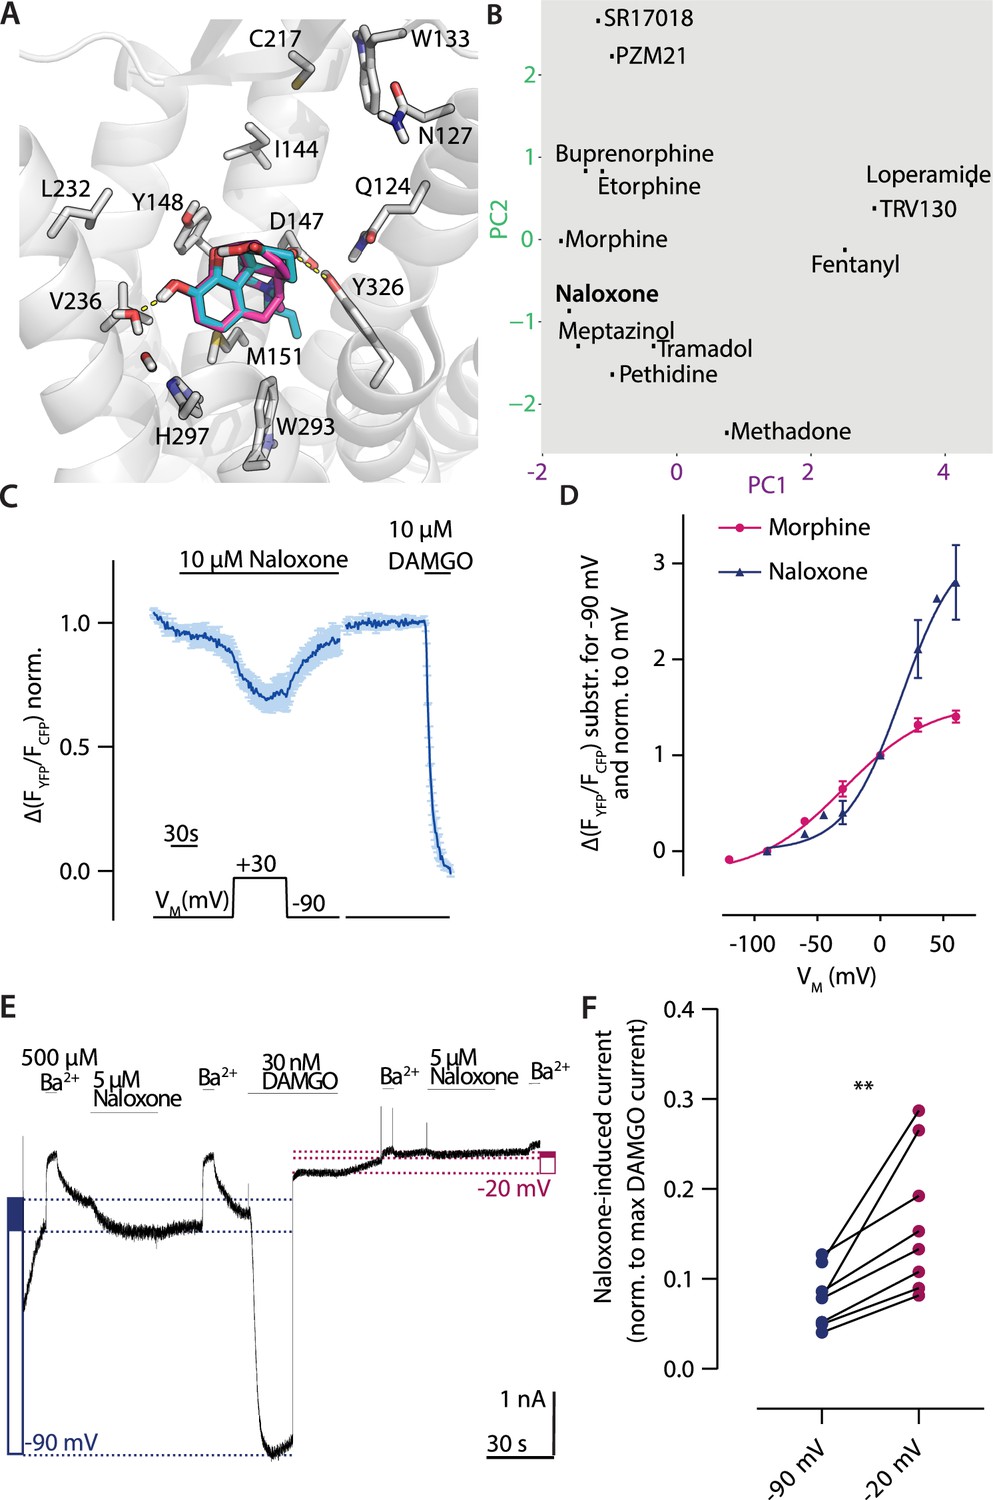
Depolarization converts the antagonist naloxone to an agonist.
(A) Binding modes of the antagonist naloxone (cyan) compared to the agonist morphine (magenta) illustrated as in Figure 2. (B) Analyzed binding modes were plotted based on the fingerprint analysis as shown in Figure 2. The fingerprint of naloxone joins the group of the ligands activating upon depolarization. (C) Average (mean ± SEM) Förster resonance energy transfer (FRET)-based single-cell recording of µ opioid receptor (MOR)-induced Gαi activation under voltage clamp conditions is plotted for naloxone with the applied voltage protocol indicated below (n=7). (D) Voltage dependence of naloxone (blue)-induced Gαi activation was compared to morphine (magenta). The activation was determined by clamping the membrane from –90 mV to different potentials and plotted relative to 0 mV. The data was fitted to a Boltzmann function resulting in a z-factor of 1.17 for naloxone and 0.8 for morphine and a V50-value of 31 mV for naloxone and –29 mV for morphine. (E) Representative recording of inward K+ currents in HEK293T cells expressing MOR and GIRK channels, where the GIRK currents were evoked by naloxone and DAMGO. The currents were measured at –90 mV (depicted as blue dotted line) or at –20 mV (depicted as magenta dotted line). GIRK channels were blocked with 500 µM Ba2+ as indicated. Determination of activation level induced by naloxone is indicated by the filled blue box (or magenta box, respectively) compared to the activation induced by DAMGO (empty box) (as described before; Ruland et al., 2020). (F) The GIRK current response evoked by naloxone was normalized to the maximum response evoked by DAMGO at the respective membrane potential. The responses at –90 and –20 mV were compared in the same recording, indicating an increased naloxone-induced current at –20 mV (p<0.05, paired, two-tailed t-test).
-
Figure 6—source data 1
Source Data to Figure 6C.
- https://cdn.elifesciences.org/articles/91291/elife-91291-fig6-data1-v2.xlsx
-
Figure 6—source data 2
Source Data to Figure 6D.
- https://cdn.elifesciences.org/articles/91291/elife-91291-fig6-data2-v2.xlsx
-
Figure 6—source data 3
Source Data to Figure 6E.
- https://cdn.elifesciences.org/articles/91291/elife-91291-fig6-data3-v2.xlsx
-
Figure 6—source data 4
Source Data to Figure 6F.
- https://cdn.elifesciences.org/articles/91291/elife-91291-fig6-data4-v2.xlsx
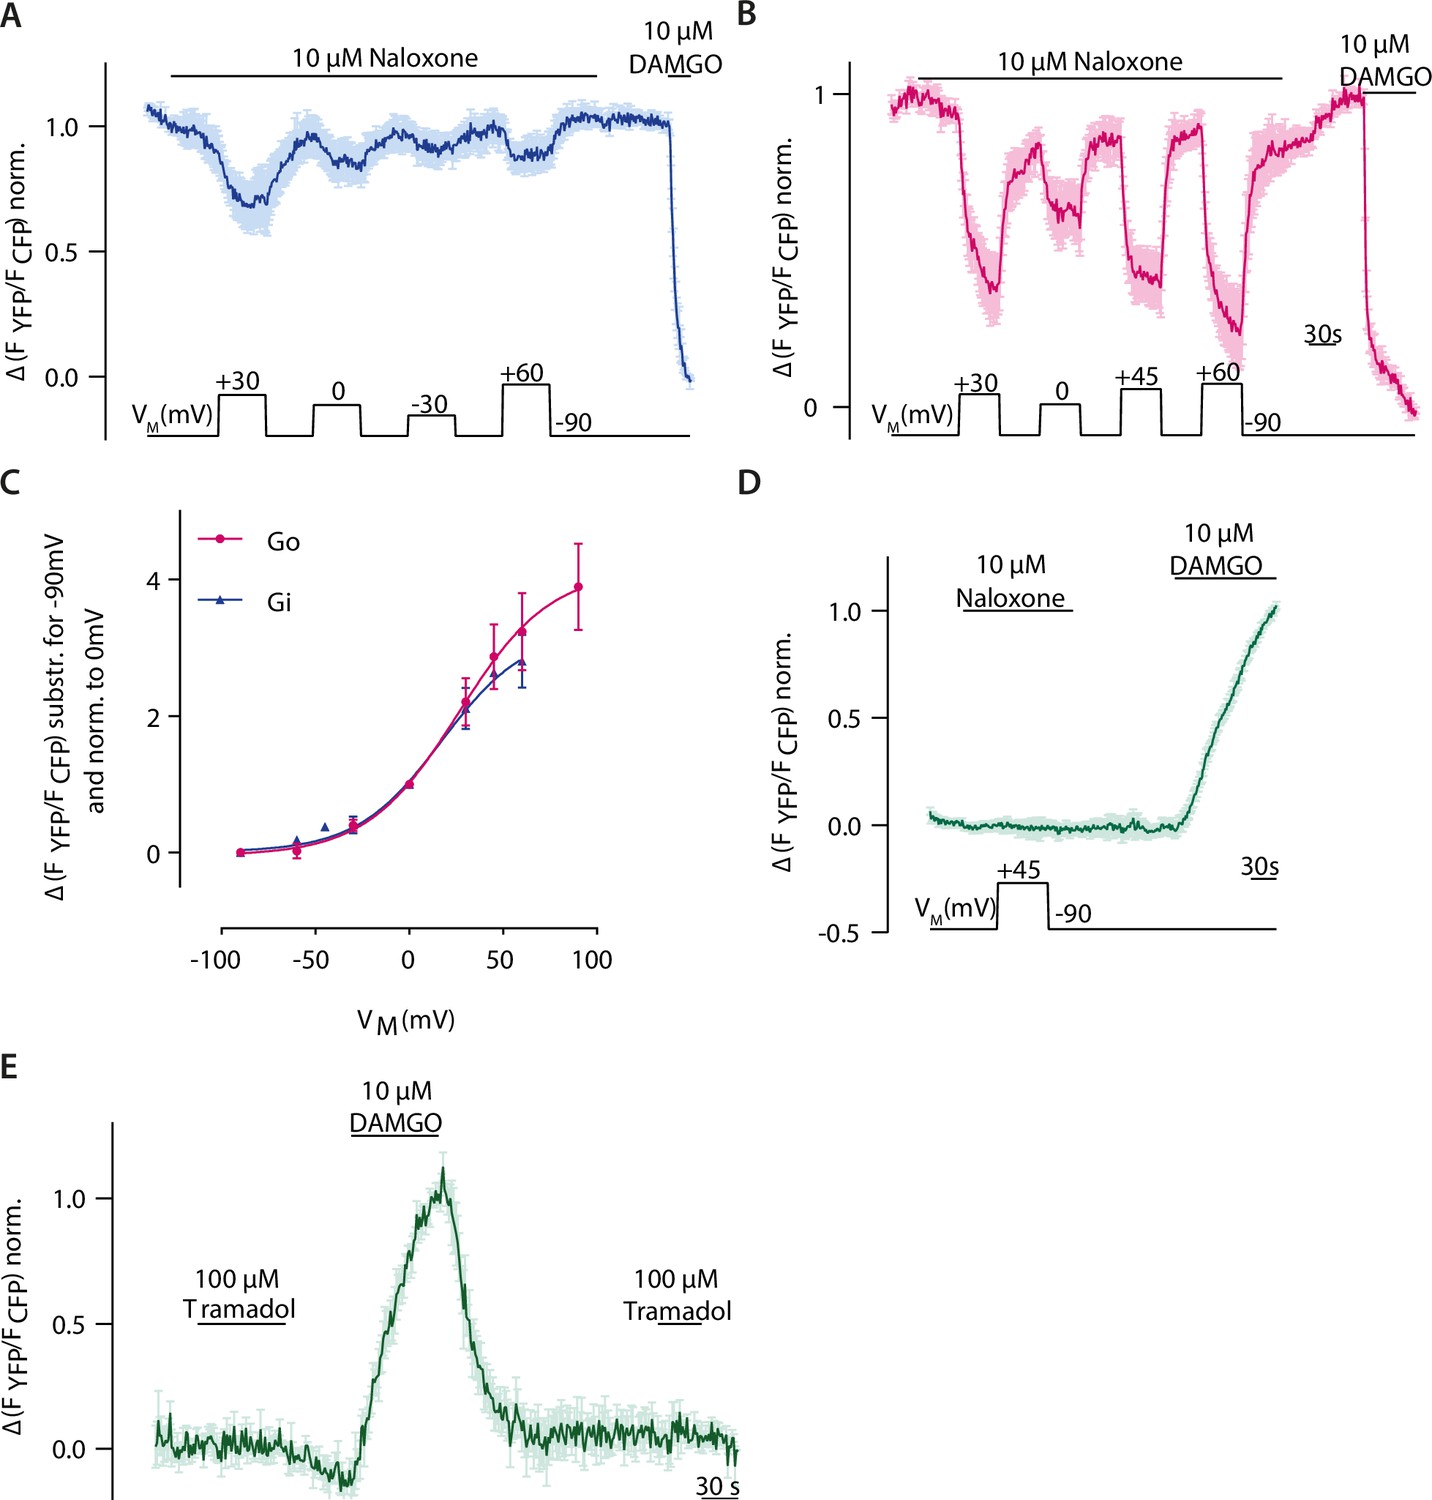
Figure 6—figure supplement 1
Depolarization converts the antagonist naloxone to an agonist.
(A) Representative Förster resonance energy transfer (FRET)-based single-cell recording of µ opioid receptor (MOR)-induced Gαi activation under voltage clamp conditions used for fit in Figure 6D and Figure 3—figure supplement 3C, the voltage protocol indicated below (mean ± SEM, n=4). (B) Representative FRET-based single-cell recording of MOR-induced Gαo activation under voltage clamp conditions used for fit in C, the voltage protocol indicated below (mean ± SEM, n=7). (C) Voltage dependence of naloxone-induced Gαi activation (blue) compared to Gαo activation (magenta). Activation was determined by clamping the membrane from –90 mV to different potentials and plotted relative to 0 mV. Data was fitted to Boltzmann function resulting in a z-factor of 1.17 for Gαi and 1.2 for Gαo and a V50-value of 31 mV for Gαi and 27 mV for Gαo. (D) Average FRET-based single-cell recording of arrestin-mTur2 interaction with MOR-sYFP2 under voltage clamp conditions, the voltage protocol indicated below (mean ± SEM, n=7). (E) Average FRET-based single-cell recording of arrestin-mTur2 interaction with MOR-sYFP2 induced by the weak partial agonist tramadol (mean ± SEM, n=5).
Additional files
-
Supplementary file 1
Ligand properties; 2D structures were taken from Wikipedia.
- https://cdn.elifesciences.org/articles/91291/elife-91291-supp1-v2.docx
-
Supplementary file 2
Calculated pEC50 values for G protein activation and pIC50 values for fluorescent ligand-binding competition.
- https://cdn.elifesciences.org/articles/91291/elife-91291-supp2-v2.docx
-
MDAR checklist
- https://cdn.elifesciences.org/articles/91291/elife-91291-mdarchecklist1-v2.docx
Download links
A two-part list of links to download the article, or parts of the article, in various formats.
Downloads (link to download the article as PDF)
Open citations (links to open the citations from this article in various online reference manager services)
Cite this article (links to download the citations from this article in formats compatible with various reference manager tools)
Differential interaction patterns of opioid analgesics with µ opioid receptors correlate with ligand-specific voltage sensitivity
eLife 12:e91291.
https://doi.org/10.7554/eLife.91291


