Topological stress triggers persistent DNA lesions in ribosomal DNA with ensuing formation of PML-nucleolar compartment
- Laboratory of Genome Integrity, Institute of Molecular Genetics of the Czech Academy of Sciences, Czech Republic
- Institute of Molecular and Translational Medicine, Faculty of Medicine and Dentistry, Palacky University Olomouc, Czech Republic
- Centre for Chromosome Biology, College of Science and Engineering, University of Galway, Ireland
- Genome Integrity Unit, Danish Cancer Society Research Center, Denmark
- Division of Genome Biology, Department of Medical Biochemistry and Biophysics, Karolinska Institutet, Sweden
Figures
Figure 1 with 5 supplements
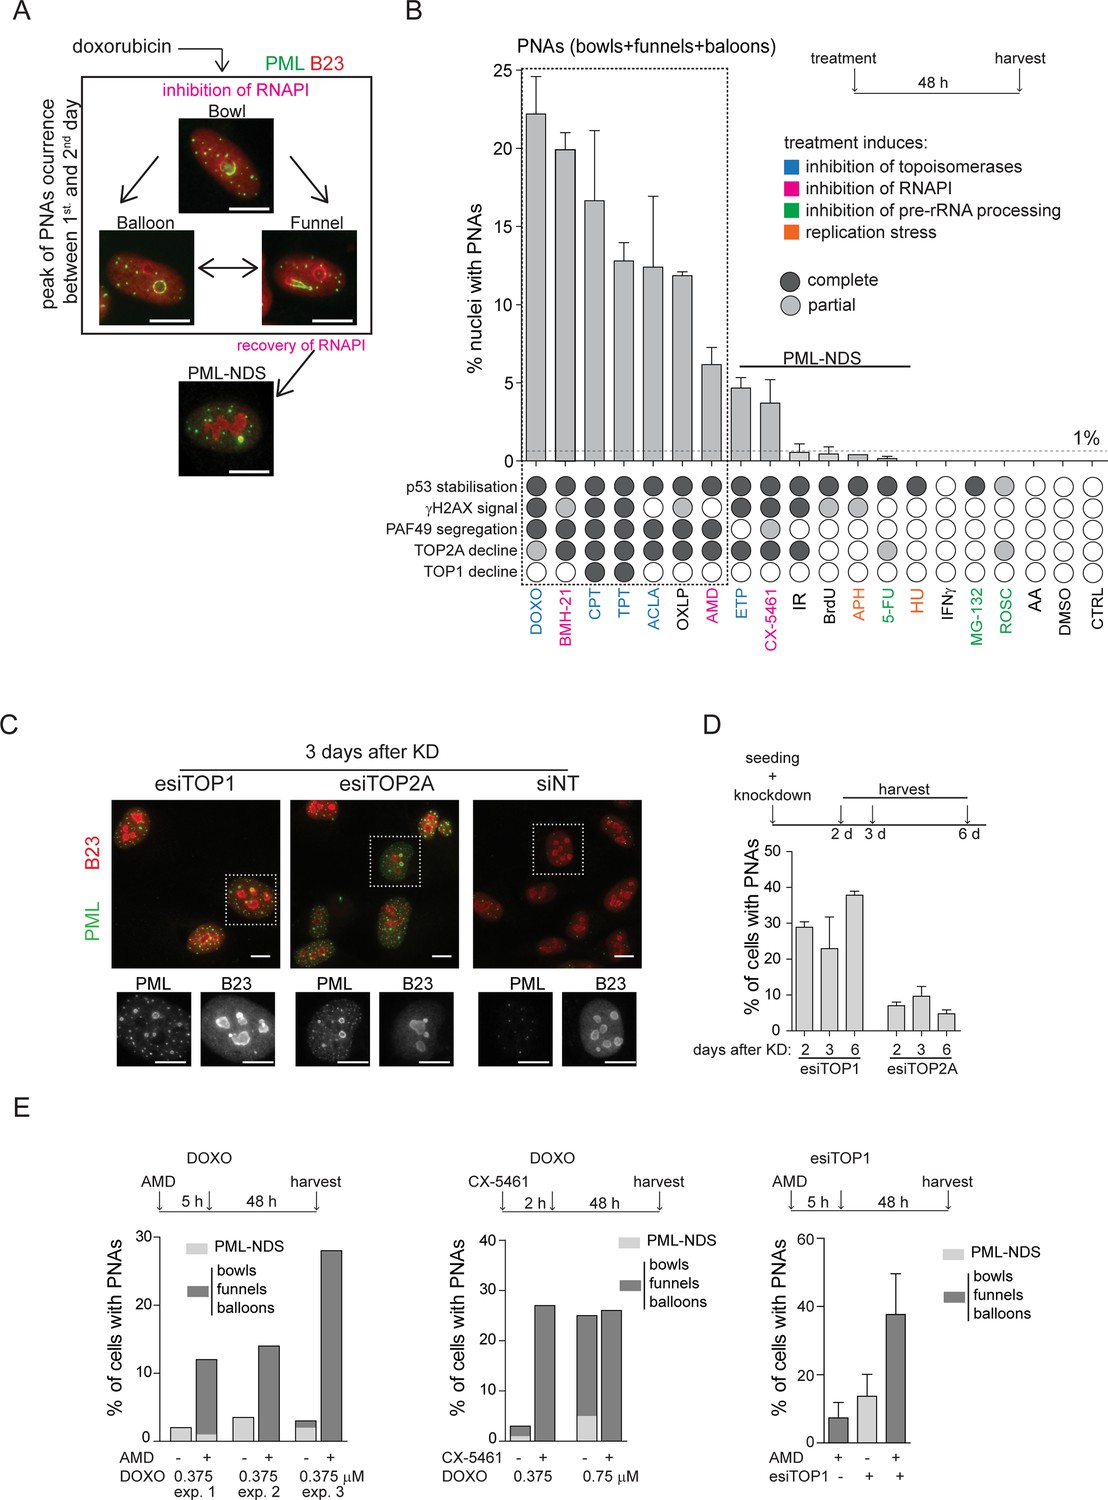
PNAs formation after diverse stress-inducing stimuli and topoisomerase downregulation.
(A) Structural types of PML-nucleolar associations (PNAs) – 'bowls', 'funnels', 'balloons', and PML-nucleolus-derived structures (PML-NDS), occurring in RPE-1hTERT cells after treatment with 0.75 μM doxorubicin detected by indirect immunofluorescence (IF) with anti-PML antibody (green) and anti-B23 (red, for nucleoli visualization). (B) Quantifying the percentage of RPE-1hTERT cells containing PNAs, 48 hr after treatment with various stress-inducing stimuli. The stress stimuli were divided into five categories according to their mechanism of action (see Supplementary file 1): (1) poisons/inhibitors of topoisomerases, (2) treatments inducing the inhibition of RNAPI, (3) inhibitors of pre-RNA processing, (4) inductors of replication stress, and (5) other stressors. p53 stabilization, γH2AX foci formation, PAF49 segregation, and TOP1 or TOP2A decline have been assessed for each treatment. The concentration and abbreviation used: DOXO, doxorubicin (0.75 µM); BMH-21 (0.5 µM); CPT, camptothecin (50 µM); TPT, topotecan (50 µM); ACLA, aclarubicin (0.05 µM); OXLP, oxaliplatin (10 µM); AMD, actinomycin D (10 nM); ETP, etoposide (50 µM); CX-5461 (5 µM); IR, (ionizing radiation 10 Gy); APH, aphidicolin (0.4 µM); 5-FU, 5-fluorouracil (200 µM); HU, hydroxyurea (100 µM), IFNγ (5 ng/mL); MG-132 (10 µM); ROSC, roscovitine (20 µM); AA, acetic acid. The mean ± SEM from at least two biological replicates is shown. (C) The pattern of PML (green) and B23 (red) in RPE-1hTERT cells visualized by indirect IF, 3 days post-transfection with siRNAs targeting TOP1 and TOP2A, or with non-targeting siRNA (siNT), respectively. (D) Quantification of the percentage of RPE-1hTERT cells containing PNAs 2, 3, and 6 days after transfection with esiTOP1 and esiTOP2A. The mean ± SEM from at least two biological replicates is shown. (E) RPE-1hTERT cells were pre-treated with 10 nM AMD for 5 hours or with 5 μM CX-5461 for 2 hours to inhibit RNAPI. The cells were then treated with 0.375 μM or 0.75 μM doxorubicin or transfected with esiRNA targeting TOP1 for 48 hr. The bar graphs show the percentage of cells containing either PML-NDS or bowls/funnels/balloons for three biological replicates (graph 1), for one biological replicate (graph 2), or the mean ± SEM for three biological replicates (graph 3). Scale bar, 10 μm.
-
Figure 1—source data 1
Numerical data for B, D, and E.
- https://cdn.elifesciences.org/articles/91304/elife-91304-fig1-data1-v1.xlsx
Figure 1—figure supplement 1
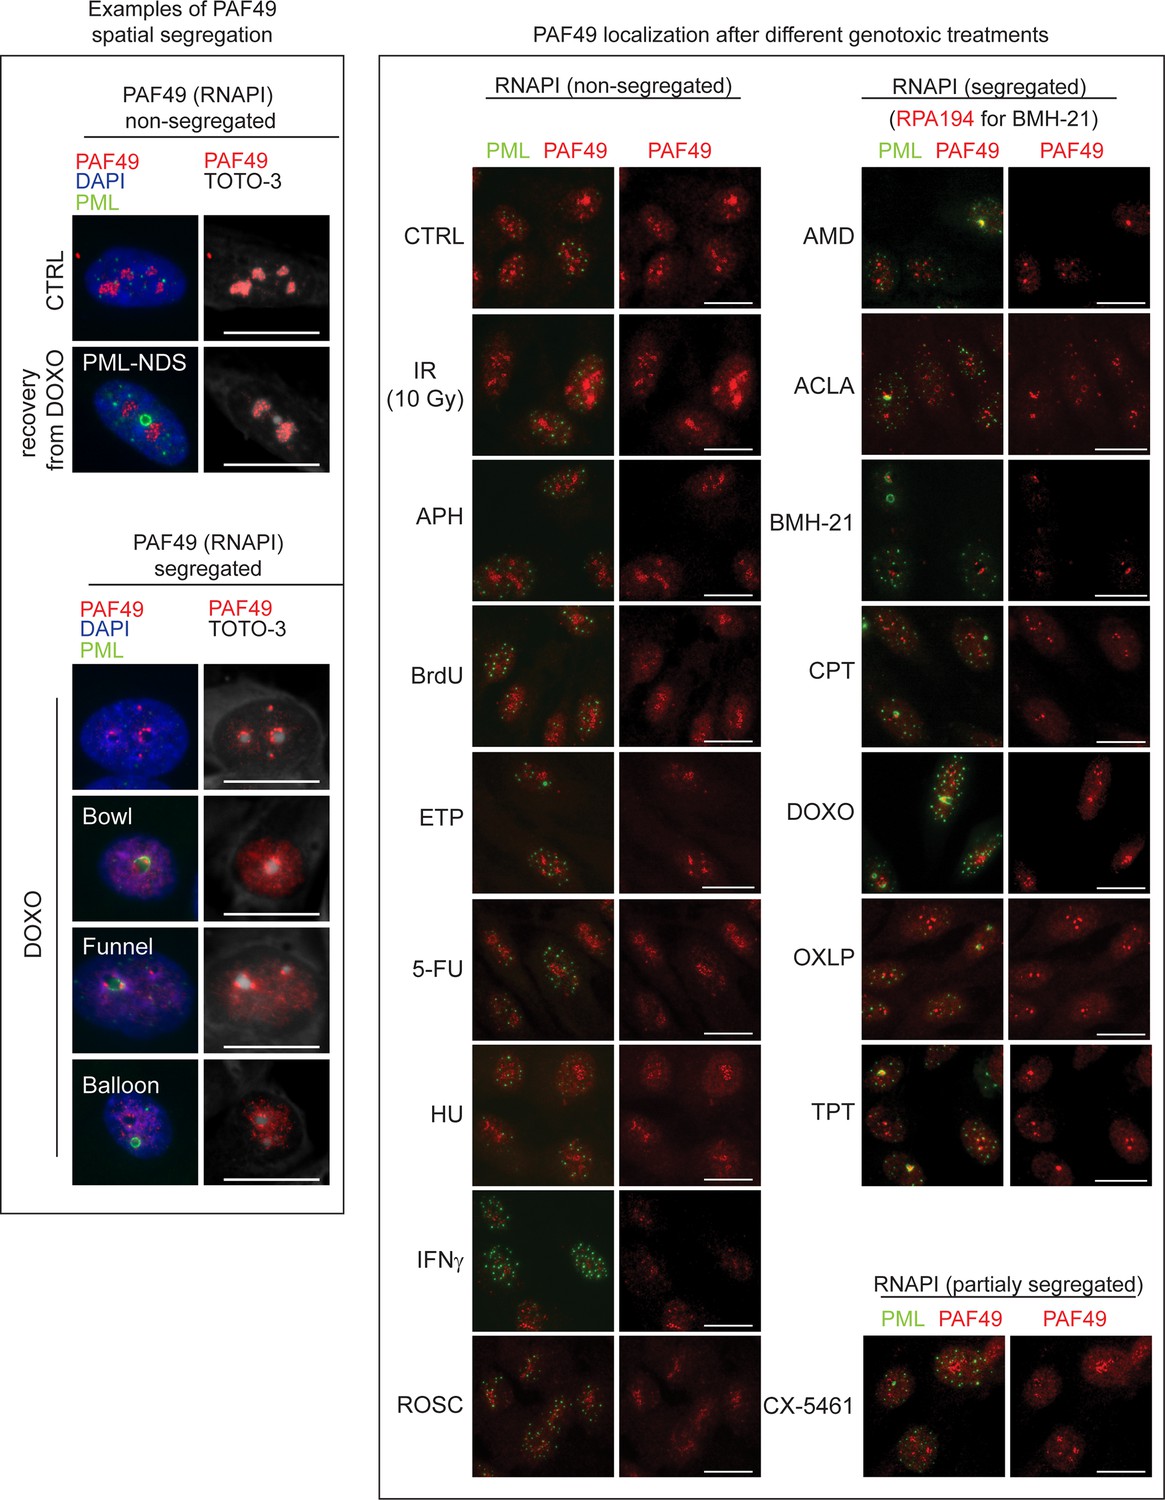
Detection of RNAPI segregation after various genotoxic treatments.
RPE-1hTERT cells were treated with selected treatments for 48 hr (for details see Supplementary file 1 or legend for Figure 1B). The segregated and non-segregated pattern of RNAPI subunits PAF49 (red) and different PNA subtypes (PML; green) are shown in the left panel. Nuclei were counter-stained with DAPI (blue) and nucleoli with TOTO-3 (white). In the right panel, the activity of RNAPI, evaluated as spatial segregation of RNAPI subunits PAF49 or RPA194 (BMH-21), and the presence of PNAs were visualized by IF and wide-field microscopy of PAF49/RPA194 (red) and PML (green). Scale bar, 20 μm.
Figure 1—figure supplement 2
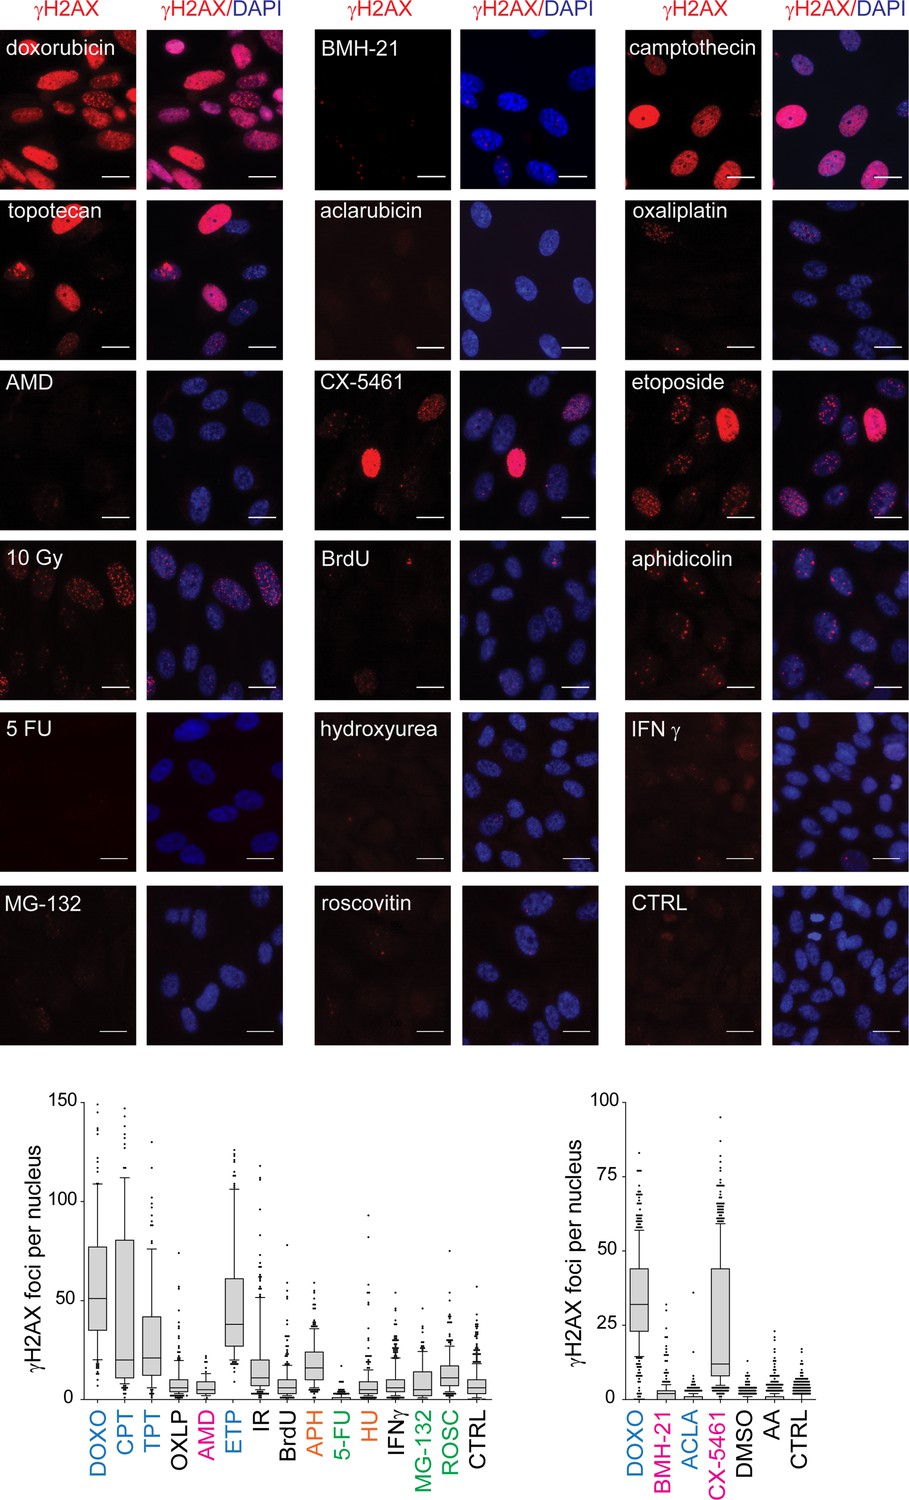
Detection of γH2AX signal after various genotoxic treatments.
RPE-1hTERT cells were treated with selected treatments for 48 hr (for details see Supplementary file 1 or legend for Figure 1B). The presence of DSBs, demonstrated as phosphorylation of histone H2AX on serine 139 (γH2AX), was visualized by IF using the anti-γH2AX antibody (red). The nuclei were counter-stained with DAPI (blue). The number of γH2AX foci per nucleus was analyzed using ScanR software and is presented using a whiskers plot (box: 10–90 percentiles; black line: median). Scale bar, 20 μm.
-
Figure 1—figure supplement 2—source data 1
Numerical data for whiskers plots.
- https://cdn.elifesciences.org/articles/91304/elife-91304-fig1-figsupp2-data1-v1.xlsx
Figure 1—figure supplement 3
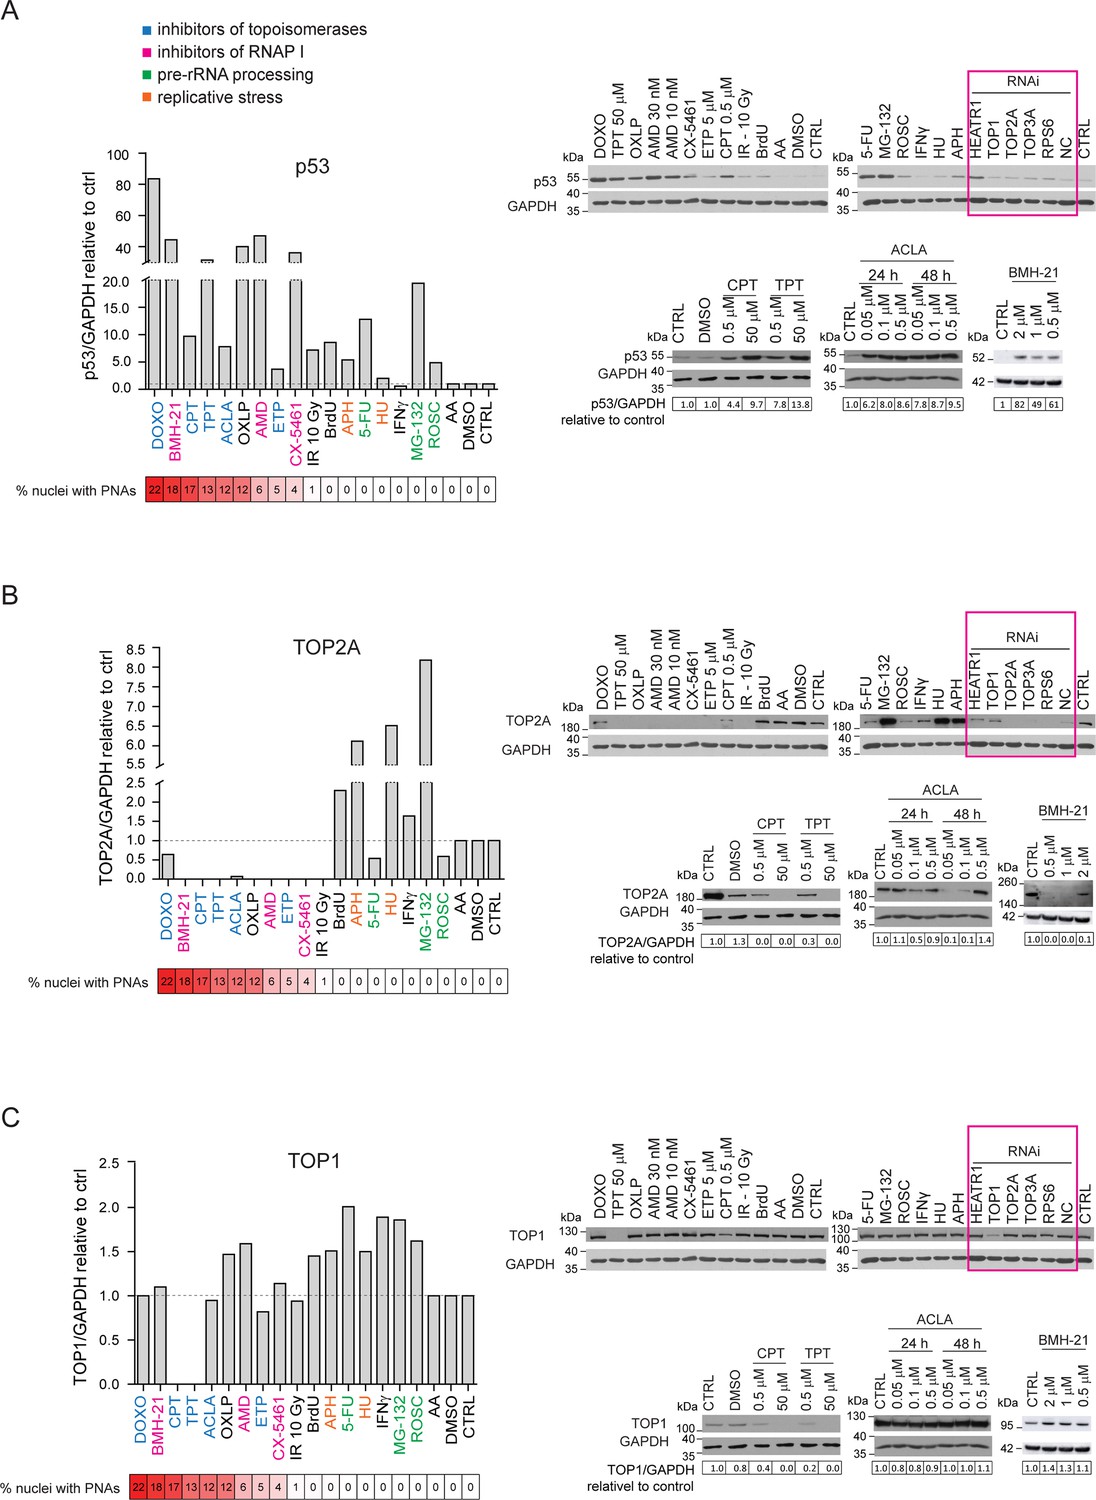
Detection of p53, TOP2A and TOP1 after various genotoxic treatments.
RPE-1hTERT cells were treated with selected treatments for 48 hr (for details see Supplementary file 1 or legend for Figure 1B). The levels of p53 (A), TOP2A (B), and TOP1 (C) were detected by western blotting. The charts on the left show relative levels of p53, TOP2A, and TOP1, respectively, related to the loading control. The protein levels of untreated cells or cells treated with drug solvents (acetic acid, DMSO) were set as one. The red, one-row tables below the charts show the percentage of cells containing PNAs.
-
Figure 1—figure supplement 3—source data 1
RAW membranes for A, B, and C.
- https://cdn.elifesciences.org/articles/91304/elife-91304-fig1-figsupp3-data1-v1.zip
-
Figure 1—figure supplement 3—source data 2
Uncropped and labeled membranes for A, B, and C.
- https://cdn.elifesciences.org/articles/91304/elife-91304-fig1-figsupp3-data2-v1.zip
Figure 1—figure supplement 4
PNAs after treatments affecting functions of topoisomerases and RNAPI.
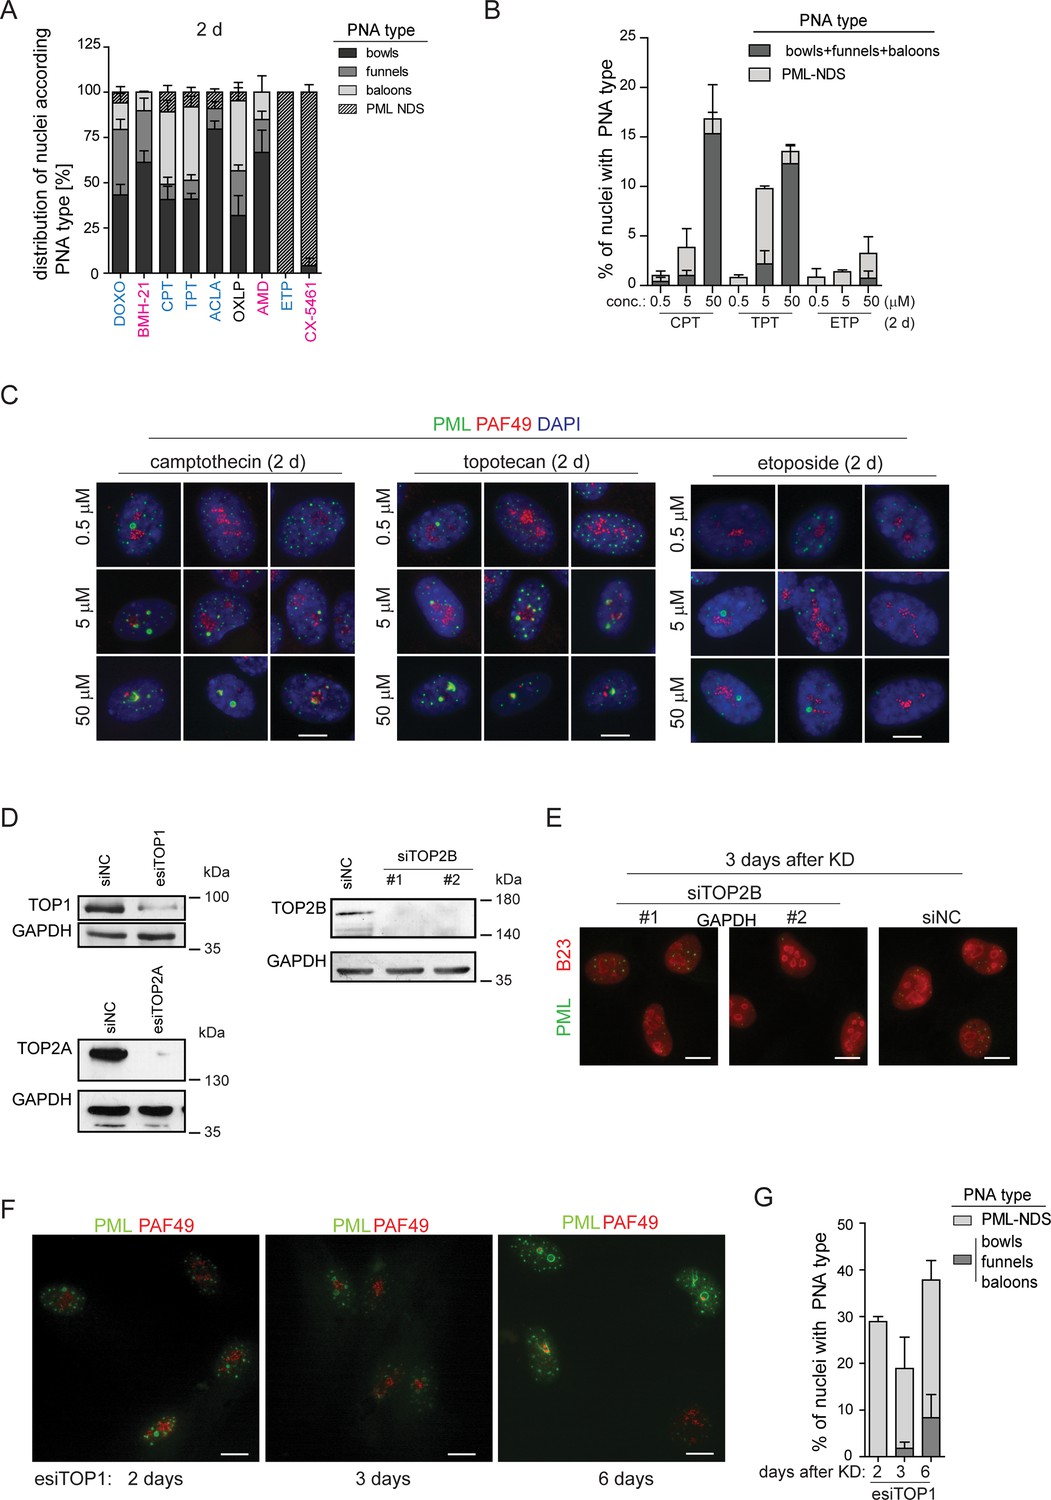
(A) RPE-1hTERT cells were treated with DOXO, BMH-21, CPT, TPT, acla, OXLP, AMD, CX-5461, and ETP for 48 hr (for details see Supplementary file 1 or legend for Figure 1B). The distribution of nuclei containing either bowls, funnels, balloons, or PML-NDS was evaluated for at least two independent experiments. Results are presented as a mean ± SEM. (B) RPE-1hTERT cells were treated with three different concentrations of CPT, TPT, or ETP for 48 hr, and percentages of cells containing either bowls/funnels/balloons or PML-NDS were evaluated for at least three independent experiments. Results are presented as a mean ± SEM. (C) The localization of PAF49 (a subunit of RNAPI; the segregation indicates the RNAPI activity) after treatments described in (B) is shown. The PAF49 (red), and PML (green) were detected by IF and wide-field microscopy. The nuclei were co-stained by DAPI (blue). Scale bar, 10 μm. (D) Immunoblotting of lysates extracted from cells after transfection either with non-targeting siRNA or with esiRNA/siRNA targeting individual topoisomerases. The membranes were probed with indicated anti-TOP antibodies to prove their efficient downregulation. GAPDH was used as a loading control. (E) Illustrative images of RPE-1hTERT cells in which TOP2B was downregulated by two different siRNAs are shown. PML (green) and B23 (red; a nucleolus marker) were detected by indirect IF and wide-field microscopy. Scale 10 μm. (F) Illustrative images of RPE-1hTERT cells in which TOP1 was downregulated by esiRNA transfection show time-dependent changes in the PML (green) and PAF49 (red) patterns. While 2 days after the transfection PAF49 was mostly non-segregated and PML-NDS were the most frequent PNAs appeared, 6 days after the transfection PAF49 was mostly segregated, and PML-NDS were largely substituted by PML forks and circles. Scale bar, 10 μm. (G) The quantification of (F). The percentages of cells containing either bowls/funnels/balloons or PML-NDS were evaluated. Results are presented as a mean ± SEM.
-
Figure 1—figure supplement 4—source data 1
RAW membranes for D.
- https://cdn.elifesciences.org/articles/91304/elife-91304-fig1-figsupp4-data1-v1.zip
-
Figure 1—figure supplement 4—source data 2
Uncropped and labeled membranes for D.
- https://cdn.elifesciences.org/articles/91304/elife-91304-fig1-figsupp4-data2-v1.zip
-
Figure 1—figure supplement 4—source data 3
Numerical data for A, B, and G.
- https://cdn.elifesciences.org/articles/91304/elife-91304-fig1-figsupp4-data3-v1.xlsx
Figure 1—figure supplement 5
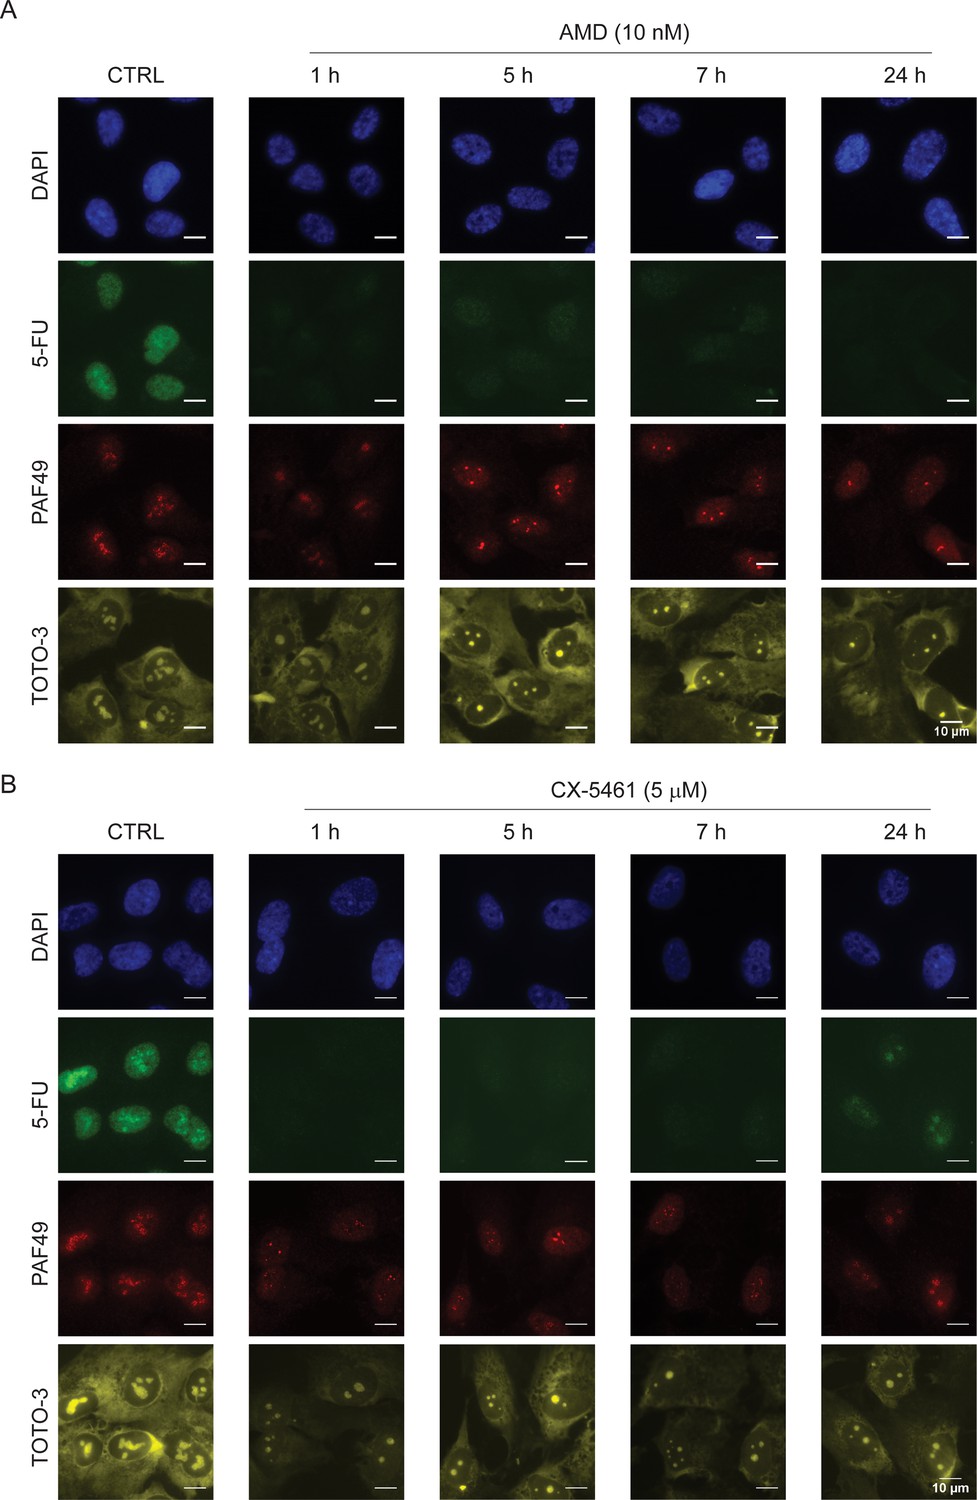
Detection RNAPI inhibition after AMD and CX-5461 treatment.
RPE-1hTERT cells were treated with AMD (A) or CX-5461 (B) for indicated time points. At each time point, the cells were incubated with 5-FUrd for 30 min. The IF detection of 5-FU (green), representing newly synthesized nucleolar RNA, and localization/segregation of RNAPI subunit PAF49 (red) was performed. The nuclei and nucleoli were stained with DAPI (blue) and TOTO-3 (yellow), respectively. Scale bars, 10 μm.
Figure 2 with 2 supplements
Inhibition of DNA repair augmented the PNAs formation.
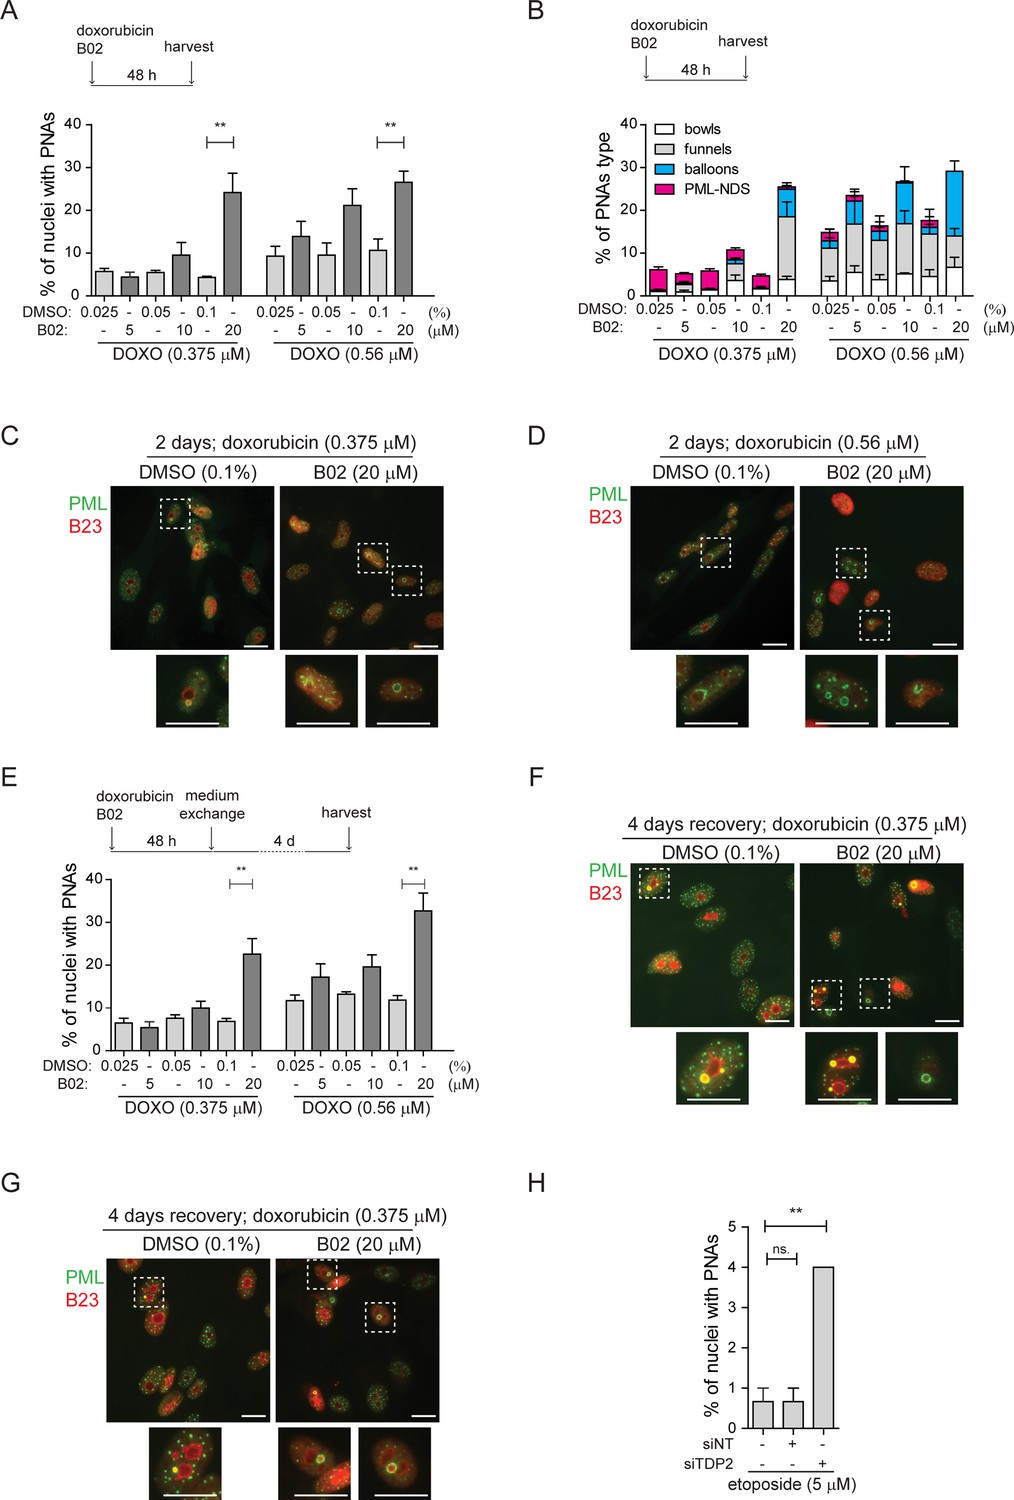
RPE-1hTERT cells were treated with doxorubicin and three concentrations of B02 or with etoposide after downregulation of TDP2 by RNA interference. After the treatment, the PML (green) and nucleolar marker B23 (red) were visualized by indirect IF and wide-field fluorescent microscopy, and percentage of nuclei with PNAs was calculated. (A) The bar graph represents the percentage of nuclei with PNAs after 2-day-long treatment with doxorubicin (0.375 µM or 0.56 µM), three concentrations of B02 (5, 10, and 20 µM), and corresponding concentrations of DMSO as a mock. (B) The bar graph represents the distribution of individual types of PNAs after the same treatments as shown in (A). (C) Representative cells after 2-day-long treatment with 0.375 µM doxorubicin combined with 20 µM B02 or 0.1% DMSO (mock). (D) Representative cells after 2-day-long treatment with 0.56 µM doxorubicin combined with 20 µM B02 or 0.1% DMSO (mock). (E) The bar graph represents the percentage of nuclei with PNAs after 4 days of recovery from 2-day-long treatments with doxorubicin (0.375 µM or 0.56 µM) together with three concentrations of B02 (5, 10, and 20 µM), and corresponding concentrations of DMSO. (F) Representative cells after 4 days of recovery from 2-day-long treatment, with 0.375 µM doxorubicin combined with 20 µM B02 or 0.1% DMSO (mock). (G) Representative cells after 4 days of recovery from 2-day-long treatment with 0.56 µM doxorubicin combined with 20 µM B02 or 0.1% DMSO (mock). (H) The bar graph represents the percentage of nuclei with PNAs after 2-day-long treatment with 5 µM etoposide in cells where TDP2 was downregulated by RNA interference. In all experiments, at least three biological replicates were evaluated. Results are presented as a mean ± SEM. An unpaired (A and E) and paired (H) two-tailed t-test were used for statistical evaluation. Asterisks indicate the following: ****p<0.0001, ***p<0.001, **p<0.01, *p<0.05. Scale bar, 20 μm.
-
Figure 2—source data 1
Numerical data for A, B, E, and H.
- https://cdn.elifesciences.org/articles/91304/elife-91304-fig2-data1-v1.xlsx
Figure 2—figure supplement 1
The inhibition of specific DNA repair pathways augmented the formation of PNAs.
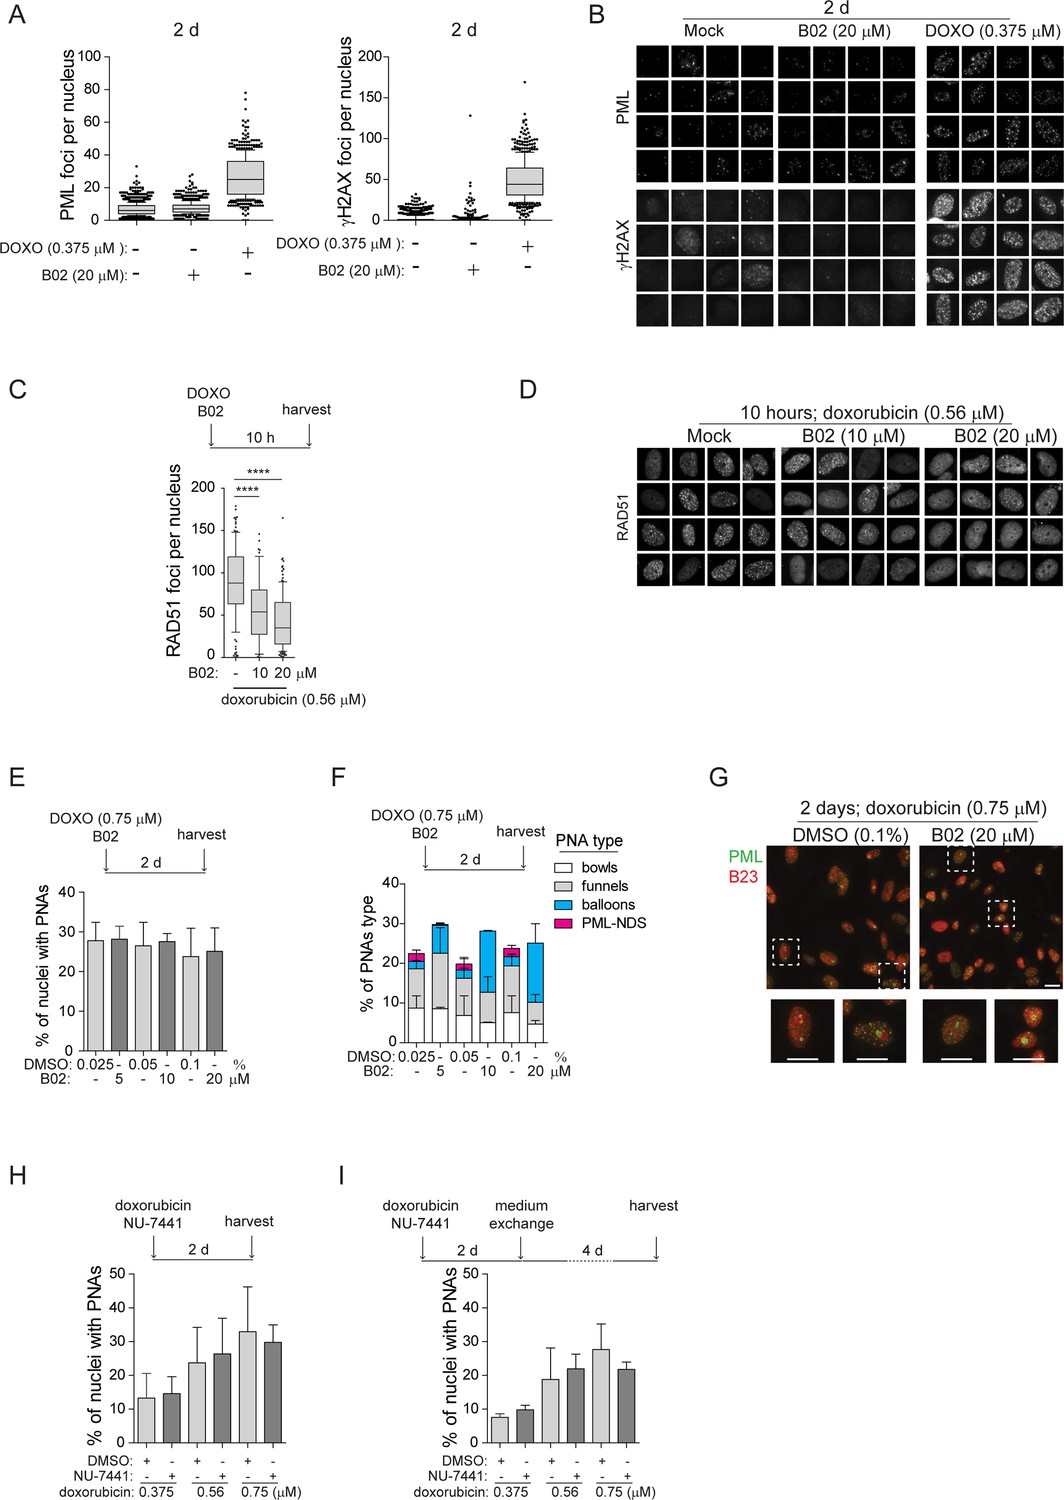
(A) RPE-1hTERT cells were exposed to 20 µM B02, the corresponding concentration of DMSO (mock), and 0.375 µM doxorubicin (positive control for DNA damage and PNAs) for 48 hr to estimate whether treatment with B02 can induce the PNAs or DSBs. PML and γH2AX were detected by indirect IF and ScanR. The PML or γH2AX count per nucleus is shown as whiskers plot (box: 10–90 percentiles; black line: median). (B) The galleries of nuclei with PML or γH2AX foci after treatment described in (A) are shown. (C) RPE-1hTERT cells were treated with 0.56 µM doxorubicin and 10 µM and 20 µM B02 to confirm the inhibition of RAD51 filament formation by B02. RAD51 was detected using indirect IF and ScanR. The RAD51 count per nucleus is shown as whiskers plot (box: 10–90 percentiles; black line: median). Only G2 cells discriminated by DNA content were analyzed. (D) The gallery of nuclei gated according to DAPI intensity for the G2 population with RAD51 foci after treatment described in (C) is shown. (E) RPE-1hTERT cells were exposed to 0.75 µM doxorubicin with three concentrations of B02 (5, 10, and 20 µM), or corresponding concentrations of DMSO. The plot represents the percentage of nuclei with PNAs after a 2-day-long treatment. (F) The plot represents the distribution of individual types of PNAs (%) after the treatments described in (E). (G) Representative cell from (E) after 2-day-long treatment with 0.75 µM doxorubicin combined with 20 µM B02 or 0.1% DMSO (mock). Scale bars, 20 μm. (H) RPE-1hTERT cells were exposed to three concentrations of doxorubicin (0.375 µM, 0.56 µM, and 0.75 µM) in combination with 1 µM NU-7441 (inhibitor of DNA PK and NHEJ) or corresponding concentration of DMSO (mock). The plot represents the percentage of nuclei with PNAs after a 2-day-long treatment. (I) RPE-1hTERT cells were exposed to three concentrations of doxorubicin (0.375 µM, 0.56 µM, and 0.75 µM), combined with 1 µM Nu7441 (inhibitor of DNA PK and NHEJ) or DMSO. The plot represents the percentage of nuclei with PNAs after a 2-day-long treatment and 4-day-long recovery. In all experiments, at least three biological replicates were evaluated. Results are presented as a mean ± SEM. An unpaired (C) two-tailed t-test was used for statistical evaluation. Asterisks indicate the following: ****p<0.0001, ***p<0.001, **p<0.01, *p<0.05.
-
Figure 2—figure supplement 1—source data 1
Numerical data for A, C, E, F, H, and I.
- https://cdn.elifesciences.org/articles/91304/elife-91304-fig2-figsupp1-data1-v1.xlsx
Figure 2—figure supplement 2
The inhibition of specific DNA repair pathways augmented the formation of PNAs.
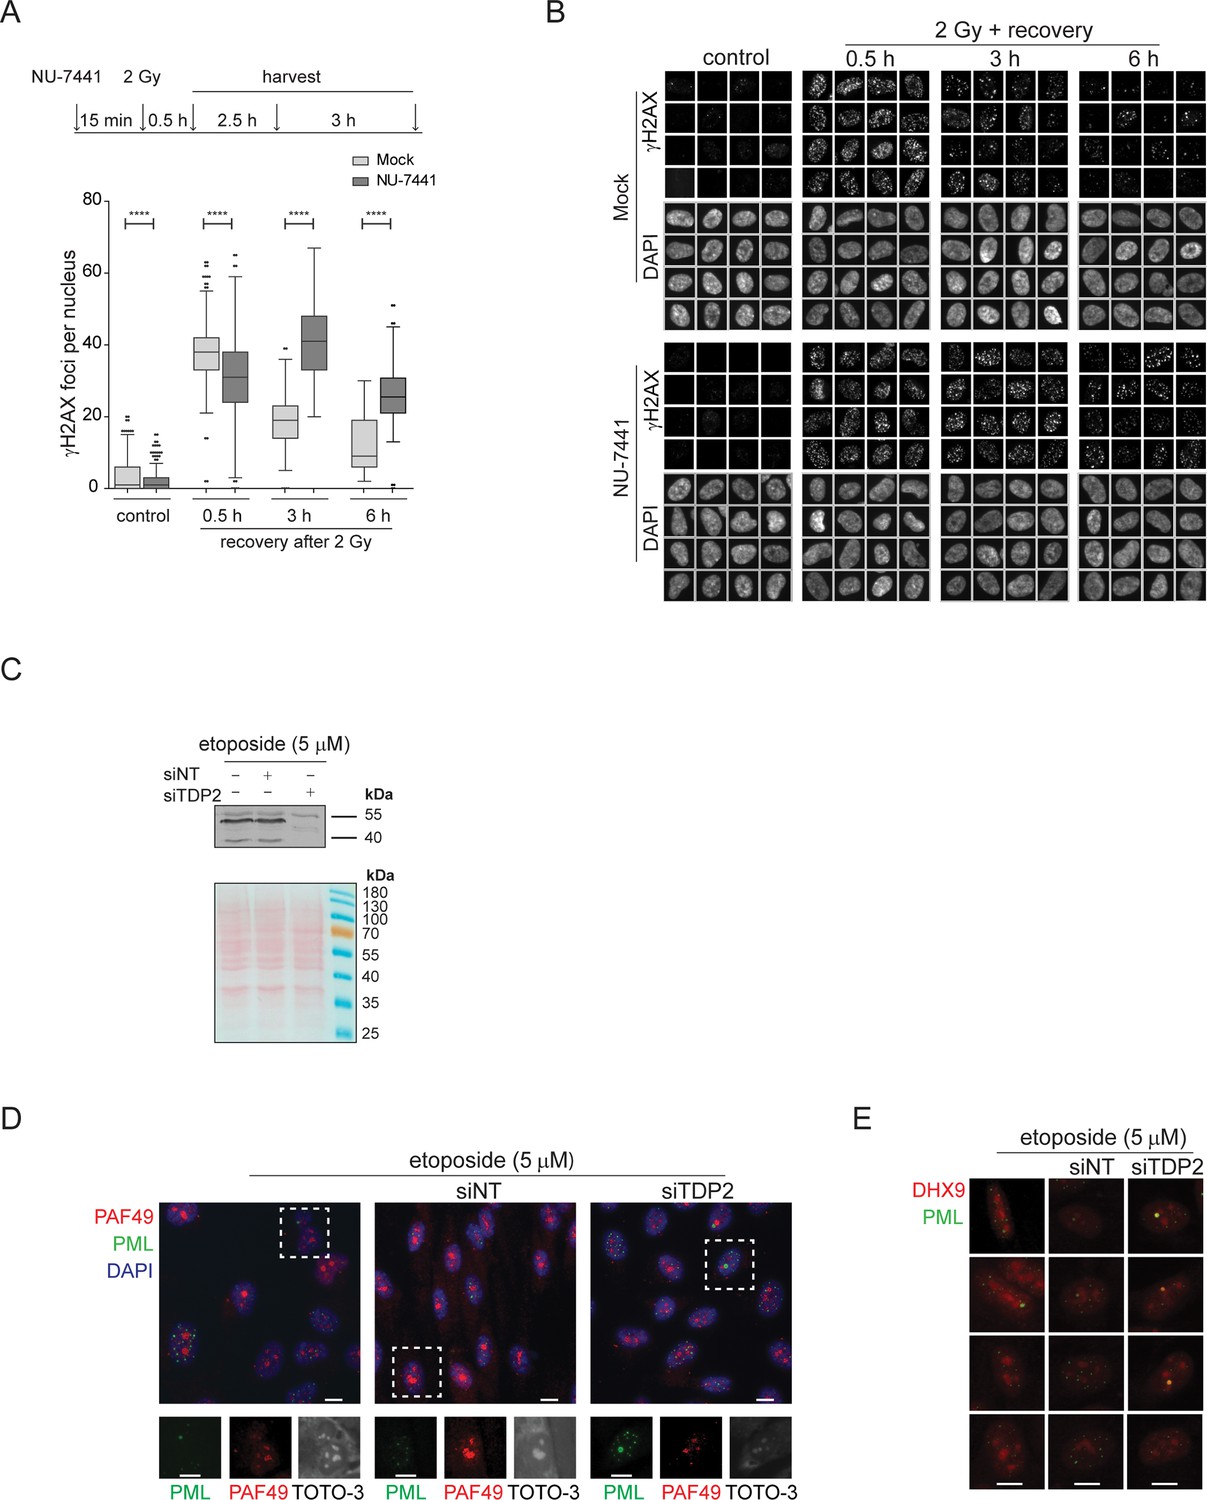
(A) RPE-1hTERT cells were exposed to IR (2 Gy) in the presence or absence of 1 µM Nu7441 (added 15 min before irradiation). The presence of γH2AX foci (a marker of DSBs) was analyzed 0.5, 3, and 6 hr after IR by indirect IF and ScanR. Quantification of γH2AX count per nucleus is presented as a whiskers plot (box: 10-90 percentiles; black line: median). Only G1 cells discriminated by DNA content were analyzed. (B) The gallery of nuclei (co-stained with DAPI) with γH2AX foci treated and analyzed as described in (A) is shown. (C) RPE-1hTERT cells were transfected with siRNA targeting TDP2 or non-targeting siRNA as control. 2 days after the transfection, 5 µM etoposide was added for an additional 2 days. Then, the cells were harvested, and the level of TDP2 protein was examined. The Ponceau-S staining is A shown as a control. (D) RPE-1hTERT cells were treated as described in (C), and the PML (green) and PAF49 (subunit of RNAPI; red) were detected by indirect IF and wide-field microscopy to evaluate the activity of RNAPI marked as PAF49 segregation and correlation with PNAs type occurrence. The nuclei and nucleoli were co-stained by DAPI and TOTO-3, respectively. (E) After the treatment described in (C), the PML and DHX9 were detected by indirect IF and wide-field microscopy to prove the accumulation of DHX9 in PML-NDS. An unpaired two-tailed t-test was used for statistical evaluation. Asterisks indicate the following: ****p<0.0001, ***p<0.001, **p<0.01, *p<0.05. Scale bars, 10 μm.
-
Figure 2—figure supplement 2—source data 1
RAW membranes for C.
- https://cdn.elifesciences.org/articles/91304/elife-91304-fig2-figsupp2-data1-v1.zip
-
Figure 2—figure supplement 2—source data 2
Uncropped and labeled membranes for C.
- https://cdn.elifesciences.org/articles/91304/elife-91304-fig2-figsupp2-data2-v1.zip
-
Figure 2—figure supplement 2—source data 3
Numerical data for A.
- https://cdn.elifesciences.org/articles/91304/elife-91304-fig2-figsupp2-data3-v1.xlsx
Figure 3 with 3 supplements
PNAs encircle rDNA and DJ loci containing DSB after doxorubicin treatment.
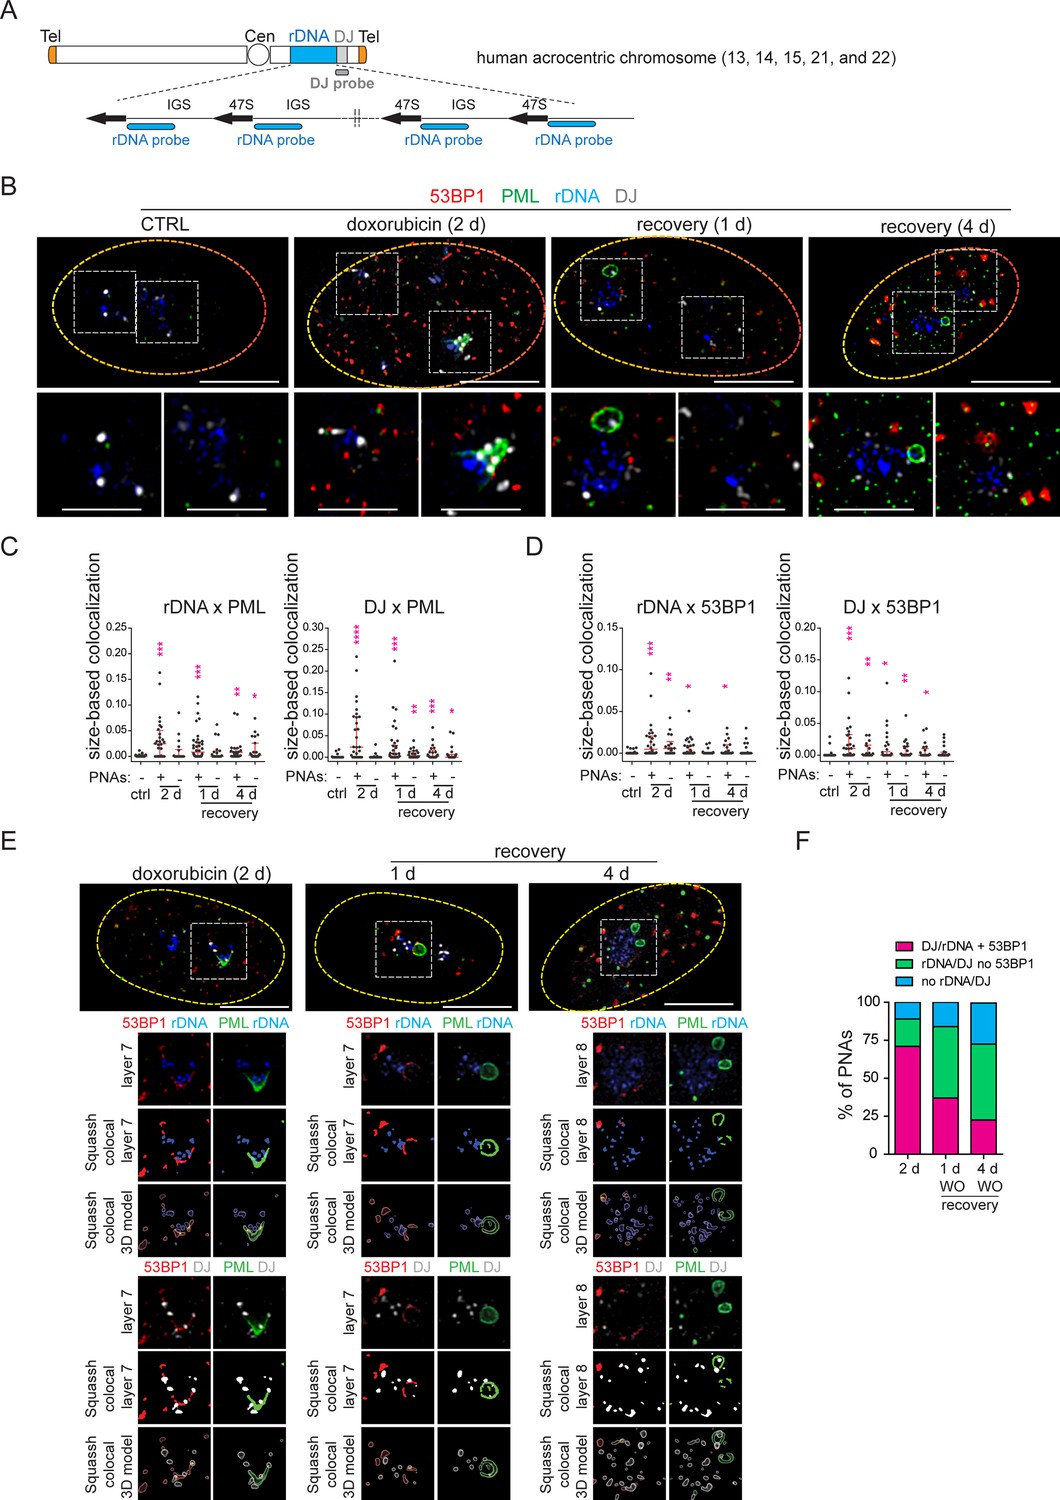
RPE-1hTERT cells were treated with 0.75 µM doxorubicin for 2 days and recovered for 1 and 4 days. The proliferating cells were used as a control. rDNA, DJ, PML, and 53BP1 localization was analyzed using immuno-FISH staining and confocal microscopy. (A) The scheme of a human acrocentric chromosome. The probes' position for detecting the rDNA locus (blue) and DJ locus (grey) is shown. (B) The representative nuclei and the nucleoli with and without PNAs in control and treated cells are shown. rDNA (blue), DJ (white), PML (green), and 53BP1 (red). (C) The extent of PML-rDNA and PML-DJ size-based co-localization calculated for individual nucleoli of treated and untreated cells with respect to the presence of PNAs is shown as a scatter plot. The median with an interquartile range is shown. The co-localization was calculated using Fiji(ImageJ)/Mosaic/Segmentation/Squassh plugin. The number of analyzed nucleoli in each group was: ctrl (n=26); 2 days+PNAs (n=28); 2 days without PNAs (n=18); 1-day-long recovery +PNAs (n=38); 1-day-long recovery without PNAs (n=20); 4-day-long recovery +PNAs (n=23); 4-day-long recovery without PNAs (n=24). (D) The extent of 53BP1-rDNA and 53BP1-DJ size-based co-localization calculated for individual nucleoli of treated and untreated cells with respect to the presence of PNAs is shown as a scatter plot. The median with interquartile range is shown. The same collection of nucleoli was used as presented in (C). (E) The example of analysis that was used to identify whether rDNA/DJ with DSB co-localized with PNAs. The images of the representative nucleoli (2 days doxorubicin, 1- and 4- days recovery) after deconvolution, segmentation, and its 3D model are shown. Note, that the signal of all observed markers was identified as a unique 3D object. rDNA (blue), DJ (white), PML (green), and 53BP1 (red). (F) The combined bar graph shows the percentage of PNAs containing rDNA/DJ with DSB, rDNA/DJ without DSB, and PNAs in which the rDNA/DJ signal was not detected. The number of analyzed nucleoli: 2 days doxorubicin (n=28), 1-day-long recovery (n=39), 4-day-long recovery (n=21). Non-parametric two-tailed Mann-Whitney test was used for statistical evaluation (C and D). Asterisks indicate the following: ****p<0.0001, ***p<0.001, **p<0.01, *p<0.05. Scale bars, 10 μm (nuclei in B and E) and 5 μm (nucleoli in B).
-
Figure 3—source data 1
Numerical data for C, D, and F.
- https://cdn.elifesciences.org/articles/91304/elife-91304-fig3-data1-v1.xlsx
Figure 3—figure supplement 1
PNAs envelop rDNA and DJ loci containing rDNA DSB after doxorubicin treatment.
RPE-1hTERT cells were treated with 0.75 µM doxorubicin for 2 days and recovered from the treatment for 1 day. The proliferating cells were used as a control. The localization of rDNA, DJ, PML, and B23 was analyzed using immuno-FISH staining and confocal microscopy to find the correlation between nucleolar caps (individual NORs) and PNAs. The sections of several nucleoli and the associated PNAs are presented in detail: rDNA (blue), DJ (white), PML (green), and B23 (red). Scale bars, 10 μm (nuclei), 5 μm (nucleoli), and 2 μm (PNAs).
Figure 3—figure supplement 2
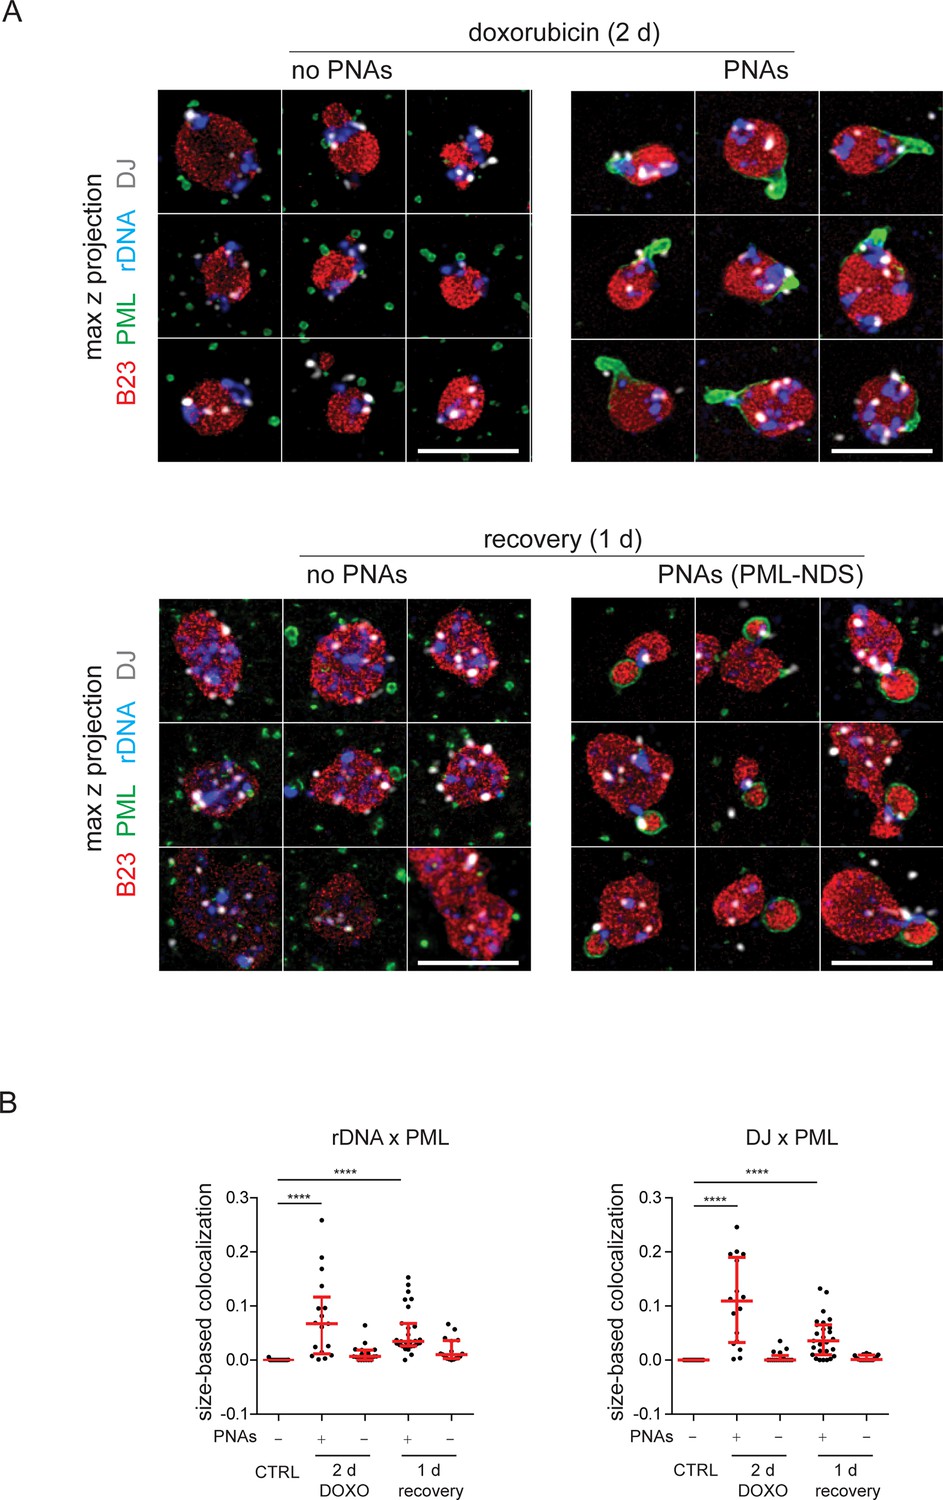
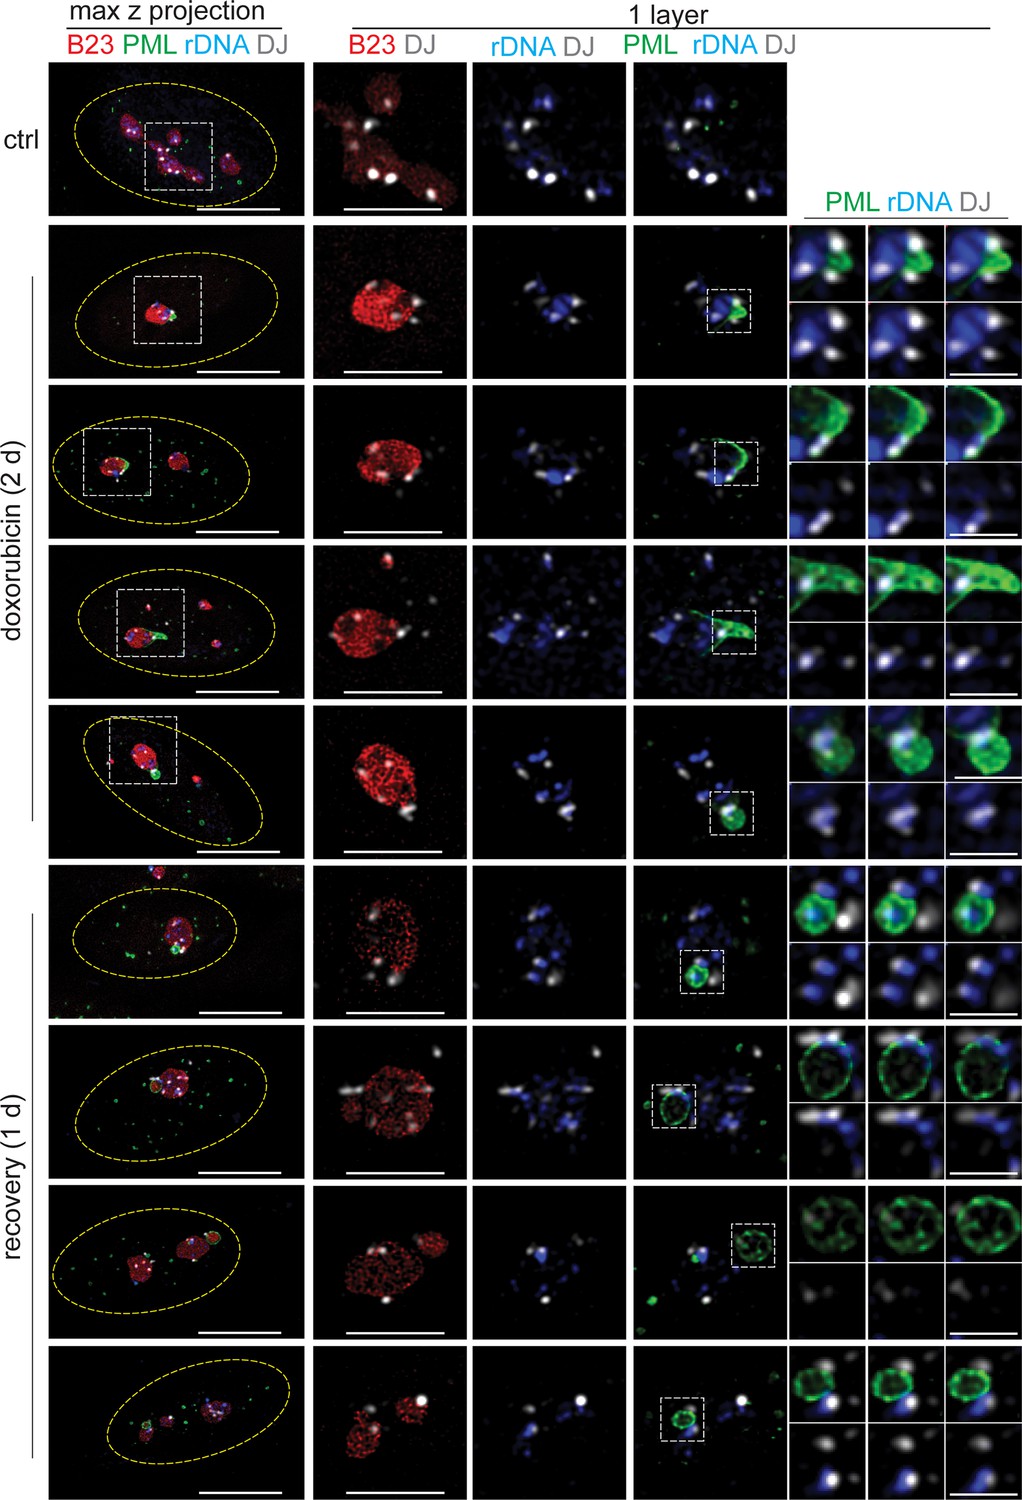
PNAs envelop rDNA and DJ loci containing rDNA DSB after doxorubicin treatment.
(A) RPE-1hTERT cells were treated with 0.75 µM doxorubicin for 2 days and recovered from the treatment for 1 day. The proliferating cells were used as a control. The localization of rDNA (blue), DJ (white), PML (green), and B23 (red) was analyzed using immuno-FISH staining and confocal microscopy. The gallery of nucleoli with and without PNAs is presented. Scale bars, 5 μm. (B) The extent of PML-rDNA and PML-DJ size-based co-localization calculated for individual nucleoli of treated and untreated cells with respect to the presence of PNAs is shown as a scatter plot. The median with an interquartile range is shown. The co-localization was calculated using Fiji/Mosaic/Squassh plugin. The number of analyzed nucleoli in each group was: ctrl (n=19); 2 days+PNAs (n=17); 2 days without PNAs (n=18); 1-day-long recovery +PNAs (n=27); 1-day-long recovery without PNAs (n=17). Non-parametric two-tailed Mann-Whitney test was used for statistical evaluation. Asterisks indicate the following: ****p<0.0001, ***p<0.001, **p<0.01, *p<0.05.
-
Figure 3—figure supplement 2—source data 1
Numerical data for B.
- https://cdn.elifesciences.org/articles/91304/elife-91304-fig3-figsupp2-data1-v1.xlsx
Figure 3—figure supplement 3
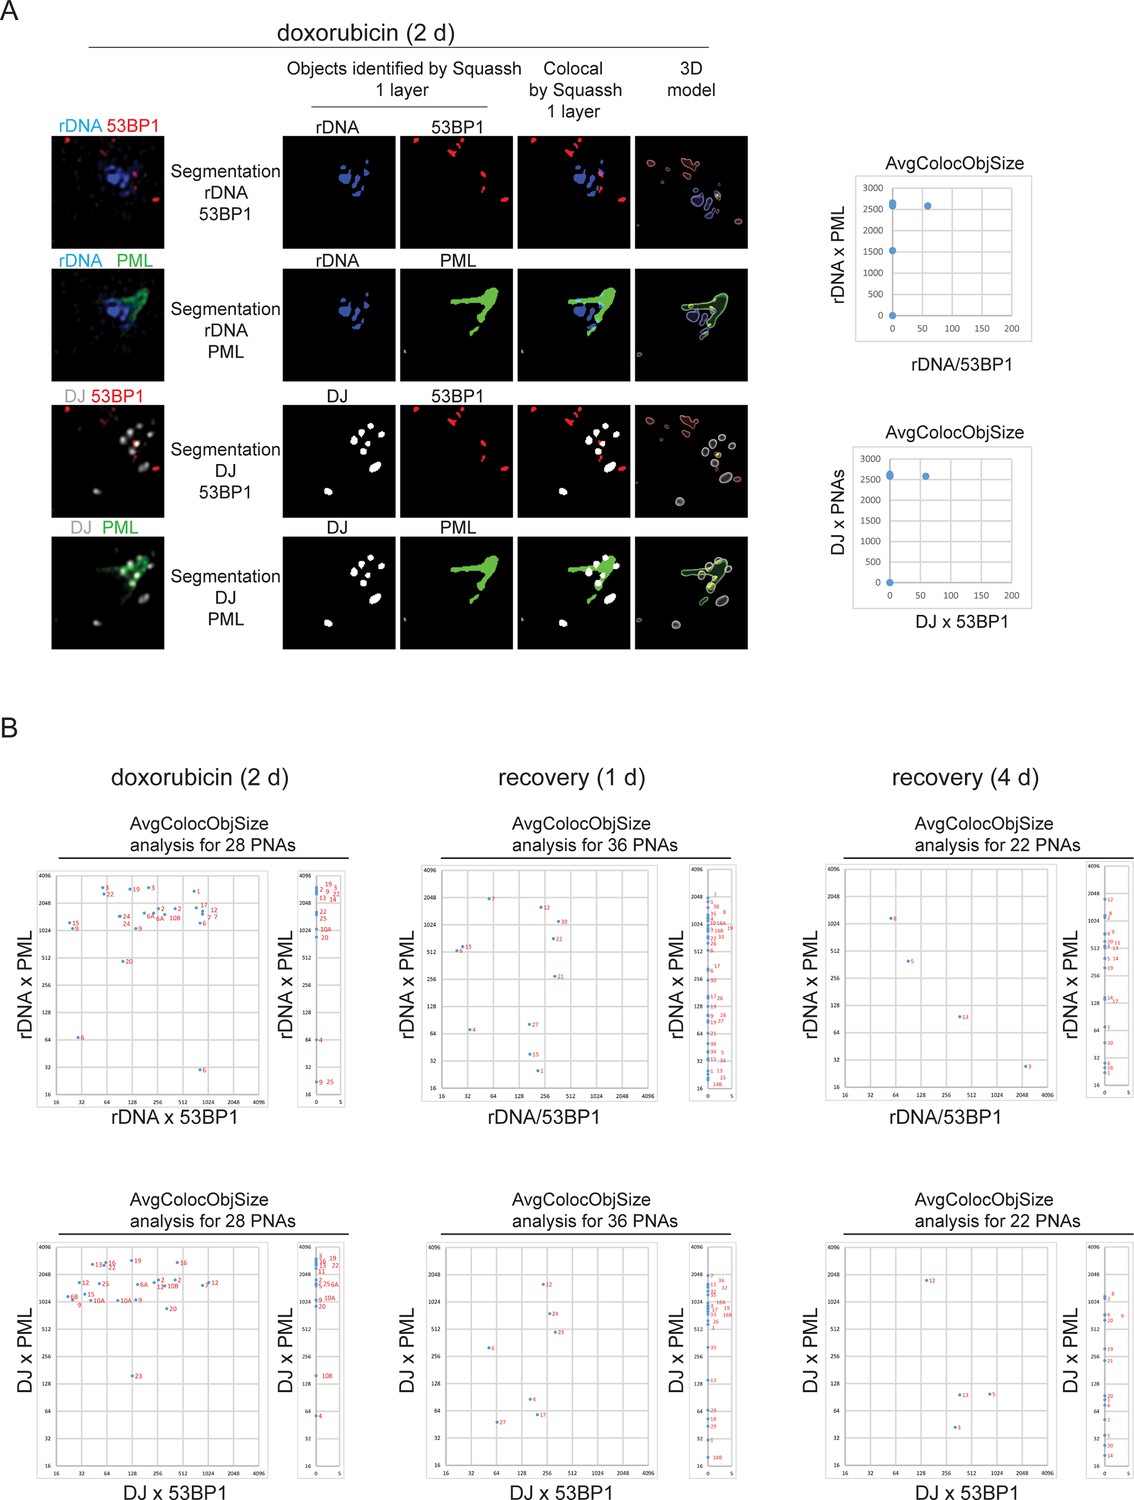
PNAs envelop rDNA and DJ loci containing rDNA DSB after doxorubicin treatment.
RPE-1hTERT cells were treated with 0.75 µM doxorubicin for 2 days and recovered from the treatment for 1 and 4 days. (A) The image of representative nucleolus with funnel-like PNAs is used to explain the principle of analysis used to identify whether PNAs co-localize with rDNA/DJ with DSB. The co-localization between rDNA/DJ and PML and rDNA/DJ and 53BP1 was done using Fiji/Mosaic/Squassh plugin. The original image, the segmentation, the obtained co-localization between individual objects, and 3D model (done in Imaris) are shown. As for both segmentations (rDNA–53BP1×rDNA–PML; similarly for DJ–53BP1×DJ–PML) the same parameters were used, and each object got the same number, the extent of co-localization with 53BP1 or PML with the same rDNA/DJ object could be defined. The presented scatter plot expresses the size of co-localization of individual rDNA/DJ objects with 53BP1 (x-axis) and PML (y-axis). (B) The size of co-localization of individual rDNA/DJ objects with PML and 53BP1 obtained for all analyzed nucleoli is shown in the x/y scatter plot.
-
Figure 3—figure supplement 3—source data 1
Numerical data for B.
- https://cdn.elifesciences.org/articles/91304/elife-91304-fig3-figsupp3-data1-v1.xlsx
Figure 4 with 4 supplements
The DNA damage introduced into the rDNA locus by endonuclease I-PpoI induces PML-NDS.
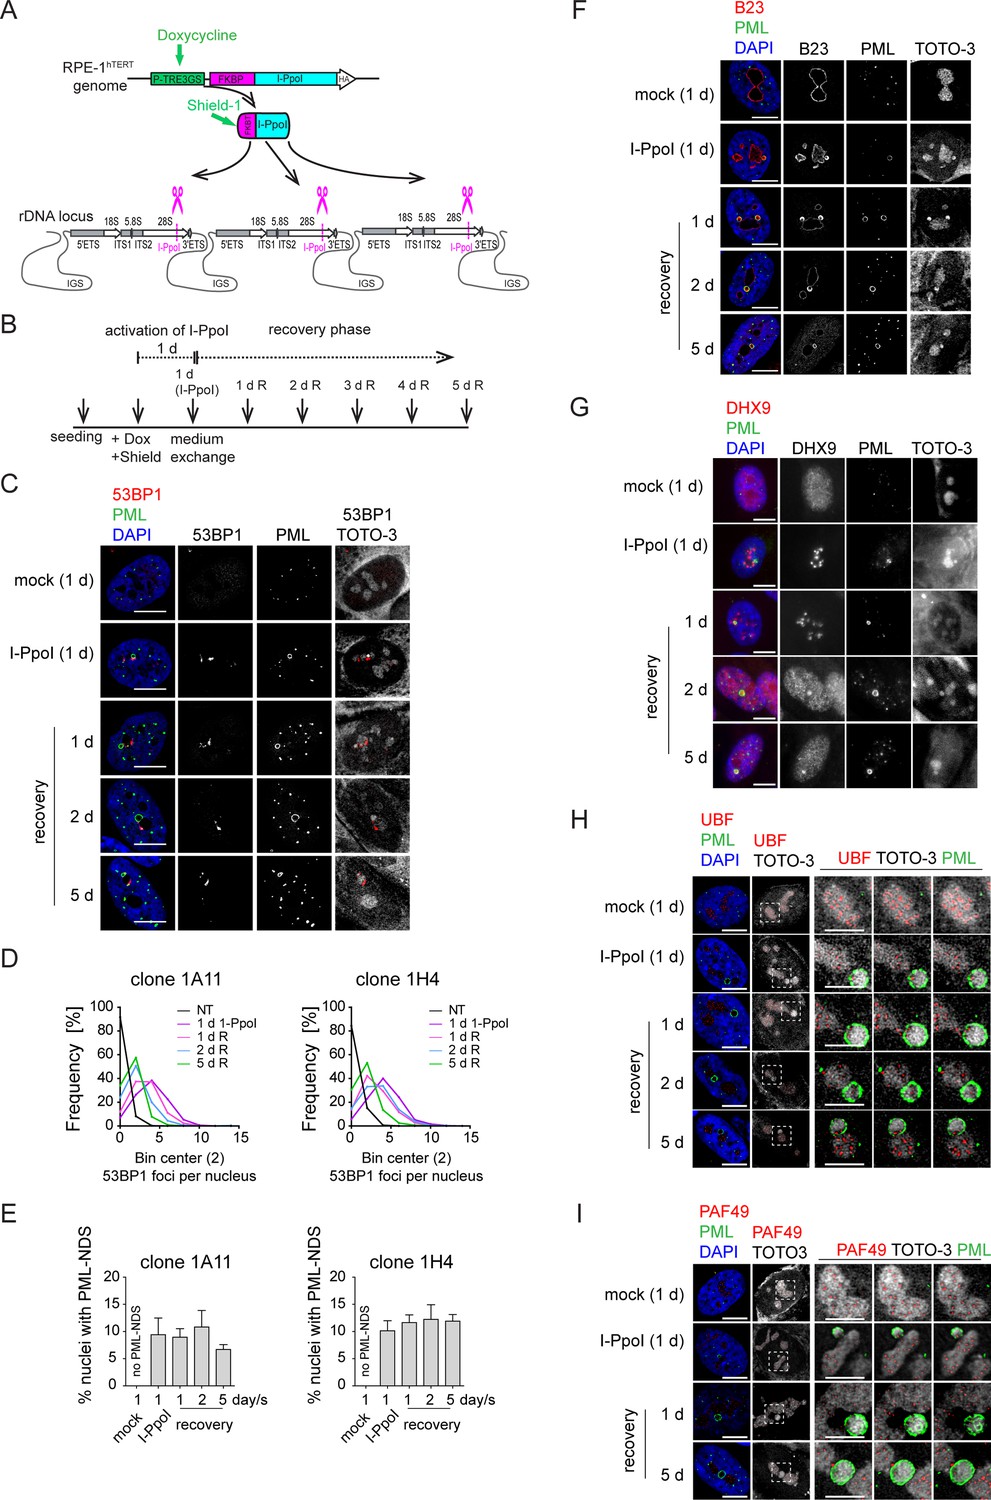
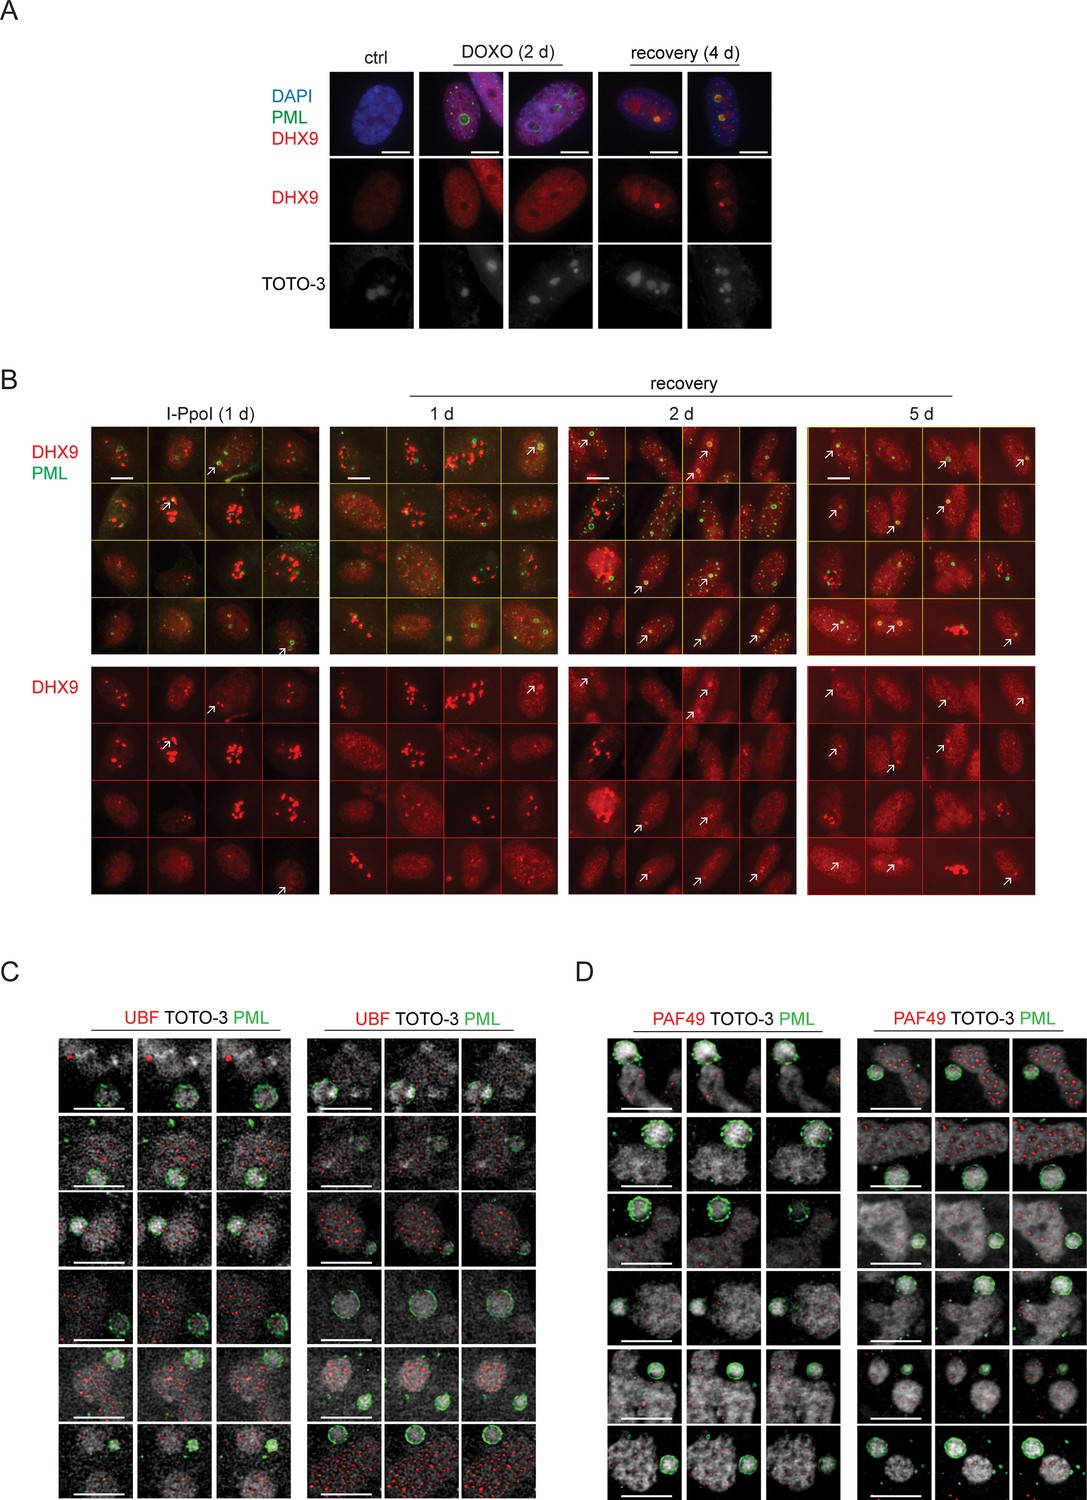
(A) Scheme of inducible expression of endonuclease I-PpoI in RPE-1hTERT cells and the position of I-PpoI cleavage site in rDNA locus. Tetracycline-inducible promoter (P-TRE3GS), destabilization domain (FKBP), intergenic spacer (IGS), external transcribed spacer (ETS), internal transcribed spacer (ITS). (B) Scheme of the experimental setup used in all experiments presented. Briefly, I-PpoI was activated by doxycycline and Shield for 24 hr, then the medium was exchanged, and the cells were analyzed upon the recovery phase (0, 1, 2, and 5 days). (C) The representative images obtained by indirect IF and confocal microscopy (STELLARIS) show the localization of 53BP1 (a marker of DSB, red), and PML (green) upon 1-day-long activation of I-PpoI and during recovery from I-PpoI insult. DAPI (blue) and TOTO-3 (white) marked the nucleus and nucleolus, respectively. Only one layer from the several sections is presented. (D) The level of DSB upon the recovery from I-PpoI insult was obtained by detecting the 53BP1 (a marker of DSB) by indirect IF andScanR. The histogram represents the frequency of nuclei (%) with the same number of 53BP1 foci. The bin center used for analysis was 2. (E) The number of nuclei with PNAs upon the recovery from I-PpoI insult was obtained by detection of PML using indirect IF and a ScanR. The quantification was done manually by evaluating PML localization in more than 200 nuclei; the TOTO-3 was used to mark nucleoli. The bar graph represents the percentage of nuclei with PNAs. Results are presented as a mean ± SEM obtained from four (1A11) and three (1H4) biological replicates. (F) The representative images obtained by indirect IF and confocal microscopy (STELLARIS) show the correlation between the localization of B23 (red) in PML-NDS (PML, green) upon the recovery from I-PpoI insult. The nucleus and nucleolus were marked by DAPI (blue), and TOTO-3 (white), respectively. Only one layer from the several sections is presented. (G) The representative images obtained by indirect IF and wide-field microscopy show the correlation between the localization of DHX9 (red) and PML-NDS (PML, green) upon the recovery from I-PpoI insult. The nucleus and nucleolus were marked by DAPI (blue), and TOTO-3 (white), respectively. The representative images obtained by indirect IF and confocal microscopy (STELLARIS) show the localization of UBF (H, a marker of rDNA; red) or PAF49 (I, a subunit of RNAPI; red) in PML-NDS (PML, green) upon the recovery from I-PpoI insult. One layer of the nucleus and three sequential layers of nucleolus with PML-NDS are presented. The nucleus and nucleolus were marked by DAPI (blue) and TOTO-3 (white), respectively. Scale bars, 10 μm (nuclei in C, F, G, H, and I) and 5 μm (nucleoli in H and I).
-
Figure 4—source data 1
Numerical data for D and E.
- https://cdn.elifesciences.org/articles/91304/elife-91304-fig4-data1-v1.xlsx
Figure 4—figure supplement 1
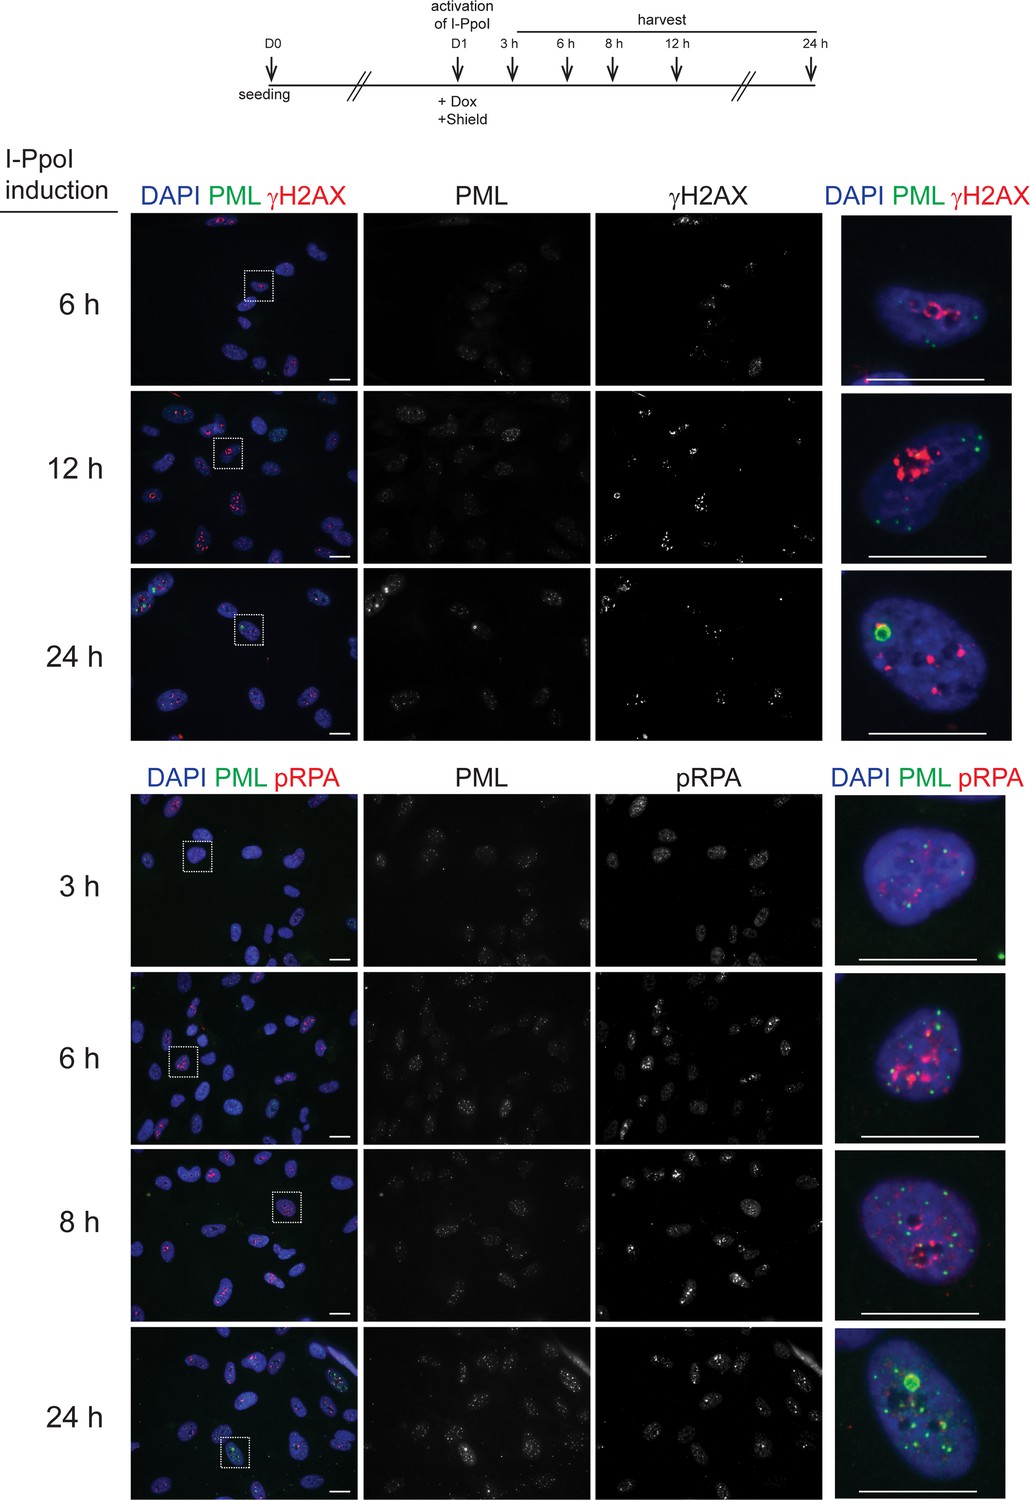
The DNA damage introduced into the rDNA locus by endonuclease I-PpoI induces PML-NDS.
The I-PpoI was activated 24 hr after RPE-1hTERT-I-PpoI (1H4) seeding using doxycycline and Shield. The cells were harvested 3, 6, 8, 12, and 24 hr after I-PpoI induction. The PNAs (PML; green) and DSBs (γH2AX or RPA2pS33; red) were detected by indirect IF and ScanR. The DNA was stained by DAPI (blue). Scale bars: 20 μm.
Figure 4—figure supplement 2
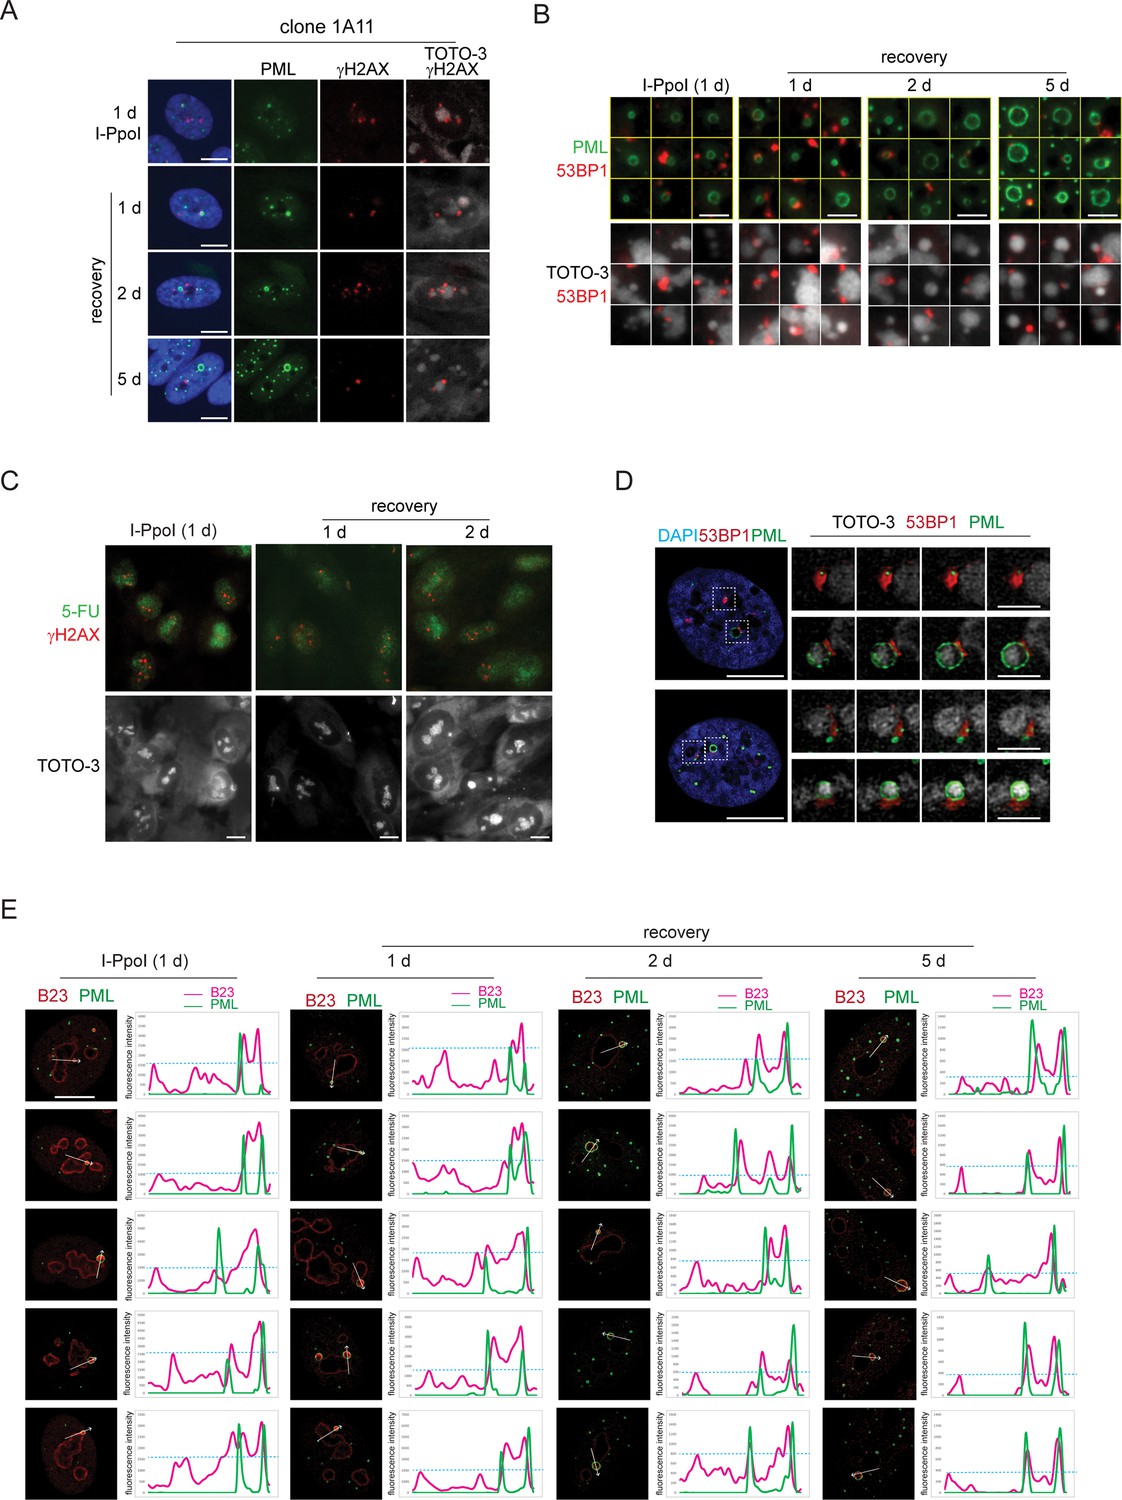
The DNA damage introduced into the rDNA locus by endonuclease I-PpoI induces PML-NDS.
The I-PpoI was activated 24 hr after RPE-1hTERT-I-PpoI seeding using doxycycline and Shield. The cells were harvested after 24 hr of I-PpoI activation or 1, 2 and 5 days in recovery phase. The different parameters were analyzed in these time points. (A) The representative images obtained by indirect IF and wide-field microscopy show the localization of γH2AX (a marker of DSB; red) and PML (green) and their relationship with the nucleolus. The nuclei and nucleoli were co-stained with DAPI (blue), and TOTO-3 (white), respectively. (B) The gallery of PNAs (PML-NDS) indicates their relationship with DSB and nucleoli. Indirect IF and wide-field microscopy detected 53BP1 (a marker of DSB; red) and PML (a marker of PML-NDS; green). The nucleoli were stained by TOTO-3 (white). (C) The activity of RNAPI was detected by 5-FU by 30 min long incubation at different time points. 5-FU (green) represents newly synthesized nucleolar RNA and γH2AX (red) DSBs. The nucleoli were co-stained TOTO-3 (white). (D) The localization of DSB next to PML-NBs and PML-NDS is shown. The 53BP1 (a marker of DSB; red) and PML (a marker of PML-NBs and PML-NDS; green) were detected by indirect IF and confocal microscopy (STELLARIS). The nuclei and nucleoli were stained with DAPI (blue) and TOTO-3 (white), respectively. (E) The accumulation of B23 in PML-NDS is presented by plot profiles representing the intensity of B23 (red) and PML (green) fluorescence. The images obtained by indirect IF and confocal microscopy (STELLARIS) were analyzed. Scale bars: 10 μm (nuclei in A, C, D); 5 μm (nucleoli in B); 3 μm (PML-NDS and PML-NBs in D).
-
Figure 4—figure supplement 2—source data 1
Numerical data for E.
- https://cdn.elifesciences.org/articles/91304/elife-91304-fig4-figsupp2-data1-v1.xlsx
Figure 4—figure supplement 3
The DNA damage introduced into the rDNA locus by endonuclease I-PpoI induces PML-NDS.
(A) The localization of DHX9 after exposure of RPE-1hTERT cells to 0.75 µM doxorubicin is shown after a 2-d treatment followed by a 4-d recovery. DHX9 (red) and PML (green) were detected by indirect IF and wide-field microscopy. The nuclei and nucleoli were stained with DAPI (blue) and TOTO-3 (white), respectively. (B) The gallery of nuclei represents the link between the DHX9 localization and PML-NDS after the I-PpoI insult (24 hr) and the recovery (1, 2, and 5 days after medium exchange). The DHX9 (red) and PML (a marker of PML-NDS, green) were detected by indirect IF and wide-field microscopy. The arrows indicate PML-NDS with DHX9 inside. Note this localization of DHX9 is characteristic of doxorubicin-induced PML-NDS. The representative images show the link between UBF (C) or PAF49 (D) and I-PpoI-induced PML-NDS. UBF (a marker of rDNA; red), PAF49 (a subunit of RNAPI; red), and PML (a marker of PML-NDS; green) were detected by indirect IF and confocal microscopy (STELLARIS). The nucleoli were stained with TOTO-3 (white). Three sequential layers are presented. Scale bars: 10 μm (A and B); 5 μm (C and D).
Figure 4—figure supplement 4
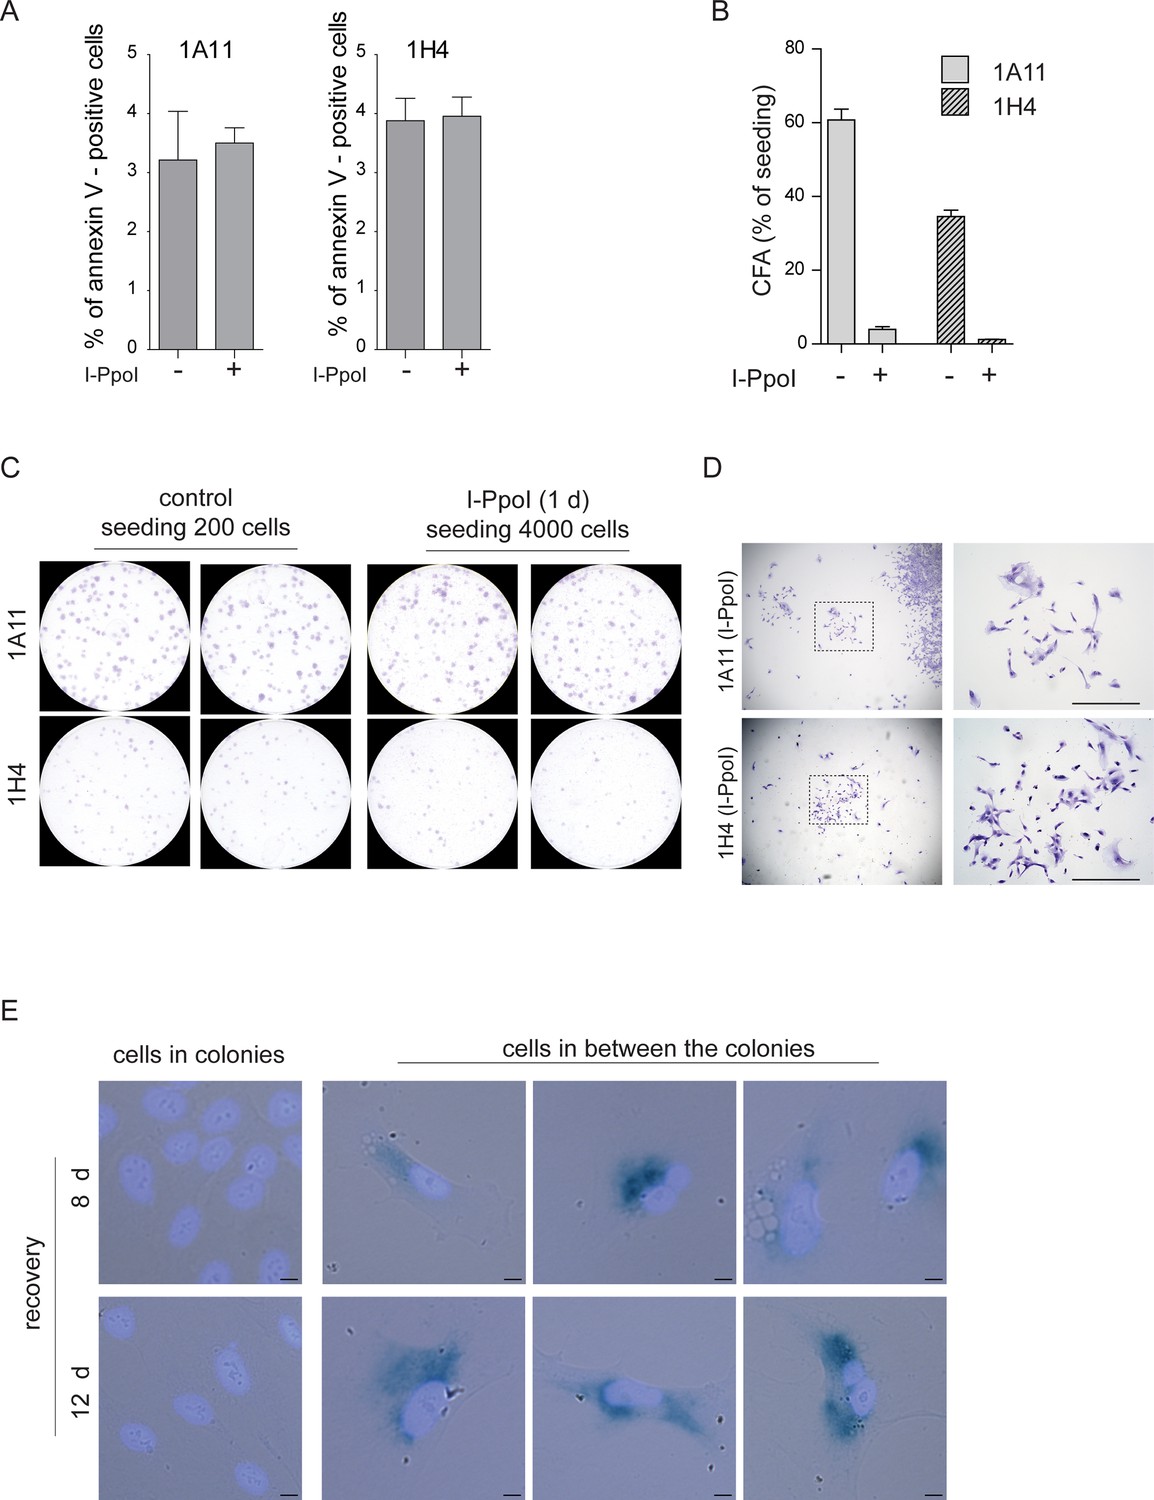
The DNA damage introduced into the rDNA locus by endonuclease I-PpoI induces cellular senescence.
(A) The I-PpoI was activated for 24 hr then cells were analyzed for marker of apoptosis, annexin-V using Fluorescence-Activated Cell Sorting (FACS). The percentage of annexin V-positive cells is shown as a mean ± SEM from two biological replicates. (B) The ability to form colonies after treatment described in (A) was assessed using colony forming assay. The percentage of cells able to form a colony is shown as a mean ± SEM from three (1A11) and two (1H4) independent biological replicates. (C and D) The representative plates from (B) and the morphology of cells stained by crystal violet and captured by ZEISS AxioZoom V.16 microscope are shown. (E) In cells treated as (A) the senescence-associated β-galactosidase activity was detected by colorimetric assay after 8 and 12 days of recovery. The cells were captured by wide-field microscopy using a color camera. Scale bars: 500 μm (D); 10 μm (E).
-
Figure 4—figure supplement 4—source data 1
Numerical data for A and B.
- https://cdn.elifesciences.org/articles/91304/elife-91304-fig4-figsupp4-data1-v1.xlsx
Figure 5 with 2 supplements
Inhibition of ATM, ATR, and RAD51 suppressed the formation of I-PpoI-induced PML-NDS.
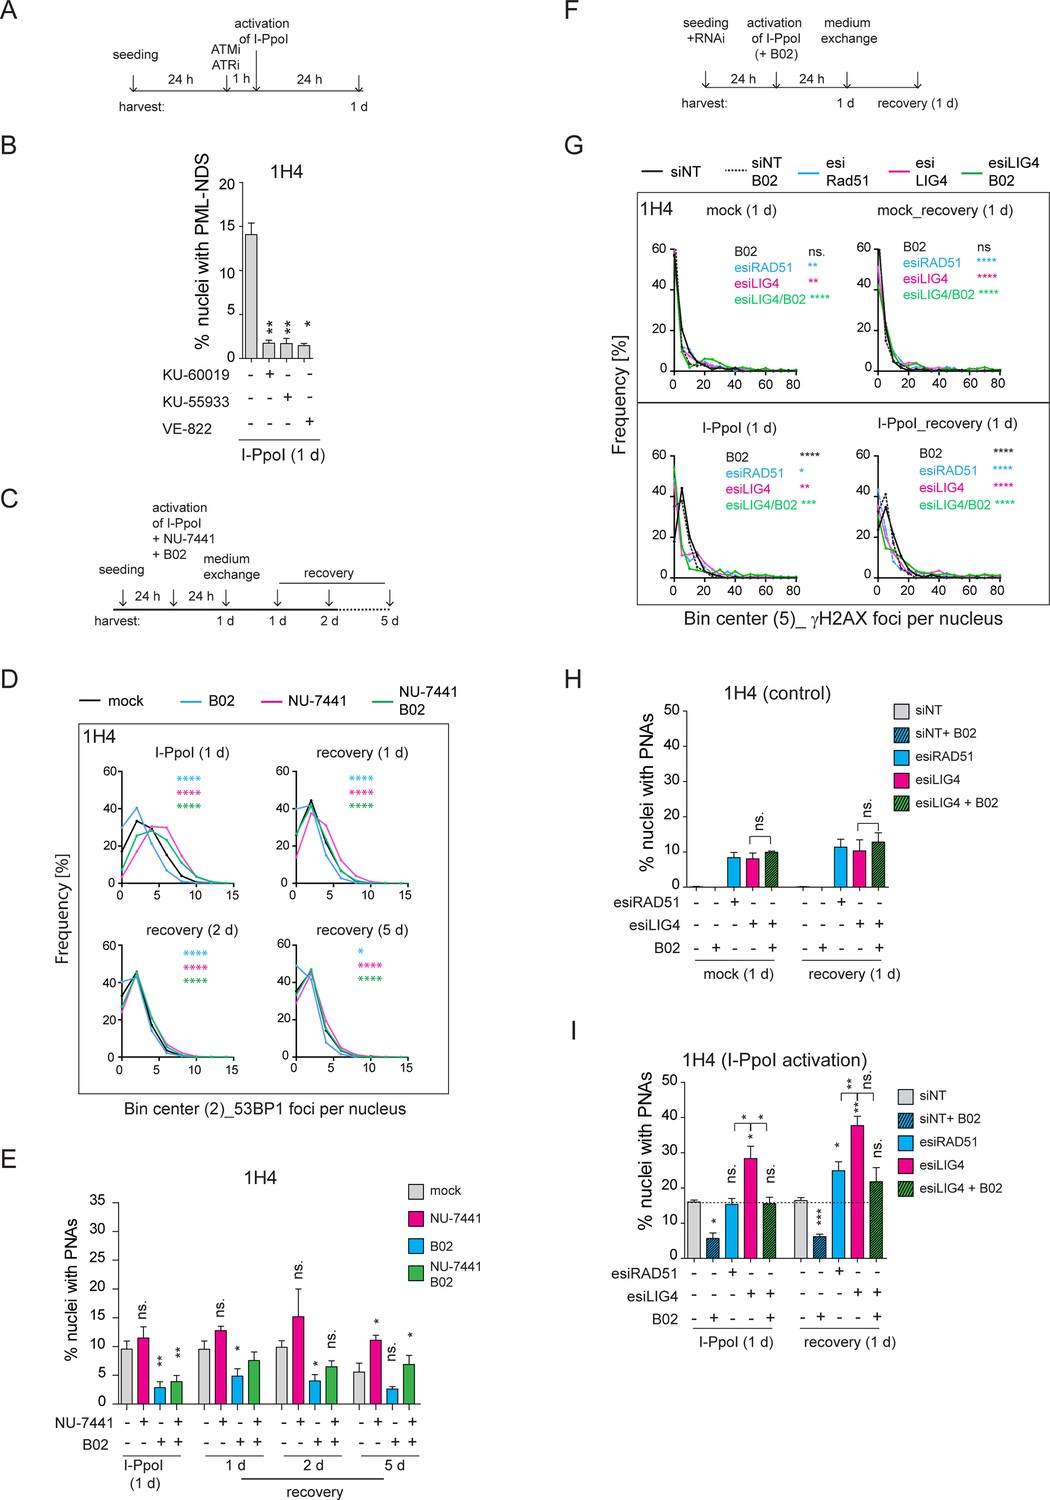
(A) The scheme of the experimental setup used in the experiment shown in (B) is presented. Briefly, 24 hr after seeding of RPE-1hTERT-I-PpoI cells (clone 1H4), the ATM inhibitors (1 µM KU-60019 or 6 µM KU-55933) or ATR inhibitor (0.2 µM VE-822) were added 1 hr before the activation of I-PpoI expression. (B) The number of nuclei with PNAs upon the I-PpoI insult and simultaneous inhibition of ATM or ATR was obtained by detecting PML and nucleolus using indirect IF and ScanR. The quantification was done manually, evaluating PML localization in more than 200 nuclei. The bar plot represents the percentage of nuclei with PNAs. (C) The scheme of the experimental setup used in (D and E and Figure 5—figure supplement 1B and C) is presented. Briefly, 24 hr after seeding I-PpoI was activated in RPE-1hTERT-I-PpoI cell clones 1A11 and 1H4 for 24 hr. The inhibitors of DNA PK (1 µM NU-7441) or RAD51 (10 µM B02) were applied individually or both together at the time of I-PpoI activation. After 24 hr, the medium was exchanged, and the cells were analyzed during the recovery phase (0, 1, 2, and 5 days). (D) During the recovery phase, the level of DSBs was quantified by detecting 53BP1 (a marker of DSBs) using indirect IF and ScanR. The data from three independent biological replicates (values for 200 nuclei) were pooled together and represented as histograms showing the frequency of nuclei (%) with the same number of 53BP1 foci. The bin center used for analysis was 2. (E) The number of nuclei with PNAs upon the recovery from I-PpoI insult and simultaneous inhibition of particular DNA damage repair pathway was obtained by detecting PML using indirect IF and ScanR. The quantification was done manually by the evaluation of PML localization in more than 200 nuclei. (F) The scheme of the experimental setup used in experiments shown in (G, H, and I) is presented. Briefly, the RPE-1hTERT-I-PpoI (clone 1H4) were transfected by interfering RNA upon seeding. After 24 hr, the I-PpoI was activated for 24 hr. Then, the medium was changed, and cells recovered from rDNA damage for 0 and 1 day. The control cells were treated with corresponding concentration of DMSO simultaneously (mock). (G). The level of DSB was quantified by detecting γH2AX (a marker of DSBs) using indirect IF and ScanR. The data from three independent biological replicates (values for 200 nuclei) were pooled together and represented as histograms showing the frequency of nuclei (%) with the same number of γH2AX foci. The number of nuclei with PNAs upon the recovery from (H) inhibition of a particular DNA damage repair pathway by RNA interference and without the activation of I-PpoI or (I) when I-PpoI was activated together with the inhibition of a particular DNA damage repair pathway was obtained by detection of PML using indirect IF and ScanR. The quantification was done manually by evaluating PML localization in more than 200 nuclei. The bar plot represents the percentage of nuclei with PNAs. Results are presented as a mean ± SEM obtained from at least three biological replicates. A paired (B, E, H, and I) and unpaired (D, G) two-tailed t-test were used for statistical evaluation. Asterisks indicate the following: ****p<0.0001, ***p<0.001, **p<0.01, *p<0.05.
-
Figure 5—source data 1
Numerical data for B, D, E, G, H, and I.
- https://cdn.elifesciences.org/articles/91304/elife-91304-fig5-data1-v1.xlsx
Figure 5—figure supplement 1
Inhibition of ATM, ATR, and RAD51 suppressed the formation of I-PpoI-induced PML-NDS.
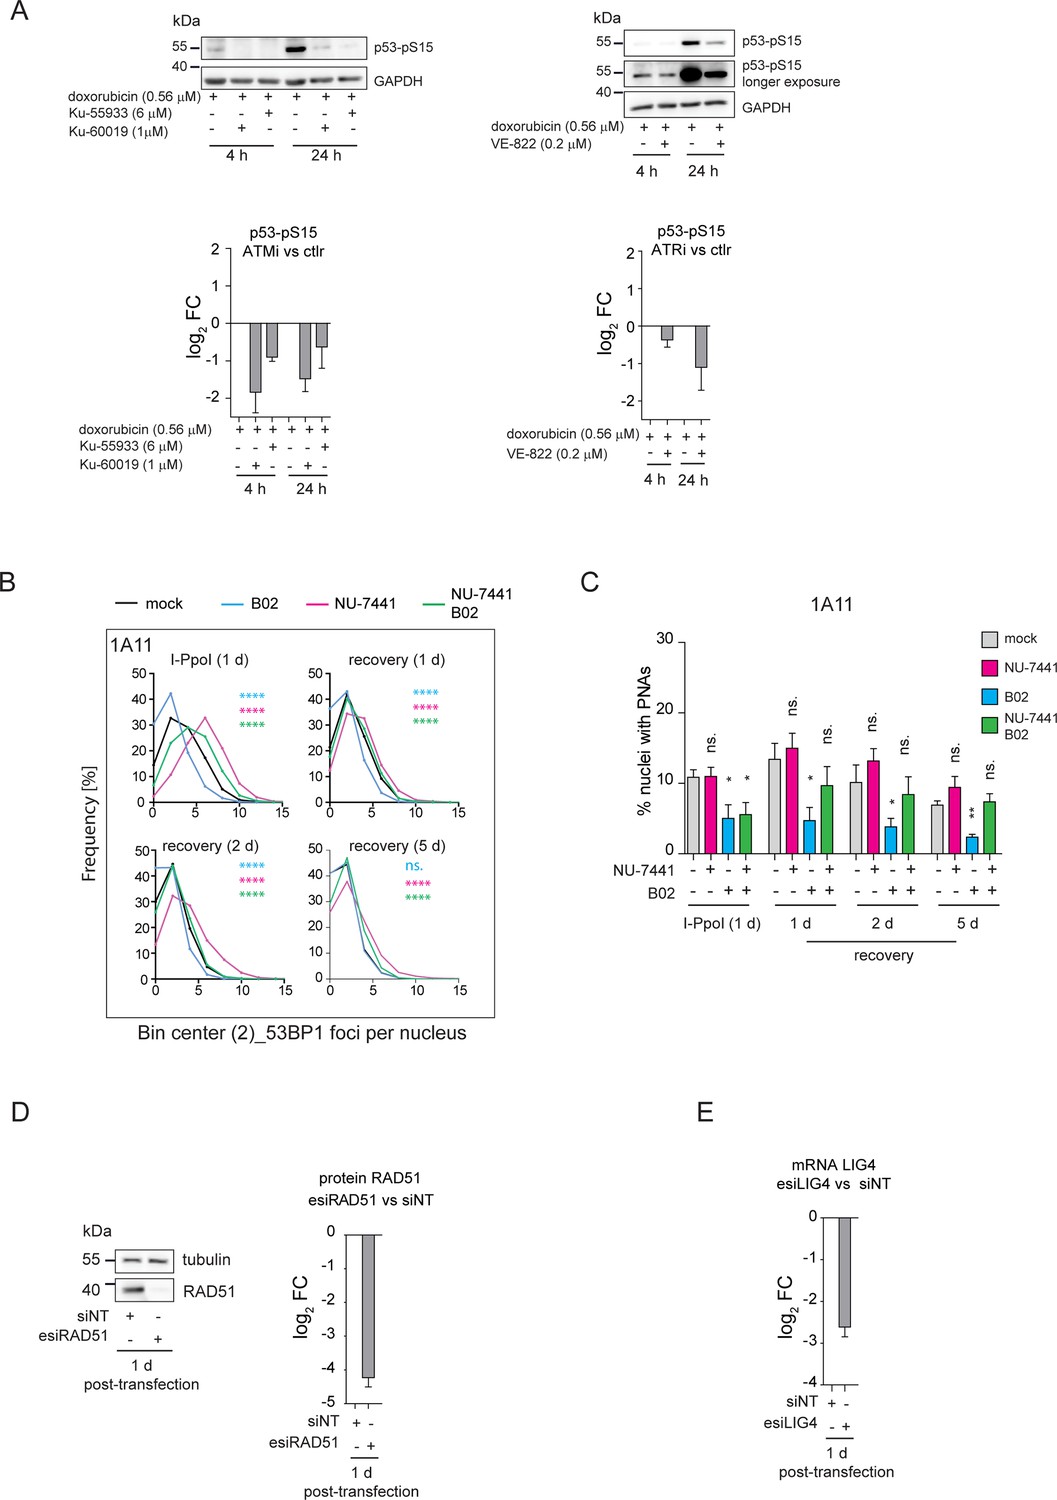
(A) The efficiency of used concentrations of ATM and ATR inhibitors was assessed by analyzing the level of the serine 15 phosphorylated form of p53 (pS15-p53) by western blotting in RPE-1hTERT after doxorubicin treatment (0.56 µM). The inhibitors were added 1 hr before doxorubicin. The quantification of the obtained signals is shown as log2 of fold change (FC) between the ATM/ATR inhibition and control as a means from three biological replicates. (B) The I-PpoI was activated for 24 hr in RPE-1hTERT-I-PpoI (clone 1A11). The number of 53BP1 (a marker of DSB) was assessed by indirect IF and ScanR analysis software after 24-hr-long activation of I-PpoI and during the recovery phase. The B02 and NU-7441 were added simultaneously with the activation of I-PpoI to restrict RAD51 filamentation or DNA PK. The data from three independent biological replicates were pooled together and represented as histograms showing the frequency of nuclei (%) with the same number of 53BP1 foci. The bin center used for analysis was 2. (C) The number of nuclei with PNAs upon the conditions described in (B) was obtained by detection of PML using indirect IF and ScanR. The quantification was done manually by the evaluation of PML localization in more than 200 nuclei. (D) The efficiency of RAD51 knockdown was assessed 1 day post-transfection with esiRAD51 by analyzing the level of RAD51 protein by western blotting in RPE-1hTERT cells. The quantification of the obtained signals is shown as log2 of FC between the esiRAD51 and pool of non-targeting siRNAs. Means from three biological replicates are shown. (E) The efficiency of LIG4 knockdown was assessed 1 day transfection with esiLIG4 by analyzing the level of LIG4 mRNA by RT qPCR. The quantification of the obtained signals is shown as log2 of FC between the esiLIG4 and pool of non-targeting siRNAs. Means from three biological replicates are shown. Results are presented as a mean ± SEM. A paired (C) and unpaired (B) two-tailed t-test were used for statistical evaluation. Asterisks indicate the following: ****p<0.0001, ***p<0.001, **p<0.01, *p<0.05.
-
Figure 5—figure supplement 1—source data 1
RAW membranes for A and D.
- https://cdn.elifesciences.org/articles/91304/elife-91304-fig5-figsupp1-data1-v1.zip
-
Figure 5—figure supplement 1—source data 2
Uncropped and labeled membranes for A and D.
- https://cdn.elifesciences.org/articles/91304/elife-91304-fig5-figsupp1-data2-v1.zip
-
Figure 5—figure supplement 1—source data 3
Numerical data for A, B, C, D, and E.
- https://cdn.elifesciences.org/articles/91304/elife-91304-fig5-figsupp1-data3-v1.xlsx
Figure 5—figure supplement 2
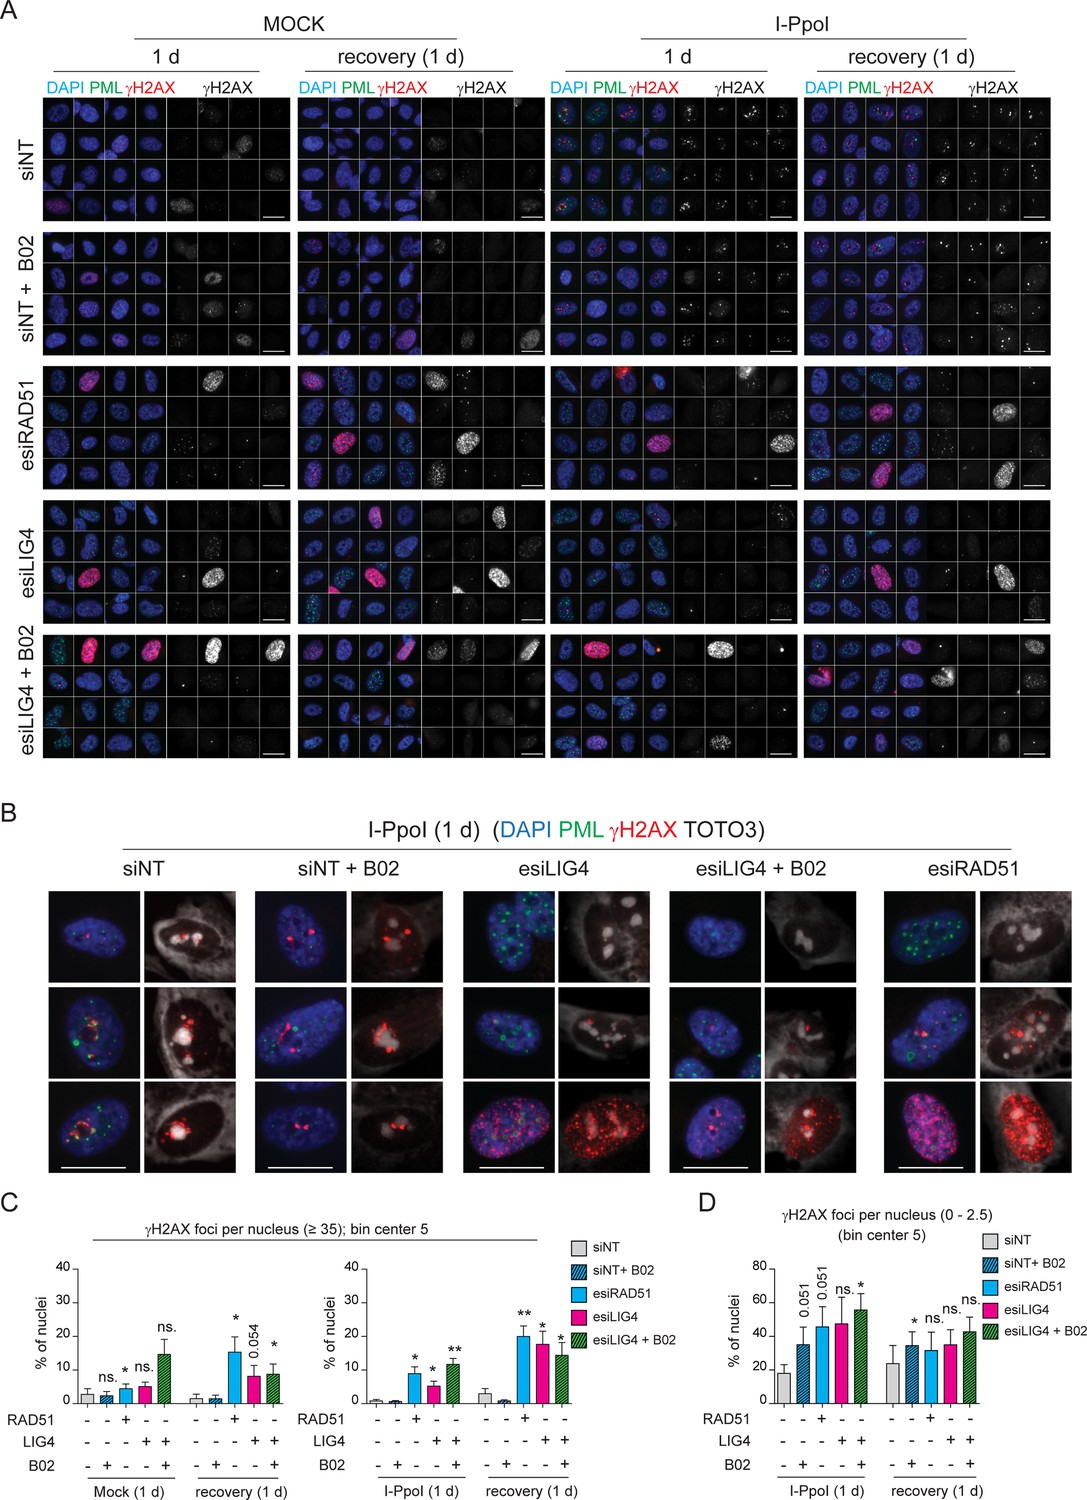
RAD51 suppressed the formation of I-PpoI-induced PML-NDS.
(A) RPE-1hTERT-I-PpoI (clone 1H4) were transfected by interfering RNA upon seeding. After 24 hr, the I-PpoI was activated by doxycycline and Shield for another 24 hr. Then, the medium was changed, and cells recovered from rDNA damage for 0 and 1 day. The control cells were treated with corresponding concentration of DMSO (mock) . The γH2AX (a marker of DSBs; red) and PML (green) were detected by indirect IF and ScanR. The nuclei were stained with DAPI (blue). The galleries of representative nuclei are shown. (B) RPE-1hTERT-I-PpoI (clone 1H4) were treated and analyzed as described in (A). The γH2AX (red) and PML (green) localization is shown after I-PpoI activation combined with KD of RAD51, LIG4, or B02. The nuclei and nucleoli were stained with DAPI (blue) and TOTO-3 (white), respectively. (C and D) RPE-1hTERT-I-PpoI (clone 1H4) were treated and analyzed as described in (A). The γH2AX count was obtained by ScanR analysis software. Then, the distribution analysis (%) was done in GraphPadPrism (see Figure 5G). The mean from four biological replicates shows the percentage of cells with γH2AX count higher than 35 foci (C) or between 0 and 2.5 foci (D). Scale bars: 20 μm. Results are presented as a mean ± SEM. A paired two-tailed t-test was used for statistical evaluation. Asterisks indicate the following: ****p<0.0001, ***p<0.001, **p<0.01, *p<0.05.
-
Figure 5—figure supplement 2—source data 1
Numerical data for C and D.
- https://cdn.elifesciences.org/articles/91304/elife-91304-fig5-figsupp2-data1-v1.xlsx
Figure 6 with 1 supplement
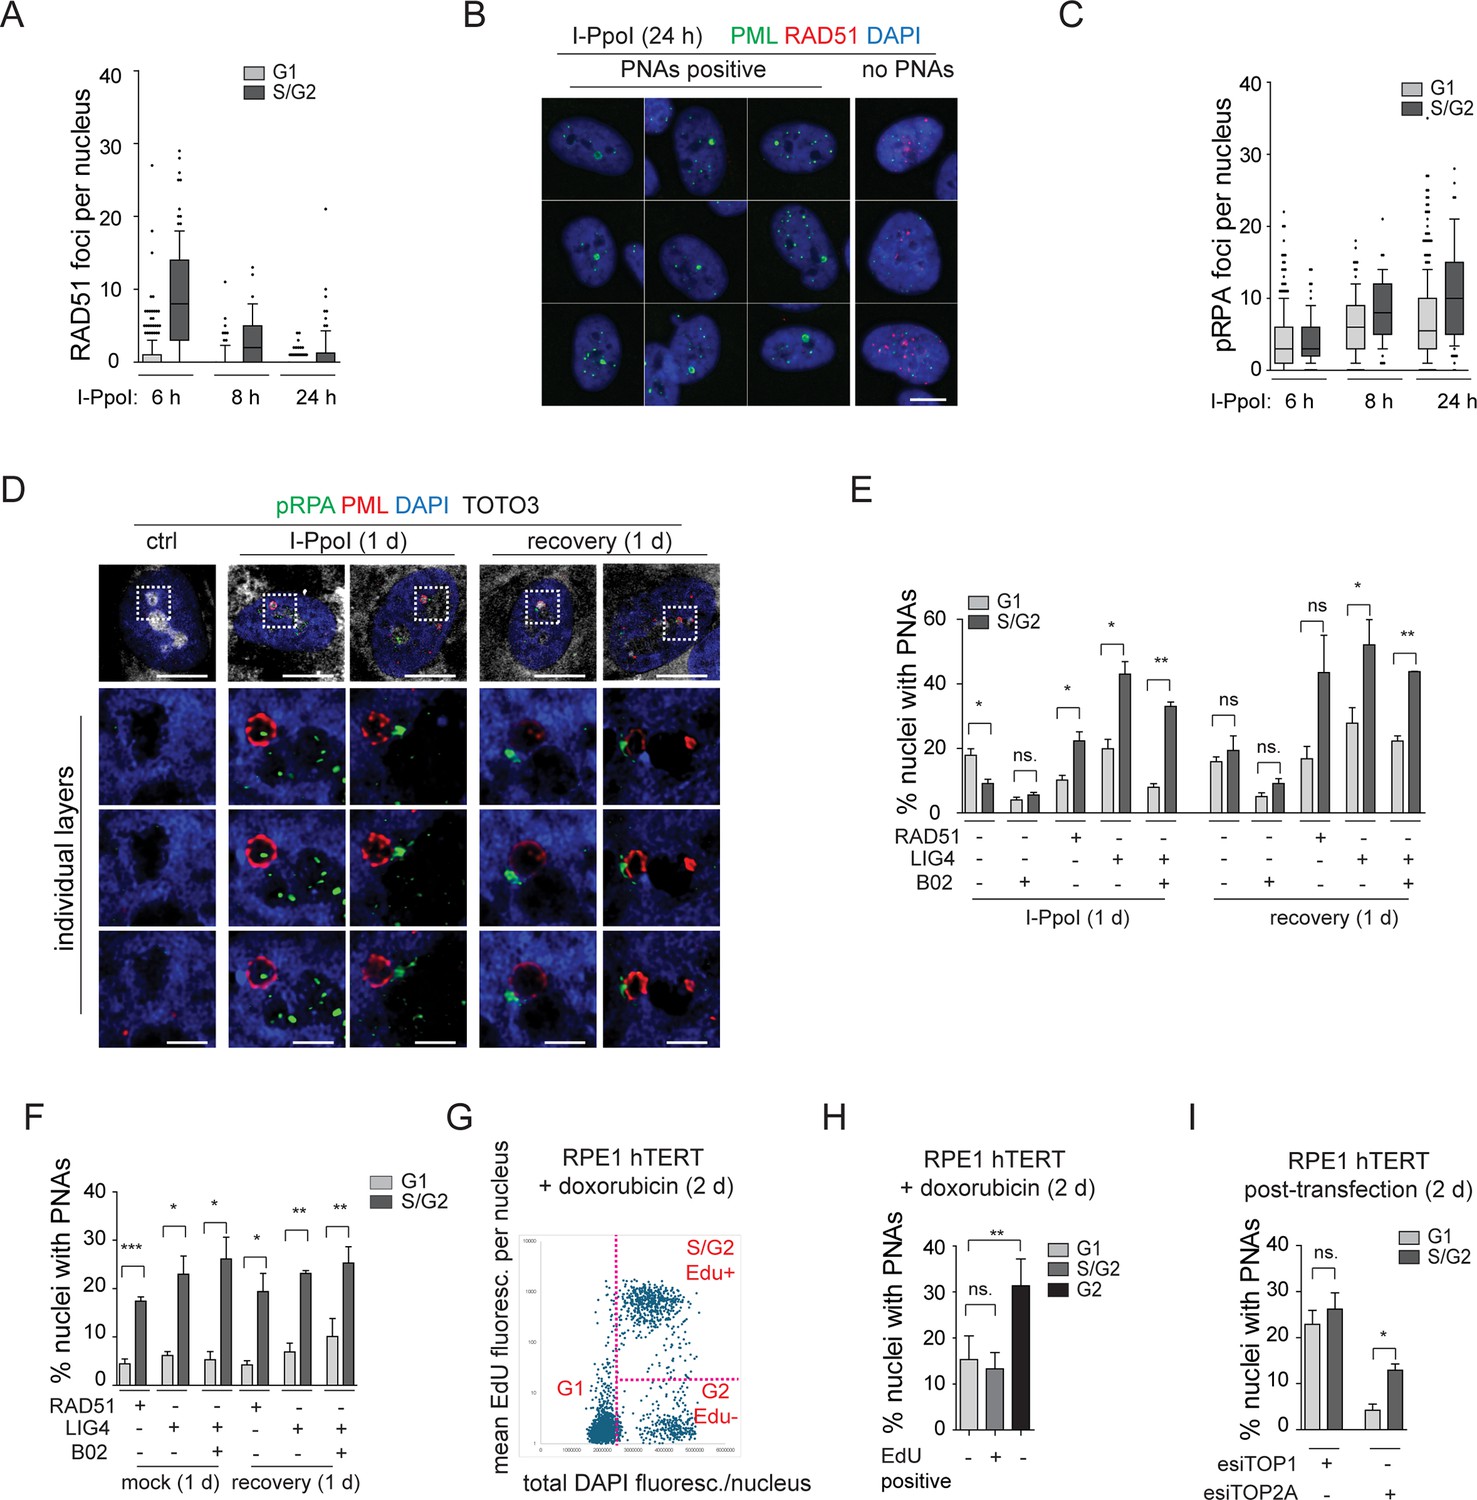
The resected DNA is present in both G1 and S/G2 cells and co-localizes with I-PpoI-induced PNAs.
(A) The I-PpoI expression was activated 24 hr after RPE-1hTERT-I-PpoI (1H4) seeding. The cells were harvested 6, 8, and 24 hr after activation of I-PpoI expression, and RAD51 and PML were detected by indirect IF. The nuclei were stained with DAPI. The number of RAD51 foci and total DAPI fluorescence in individual nuclei were evaluated using the ScanR software. The G1 and S/G2 cells were estimated according to the total DAPI fluorescence. The count of RAD51 per nucleus is shown for G1 and S/G2 cells using the whiskers plot (box shows 10–90 percentiles; the black line is median). (B) The cells harvested after 24 hr of I-PpoI activation were stained for PML (green) RAD51 (red) and nucleus (blue). The characteristic nuclei with PNAs are shown. (C) The experimental setup described in (A) was used, but RPA2pS33 and PML were detected by indirect IF and ScanR. The number of RPA2pS33 foci and total DAPI fluorescence in individual nuclei were evaluated using the ScanR software. The G1 and S/G2 cells were estimated according to the total DAPI fluorescence. The count of RPA2pS33 per nucleus is shown for G1 and S/G2 cells using the whiskers plot (box shows 10–90 percentiles; the black line is median). (D) PML (red) and resected DNA (RPA2pS33; green) were detected after 24 hr long activation of I-PpoI and after 1 day-long recovery using indirect IF and confocal microscopy (STELLARIS). The whole nucleus and three separate layers of nucleolus are shown. Nuclei were stained by DAPI (blue) and nucleoli by TOTO3 (white). Scale bar, 10 µm (nucleus); 2 µm (nucleolus). (E) RPE-1hTERT-I-PpoI (1H4) were transfected by interfering RNA upon seeding. After 24 hr, the I-PpoI was activated by doxycycline and Shield for another 24 hr. Then, the medium was changed, and cells recovered for 1 day. The PML was detected by indirect IF and ScanR. ScanR analysis software divided the cells according to total DAPI fluorescence as a G1 and S/G2. Then, the gallery of nuclei was made for each group, and the number of nuclei with PNAs was manually calculated. The percentage of nuclei with PNAs presented in G1 and S/G2 is shown as a column graph. (F) The experimental setup and evaluation were like those in (E). Only the I-PpoI was not activated; instead, DMSO was added. (G) RPE-1hTERT cells were treated with 0.75 µM doxorubicin and EdU for 48 hr. Then, the PML was detected by indirect IF and EdU by ClickIt chemistry. ScanR analysis software divided the cells according to total DAPI fluorescence and EdU fluorescence into three groups: G1 (Edu-), S/G2 (Edu+), and G2 (EdU-). The scatter plot shows the total DAPI fluorescence and EdU mean fluorescence of individual nuclei and gates for the mentioned three groups. (H) Galleries of nuclei from gates shown in (G) were made, and the number of nuclei with PNAs was manually calculated. The percentage of nuclei with PNAs presented in G1(EdU-), S/G2(EdU+), and G2(EdU-) is shown as a column graph. (I) RPE-1hTERTwere transfected by interfering RNA targeting TOP2A and TOP1 upon seeding. After 2 days, PML was detected by indirect IF and ScanR. ScanR analysis software divided the cells according to total DAPI fluorescence as a G1 and S/G2. Then, the galleries of nuclei were made, and the number of nuclei with PNAs was manually calculated. The percentage of nuclei with PNAs presented in G1 and S/G2 is shown as a column graph. Scale bar, 10 µm (nuclei in B, D); 2 µm (nucleoli in D). Results are presented as a mean ± SEM obtained from at least three biological replicates. A paired two-tailed t-test was used for statistical evaluation. Asterisks indicate the following: ****p<0.0001, ***p<0.001, **p<0.01, *p<0.05.
-
Figure 6—source data 1
Numerical data for A, C, E, F, G, H, and I.
- https://cdn.elifesciences.org/articles/91304/elife-91304-fig6-data1-v1.xlsx
Figure 6—figure supplement 1
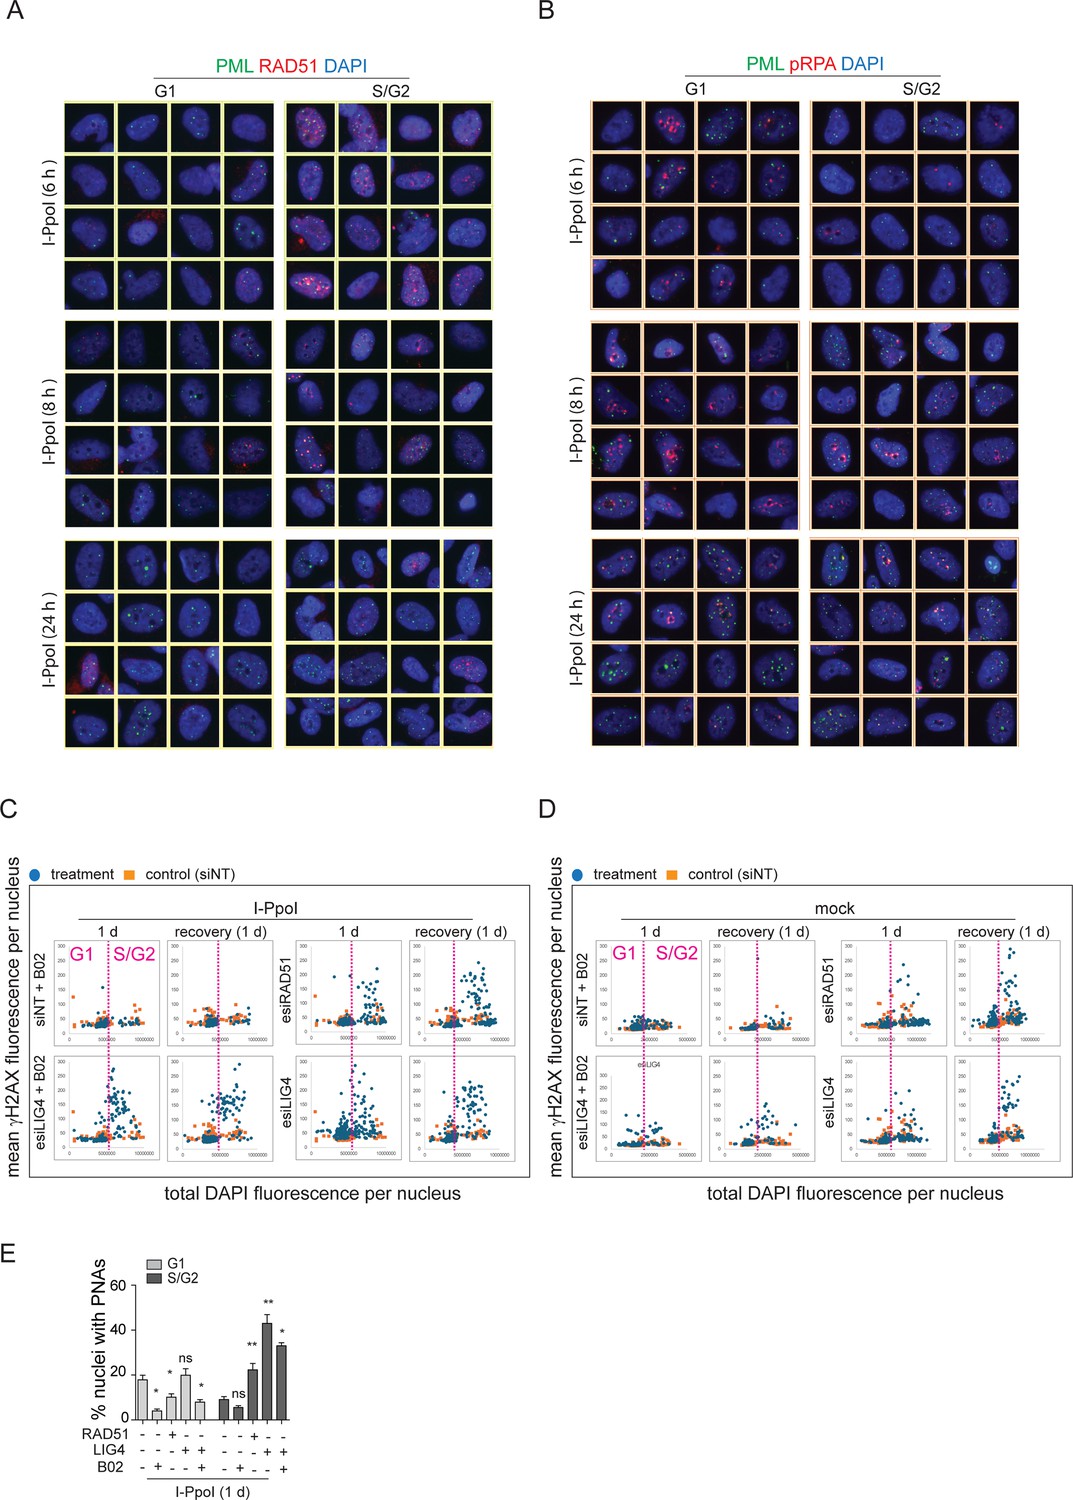
The resected DNA is present in G1 and S/G2 cells and co-localizes with I-PpoI-induced PNAs.
(A) The I-PpoI was activated 24 hr after RPE-1hTERT-I-PpoI (1H4) seeding using doxycycline and Shield. The cells were harvested 6, 8, and 24 hr after this, and RAD51(red) and PML (green) were detected by indirect IF and ScanR. The DNA was stained by DAPI (blue). The G1 and S/G2 cells were estimated according to the total DAPI fluorescence. The galleries of nuclei made from estimated gates (G1; S/G2) are shown. (B) The same experimental setup as described in (A) was used, but RPA2pS33 (red) and PML (green) were detected by indirect IF and ScanR. The DNA was stained by DAPI (blue). The G1 and S/G2 cells were estimated according to the total DAPI fluorescence. The galleries of nuclei made from estimated gates (G1; S/G2) are shown. (C and D) RPE-1hTERT-I-PpoI (1H4) were transfected by interfering RNA upon seeding. After 24 hr, the I-PpoI was activated by doxycycline, and Shield (C) or DMSO was added (D) for another 24 hr. Then, the medium was changed, and cells recovered for 0 or 1 day. The PML and γH2AX were detected by indirect IF and ScanR. The scatter plots show the total DAPI fluorescence and mean γH2AX fluorescence estimated for each nucleus. The dashed red lines indicated the division to G1 and S/G2 subpopulations. (E) The columns indicate the percentage of nuclei with PNAs present in the G1 or S/G2 subpopulation after treatment described in (C). Results are presented as a mean ± SEM obtained from at least three biological replicates. A paired two-tailed t-test was used for statistical evaluation. Asterisks indicate the following: ****p<0.0001, ***p<0.001, **p<0.01, *p<0.05.
-
Figure 6—figure supplement 1—source data 1
Numerical data for C and D.
- https://cdn.elifesciences.org/articles/91304/elife-91304-fig6-figsupp1-data1-v1.xlsx
Figure 7
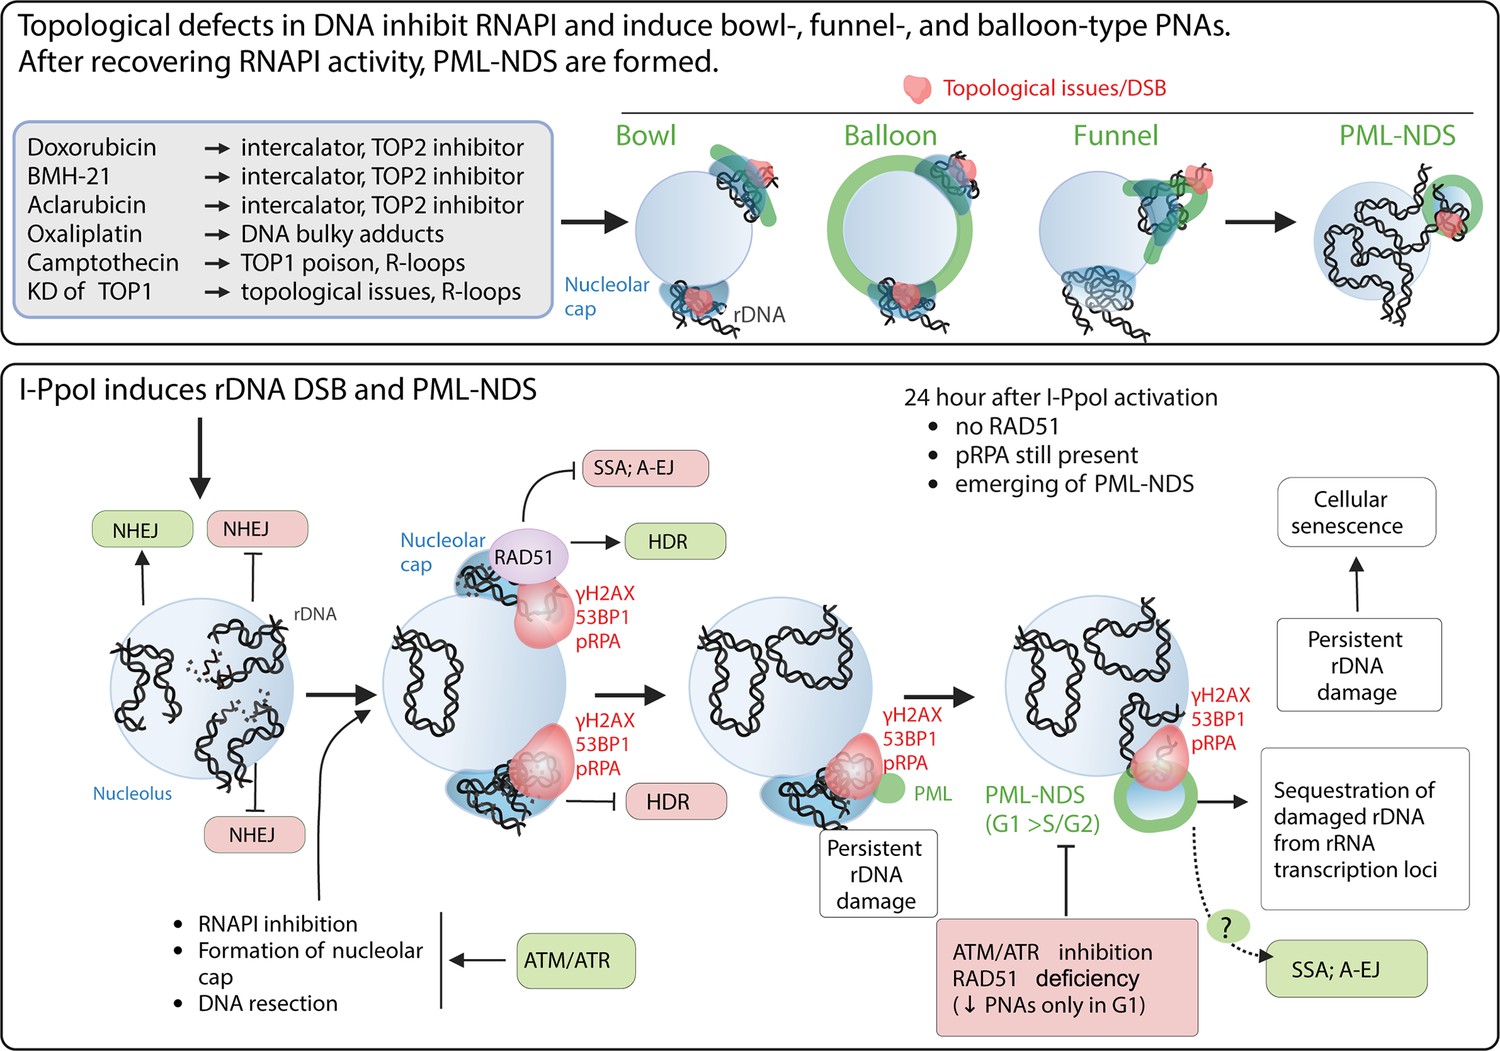
The schematic presentation of signals triggering the development of PNAs.
The upper panel represents the most potent PNA inductors. The common characteristic of these treatments is the ability to alter chromatin topology and simultaneously cause the ‘long-term inhibition’ of RNAPI (the inhibition was present even after 2 d long treatment). After these treatments, the bowl-, funnel-, and balloon-like PNA types interacting with nucleolar caps are formed. After recovery of RNAPI, the persistent rDNA damage is sequestrated, resulting in the formation of PML-NDS. The lower panel presents the signals affecting the PNAs formation after I-PpoI-induced rDNA DSBs. Such rDNA DSBs are predominantly repaired by NHEJ in the nucleolar interior (Warmerdam et al., 2016; Harding et al., 2015). Unrepaired rDNA lesions signal for ATM/ATR-dependent inactivation of RNA polymerase I and the translocation of damaged rDNA to the nucleolar periphery, forming a nucleolar cap (Korsholm et al., 2019; Harding et al., 2015). The damaged rDNA in the nucleolar cap is resected, suggesting repair by HDR (Warmerdam et al., 2016; van Sluis and McStay, 2015). Our data indicate that I-PpoI-induced PNAs (PML-NDS) form as a late response to rDNA damage, occurring when RAD51 foci in the nucleolar periphery decline. Markers of DSBs (γH2AX, 53BP1) and DNA resection (pRPA) still co-localize with PNAs, supporting the hypothesis that persistent rDNA DSBs are incompatible with NHEJ or HDR signal for PNA development. The exact functions of PNAs are unknown, but we hypothesize that they isolate damaged rDNA from active pre-rRNA transcription foci. We cannot exclude a link to alternative repair pathways for persistent rDNA damage. Notably, I-PpoI-induced PML-NDS are mainly present in the G1 cell cycle phase. Inhibiting ATM/ATR, which is essential for RNAPI inhibition, nucleolar cap establishment, and HDR, prevents their formation. RAD51 ablation negatively affects the occurrence of I-PpoI-induced PNAs. Importantly, the PNAs decline was present only in G1. The mechanisms by which RAD51 affects PNA establishment are unclear, but RAD51 promotes HR and inhibits alternative pathways such as SSA and A-EJ or regulates DNA end processing. The scheme was created using BioRender.com and published using a CC BY-NC-ND license with permission (Agreement number: GD279KWD6V).
Author response image 1

A scatter plot shows the changes in PNA diameters during the recovery phase from a 24-hour-long expression of IPpoI.
Author response image 2

The representative images nucleoli show the localization of 53BP1 (red; a marker of DNA DSB), PML (green, a marker of PML-NB or PNAs), rDNA (blue), and DJ (white; a marker of the acrocentric chromosome) after doxorubicin treatment (2 days) or in the recovery phase (1 and 4 days).
The merge of all channels is shown together with the presentation of individual images in greyscale. Scale, 5 µm.
Author response image 3

This Figure shows data published in Imrichova et al. (doi: 10.18632/aging.102248).
PML IV-EGFP was ectopically expressed in RPE-1hTERT cells. The localization of PML was followed using live cell imaging. (A) The bowl (in this work named cap) originates from the accumulation of diffuse PML. (B) The transition between bowl (named cap), funnel (named fork), and balloon (named circle). (C, D) PML IV-EGFP (green) and B23-RFP (red) were ectopically expressed in RPE-1hTERT cells. The localization of both proteins was followed by live cell imaging. (C) The formation of PML-NDS from the funnel is shown; (D) The entire PNA cycle is shown. PML-bowl formed on the border of the nucleolus, then transformed into the PML-funnel, and finally into PML-NDS.
Additional files
-
Supplementary file 1
The compounds/treatments tested for the ability to induce PML-nucleolar association.
The applied concentration and toxicity specification are shown.
- https://cdn.elifesciences.org/articles/91304/elife-91304-supp1-v1.docx
-
Supplementary file 2
The antibodies, including description, source, and dilution, are shown.
- https://cdn.elifesciences.org/articles/91304/elife-91304-supp2-v1.docx
-
Supplementary file 3
The names of plasmids and BACs, as well as descriptions and sources, are shown.
- https://cdn.elifesciences.org/articles/91304/elife-91304-supp3-v1.docx
-
Supplementary file 4
The sequence of primers, as well as their application, are shown.
- https://cdn.elifesciences.org/articles/91304/elife-91304-supp4-v1.docx
-
MDAR checklist
- https://cdn.elifesciences.org/articles/91304/elife-91304-mdarchecklist1-v1.docx
Download links
A two-part list of links to download the article, or parts of the article, in various formats.
Downloads (link to download the article as PDF)
Open citations (links to open the citations from this article in various online reference manager services)
Cite this article (links to download the citations from this article in formats compatible with various reference manager tools)
Topological stress triggers persistent DNA lesions in ribosomal DNA with ensuing formation of PML-nucleolar compartment
eLife 12:RP91304.
https://doi.org/10.7554/eLife.91304.3


