Homeostatic control of deep sleep and molecular correlates of sleep pressure in Drosophila
- The Advanced Science Research Center, The City University of New York; The Graduate Center at the City University of New York, United States
- VIB-KU Leuven Center for Brain & Disease Research, Belgium
Figures
Figure 1 with 1 supplement

Homeostatic sleep rebound is driven by the frequency of mechanical agitation when the amount of sleep deprivation is held constant.
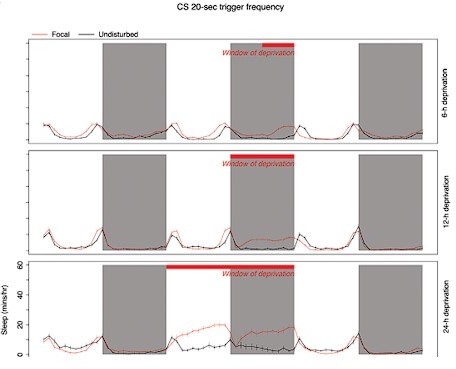
(A–B) Six hours of sleep deprivation was induced with two different mechanical trigger frequencies using vortexers: 2 s randomized shaking every 20 s or 220 s (each producing similar levels of sleep deprivation). (C) A significant increase in sleep was observed for the 20 s trigger, but the 220 s trigger failed to show such increases when compared with undisturbed controls (Kruskal-Wallis critical value = 40.43, df = 2, p=1.66 × 10⁻⁹, followed by Bonferroni corrections for pairwise comparisons). (D–E) Time course of 12 hours of nighttime sleep deprivation using two trigger frequencies (20 s and 220 s) results in nighttime sleep loss. (F) Sleep rebound using 20 s trigger produced significant increases compared to controls, but we did not observe any significant changes when the 220 s trigger was used (Kruskal-Wallis critical value = 24.59, df = 2, p=4.5 × 10⁻⁶, followed by Bonferroni corrections for pairwise comparisons). (G–H) We increased the vortexing-induced sleep deprivation to 24 hours using 20 s and 220 s trigger frequencies and calculated sleep rebound in the 24 hours post-deprivation window represented in the time course. (I) Once again, the 20 s trigger produced significant sleep rebound compared to control flies whereas the 220 s trigger-induced deprivation did not, even though both trigger frequencies effectively deprived sleep (Kruskal-Wallis critical value = 23.63, df = 2, p=7.41 × 10⁻⁶, followed by Bonferroni corrections for pairwise comparisons). (J) We compared the amount of sleep rebound during the first recovery day caused by different durations of deprivation using 20 s (left) and 220 s (right) inactivity triggers and found significant rebound only for the 20 s trigger. However, despite producing significantly different amounts of sleep loss, we observed no increases in rebound with the 220 s trigger. Surprisingly, the 6 hr deprivation condition, which produced the least amount of sleep loss displayed significantly higher rebound sleep compared to the 12 hr and 24 hr deprivation conditions (20 s trigger: Kruskal-Wallis critical value = 13.71, df = 2, p=0.0011, followed by Bonferroni corrections for pairwise comparisons; 220 s trigger: Kruskal-Wallis critical value = 1.96, df = 2, p=0.37, followed by Bonferroni corrections for pairwise comparisons). (K) We included an intermediate trigger frequency of 120 s for sleep deprivation and found that like the 220 s trigger, it failed to produce statistically significant increases in sleep for the 24 hr post-deprivation analysis (ANOVA F2,250=3.93, p=0.02). (L) Sleep levels observed during the 24 hr following deprivation reveal that flies recover very little of total sleep lost. Previously measured Drosophila (Huber et al., 2004) and human sleep (Stroemel-Scheder and Lautenbacher, 2021) recovery amounts are indicated by dashed lines. 6 hr SD control n=44, sleep-deprived20 s n=62, sleep-deprived220 s n=57; 12 hr SD control n=32, sleep-deprived20 s n=64, sleep-deprived220 s n=64; 24 hr SD control n=64, sleep-deprived20 s n=32, sleep-deprived220 s n=64, sleep-deprived120 s n=64; *<0.05 and NS (not significant).
Figure 1—figure supplement 1

Time courses of ‘active sleep’ – bouts of inactivity that are between 1 and 5 min long – under conditions of 6 (A), 12 (B), and 24 hr (C) sleep deprivation using vortexers at a trigger frequency of 220 s for CS flies.
Plots are means ± SEM. Gray shaded regions indicate the dark phase of the LD cycle. Red shaded regions along the x-axis indicate windows of sleep deprivation.
Figure 2 with 1 supplement
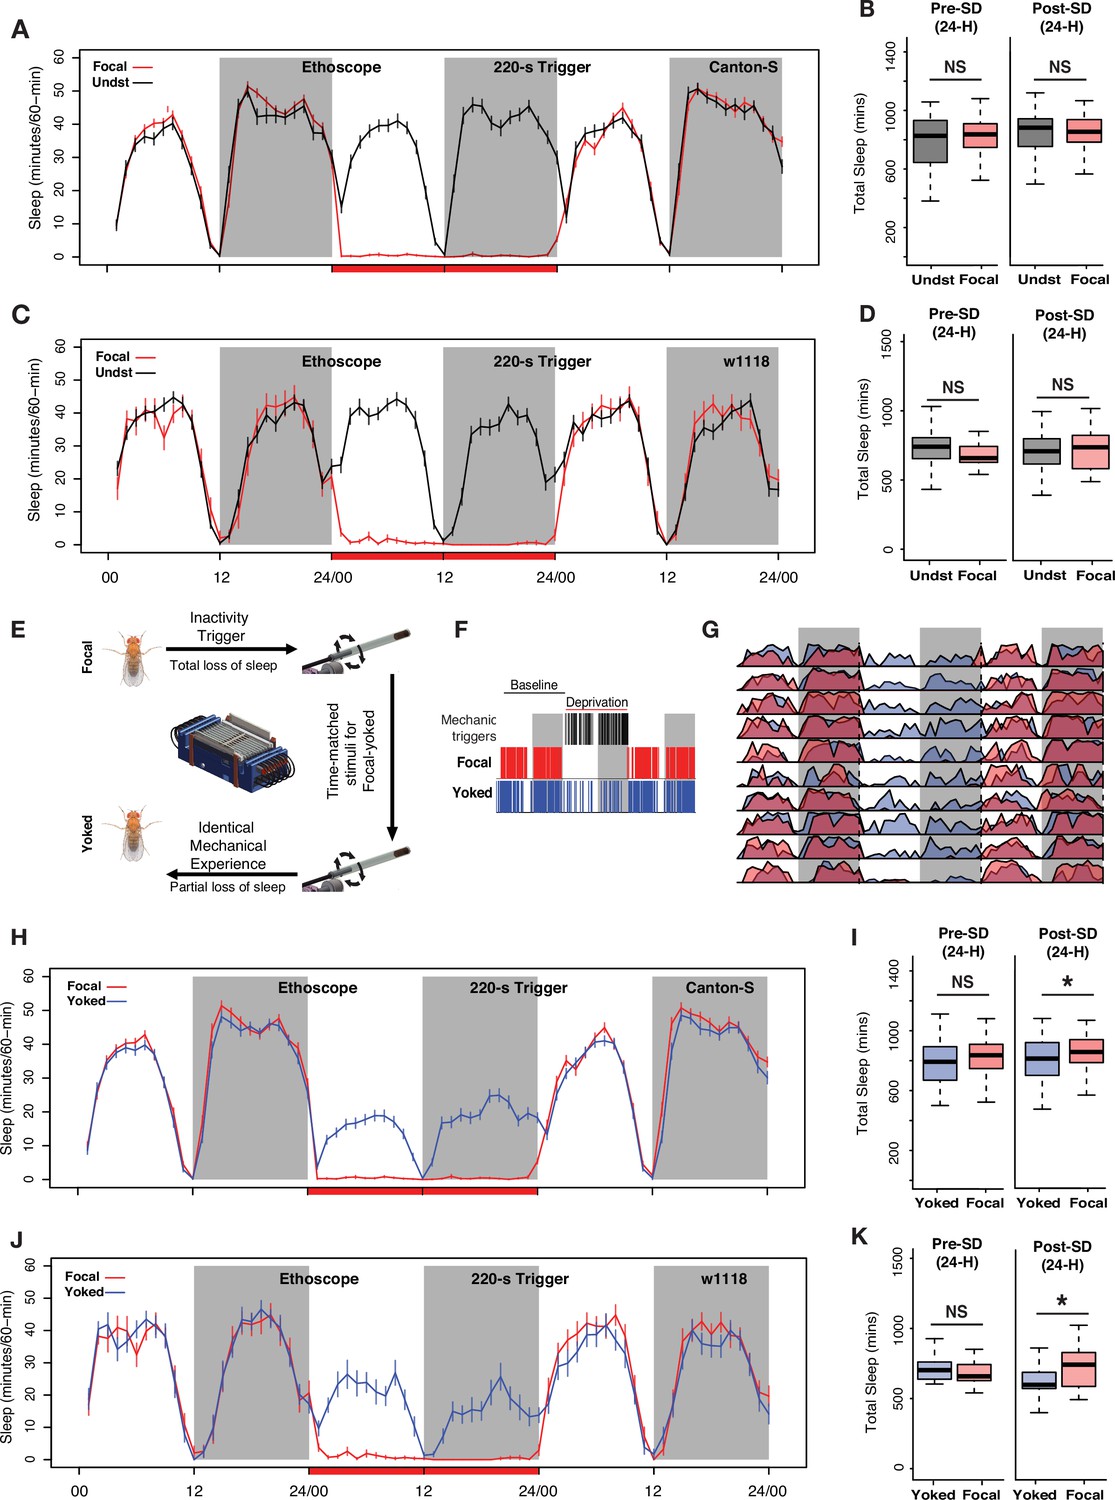
Controlling for mechanical stimulation is necessary to observe 24 hr sleep rebound when low-frequency mechanical triggers are used for deprivation.
(A) Inactivity-dependent sleep deprivation in Ethoscopes with 220 s inactivity triggers fails to generate post-deprivation sleep rebound in wild-type (Canton-S) flies when compared with undisturbed controls. (B) Focal flies do not show differences in total sleep compared to undisturbed flies across the baseline day (Wilcoxon’s W=2523, p=0.54) or across the first post-deprivation day (Wilcoxon’s W=2340, p=0.87). (C) w1118 flies also failed to display post-deprivation sleep rebound compared to undisturbed controls. (D) Comparison of total sleep on the day before and after sleep deprivation for w1118 flies. There were no significant differences in sleep amount on the baseline day (baseline sleep: Wilcoxon’s W=351, p=0.07) or on the post-deprivation day (post-deprivation sleep: Wilcoxon’s W=519, p=0.71). (E) The Ethoscope platform was modified to include ‘yoked controls’ where inactivity-dependent sleep depriving triggers for experimental (focal) flies are matched to their yoked controls, thereby generating paired flies with identical mechanical experience but significantly different amounts of sleep loss. (F) Sleep and mechanical perturbation in an example of a focal/yoked pair of flies: Sleep episodes for one baseline day and the day of deprivation are shown. Sleep episodes are indicated by red (focal) and blue (yoked) hash marks. Black hashmarks represent tube rotations triggered by the focal fly (left panel). (G) Averaged sleep profiles for 10 focal-yoked paired flies on baseline, deprivation, and post-deprivation days show how yoked flies (blue) were able to sleep during the deprivation cycle, whereas focal (red) flies lost all sleep. (H) Average traces of focal and yoked flies 24 hr before, during, and after sleep deprivation for wild-type Canton-S flies. (I) When compared to yoked flies that have undergone same levels of mechanical perturbation, focal flies increased sleep after 24 hr deprivation (Wilcoxon’s W=4074.5, p=0.01) while not showing any baseline differences on the day before deprivation (Wilcoxon’s W=3829, p=0.12). (J) To confirm reproducibility of yoking we used the w1118 line, a common genetic background strain, to replicate the sleep rebound finding observed for Canton-S. (K) Compared to yoked flies that have undergone same levels of mechanical perturbation, focal flies show increased sleep following 24 hr deprivation (post-deprivation sleep: Wilcoxon’s W=277, p=0.037) while not showing any baseline differences on the day before deprivation (baseline sleep: Wilcoxon’s W=176, p=0.53). For Canton-S, n=82 each for focal and yoked categories, and n=58 for unperturbed controls. For w1118, n=20 for focal and yoked categories, and n=49 for unperturbed controls *<0.05 and NS (not significant).
Figure 2—figure supplement 1

Mechanical perturbation causes long term locomotor effects.
(A) Activity time courses of undisturbed and sleep-deprived flies across the 24 hr following mechanical deprivation. During ZT12–24 on post SD day 1, focal flies display elevated nighttime activity at times corresponding to the normal period of consolidated sleep. (B) The activity of focal flies between ZT12–24 was significantly higher than that of undisturbed controls (Wilcoxon’s W=2902, p=0.009). (C) Activity time course of focal and yoked flies during the same post-deprivation window (24 hr). (D) Activity of focal and yoked flies during ZT12–24 were not significantly different from each other (Wilcoxon’s W=2902, p=0.06). n=82 each for focal and yoked categories, and n=58 for unperturbed controls.
Figure 3 with 2 supplements
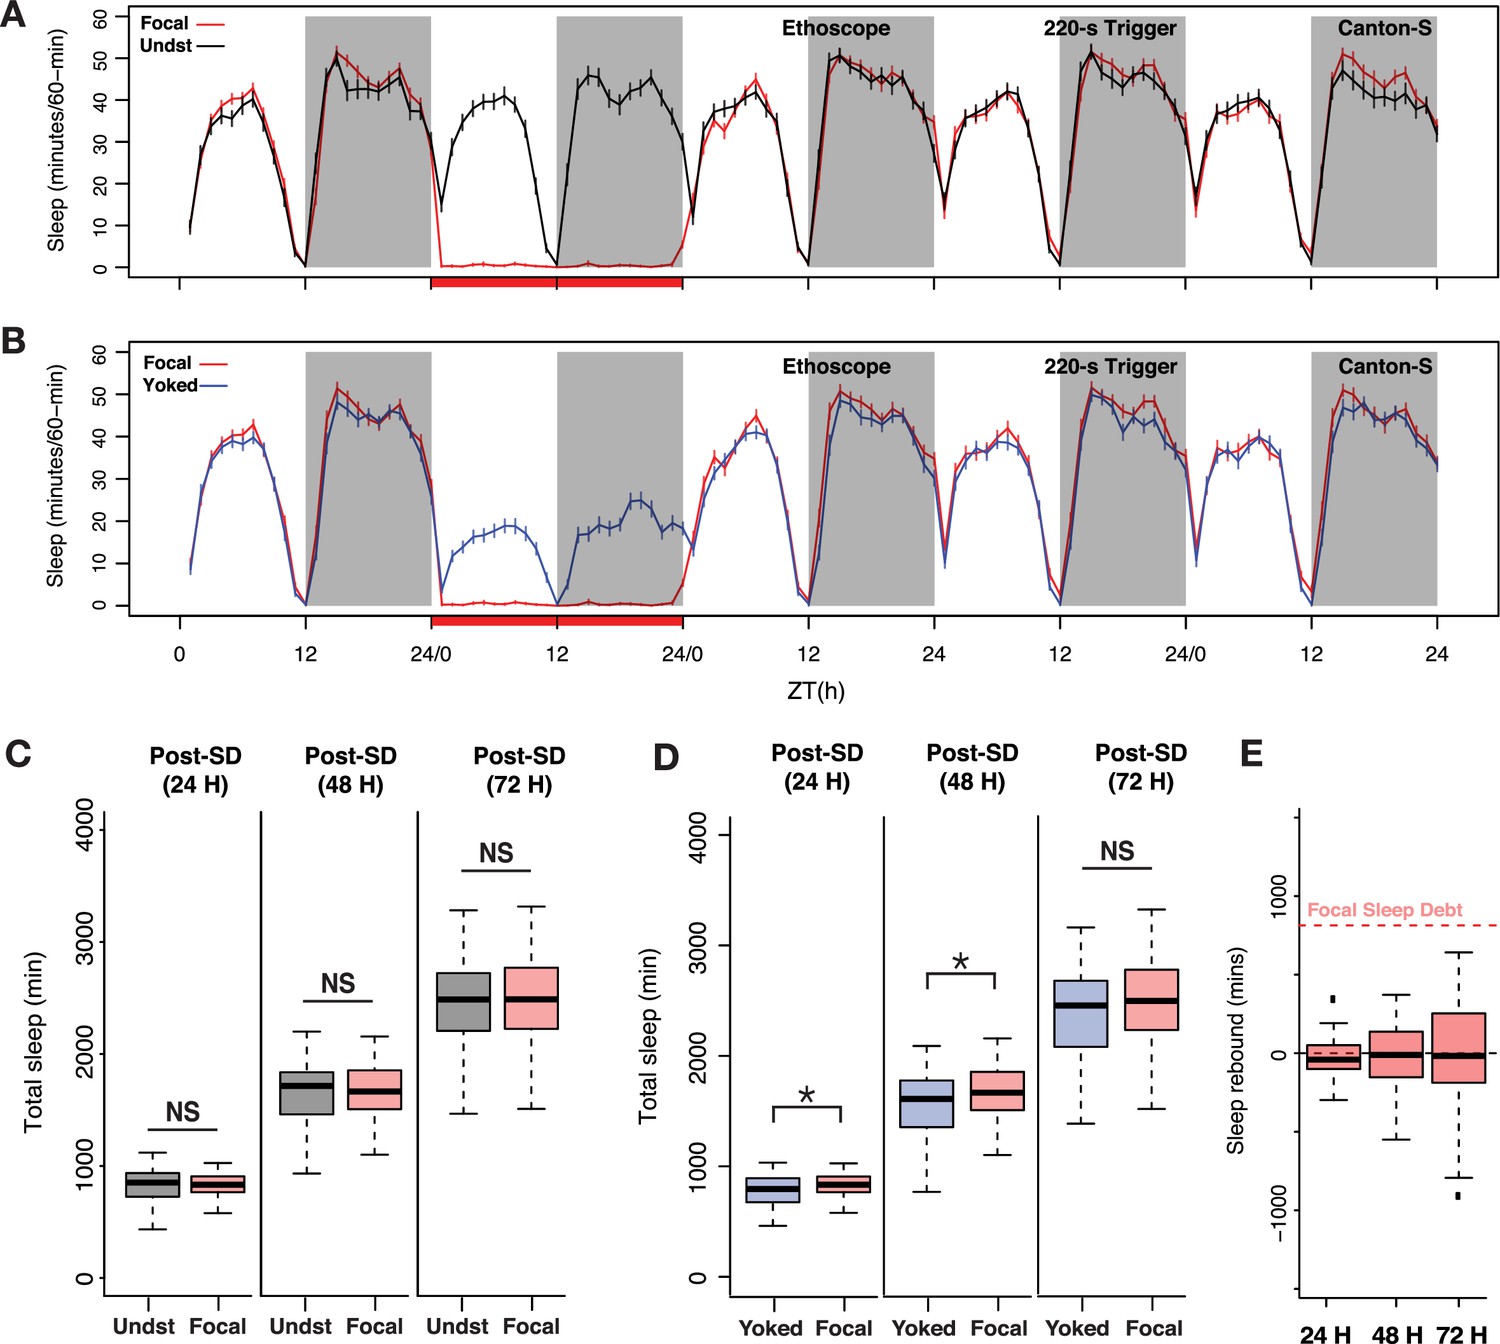
Sleep pressure is discharged as cumulative sleep recovery across multiple cycles.
(A) Average sleep time courses of baseline, deprivation (220 s inactivity-dependent trigger), and 3 post-deprivation days in focal and undisturbed flies, and (B) focal-yoked pairs for the same days shown in A (the time courses visualized here are extended, multi-day analysis of the focal-yoked experiment reported for Canton-S in the previous figure). (C) Focal flies do not show significant differences in cumulative sleep gain across 3 post-deprivation days when compared to undisturbed controls (post 1: Wilcoxon’s W=2323.5, p=0.81; post 2: Wilcoxon’s W=2351, p=0.91; post 3: Wilcoxon’s W=2460.5, p=0.72). (D) When compared to paired yoked controls, focal animals showed significant increases in cumulative sleep across two cycles (post 1: Wilcoxon’s W=4088, p=0.01; post 2: Wilcoxon’s W=4009, p=0.03). In the third post-deprivation day, even though the focal flies showed a tendency to have higher cumulative sleep gain, this was not statistically significant (Wilcoxon’s W=3932, p=0.06). All comparisons are made using the Wilcoxon rank sum test, and n=82 each for focal and yoked categories. *<0.05 and NS (not significant). (E) Compared to total sleep lost, focal flies do not pay back a significant amount of lost sleep, perhaps owing to normalization with unperturbed controls (see Methods). n=82 each for focal and yoked categories, and n=58 for unperturbed controls *<0.05 and NS (not significant).
Figure 3—figure supplement 1

24 hour SD generates multi-cycle post SD sleep pressure signatures.
(A) Time course of conditional Doze probability – p(Doze) – for focal and yoked CS controlled flies across three cycles post sleep deprivation using 220 s trigger frequency. Plotted are means ± SEM. (B) Changes in p(Doze) values compared to baseline. Plotted are means ± SEM. Statistically significant differences between focal and yoked flies were inferred using two-sample, one-tailed t-tests for unequal variances (post 1: day – t161.99=2.64, p=0.005; night – t159.8=1.56, p=0.06; post 2: day – t157.66=0.95, p=0.17; night – t159.83=2.2, p=0.01; post 3: day – t161.41=0.64, p=0.26; night – t161.93=2.7, p=0.004). Gray shaded regions indicate dark phase of the LD cycle, in both panels. *p<0.05, **p<0.01, NS – not significant.
Figure 3—figure supplement 2

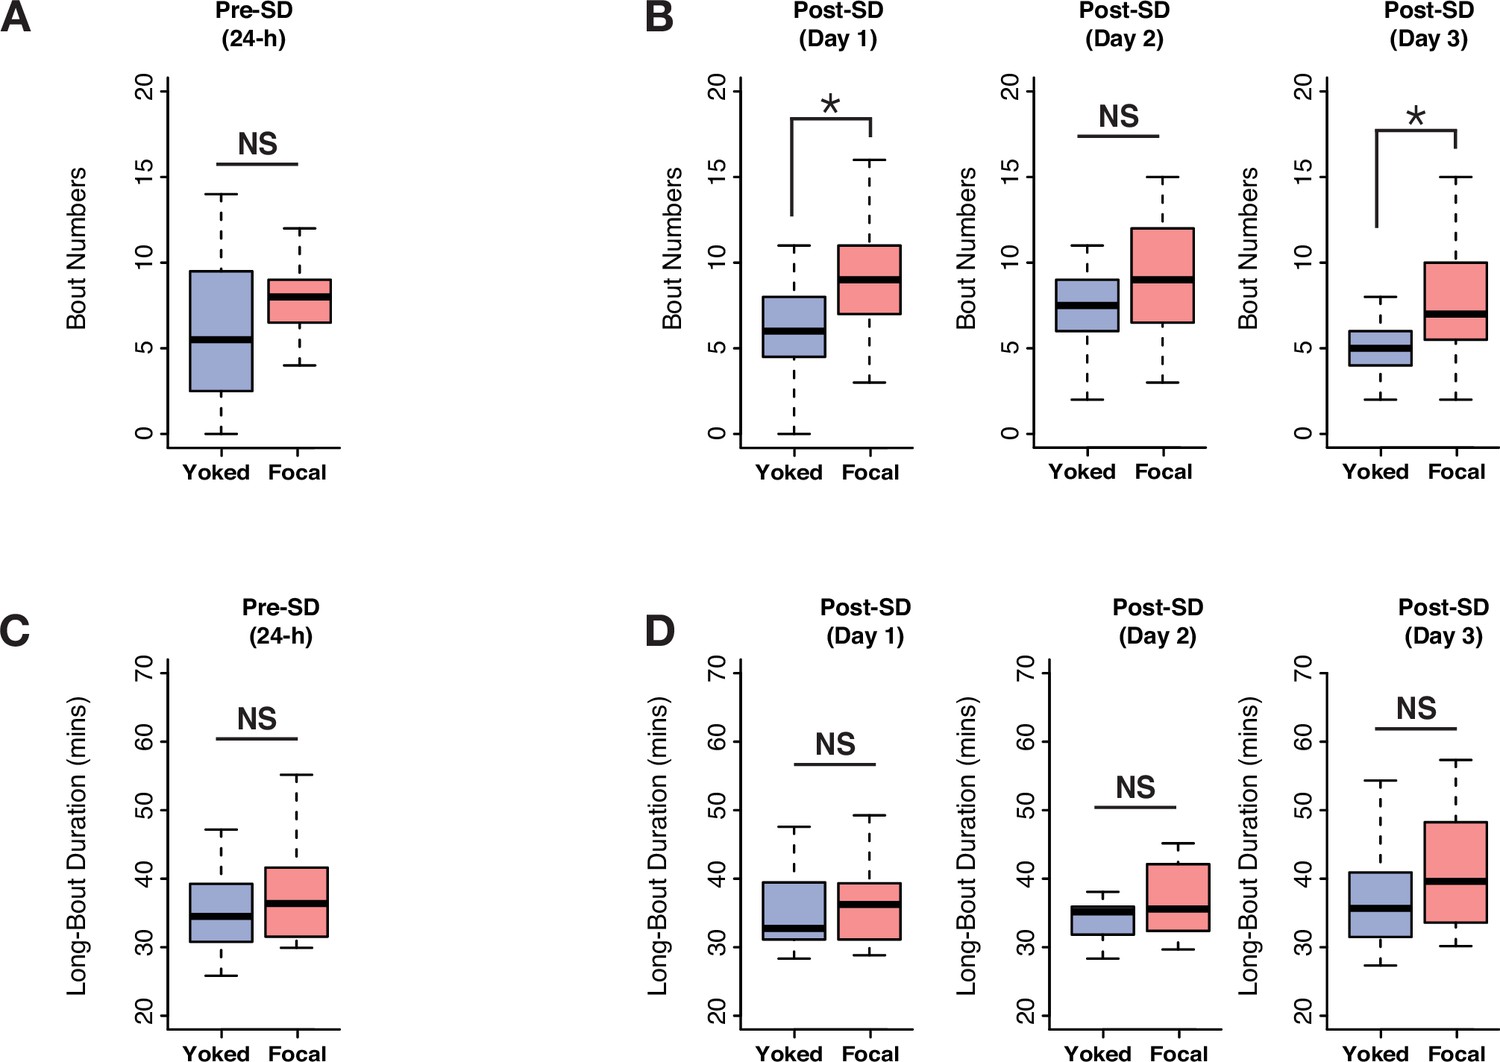
24 hour SD results in altered sleep architecture across multiple cycles.
(A) Comparison of bout numbers for standard sleep between focal and yoked flies in three post-deprivation cycles did not reveal significant differences (post 1: Wilcoxon’s W=3385, p=0.94; post 2: Wilcoxon’s W=2962.5, p=0.18; post 3: Wilcoxon’s W=3273, p=0.77). (B) Comparing bout duration of standard sleep across three post deprivation cycles revealed that focal flies had significantly higher bout durations for the first two recovery cycles (post 1: Wilcoxon’s W=4077, p=0.01; post 2: Wilcoxon’s W=4269, p=0.002; post 3: Wilcoxon’s W=3624, p=0.38). n=82 each for focal and yoked categories. Undisturbed control n=58 *<0.05 and NS (not significant). (C) Pre-deprivation bout numbers (Wilcoxon’s W=3358, p=0.99) and bout durations (Wilcoxon’s W=3705, p=0.25) were not significantly different between focal and yoked pairs. n=82 each for focal and yoked categories, and n=58 for unperturbed controls *<0.05 and NS (not significant).
Figure 4 with 1 supplement
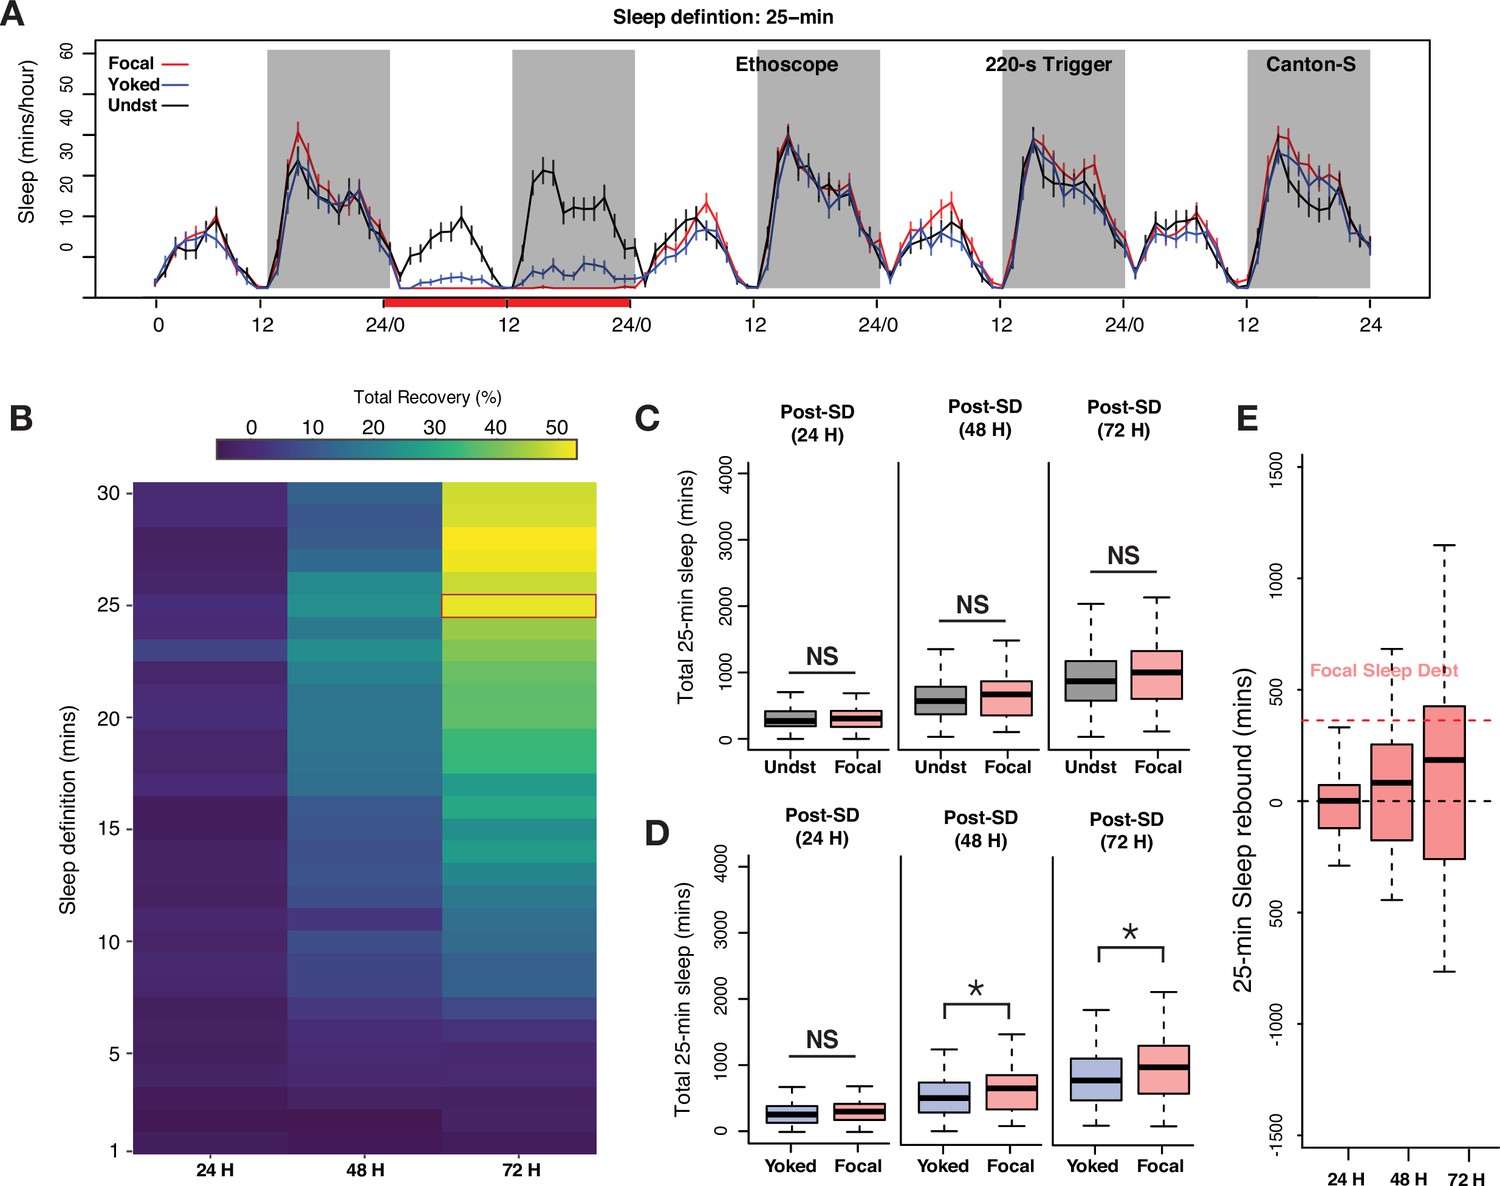
Examination of long-bout sleep reveals a multi-cycle sleep rebound that discharges a significant proportion of lost sleep.
(A) Averaged sleep time-series of long-bout sleep (25 min inactivity criterion) in baseline, deprivation (220 s inactivity-dependent trigger), and three post-deprivation days in focal, yoked, and undisturbed flies. (B) Sleep recovery as a function of sleep definition (minutes of inactivity) visualized as a heatmap. When sleep is defined as progressively longer bouts of inactivity, deprived flies paid back a majority of their sleep debt cumulatively over 3 days as the inactivity criterion approaches 25 min. When either the standard sleep definition (5 min or more of inactivity) or active/short sleep criteria (1–5 min) are used, little to no sleep debt is repaid. (C) In 3 post-deprivation days, focal flies showed trends of increased cumulative sleep recovery in 25 min sleep but were not significantly different from undisturbed controls (post 1: Wilcoxon’s W=2458, p=0.73; post 2: Wilcoxon’s W=2689, p=0.18; post 3: Wilcoxon’s W=2766, p=0.10). (D) Accounting for mechanical stimulation resulted in significant and substantial multi-cycle total sleep increases for focal flies. Interestingly, the first cycle after deprivation did not show significant increases in long-bout sleep in focal flies (post 1: Wilcoxon’s W=3847, p=0.11; post 2: Wilcoxon’s W=3987, p=0.03; post 3: Wilcoxon’s W=4001, p=0.03). (E) Normalized sleep rebound for sleep bouts of 25 min or longer across 3 days shows the discharge of sleep debt accrued during the 24 hr of deprivation. Median recovery was more than 50%, while 25% of flies overshoot total sleep loss, thereby showing hallmarks of homeostatic control. n=82 each for focal and yoked categories, and n=58 for unperturbed controls *<0.05 and NS (not significant).
Figure 4—figure supplement 1
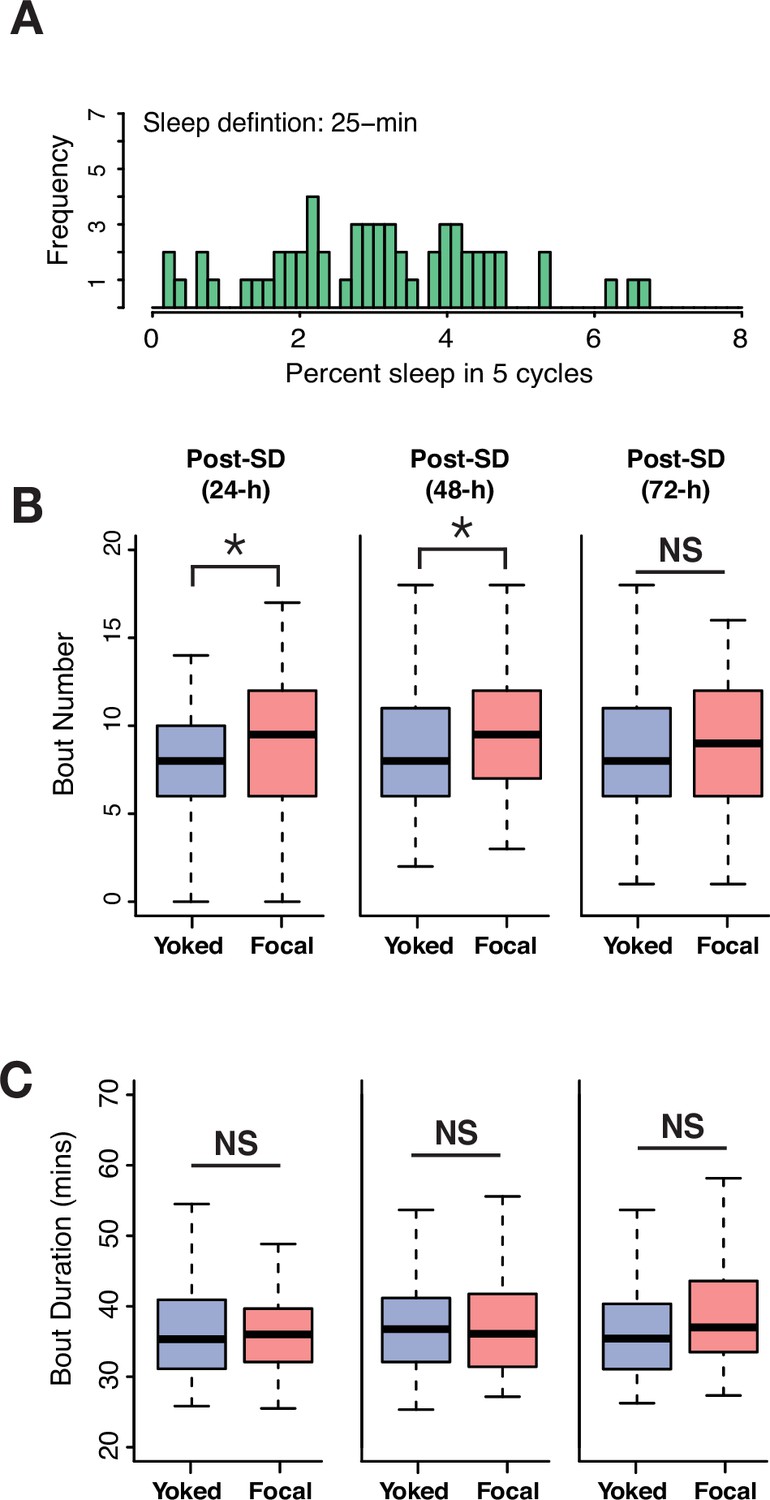
24 hour SD causes multi cycle post SD increases in long bouts of sleep.
(A) Frequency distribution of 25 min sleep bouts in undisturbed flies collected from five cycles. Every fly displayed at least one bout of sleep that was 25 min or longer. (B) Total bout numbers in 25 min, long-bout sleep across two cycles following 24 hr of deprivation using 220 s inactivity triggers showed significant increases in focal flies compared to yoked flies (post 1: Wilcoxon’s W=4029, p=0.02; post 2: Wilcoxon’s W=4186.5, p=0.006; post 3: Wilcoxon’s W=3779.5, p=0.16). (C) Duration of long bouts is not significantly different between focal and yoked flies in 3 post-deprivation days (post 1: Wilcoxon’s W=3422, p=0.53; post 2: Wilcoxon’s W=3229.5, p=0.66; post 3: Wilcoxon’s W=3888, p=0.08). n=82 each for focal and yoked categories, and n=58 for unperturbed controls *<0.05 and NS (not significant).
Figure 5 with 2 supplements

Deprivation of only long-bout sleep is sufficient to produce homeostatic responses and elicit multi-day sleep rebound.
(A) Five-day sleep time courses using the standard inactivity criterion for sleep (5 min or more) in focal-yoked flies during baseline, long-bout sleep deprivation (22 min inactivity triggers), and 3 days of recovery. There were no discernable changes in the average standard sleep measurements between experimental and control flies. (B) Five-day sleep time courses of long-bout sleep (inactivity durations of 25 min or more) during baseline, deprivation, and 3 post-deprivation days in focal and yoked flies. (C) In the 3 post-deprivation days there were no significant differences in standard sleep between focal and yoked flies (post 1: Wilcoxon’s W=269, p=0.06; post 2: Wilcoxon’s W=258, p=0.12; post 3: Wilcoxon’s W=263, p=0.09). (D) Long-bout sleep displayed significant increases in the total amount of sleep over three post-deprivation cycles when compared to yoked controls (post 1: Wilcoxon’s W=288, p=0.01; post 2: Wilcoxon’s W=284, p=0.02; post 3: Wilcoxon’s W=290, p=0.01). (E) Long-bout sleep rebound showed over 25% of flies paying back total sleep debt and overshooting in three post SD cycles. Focal sleep debt reflects the total sleep lost during deprivation, which was normalized to sleep amounts in undisturbed controls. n=20 each for focal and yoked categories *<0.05 and NS (not significant).
Figure 5—figure supplement 1

Time course of control CS flies for five LD cycles from a different run (see and compare with Figure 4), showing the remarkable consistency between runs in the amount of 25 min sleep.
Plotted are means ± SEM and dark shaded regions indicate the dark phase of the LD cycle.
Figure 5—figure supplement 2
Selective deep sleep deprivation causes multi cycle post SD increases in long bouts of sleep.
(A) Long-sleep bouts prior to deprivation were not different between focal and yoked flies (Wilcoxon’s W=263, p=0.09). (B) On post-deprivation day 1 focal flies showed significantly increased long-bout numbers (Wilcoxon’s W=304, p=0.004). On second day even though a trend was seen, it was not significant (Wilcoxon’s W=244.5, p=0.23), before returning to significant levels on post-deprivation day 3 (Wilcoxon’s W=295, p=0.009). (C) Long-bout duration on baseline days was not different between focal and yoked flies (Wilcoxon’s W=225.5, p=0.32). (D) On 3 post-derivation days, focal and yoked pairs did not show significant differences in long-bout durations (post 1: Wilcoxon’s W=210.5, p=0.57; post 2: Wilcoxon’s W=231.5, p=0.24; post 3: Wilcoxon’s W=242.5, p=0.14). n=20 each for focal and yoked categories. *<0.05 and NS (not significant).
Figure 6 with 1 supplement
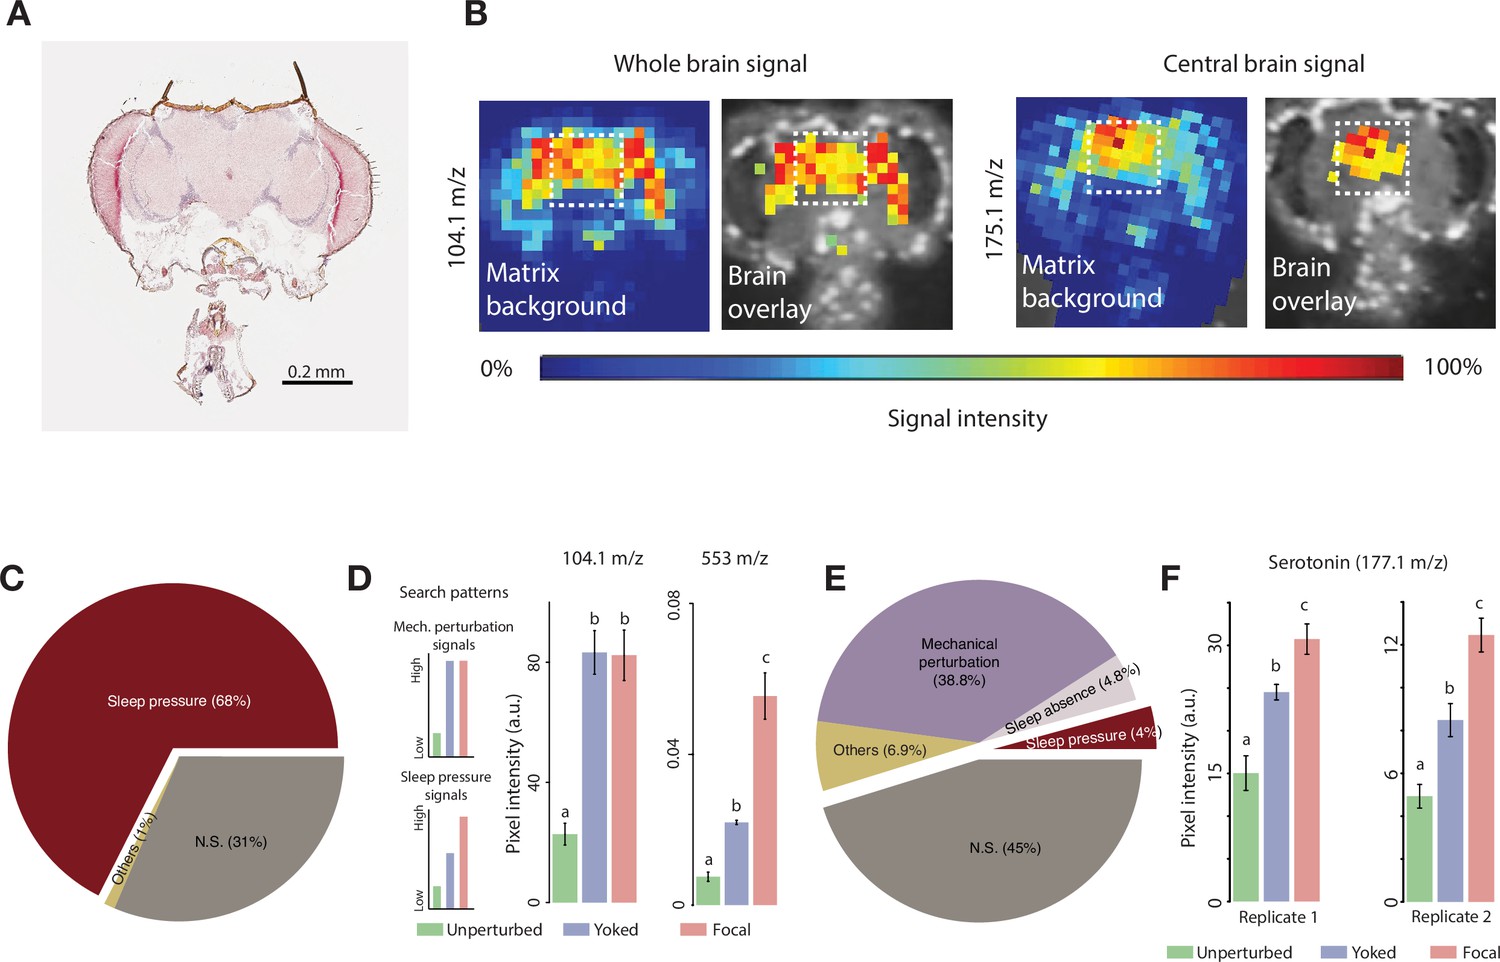
Identifying sleep substances using matrix-assisted laser desorption/ionization-time-of-flight mass spectrometry (MALDI-TOF MS).
(A) Representative hematoxylin-eosin stained cryosection of a fly head section. (B) Distribution of two representative molecules (104.1 m/z and 175.1 m/z) within a single head section. Note the near-zero relative intensity outside the brain region. Images are overlays of the high-intensity signals on the cryosection used to detect the signal and highlights brain-specific distribution of these molecules. The white dotted box represents the area, corresponding to the central brain, from which signal intensity was quantified. (C) Post-deprivation increases in the relative abundance of molecules in focal (deprived) flies when mechanical perturbations are not accounted for yields 127 positive hits (out of 188 molecules – 68%) in the first replicate. We also found 59 peaks that were not significantly different between focal and undisturbed flies, and 2 peaks that were significantly different, but lower in the focal than in undisturbed flies, which we termed as ‘Others’. (D) Search patterns of molecules tracking mechanical perturbation signals (top) and sleep pressure-specific signals (bottom). Example peaks (m/z 104.1 and m/z 553) showing each of the two categories. Values plotted are mean ± SEM. (E) Pie chart representing the number of molecules in various categories when yoking is employed. The number of molecules reflecting sleep pressure was eight (4%) for the first replicate. We identified an additional category of molecules that may track sleep and refer to it as ‘Sleep Absence’. Molecules that track the complete absence of sleep (as in the case of focal flies, but not in partial sleep loss situations as in the yoked flies) are classified under this category, and we found nine such candidates. These nine molecules had indistinguishable values between yoked and undisturbed flies which were both significantly lower than focal flies. The number of sections from independent brains that were used are as follows: focal = 6; yoked = 3; unperturbed = 4. (F) One of the detected sleep-tracking molecules was serotonin, detected at 177.1 m/z, which showed significant sleep pressure tracking changes in both replicate runs. The number of sections from independent brains that were used for the second replicate are as follows: focal = 7; yoked = 4; unperturbed = 4 (replicate 1: Kruskal-Wallis critical value = 9.32, df = 2, p=0.009; replicate 2: Kruskal-Wallis critical value = 11.56, df = 2, p=0.003). Bars with the same letters are not significantly different from each other.
Figure 6—figure supplement 1

Spotted amines in matrix-assisted laser desorption/ionization-time-of-flight (MALDI-TOF) mass spectrometry (MS) experiments and detected serotonin concentration at m/z 177.07.
Water was used as a solvent to make 1 mg/ml concentrations for spotting slides.
Author response image 1
Additional files
-
MDAR checklist
- https://cdn.elifesciences.org/articles/91355/elife-91355-mdarchecklist1-v2.pdf
-
Supplementary file 1
Behavioral and sleep architecture phenotypes associated with mechanical sleep deprivation, and MALDI-TOF MS standards.
- https://cdn.elifesciences.org/articles/91355/elife-91355-supp1-v2.docx
Download links
A two-part list of links to download the article, or parts of the article, in various formats.
Downloads (link to download the article as PDF)
Open citations (links to open the citations from this article in various online reference manager services)
Cite this article (links to download the citations from this article in formats compatible with various reference manager tools)
Homeostatic control of deep sleep and molecular correlates of sleep pressure in Drosophila
eLife 12:e91355.
https://doi.org/10.7554/eLife.91355


