Enkephalin-mediated modulation of basal somatic sensitivity by regulatory T cells in mice
- Centre d’Immunologie et des Maladies Infectieuses (CIMI-PARIS), INSERM, CNRS, Sorbonne Université, France
- Université Clermont Auvergne, CHU Clermont-Ferrand, INSERM, Neuro-Dol, France
- Toulouse Institute for Infectious and Inflammatory Diseases (Infinity), INSERM, CNRS, Université Toulouse III - Paul Sabatier (UPS), France
- Institut de Recherche sur la Santé Digestive (IRSD), Université de Toulouse, INSERM, INRAE, ENVT, Université Toulouse III - Paul Sabatier (UPS), France
Figures
Figure 1
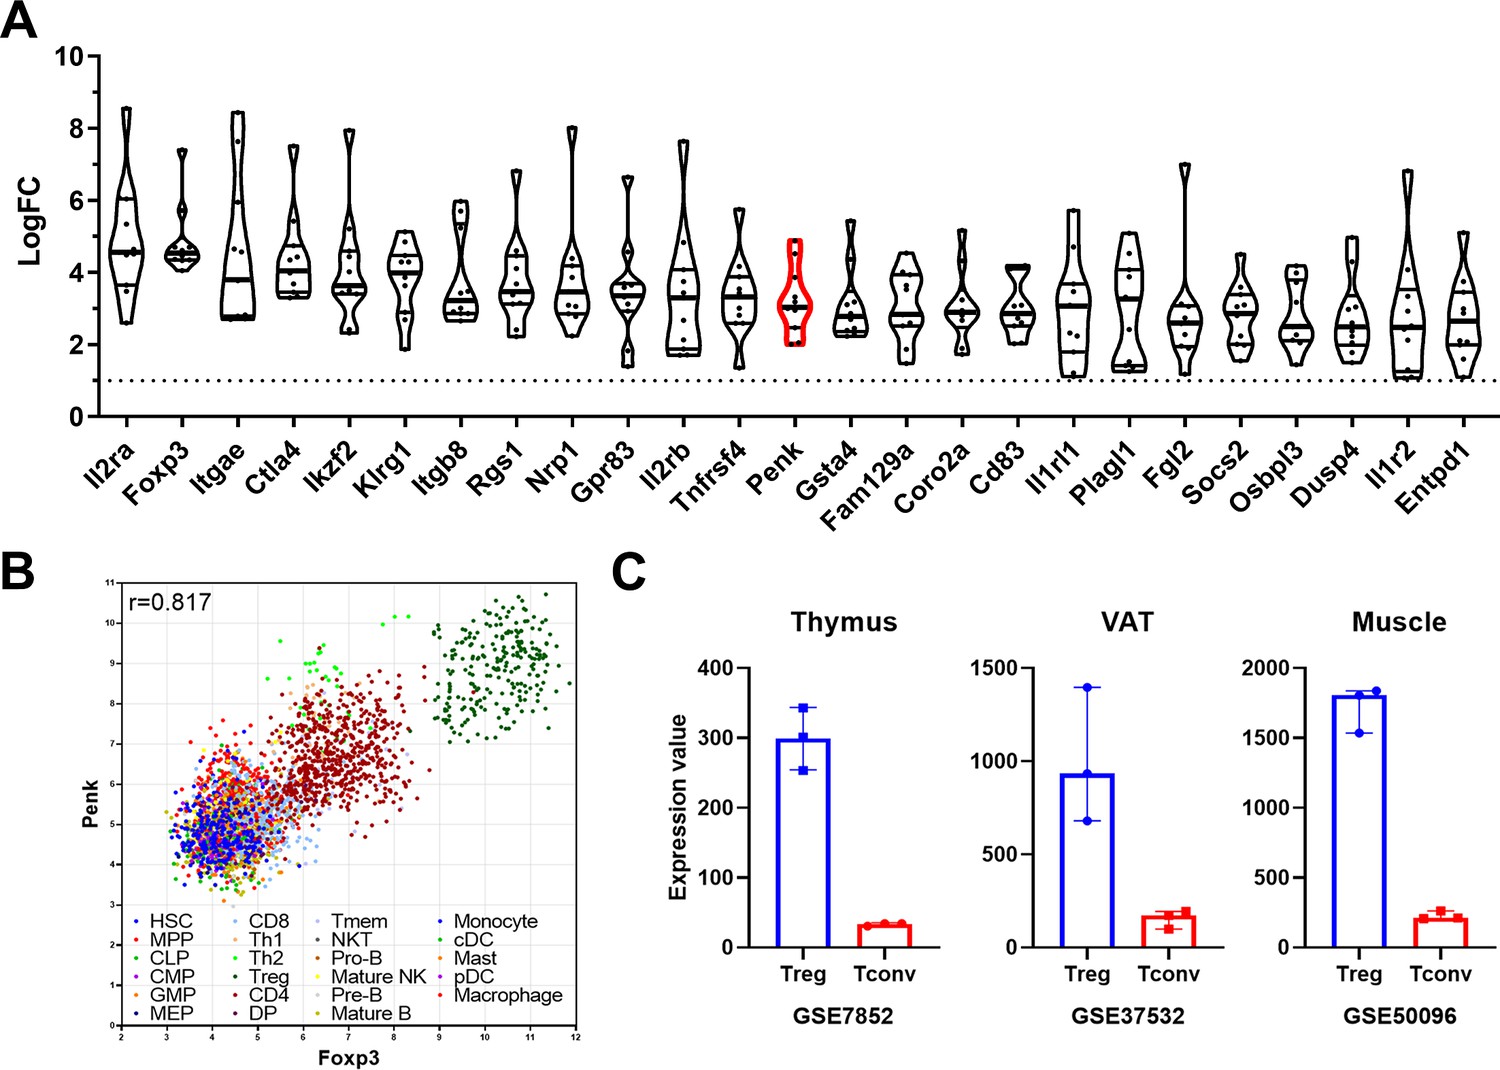
A meta-signature of murine regulatory T cell (Treg) and Penk mRNA expression in lymphoid and non-lymphoid organs.
(A) Top 25 genes enriched in Treg compared to conventional T cell (Tconv) from lymphoid tissue from at least 10 of the 11 datasets analyzed ranked by fold change (LogFC) of mean expression relative to Tconv. The Penk gene is highlighted in red. (B) Correlation of Penk and Foxp3 expression in all the cell types listed in the legend according to the Immuno-Navigator dataset. The Pearson correlation coefficient is indicated. Each dot is a sample, color coded as a subset according to the legend. (C) Expression of Penk in Treg (blue) and Tconv (red) isolated from thymus, visceral adipose tissue (VAT) and muscle. The source of the data is indicated below each graph.
Figure 2 with 1 supplement
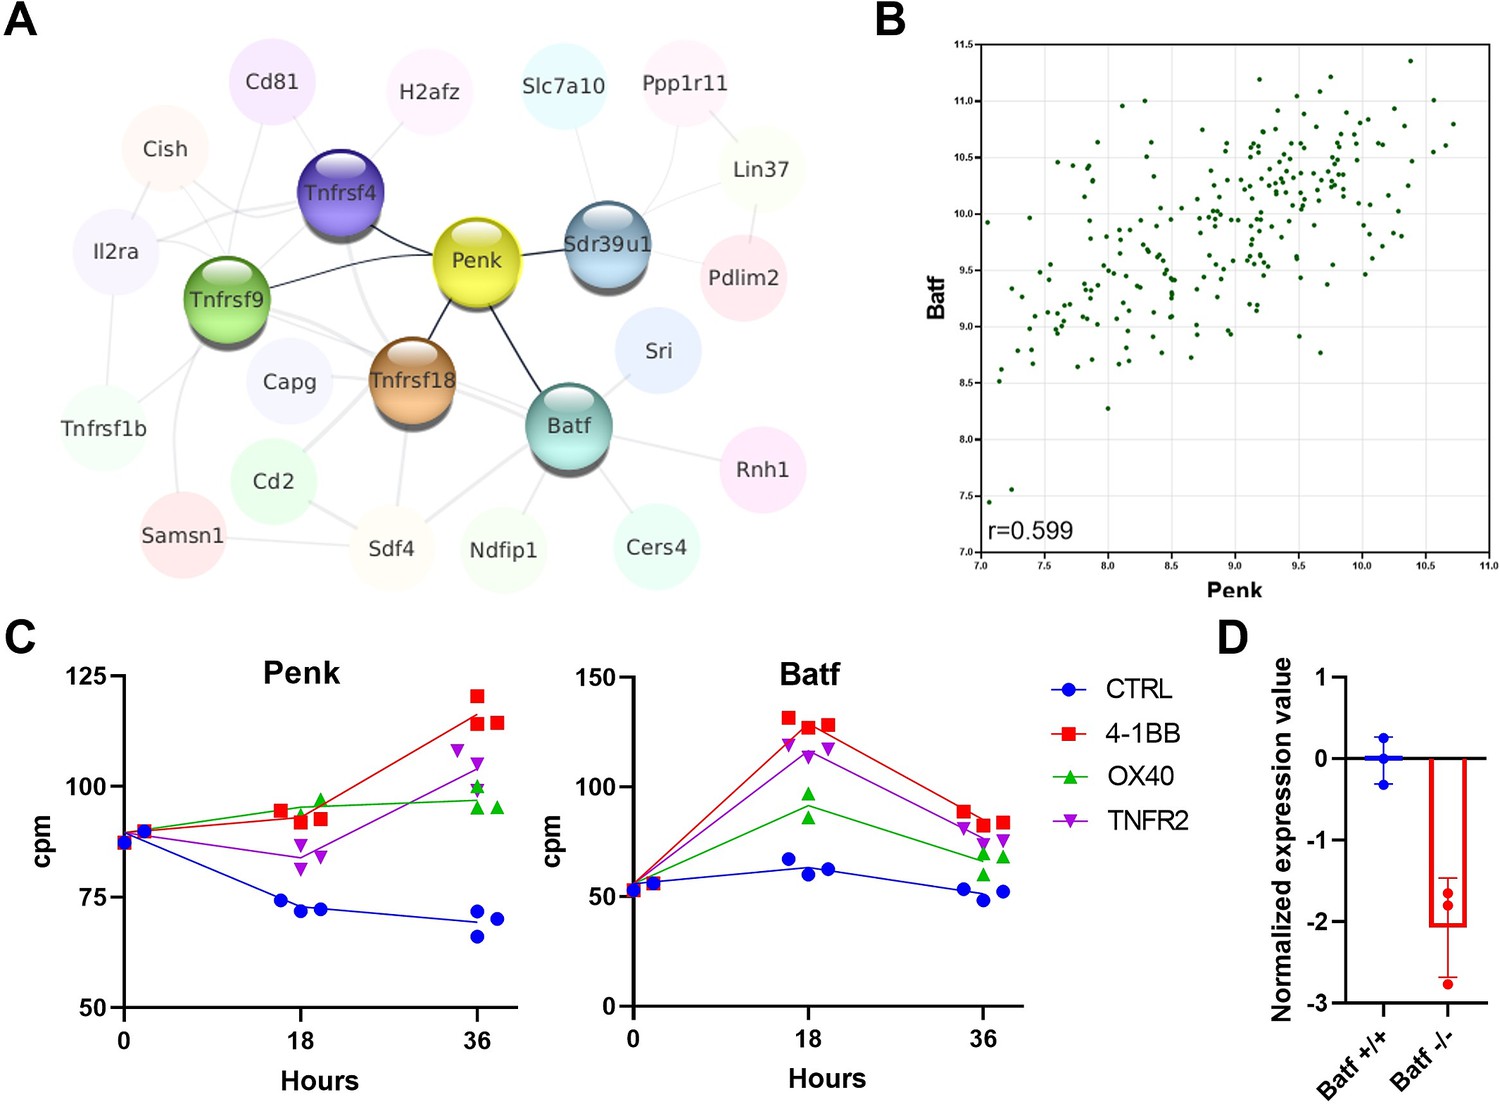
Penk expression is regulated by TNFR signaling and the BATF transcription factor.
(A) A network of the genes most correlated to Penk in regulatory T cell (Treg) is shown. The Pearson correlation values were extracted from the Immuno-Navigator database (selecting only Treg in the analysis) and integrated into Cytoscape v3.7 (Shannon et al., 2003). Each node is a gene linked by edges with width proportional to the Pearson correlation (edge range: 0.538–0.758). (B) Illustration of the correlation between expression of Penk and Batf in Treg. Each dot is a sample from the Immuno-Navigator database. The Pearson correlation coefficient is indicated on the figure. (C) Penk and Batf mRNA expression after in vitro stimulation of purified Treg with the indicated TNFR agonists prior (0), and at 18 and 36 hr after stimulation. Each dot is a biological replicate from a single experiment. (D) GEO2R analysis of the GSE89656 dataset between wild-type control Treg (WT) and BATF-KO Treg.
Figure 2—figure supplement 1
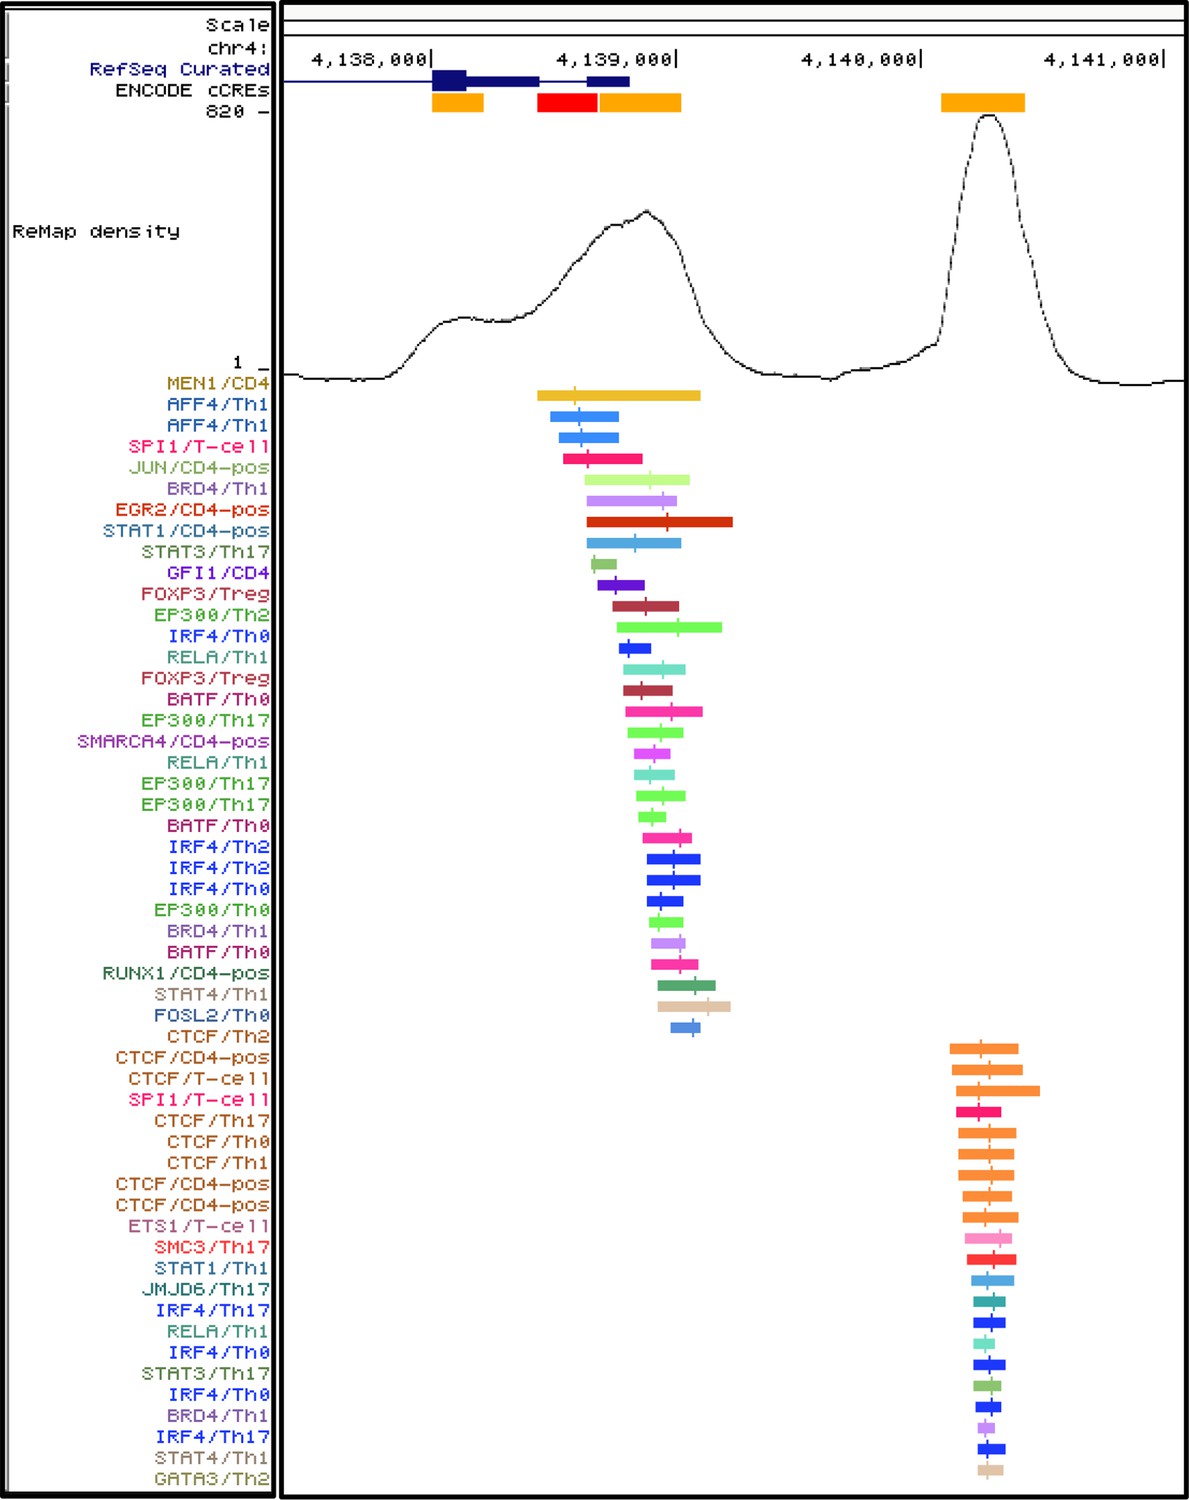
Analysis of regulatory regions of the Penk gene.
(Ref Seq): The location and transcription orientation of the Penk gene on chromosome 4 are indicated. (ENCODE cCREs): The locations of ENCODE candidate cis-regulatory regions (cCREs) are shown. Colors indicate promoter-like signature (red) and proximal enhancer-like signature (orange). (Remap density): Density representation of transcription factor-binding sites at the indicated locations with filtering on T cell subsets only (source: UniBind 2021). Specific tracks depicted on the left were added to the reference genome assembly mm10 as bed files extracted from the TFBS tool in UniBind, focusing the analysis on the region flanking the cCREs depicted above. The figure was generated with the Ensembl web browser.
Figure 3 with 2 supplements
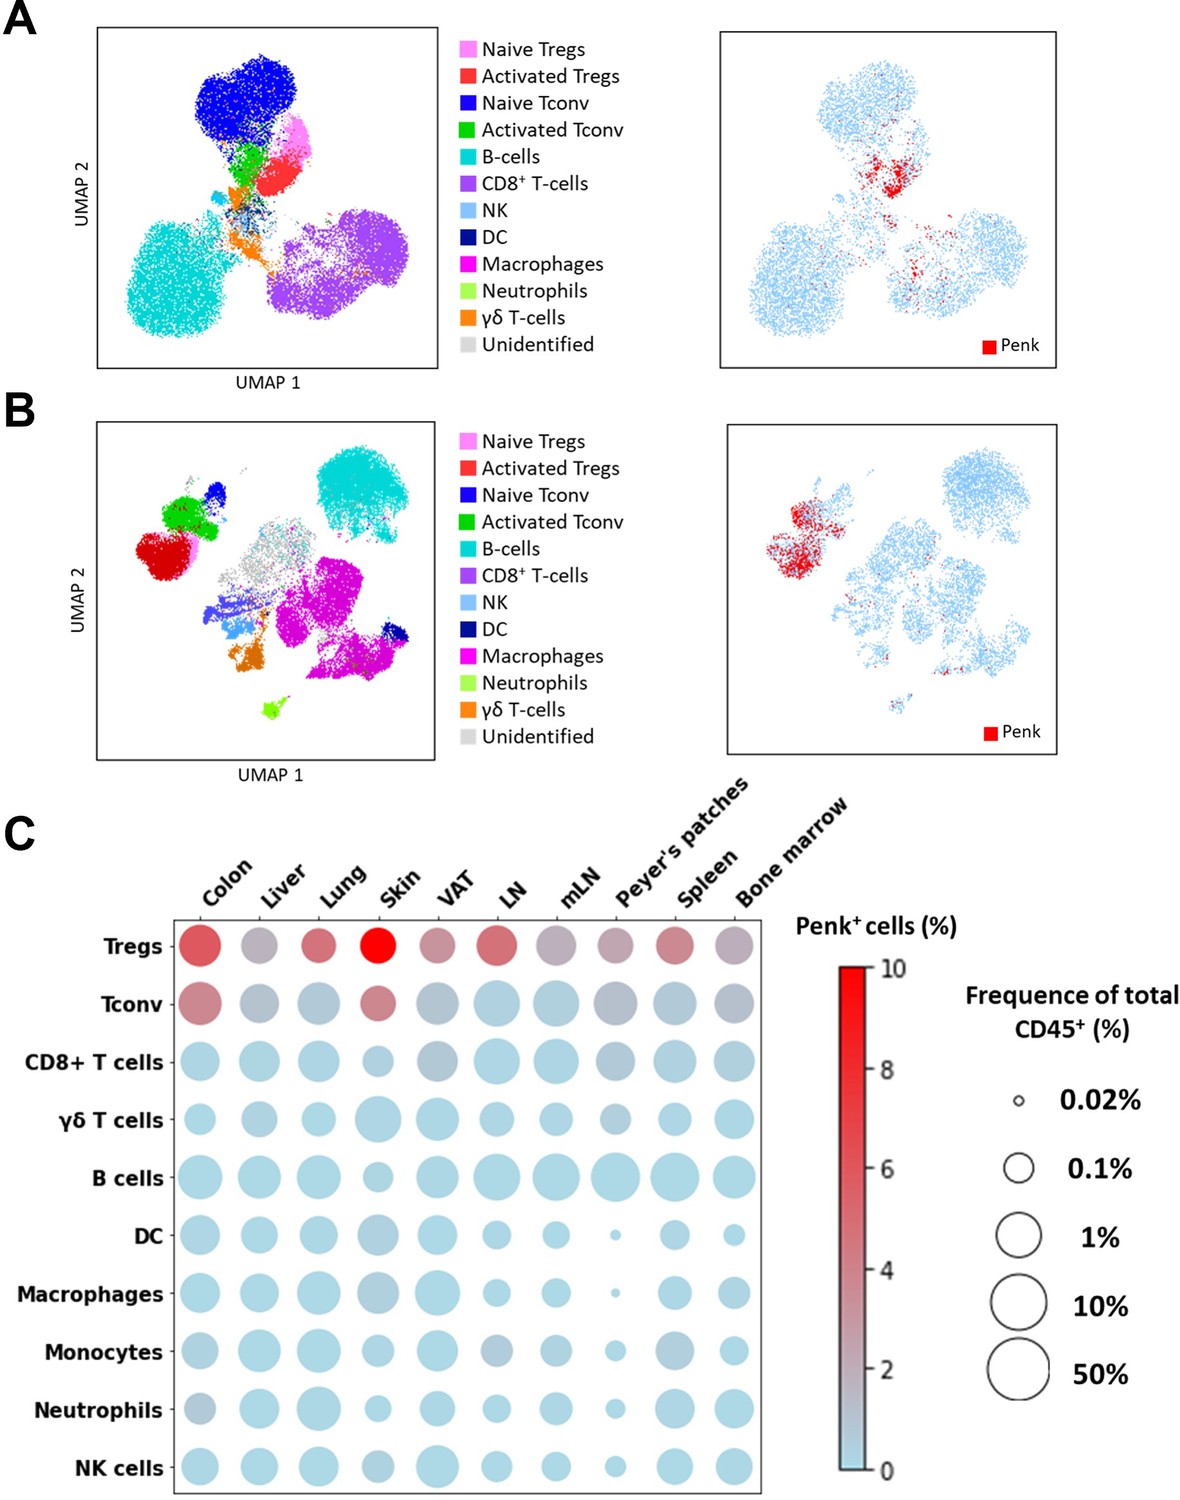
Penk is predominantly expressed by regulatory T cell (Treg) at steady state.
(A–B) (Left) UMAP representing all major cell types indicated in the figures determined by flow cytometry from lymph nodes (A) and colon (B). (Right) Projection of tdTomato expression on the UMAP of lymph nodes and colon. Subsets were manually gated as depicted in Figure S1A. (C) Bubble plot displaying the average population size and frequencies of Penk+ cells for the listed cell populations and organs. Population size was calculated as the percentage out of total CD45+ single cells and represented on a log10 scale (n = 3 mice for the visceral adipose tissue [VAT], spleen, and bone marrow, n = 6 mice for the other groups; results cumulative of two independent experiments).
Figure 3—figure supplement 1
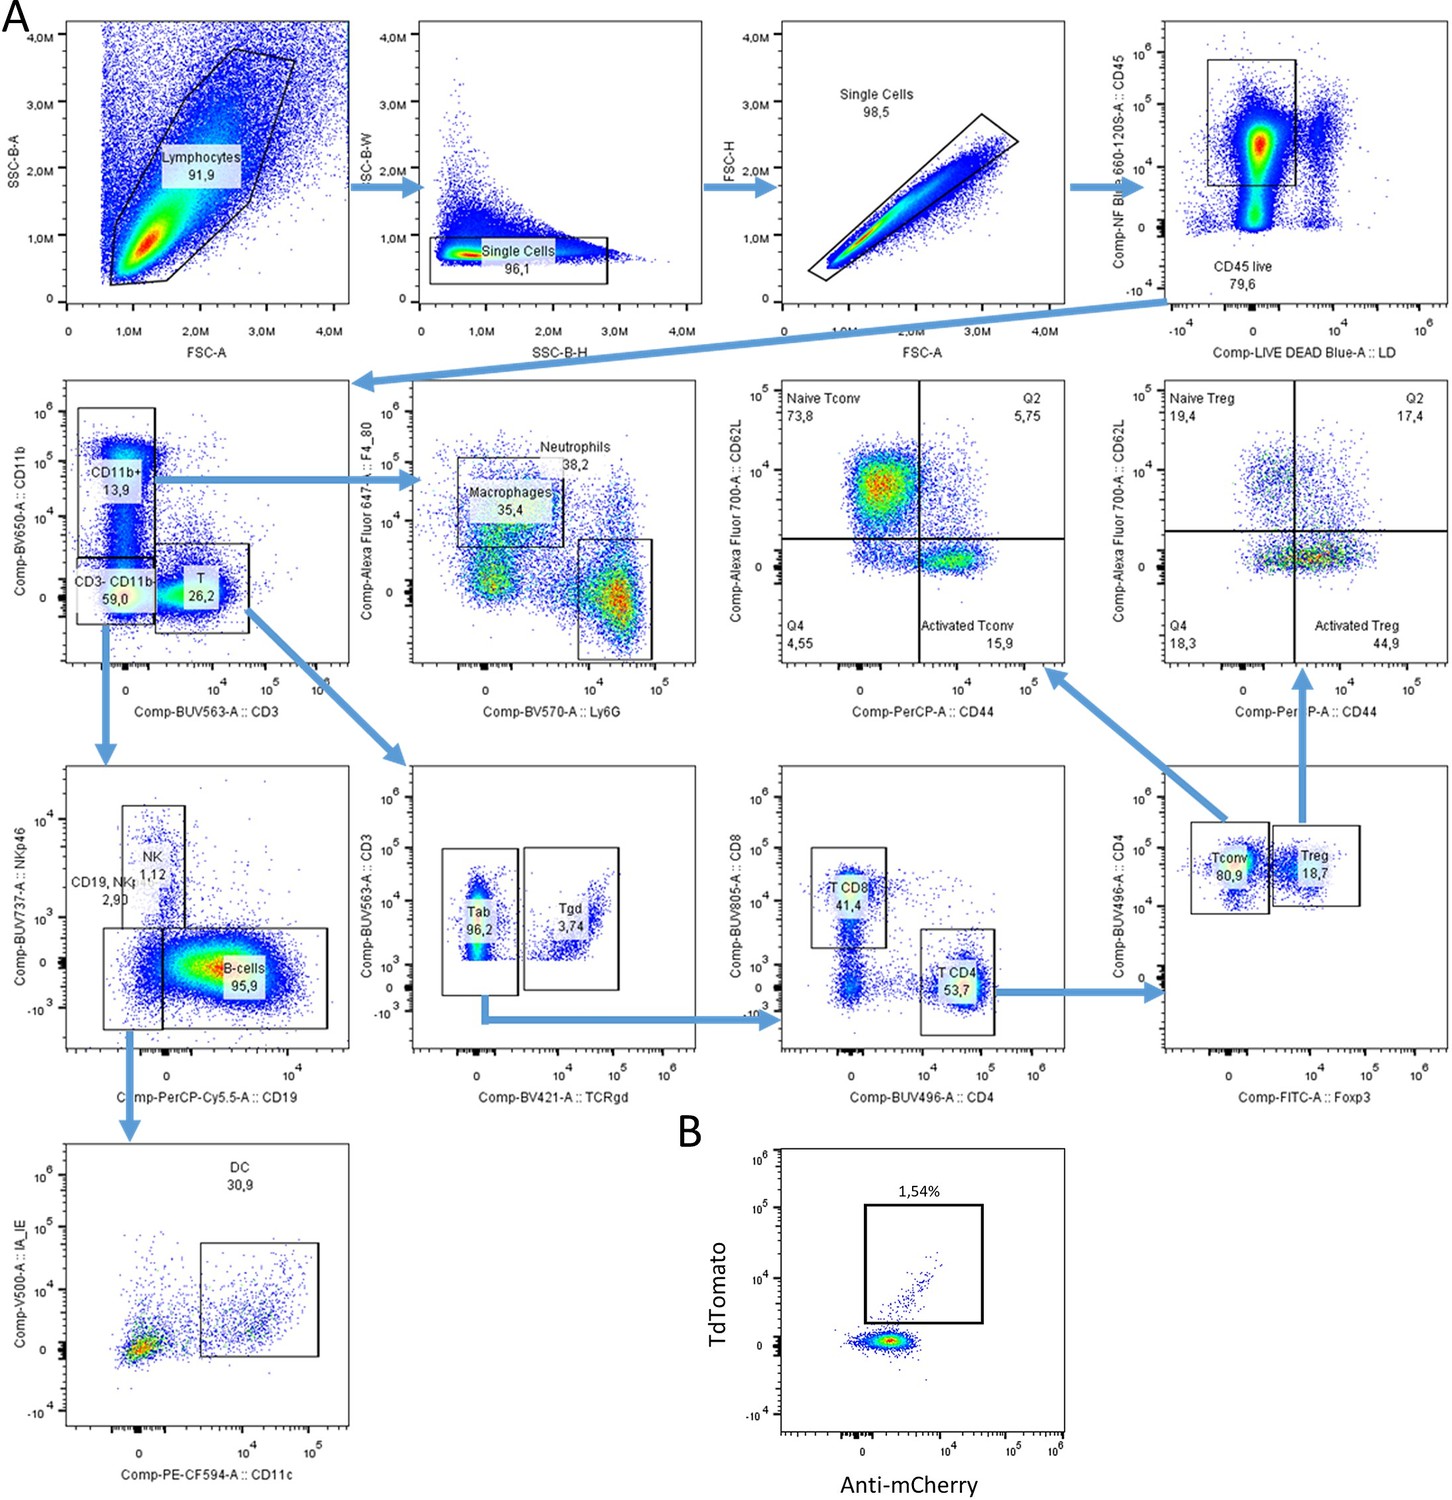
Mapping Penk expression in multiple tissues and cell types.
(A) Representative flow cytometry profiles in the spleen at day 7 post-Tamoxifen (TMX) administration into PenkCre-ERT2 × ROSAtdtomato mice. (B) Representative staining of TdTomato and mCherry in the spleen at day 7 post-TMX administration.
Figure 3—figure supplement 2
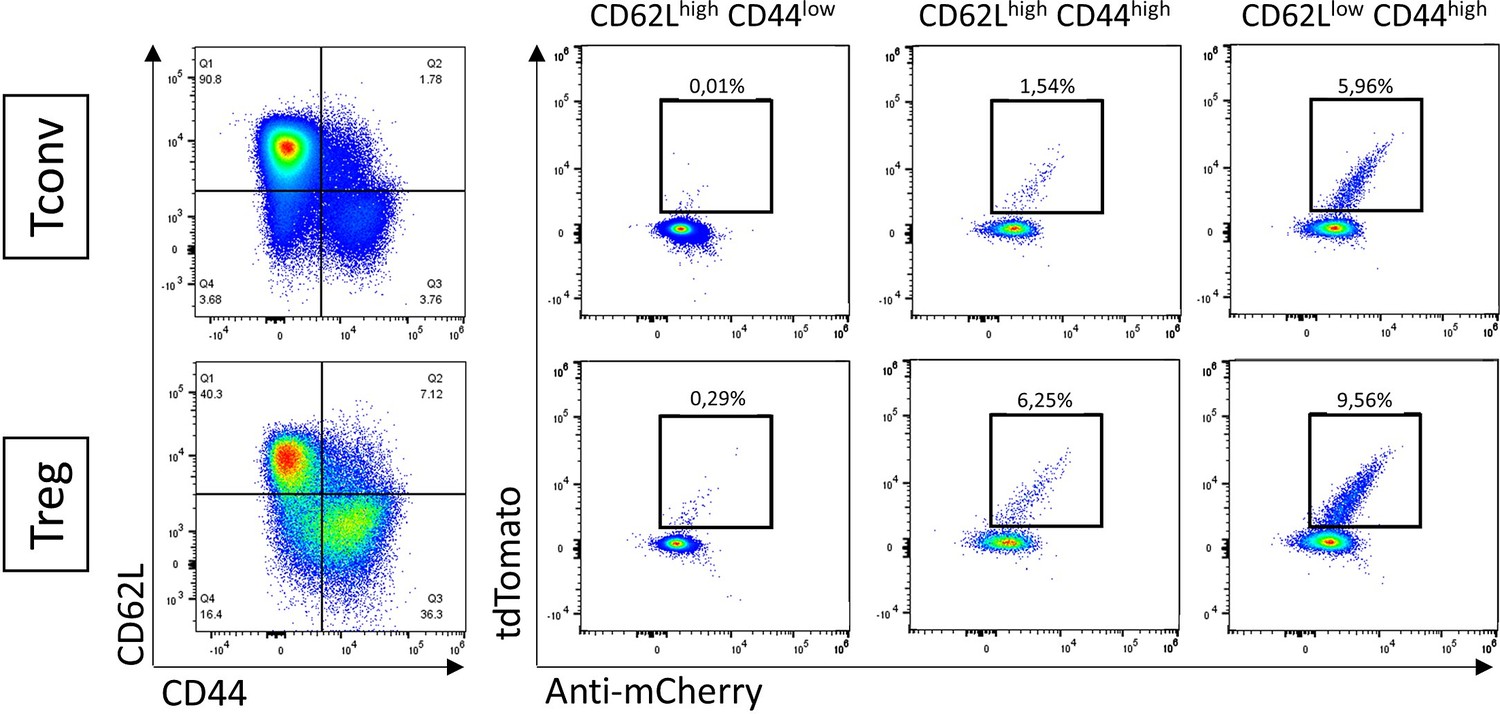
Penk expression in conventional T cell (Tconv) and regulatory T cell (Treg) according to activation status in lymph nodes.
Representative staining of TdTomato and mCherry in naive (CD62Lhigh CD44low), central memory (CD62Lhigh CD44high), and effector memory (CD62Llow CD44high) Tconv (top) and Treg (bottom) in the lymph nodes 1-week post-Tamoxifen (TMX) administration.
Figure 4
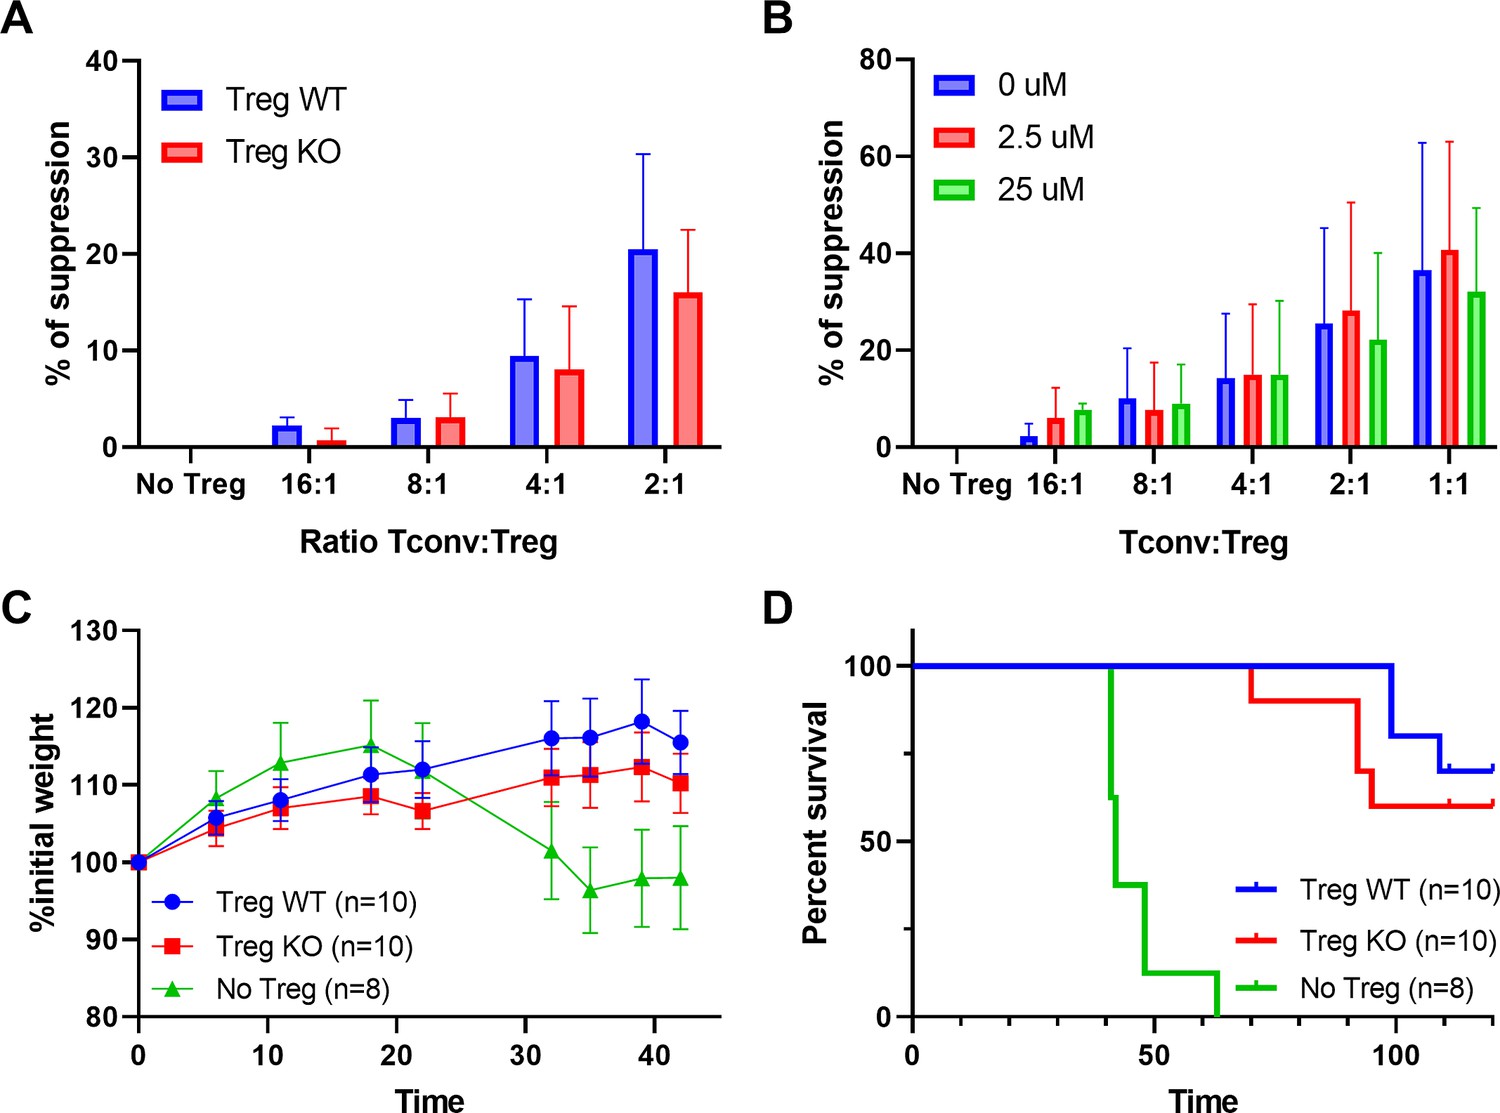
Immunosuppressive functions of regulatory T cell (Treg) are unaffected by the lack of enkephalins.
(A) In vitro suppression of wild-type (WT) conventional T cell (Tconv) proliferation by WT or Penk knock-out (KO) Tregs. (B) In vitro suppression of WT Tconv proliferation by Penk WT Tregs in presence of Naloxone. (C) Body weight and (D) survival of Rag2−/− mice transferred with Tconv and Treg from Penk-WT or Penk-KO chimeric mice (2:1 ratio), as described in the methods. All data are cumulative of two independent experiments.
Figure 5 with 2 supplements
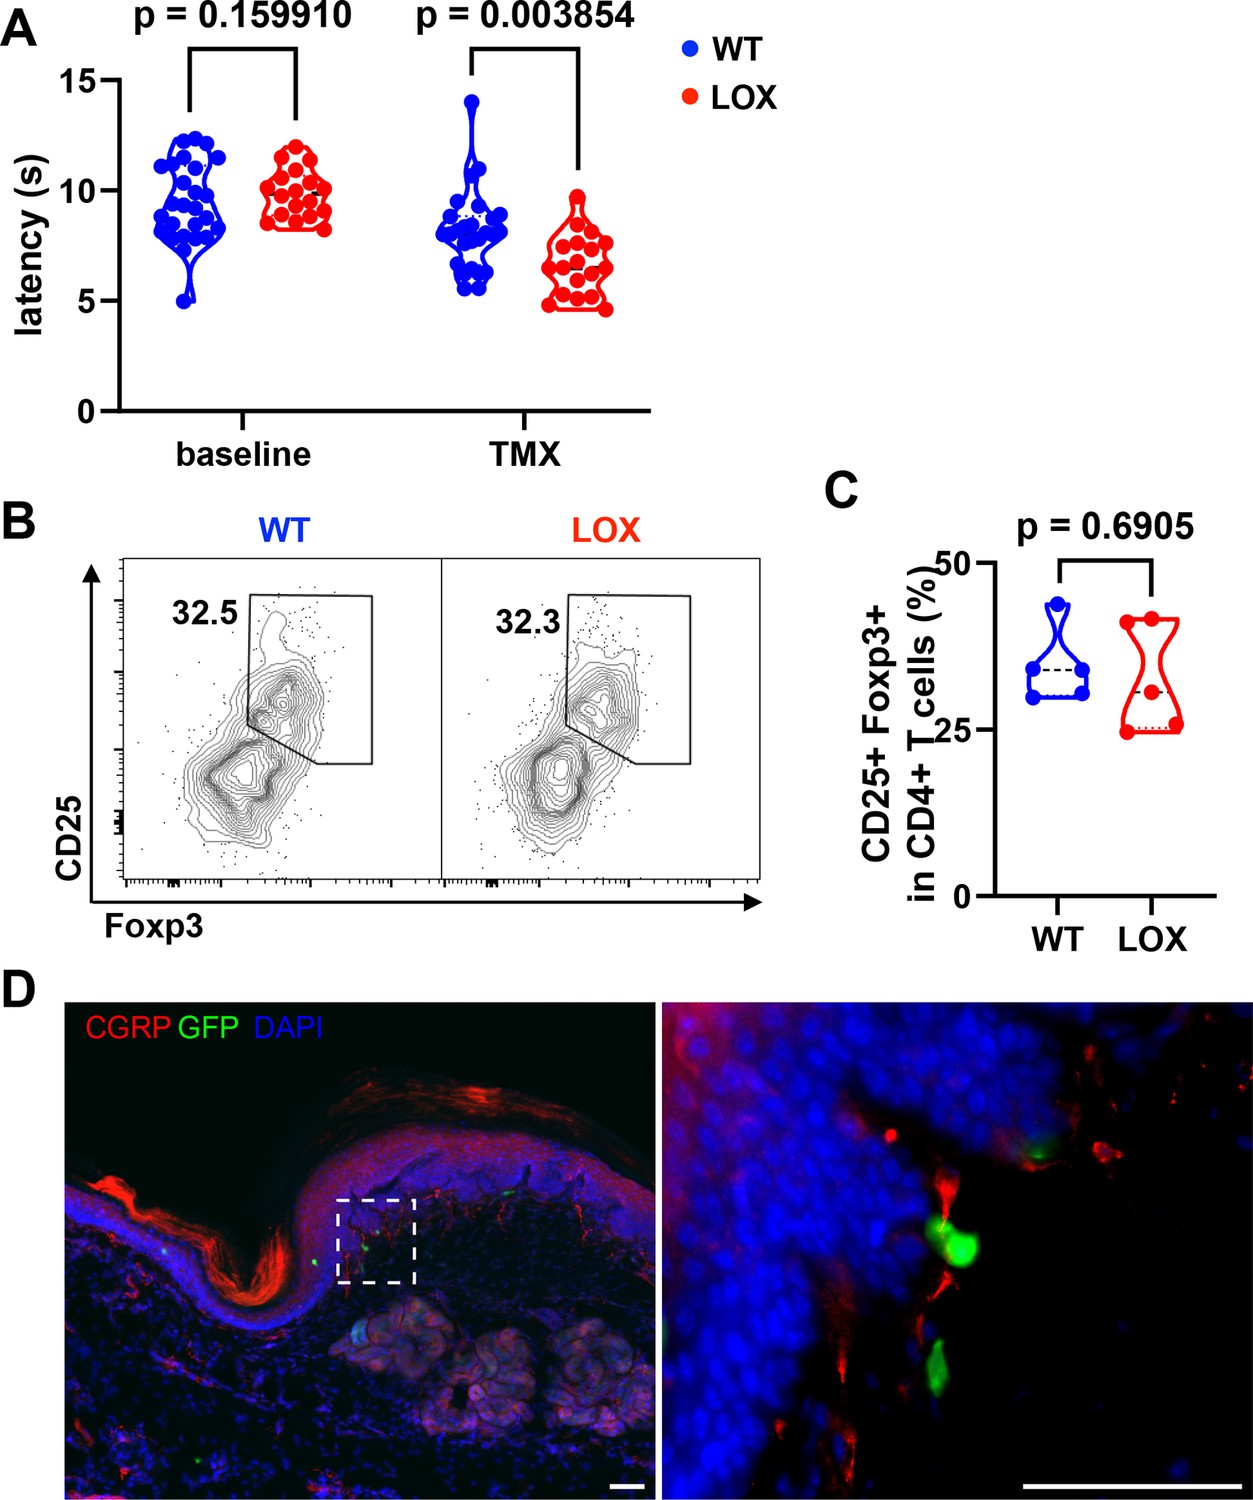
Heat hyperalgesia in mice deficient for Penk in regulatory T cell (Treg).
(A) Withdrawal latency of wild-type (WT) and LOX mice before (baseline) and after administration of Tamoxifen (TMX). Each dot corresponds to the mean latency response (in seconds) of four measurements taken before TMX administration (baseline) and four measurements taken from day 7 onwards (TMX). Statistical modeling was performed using a non-parametric unpaired Mann–Whitney t-test with multiple corrections. The results shown in this figure are cumulative from two independent experiments with a total of 44 mice (26 WT and 18 LOX). Each dot is a mouse. (B) Representative flow cytometry contour plot of CD25 and Foxp3 staining on pad skin CD45+CD3+CD4+ cells from WT or LOX mice 17 days after TMX gavage. (C) Quantification of the frequency of Treg (Foxp3+CD25+) among CD4+ T cells in WT and LOX mice pad as shown in (B). The indicated p value was determined by a Mann–Whitney test. Each dot is a mouse from a single experiment. (D) Immunofluorescence staining of Calcitonin Gene-Related Peptide (CGRP) neurons (red), Foxp3-GFP cells (green), and 4'6-diamidino-2-phenylindole (DAPI) (blue) of footpad skin section of a female LOX mouse (scale bar represents 50 µm). The right panel is the magnification of the area indicated on the left panel.
Figure 5—figure supplement 1
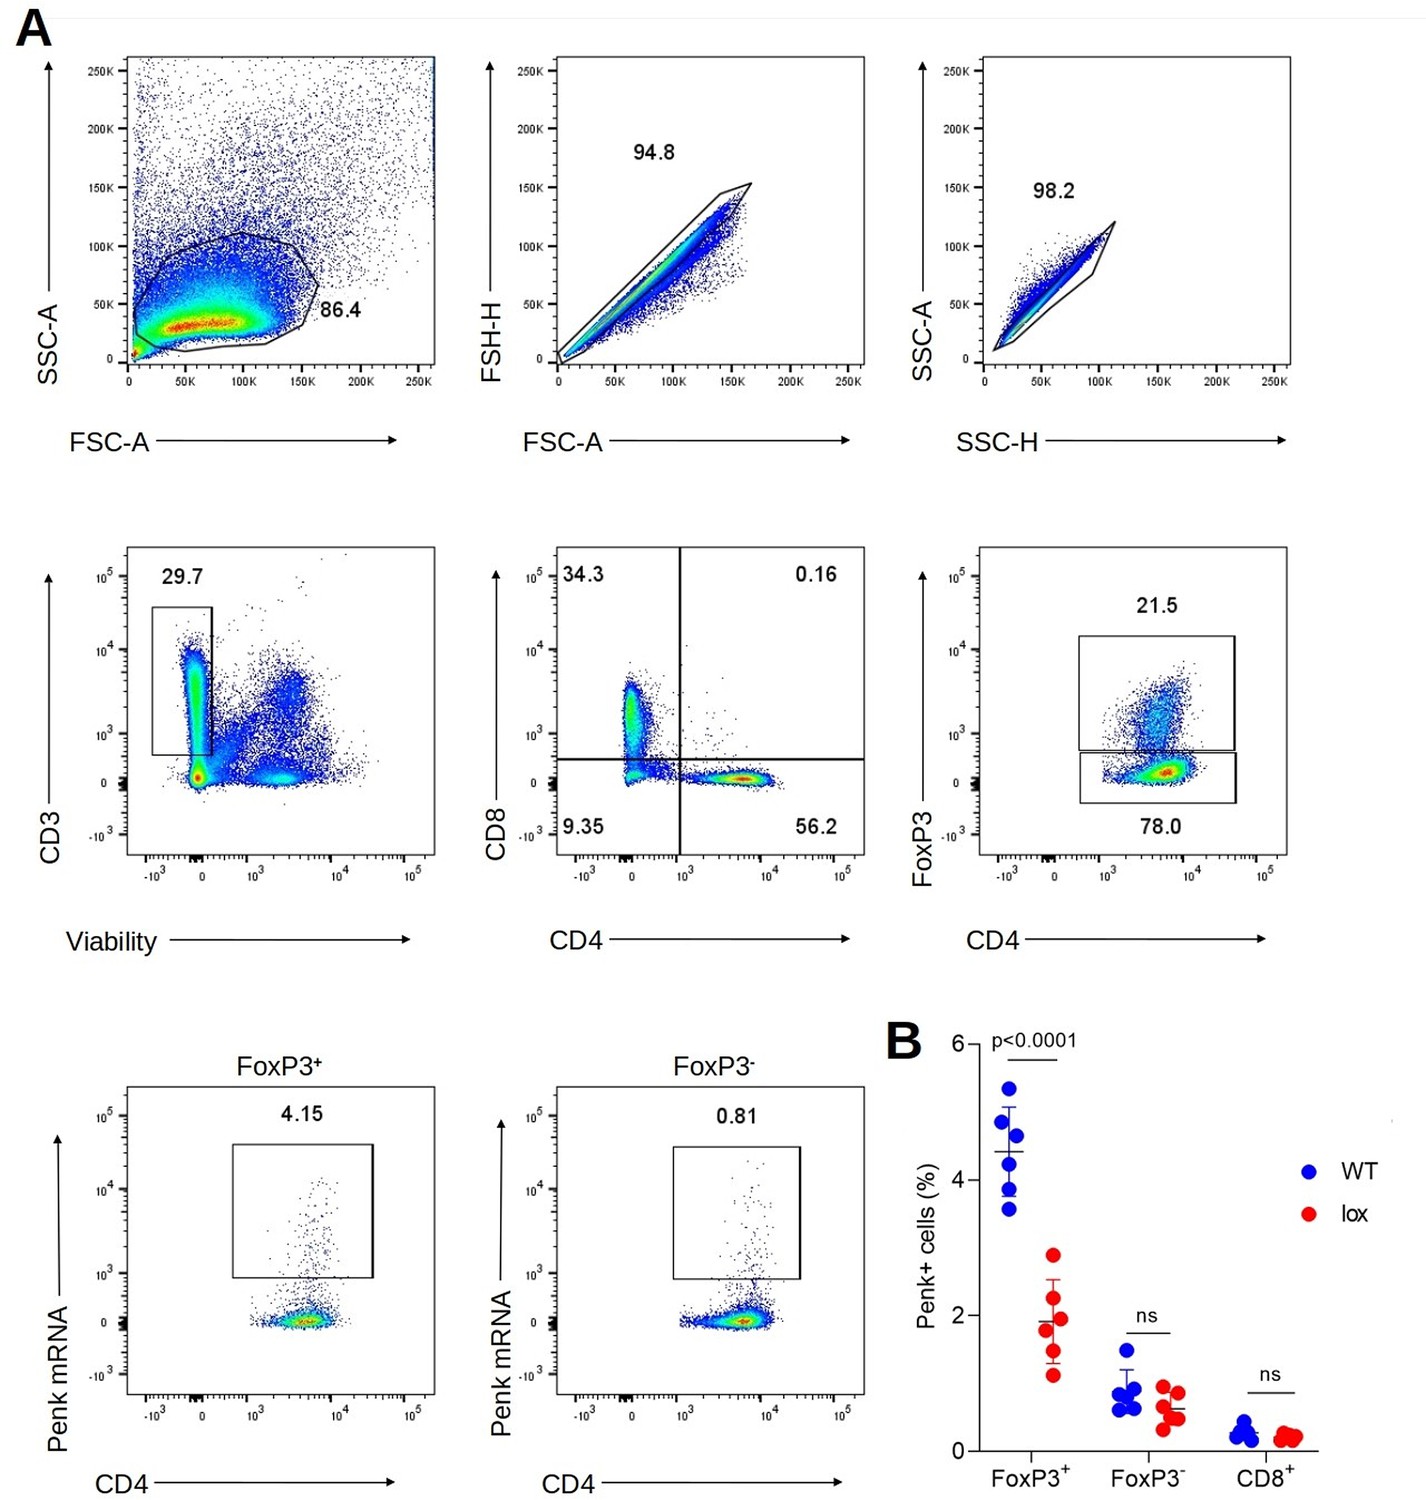
Specific deletion of Penk in regulatory T cell (Treg) of LOX mice after Tamoxifen (TMX) administration.
(A) Representative flow cytometry profiles of splenocytes in FoxP3Cre-ERT2 × Penk+/+ (wild-type, WT) and FoxP3Cre-ERT2 × Penkfl/fl mice (LOX). (B) Frequencies of Penk+ cells in different CD4+ T cell populations: Treg (FoxP3+), conventional T cell (Tconv; FoxP3−), and CD8+ T cells. Cumulative data from mice analyzed at days 3, 7, and 30 post-TMX are shown. Each dot is a mouse. Statistical modeling was performed using two-way analysis of variance with multiple tests correction. ns = not significant (p > 0.05).
Figure 5—figure supplement 2
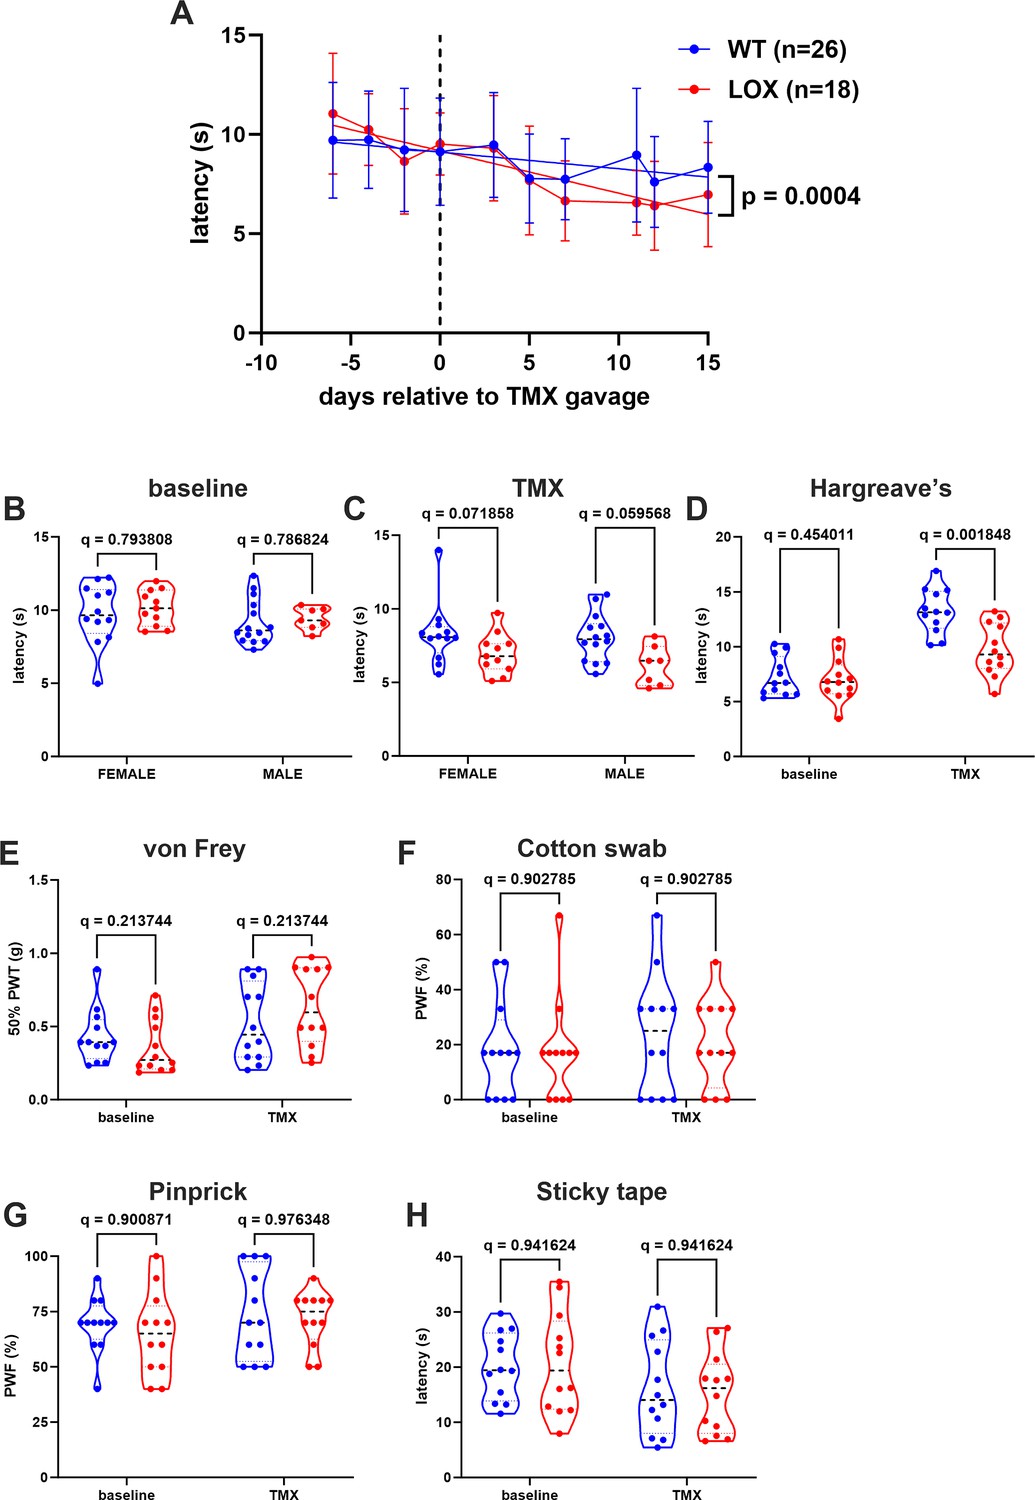
Heat hyperalgesia in wild-type (WT) and LOX mice.
(A) Each dot represents the mean (± standard error of the mean [SEM]) latency to heat stimulation for all mice of either WT (blue) or LOX (red) genotype. Results are plotted as a function of days relative to Tamoxifen (TMX) gavage (D0). Statistical modeling of the results was performed using linear regression curve fitting with intercept and slope comparisons. The low p-value allows the hypothesis that one curve fits all datasets to be rejected. (B–C) Each dot is the mean value of the latency period in response to 55°C exposition for female and male mice of either WT (blue) or LOX (red) genotype for four baselines (B) and four post-TMX time points after D7 (C). Each dot is a mouse. (D) Withdrawal latency of WT and LOX mice before (baseline) and after TMX administration (TMX) in response to the Hargreave test. Each dot is a mouse. (E) Each dot is the 50% paw withdrawal threshold (PWT) for all mice on both hind paws of the WT (blue) or LOX (red) genotype in response to the Von Frey test at baseline or post-TMX time points. (F) Paw withdrawal frequency (PWF) for all mice on both hind paws of the WT (blue) or LOX (red) genotype in response to the cotton swab test. Baseline and post-TMX time points are shown for each mouse. (G) PWF for all mice on both hind paws of the WT (blue) or LOX (red) genotype in response to the pinprick test before and after TMX gavage. (H) Latency period in response to sticky tape test stimulation for all mice of the WT (blue) or LOX (red) genotype. Baseline and post-TMX time points are shown for each mouse hind paw. Statistical modeling was performed using Mann–Whitney tests with multiple tests correction with n = 44 (26 WT and 18 LOX) for A–C and n = 12 (6 WT and 6 LOX) for D–H. The q values indicated on the graphs are the results of the two-stage step-up false discovery rate (FDR) multiple test correction.
Tables
Table 1
Characteristics of the datasets used for the regulatory T cell (Treg) meta-signature (NA = not available; LN = lymph nodes).
| Dataset | Genetic background | Age | Sex | Treg sorting | Tissue | Affymetrix Genome array |
|---|---|---|---|---|---|---|
| GSE103216 | C57Bl/6 | 6–8 weeks | Female | Foxp3-RFP | LN | 1.0 |
| GSE136582 | C57Bl/6 | 6–8 weeks | NA | Foxp3-eGFP | Spleen | 2.0 |
| GSE14308 | C57Bl/6 | NA | NA | CD25high | Spleen and LN | 2.0 |
| GSE15907 | C57Bl/6 | 6 weeks | Male | CD25high | Spleen | 1.0 |
| GSE17580 | C57Bl/6 | NA | Female | CD25high | Mesenteric LN | 2.0 |
| GSE24210 | C57Bl/6 | NA | NA | CD25high | Spleen and LN | 2.0 |
| GSE37532 | C57Bl/6 | 25 weeks | Male | CD25high | LN | 1.0 |
| GSE40685 | C57Bl/6 | NA | NA | Foxp3-GFP | Spleen and LN | 2.0 |
| GSE42021 | BALB/c | NA | NA | Foxp3-GFP | Spleen and LN | 2.0 |
| GSE50096 | C57Bl/6 | 6 weeks | NA | Foxp3-GFP | Spleen | 1.0 |
| GSE7460 | C57Bl/6 | 32–36 weeks | NA | CD25high | LN | 2.0 |
Additional files
-
Supplementary file 1
Monoclonal antibodies used in the study of PenkCre × ROSA26tdTomato.
Indicated are the specificity of the antibody with the fluorescent dye, the provider, the catalog number, the clone, and the dilution of the monoclonal antibodies (mAb) used to generate results of Figure 3.
- https://cdn.elifesciences.org/articles/91359/elife-91359-supp1-v1.zip
-
MDAR checklist
- https://cdn.elifesciences.org/articles/91359/elife-91359-mdarchecklist1-v1.docx
-
Source data 1
List of the differentially expressed genes between conventional T cell (Tconv) and regulatory T cell (Treg).
Only genes upregulated in 10 out of 11 datasets are presented with the associated log2 fold change as determined by GEO2R (NA = not available).
- https://cdn.elifesciences.org/articles/91359/elife-91359-data1-v1.xlsx
Download links
A two-part list of links to download the article, or parts of the article, in various formats.
Downloads (link to download the article as PDF)
Open citations (links to open the citations from this article in various online reference manager services)
Cite this article (links to download the citations from this article in formats compatible with various reference manager tools)
Enkephalin-mediated modulation of basal somatic sensitivity by regulatory T cells in mice
eLife 13:RP91359.
https://doi.org/10.7554/eLife.91359.3


