Non-Hebbian plasticity transforms transient experiences into lasting memories
- Department of Molecular Biology and Genetics, Aarhus University, Denmark
- Department of Biomedicine, Aarhus University, Denmark
- DANDRITE, The Danish Research Institute of Translational Neuroscience, Aarhus University, Denmark
- Center for Proteins in Memory – PROMEMO, Danish National Research Foundation, Aarhus University, Denmark
- Cellular and Systems Neurobiology, Universidade Nova de Lisboa, Portugal
- Instituto de Fisiología Biología Molecular y Neurociencias (IFIBYNE), Universidad de Buenos Aires, Argentina
Figures
Figure 1 with 1 supplement
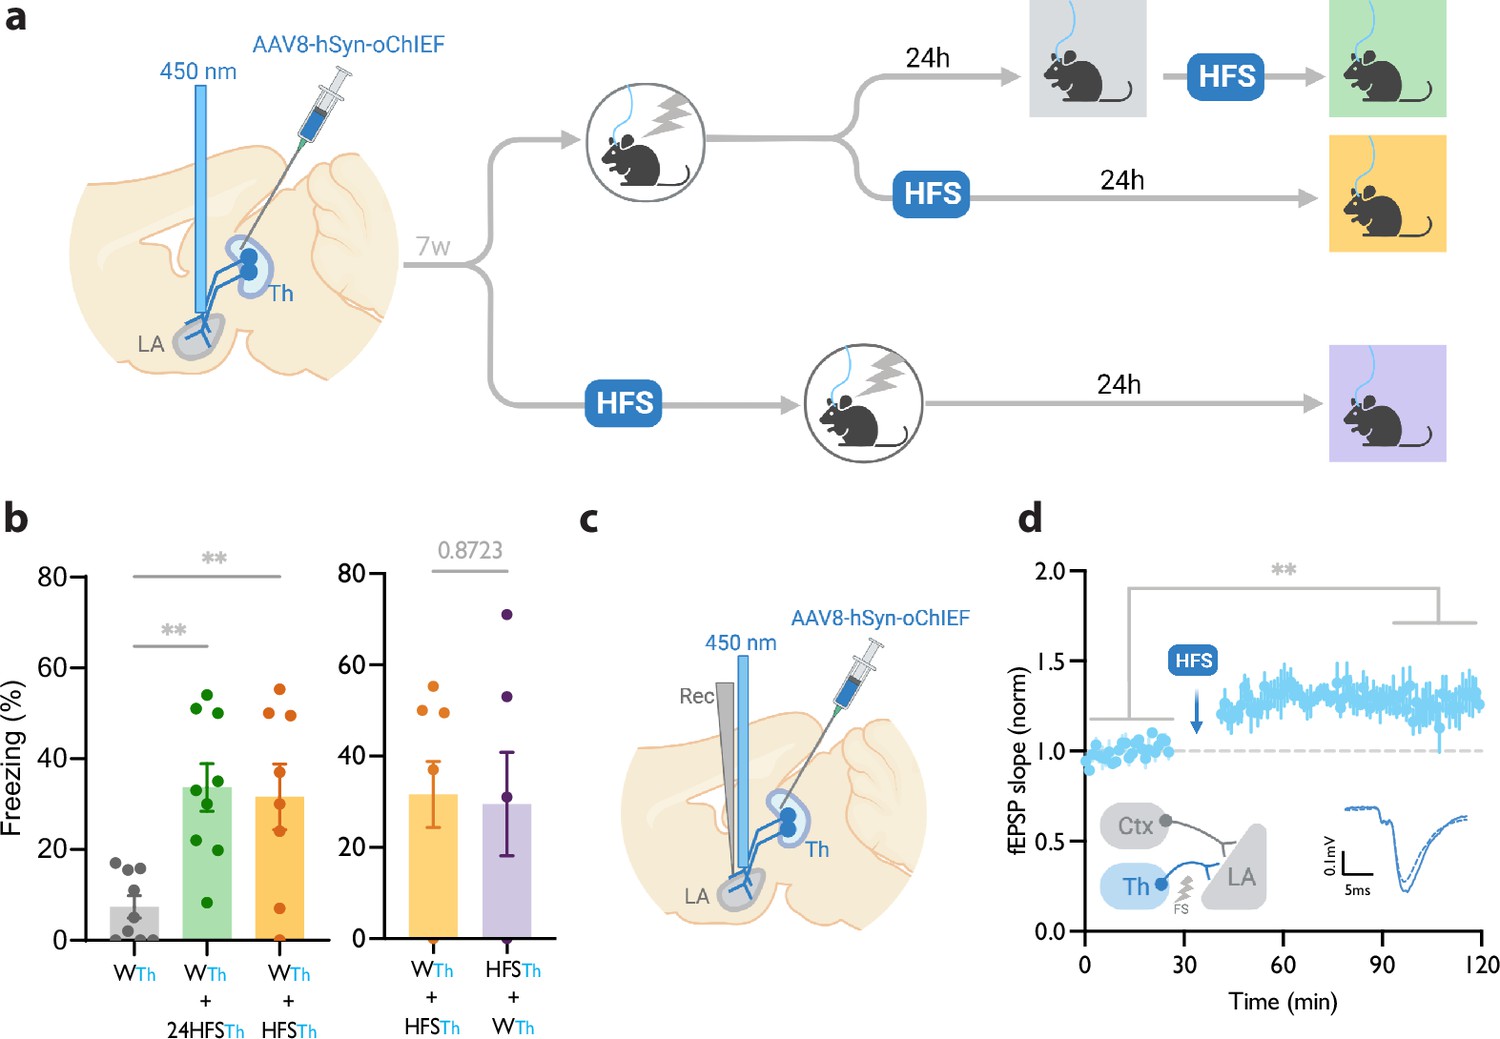
Homosynaptic long-term potentiation (LTP) stimulus minutes before, after, or 24 hr after a weak associative conditioning produces lasting memory.
(a) Diagram showing the experimental timeline. (b) Left: High frequency stimulation (HFS) of the thalamic inputs (Th) to the lateral amygdala (LA) applied either 24 hr (WTh + 24hHFSTh, corresponding to panel a, top branch), or immediately after a weak thalamic associative conditioning (WTh + HFSTh, corresponding to panel a, middle branch), significantly increased the CS-evoked freezing (n=9; One-way ANOVA, FInteraction (2, 23)=8.202, p-value = 0.0020). Right: HFS of the thalamic input immediately before (HFSTh + WTh, corresponding to panel a, bottom branch) (n=6) or after a weak associative conditioning (n=8) (WTh + HFSTh, corresponding to panel a, middle branch) is equally effective in increasing the CS-evoked freezing. Colors of the bar graphs represent the experimental protocols for each group of mice (colored boxes in panel a). Subscripts with blue font indicate stimulation of the blue-shifted channelrhodopsin oChIEF using the selective procedure. (c) Diagram showing the experimental setup of the in vivo electrophysiology recording (Rec) in anesthetized mice. Evoked field EPSP was produced by blue light stimulation (450 nm) of thalamic inputs expressing oChIEF. (d) Plot of average in vivo field EPSP slope (normalized to baseline period) in the LA before and after HFS (n=5). Right inset: Superimposed traces of in vivo field responses to single optical stimulus before (dashed line) and after (solid line) HFS. Scale bar, 0.1 mV, 5 ms. Results are reported as mean ± S.E.M. **p<0.01. Ctx: Cortical input; Th: Thalamic input; LA: lateral amygdala; HFS: High Frequency Stimulation; EPSP: excitatory postsynaptic potential; WTh: Recall session after a weak thalamic associative conditioning.
© 2024, BioRender Inc. Figure 1 was created using BioRender, and is published under a CC BY-NC-ND license. Further reproductions must adhere to the terms of this license.
Figure 1—figure supplement 1
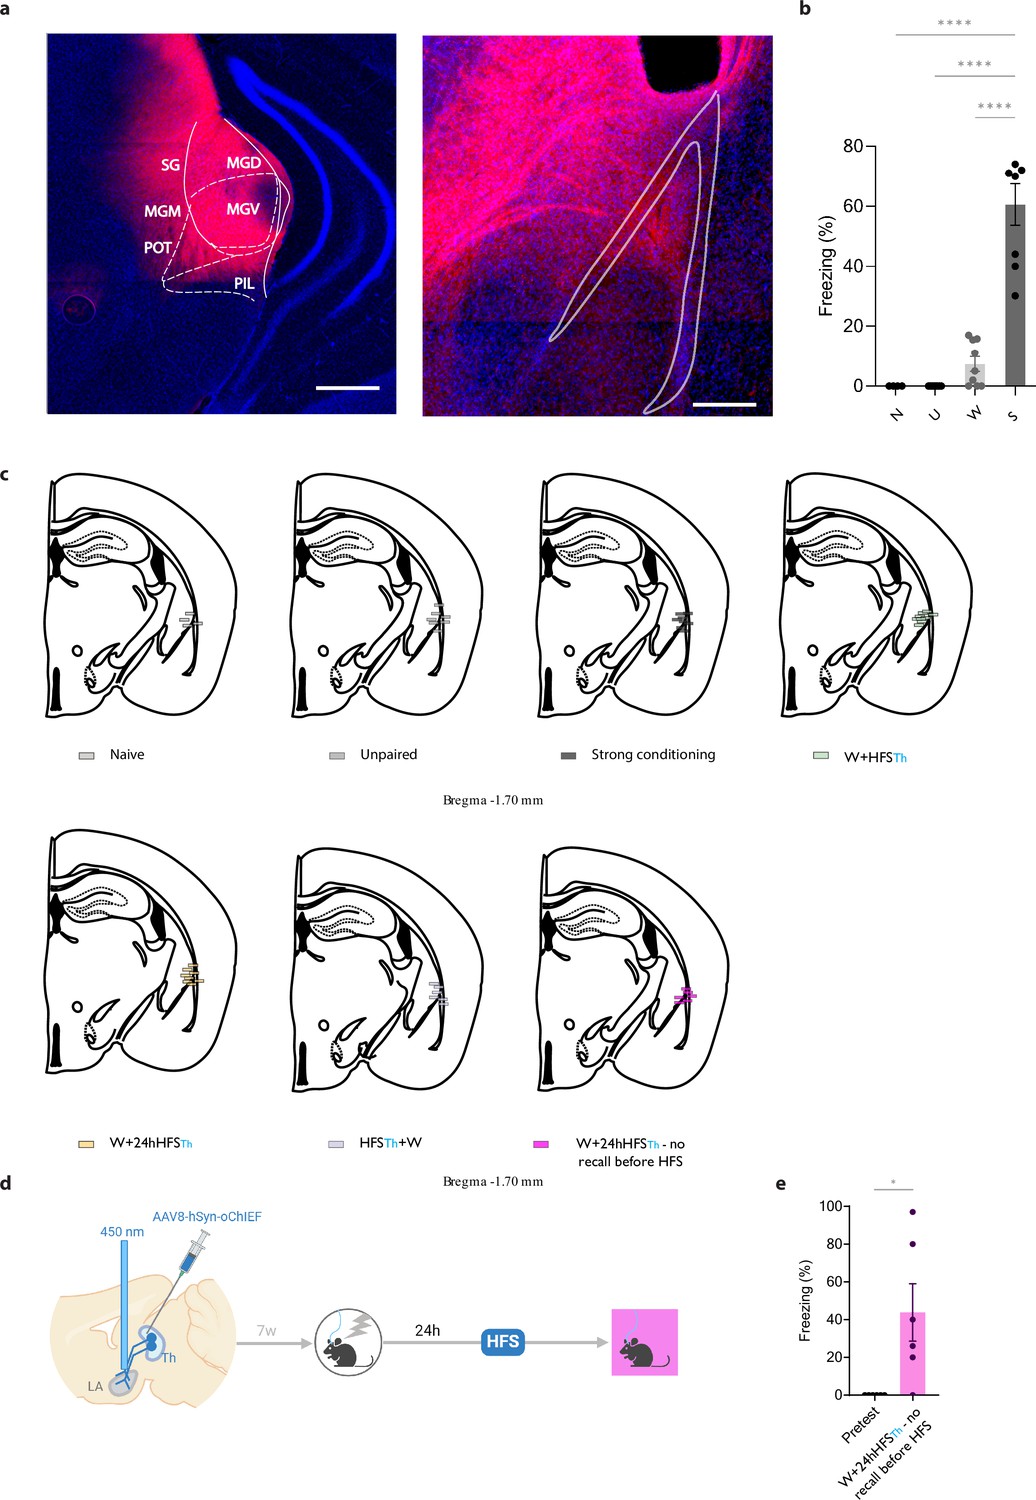
Effect of optical thalamic conditioning protocol and modulation by homosynaptic LTP.
(a) Representative image of a coronal section of mice expressing AAV-oChIEF-tdTomato in the lateral thalamus (Left). Scale bars, 1 mm. Axonal expression of AAV-oChIEF-tdTomato in lateral amygdala (Right). Scale bars, 500 μm. (b) The conditioned response (CR) is significantly higher after strong conditioning (n=8) compared to weak conditioning (n=9), and unpaired conditioning (n=7). Optical CS alone did not elicit any CR (n=4; Two-way ANOVA, FInteraction (3, 16)=34,68, p-value <0.0001). (c) Optic fiber placement of individual mice from Figure 1. (d) Diagram showing the experimental timeline. (e) The CR is significantly higher upon testing immediately after homoLTP induction (n=6; paired t-test, p-value = 0.0347). Results are reported as mean ± S.E.M. *p<0.05;****p<0.0001.
© 2024, BioRender Inc. Figure 1-figure supplement 1 was created using BioRender, and is published under a CC BY-NC-ND license. Further reproductions must adhere to the terms of this license.
Figure 2
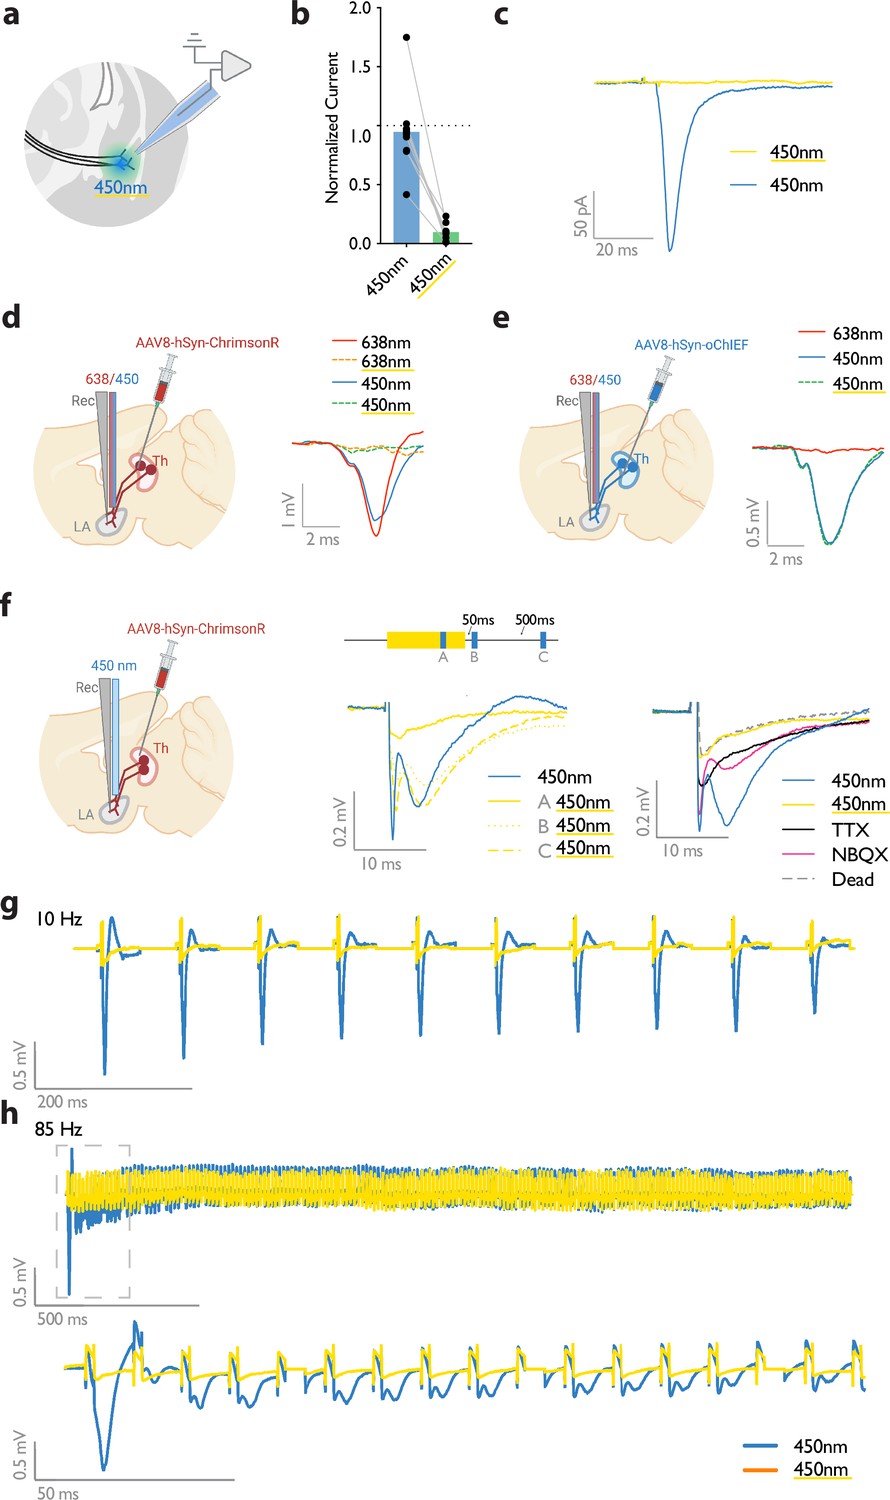
Submilliwatt yellow light renders a red-shifted channelrhodopsin insensitive to blue light.
(a) Diagram showing ex vivo electrophysiology recordings in slices where ChrimsonR-expressing thalamic inputs to the lateral amygdala (black lines) were optically activated. Synaptic responses were evoked by pulses of 450 nm blue light (450 nm), or pulses of blue light co-illuminated with a 561 nm yellow light pulse (co-illumination). (b, c) Bar graph (normalized to blue light [450 nm] stimuli) (b), and example recording (scale bar, 50 pA, 20ms) (c), of optically driven synaptic responses to pulses of blue light (450 nm) or pulses of blue light co-illuminated with yellow light (450 nm with yellow underline). (d) Left: Diagram showing the experimental set up of electrophysiology recordings in freely moving mice where ChrimsonR-expressing thalamic inputs (Th) to the lateral amygdala (LA) were optically activated. Right: Comparison of a representative waveform average of the response to pulses of red light (638 nm), pulses of red light co-illuminated with a 500 ms yellow light pulse (638 nm with yellow underline), pulses of blue light (450 nm), and pulses of blue light co-illuminated with a 500 ms yellow light pulse (450 nm with yellow underline) (scale bar, 1 mV, 2 ms; n=3). (e) Left: Diagram showing the experimental set up of electrophysiology recordings in freely moving mice where oChIEF-expressing thalamic inputs (Th) to the lateral amygdala (LA) were optically activated. Right: Comparison of a representative waveform average of the response to pulses of red light (638 nm), pulses of blue light (450 nm), and pulses of blue light co-illuminated with a 500ms yellow light pulse (450 nm with yellow underline) (scale bar, 0.5 mV, 2 ms; n=3). (f) Left: Diagram showing the experimental setup of electrophysiology recordings in anesthetized mice where ChrimsonR-expressing thalamic inputs (Th) to the lateral amygdala (LA) were optically activated. Middle: Comparison of a representative waveform average of the response to pulses of blue light (450 nm), pulses of blue light co-illuminated with a 500 ms yellow light pulse (A), pulses of blue light following the yellow light pulse by 50 ms (B), or 500ms (C) (n=4). Right: Comparison of the waveform average responses to pulses of blue light (450 nm), pulses of blue light co-illuminated with a 500 ms yellow light pulse (450 nm with yellow underline), and pulses of blue light after sequentially applying NBQX and TTX, and later in a euthanized mouse (Dead), (n=4). Scale bar, 0.2 mV, 10 ms. (g, h) Representative traces for 10 Hz (g) and 85 Hz (h) stimulation of ChrimsonR-expressing thalamic inputs to the lateral amygdala, which were activated with blue light (450 nm, in blue). Yellow traces are the represantative evoked responses of the inputs to 10 Hz (g) and 85 Hz (h) blue light stimulation (450 nm) co-illuminated with a 561nm yellow light pulse (n=3).
© 2024, BioRender Inc. Figure 2 was created using BioRender, and is published under a CC BY-NC-ND license. Further reproductions must adhere to the terms of this license.
Figure 3 with 1 supplement
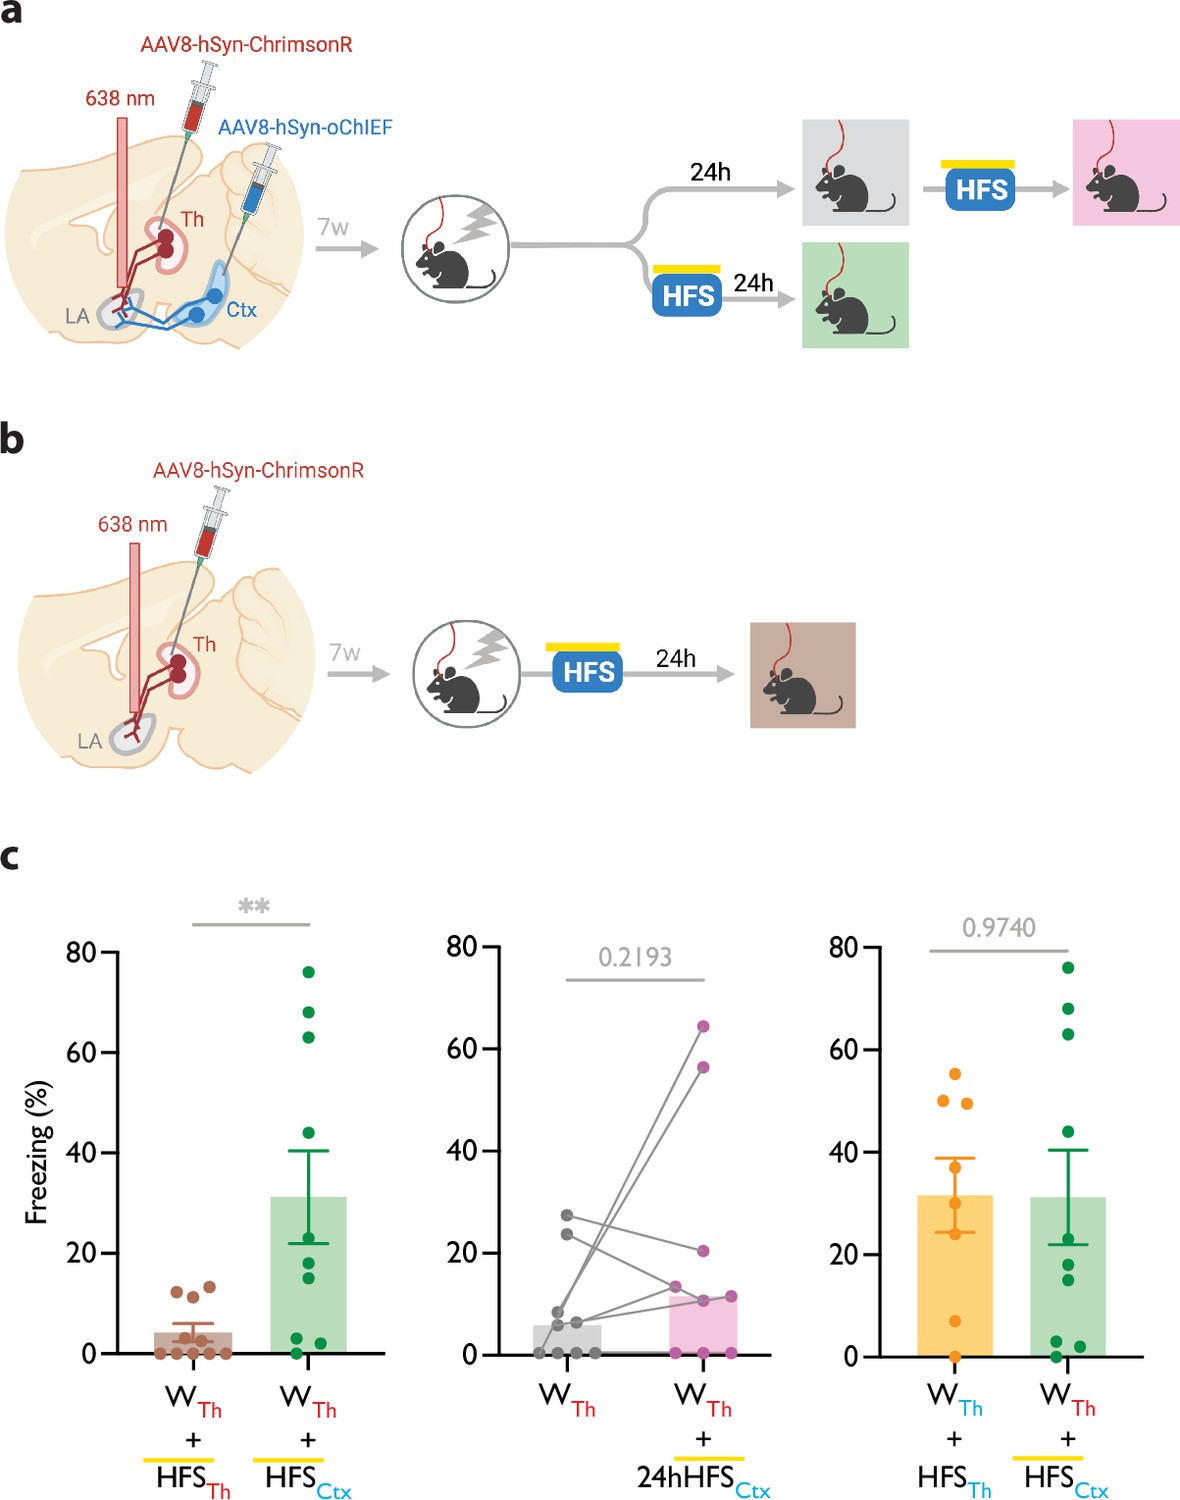
Heterosynaptic long-term potentiation (LTP) stimulus produces lasting memory if delivered within minutes after a weak associative conditioning.
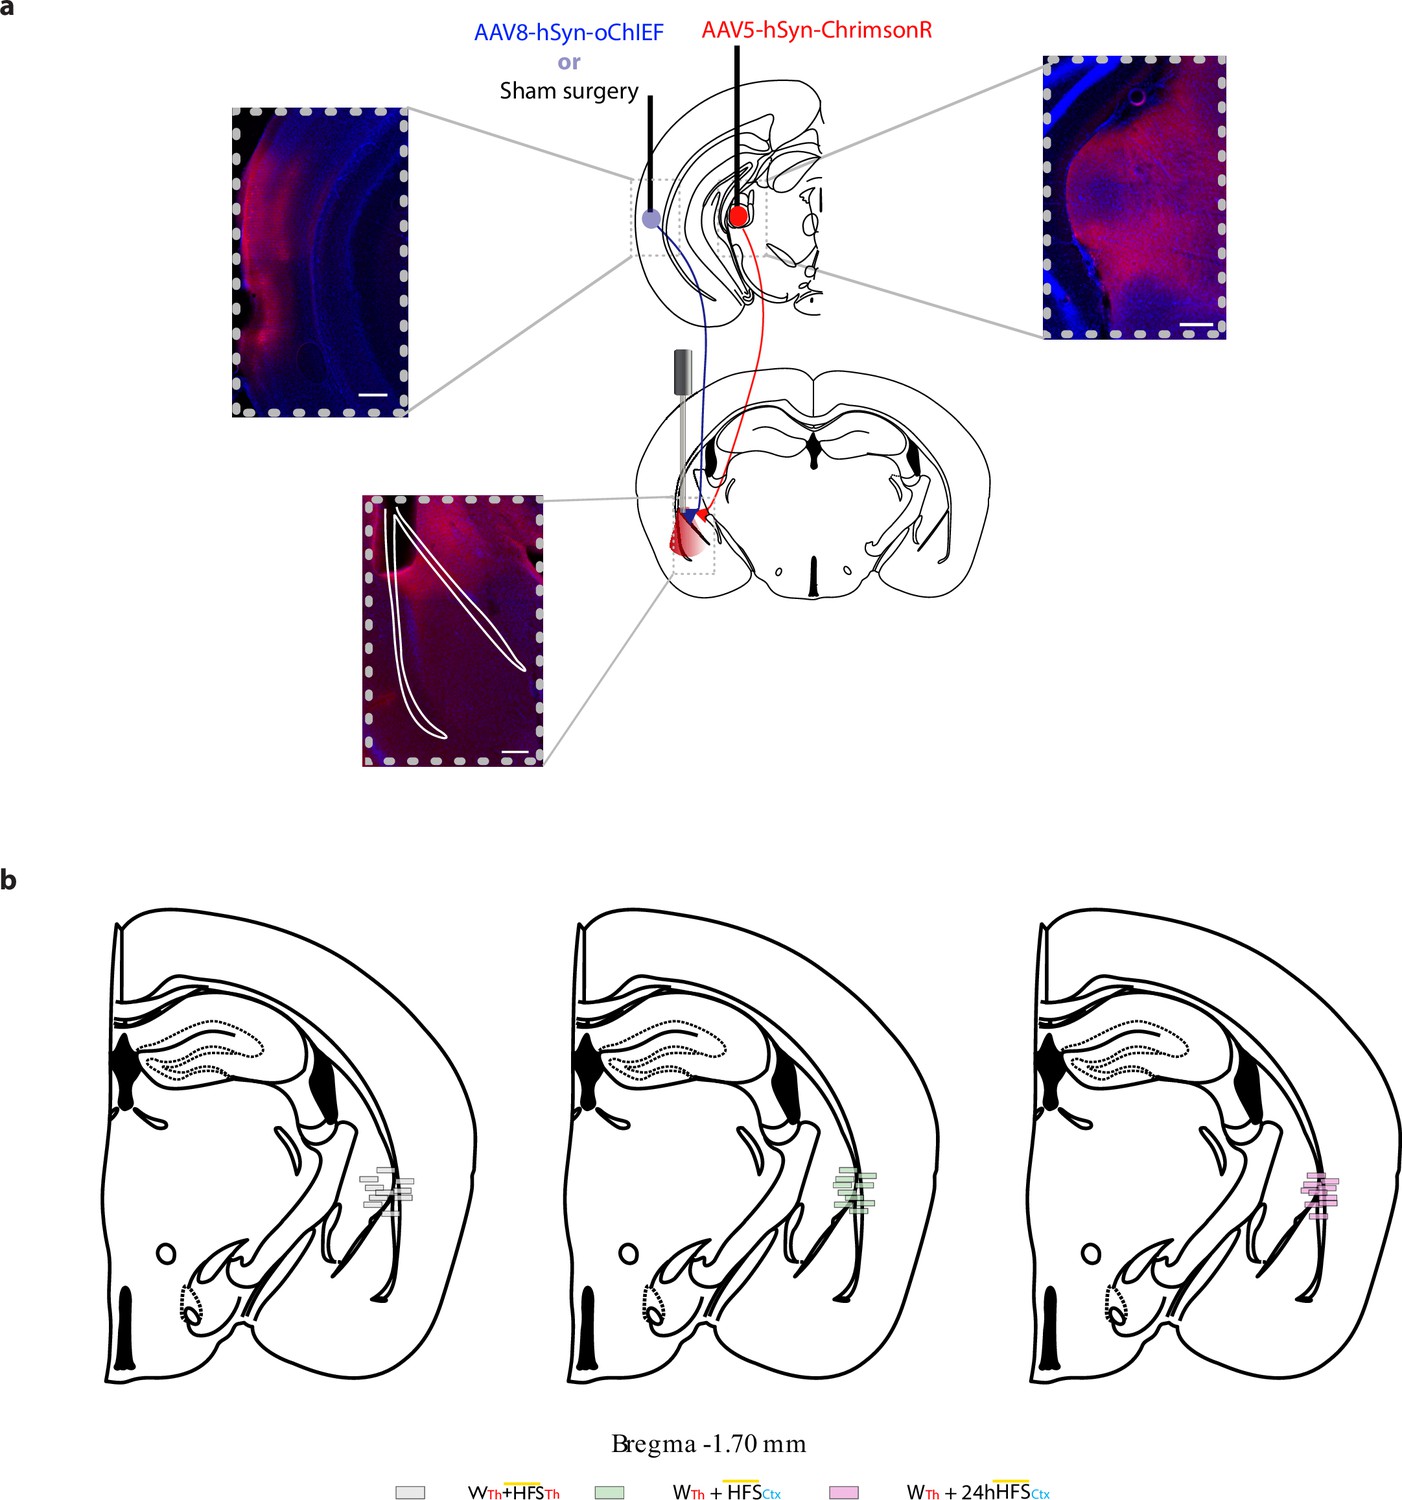
(a, b) Diagram showing the experimental timeline of the heterosynaptic LTP protocol manipulation following a weak thalamic associative conditioning. HFS with yellow upperline indicates that the delivery of high frequency stimulation with blue light overlapped with long pulses of yellow light. This co-illumination prevents the activation of ChrimsonR-expressing thalamic inputs (Th) by blue light, while the oChIEF-expressing cortical inputs remain unaffected. Note that yellow light specifically renders ChrimsonR, and not oChIEF, insensitive to blue light. (c) Left: High frequency stimulation (HFS) of the thalamic input expressing ChrimsonR immediately following a weak associative conditioning on the same input (WTh + HFSTh, corresponding to panel b) (n=9) was ineffective in producing the CS-evoked freezing. HFS with yellow upperline indicates that HFS with blue light overlapped with long pulses of yellow light. This was to prevent the activation of ChrimsonR-expressing thalamic inputs by blue light, as described above and detailed in Figure 2. The same HFS protocol in mice that additionally, expressed oChIEF in the cortical inputs (WTh + HFSCtx, corresponding to panel a, bottom branch) (n=10), significantly increased the CS-evoked freezing (heterosynaptic LTP) (Unpaired t-test, p-value = 0.0100). Middle: HFS on the cortical input, induced 24 hr after a weak associative conditioning (WTh + 24hHFSCtx, corresponding to panel a, top branch) was ineffective in producing the CS-evoked freezing. (n=9; Paired t-test, p-value = 0.2193). Right: Comparison of the effect of homosynaptic LTP protocol (WTh +HFSTh) (same dataset from Figure 1b) and heterosynaptic LTP protocol (WTh +HFSCtx) (same dataset from panel c, left) (Unpaired t-test, p-value = 0.9740). Results are reported as mean ± S.E.M. **p<0.01. Subscripts with red font and blue font indicate stimulation of the red-shifted channelrhodopsin ChrimsonR and the blue-shifted channelrhodopsin oChIEF, respectively.
© 2024, BioRender Inc. Figure 3 was created using BioRender, and is published under a CC BY-NC-ND license. Further reproductions must adhere to the terms of this license.
Figure 3—figure supplement 1
Viral expression and optic fiber location in mice from Figure 3.
(a) Representative image of a coronal section of mice expressing AAV-oChIEF-tdTomato in the LA-projecting cortical region and AAVChrimsonR-tdTomato in the LA-projecting thalamic region. Scale bars, 1 mm. Axonal expression of AAV-oChIEF-tdTomato and AAVChrimsonR-tdTomato in lateral amygdala. Scale bars, 500 μm. (b) Optic fiber placement of individual mice from Figure 2.
Figure 4 with 2 supplements
Homosynaptic and heterosynaptic long-term potentiation (LTP) protocols produce lasting memory when applied within minutes after a non-associative conditioning.
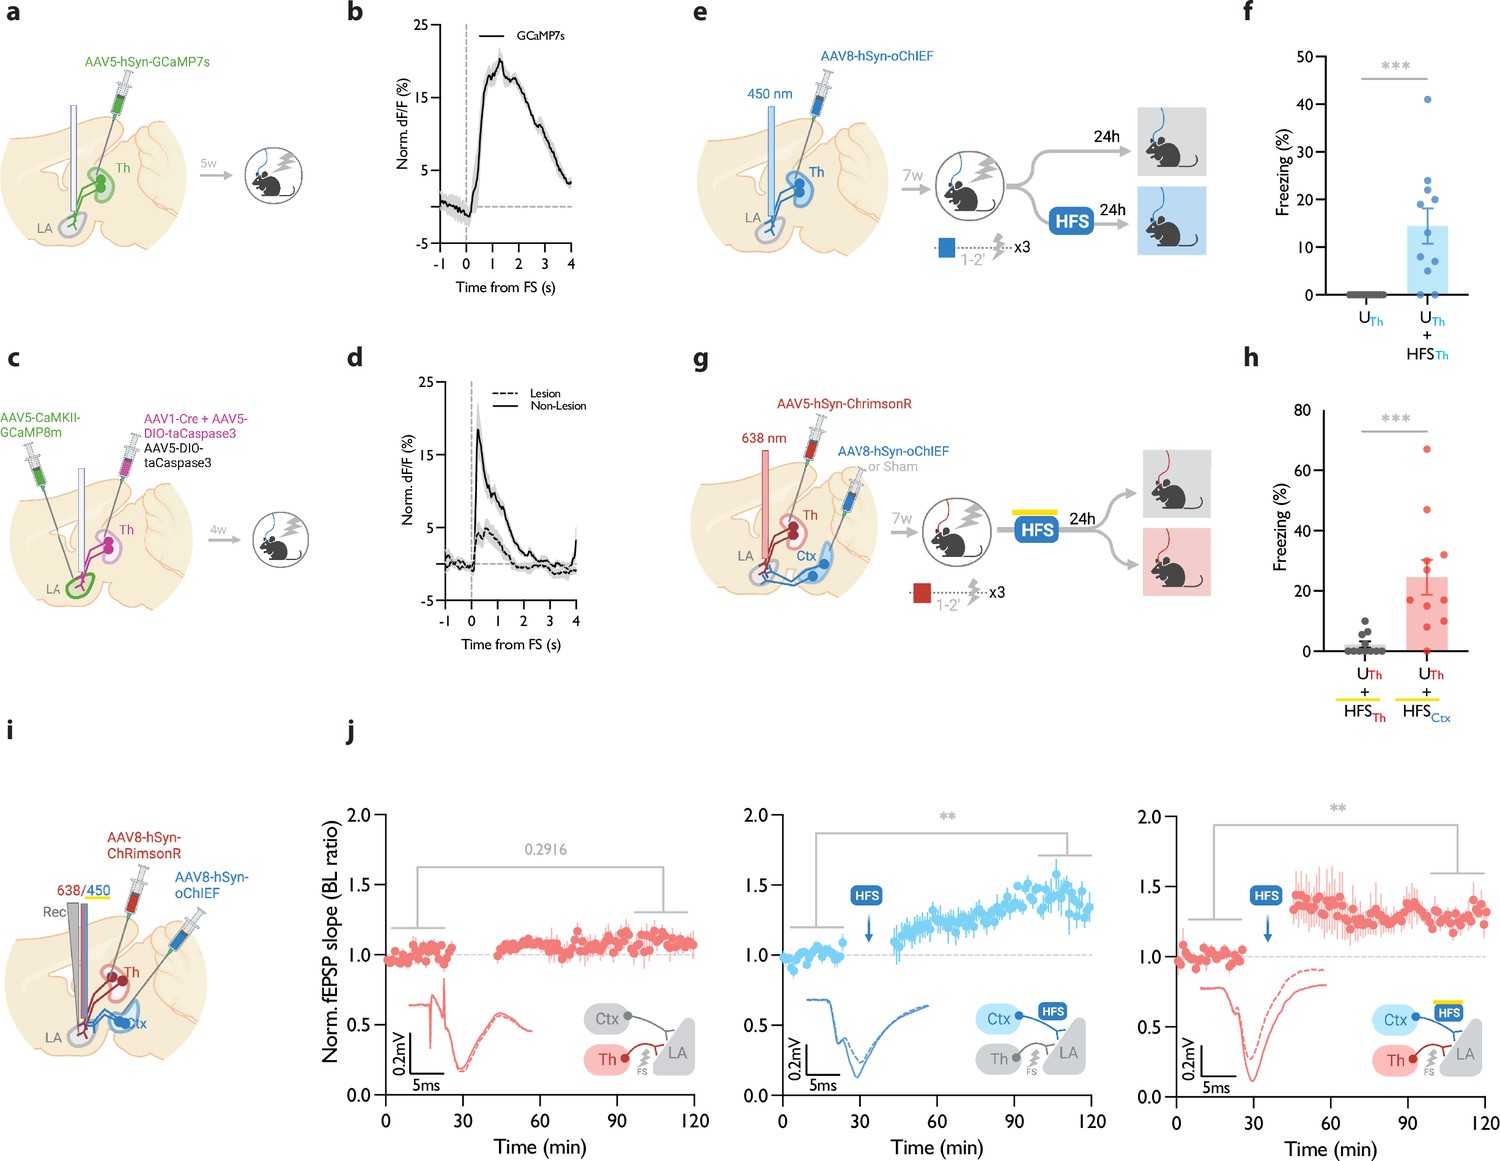
(a) Diagram showing the experimental timelines for fiber photometry from thalamic inputs (Th) expressing GCaMP7s. (b) Averaged trace of the thalamic input activity in response to footshock (onset indicated by the dotted line), n=5. (c) Diagram showing the experimental timelines for fiber photometry from the lateral amygdala (LA) neurons expressing GCaMP8m with intact or lesioned thalamic inputs. (d) Averaged trace of the LA neurons activity in response to footshock (onset indicated by the dotted line) in mice with lesion (dash line) or no lesion (solid line) in the lateral thalamus (Th), n=6 per group. (e) Diagram showing the experimental timelines of the homosynaptic LTP protocol manipulation following an unpaired thalamic conditioning. (f) Unpaired conditioning on the thalamic inputs (UTh, corresponding to panel e, top branch) produced no CS-evoked freezing, while if unpaired conditioning was immediately followed by high frequency stimulation (HFS) on the same inputs (UTh + HFSTh, corresponding to panel e, bottom branch) it significantly increased the CS-evoked freezing (homosynaptic LTP), (n=11 per group; Mann-Whitney test, p-value = 0.0002). Subscripts with blue font indicate stimulation of the blue-shifted channelrhodopsin oChIEF using the selective procedure. (g) Diagram showing the experimental timelines of the heterosynaptic LTP protocol manipulation following an unpaired thalamic conditioning. (h) High frequency stimulation (HFS) of the thalamic input expressing red-shifted channelrhodopsin ChrimsonR immediately following an unpaired conditioning on the same input (UTh + HFSTh, corresponding to panel g, top branch) was ineffective in producing the CS-evoked freezing, while the same protocol in mice that, in addition, expressed oChIEF in the cortical inputs (UTh + HFSCtx, corresponding to panel g, bottom branch), significantly increased the CS-evoked freezing (heterosynaptic LTP) n=11 per group; Mann-Whitney test, p-value = 0.0002. During HFS, blue light pulses overlapped with long pulses of yellow light. This co-illumination prevents the activation of ChrimsonR-expressing thalamic inputs (Th) by blue light, while the oChIEF-expressing cortical inputs remain unaffected. Note that yellow light specifically renders ChrimsonR, and not oChIEF, insensitive to blue light. Subscripts with red font and blue font indicate stimulation of the red-shifted channelrhodopsin ChrimsonR and the blue-shifted channelrhodopsin oChIEF, respectively. (i) Diagram showing the experimental setup of the in vivo electrophysiology recordings (Rec) in anesthetized mice where the thalamic input expressing ChrimsonR and/or cortical input expressing oChIEF were optically activated independently. (j) Left: Plot of average in vivo field EPSP slope (normalized to baseline period) in LA evoked by optical activation of thalamic inputs, before and after footshock delivery (n=5; Paired t-test, p-value = 0.2916). Middle: Plot of average in vivo field EPSP slope (normalized to baseline period) in LA evoked by optical activation of cortical inputs (Ctx), before and after high frequency stimulation (HFS) of these inputs (n=6; Paired t-test, p-value = 0.0031). Right: Plot of average in vivo field EPSP slope (normalized to baseline period) in LA evoked by optical activation of thalamic inputs (Th), before and after HFS delivery on the cortical inputs (heterosynaptic LTP) (n=5; Paired t-test, p-value = 0.0074). HFS with yellow upperline indicates that the delivery of high frequency stimulation with blue light overlapped with long pulses of yellow light. This co-illumination prevents the activation of ChrimsonR-expressing thalamic inputs (Th) by blue light, while the oChIEF-expressing cortical inputs remain unaffected. Superimposed traces of in vivo field response to single optical stimulus before (dash line) and after (solid line) the induced protocols. Results are reported as mean ± S.E.M. **p<0.01; ***p<0.001. Scale bars, 0.2 mV, 5 ms.
© 2024, BioRender Inc. Figure 4 was created using BioRender, and is published under a CC BY-NC-ND license. Further reproductions must adhere to the terms of this license.
Figure 4—figure supplement 1
Viral expression and optic fiber location in mice from Figure 4a and c.
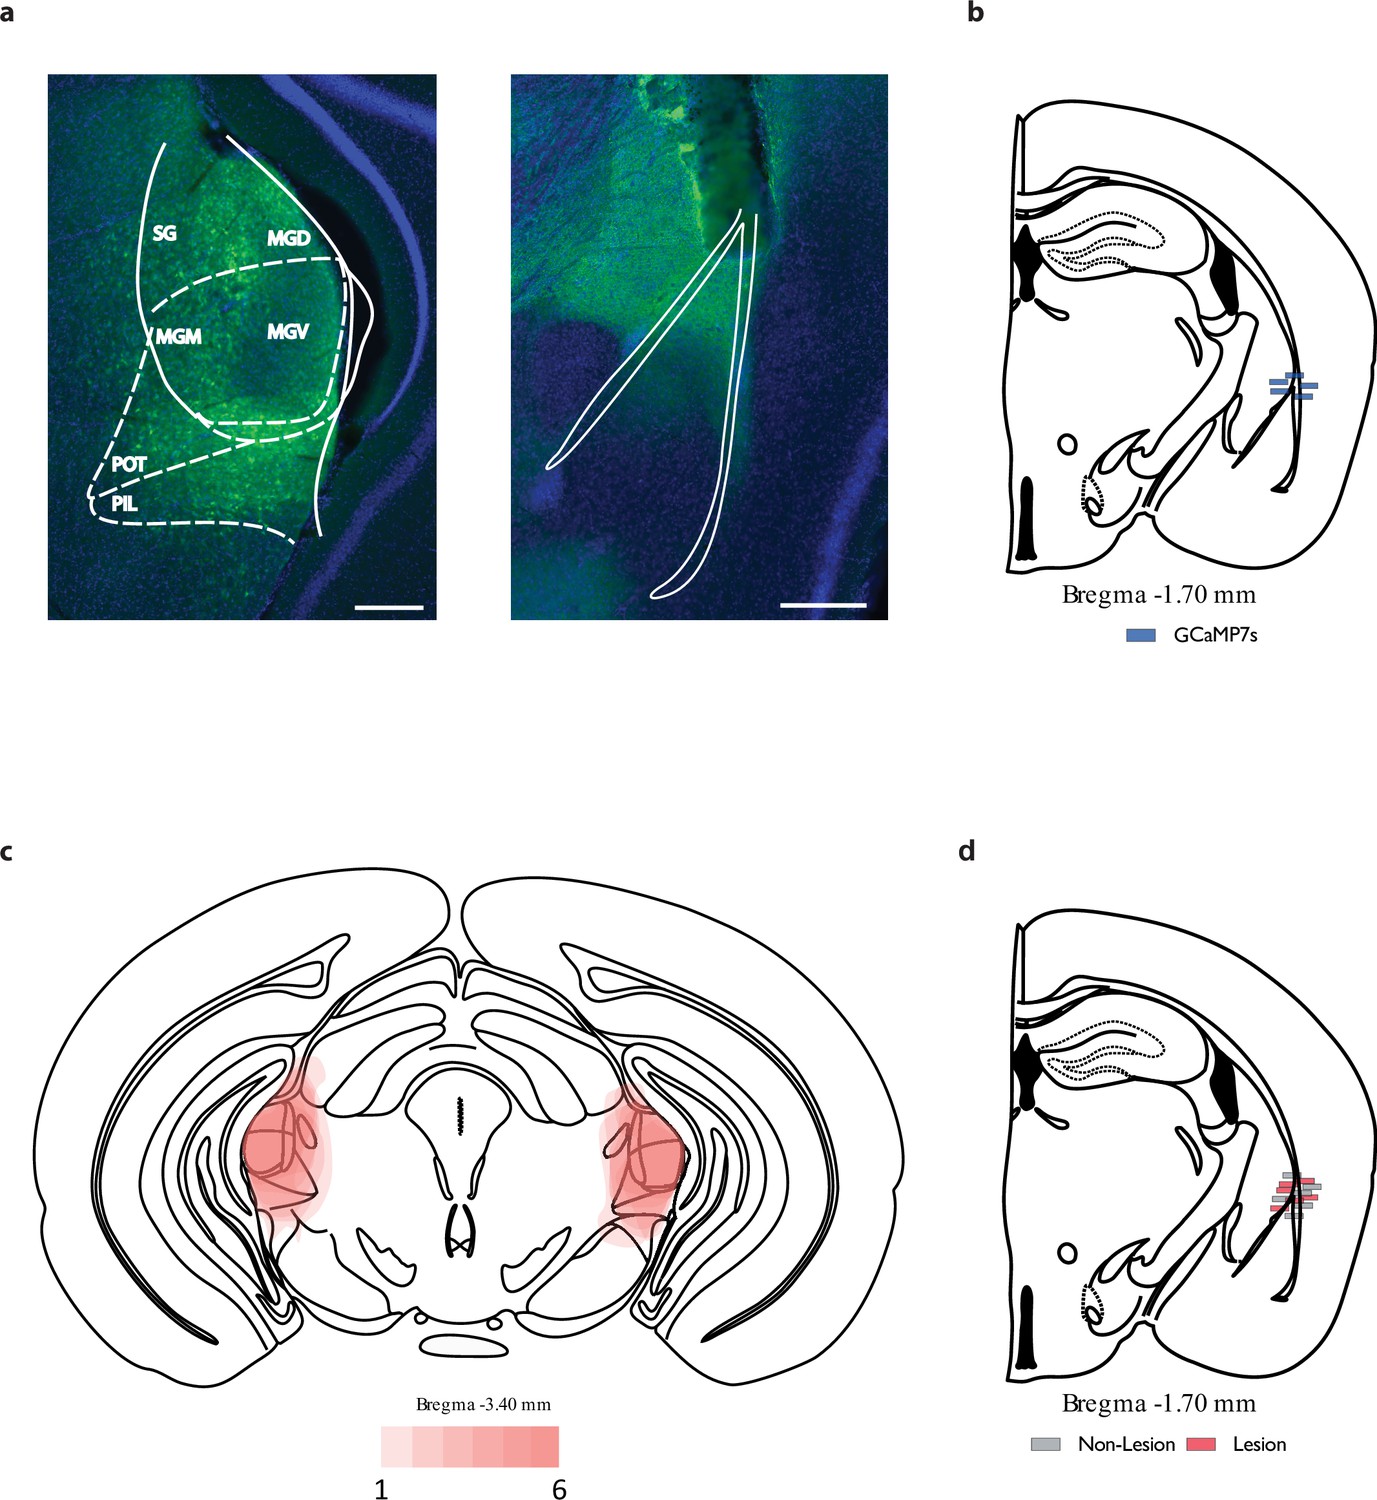
(a) Representative image of a coronal section of mice expressing AAV-GCaMP7s in the lateral thalamus (Left). Scale bars, 1 mm. Axonal expression of AAV-GCaMP7s in lateral amygdala. Scale bars, 500 μm. (b) Optic fiber placement of indi-vidual mice from Figure 3. (c) Overlay of the maximum extent of the lesion in the thalamic-lesioned group (n=6). (d) Optic fiber placement of individual mice from Figure 3f and h.
Figure 4—figure supplement 2
Effect of homosynaptic HFS on unpaired conditioning and unprimed heterosynaptic HFS.
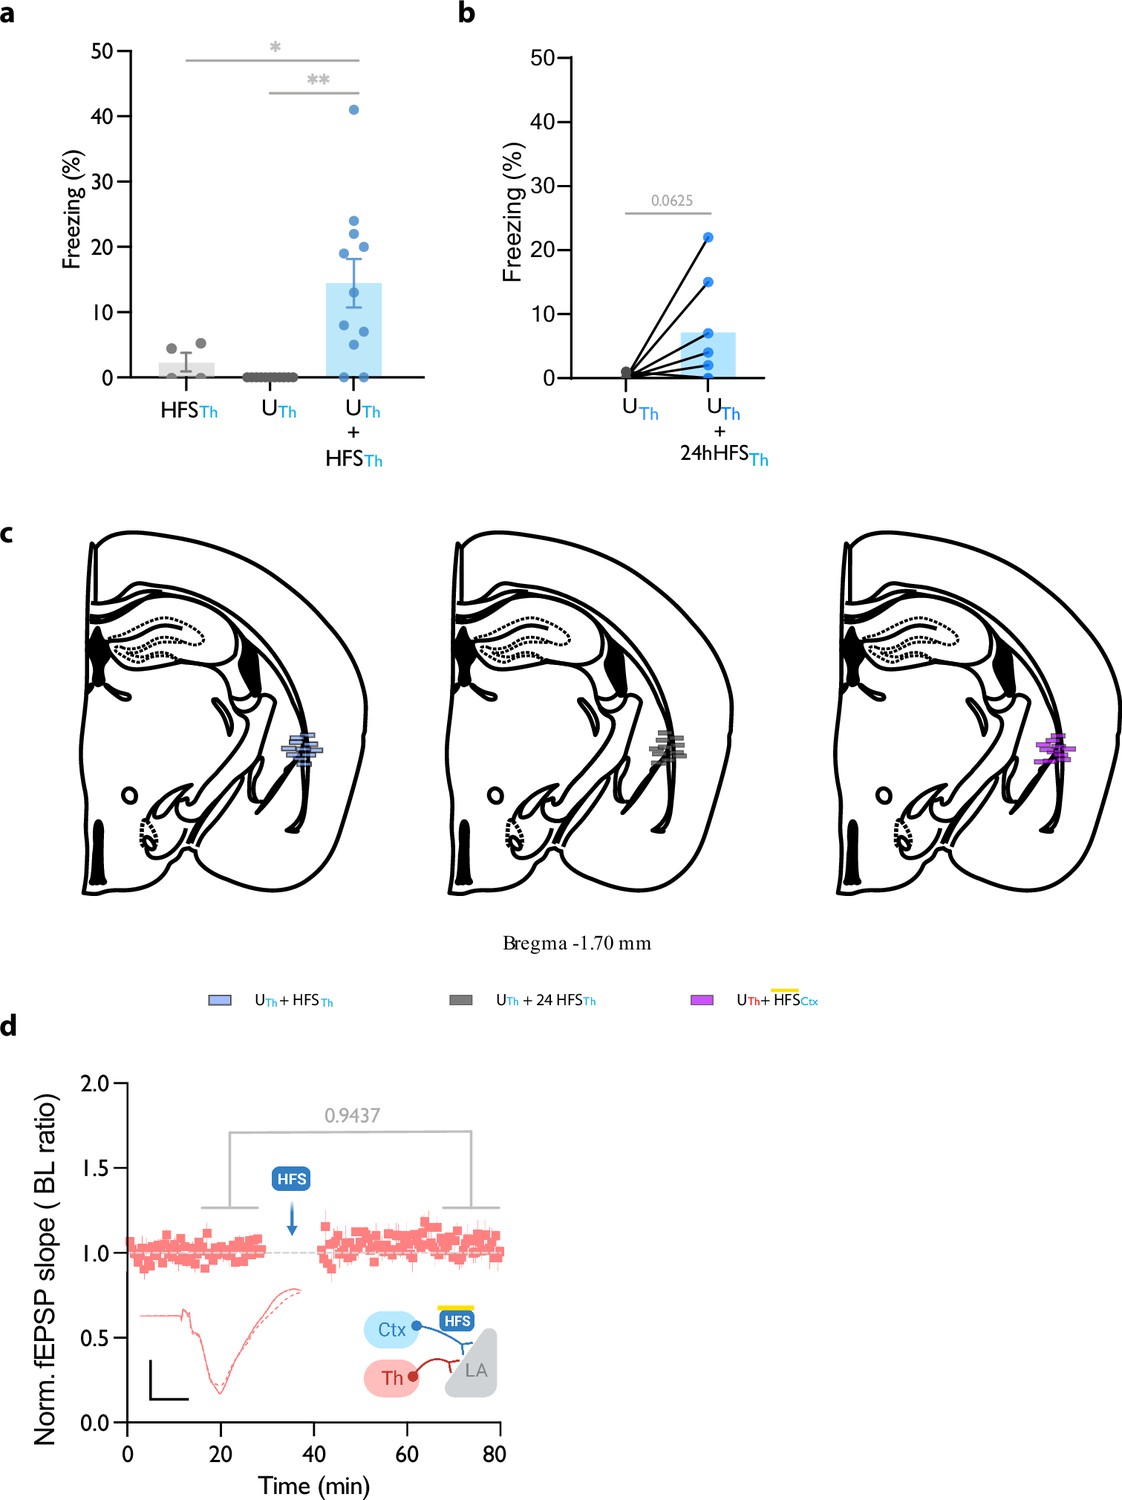
(a) Comparison of the freezing levels evoked by high frequency stimulation of the thalamic input in naive mice (HFSTh, n=4) compared to mice subjected to unpaired conditioning (U; n=11) and to unpaired conditioning filled by high-frequency stimulation (HFS) (U+HFSTh, n=11; Two-way ANOVA, FInteraction (2,12)=10.04, p-value = 0.0027). (b) A paired comparison of the freezing levels evoked by thalamic axons activation when the thalamic LTP is applied 24 hr after the unpaired conditioning. the (n=7, Wilcox test, p-value = 0.0625). (c) Optic fiber placement of individual mice from Figure 3. Results are reported as mean ± S.E.M. *p<0.05; **p<0.01. (d) Plot of average in vivo field EPSP slope (normalized to baseline period) in LA evoked by optical activation of thalamic inputs (Th), before and after HFS delivery on the cortical inputs (heterosynaptic LTP) in absence of foot shock delivery (n=4; Paired t-test, p-value=0.9437). Sclae bar, 0.2 mV, 5 ms.
Figure 5 with 1 supplement
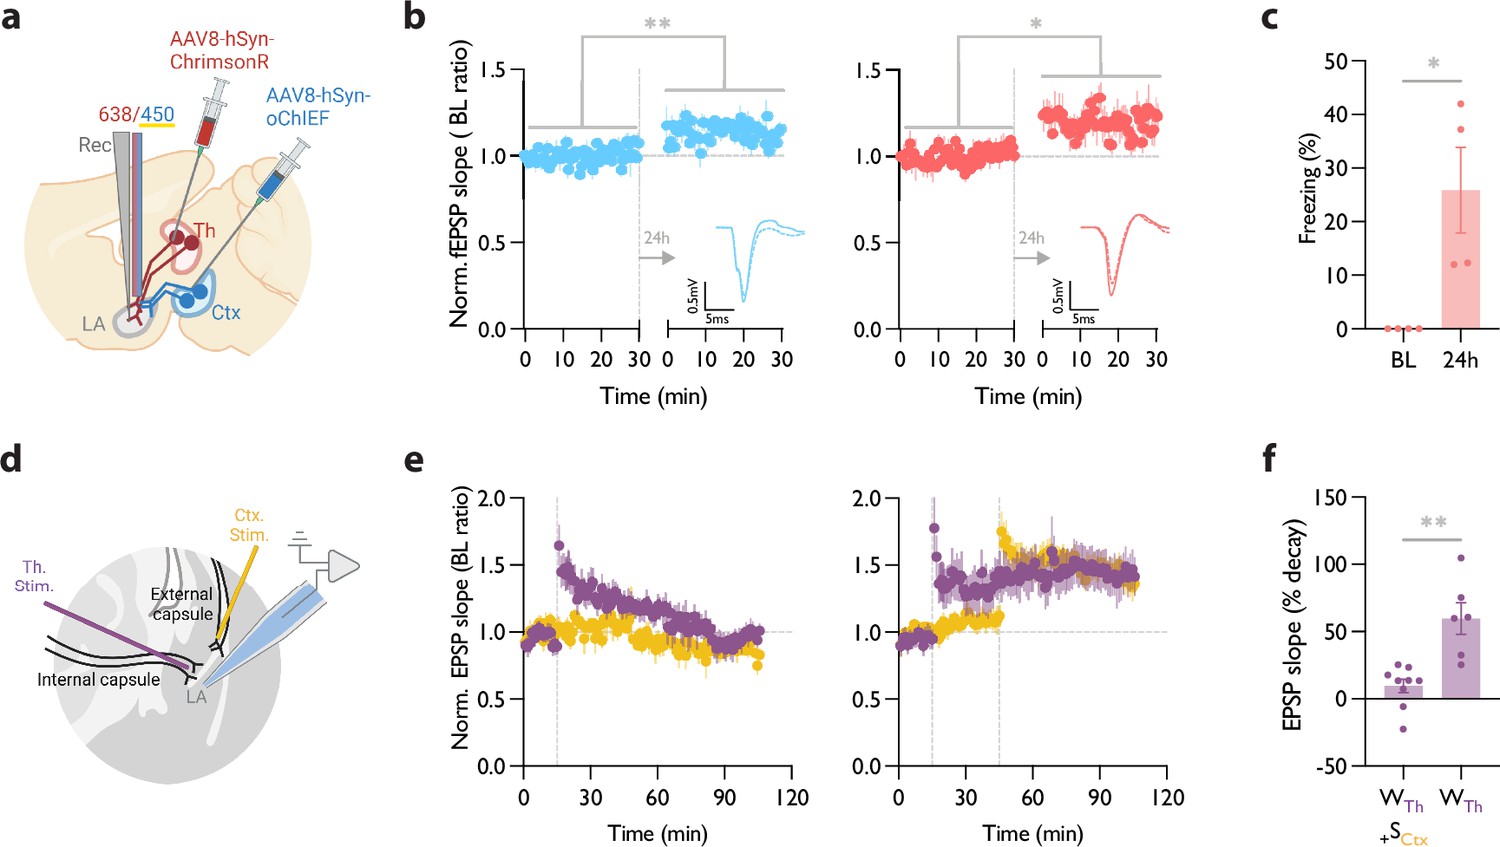
Heterosynaptic long-term potentiation (LTP) protocol when applied within minutes after a weak associative conditioning produces a long-lasting memory accompanied by the synaptic potentiation of the conditioned inputs.
(a) Diagram showing the experimental setup of the in vivo electrophysiology recordings (Rec) in freely moving mice where the thalamic input expressing ChrimsonR and cortical input expressing oChIEF were optically activated independently. (b) Left: Plot of average in vivo field EPSP slope (normalized to baseline period) in LA evoked by optical activation of cortical inputs, before and 24 hr after a weak thalamic conditioning followed immediately by high-frequency stimulation (HFS) delivery on the same cortical inputs. Right: as left, except field EPSP was evoked by activation of thalamic inputs. The potentiation of the field EPSP of cortical (homosynaptic LTP) (n=4; Paired t-test, p=0.0082) as well as thalamic inputs (heterosynaptic LTP) (n=4; Paired t-test, p=0.0336) is evident 24 hr after the delivery of HFS. Superimposed traces of in vivo field response to single optical stimulus before (dash line) and after (solid line) HFS (Scale bars, 0.5 mV, 5 ms). (c) The behavioral responses of the mice tested for their homo- and hetero-synaptic plasticity in panel b. Note a significant CS-evoked freezing 24 hr after a weak thalamic conditioning followed immediately by HFS delivery on the cortical inputs (heterosynaptic LTP). These mice did not show a CS-evoked freezing prior to the protocol (BL) (n=4; Paired t-test, p=0.0478). (d) Positioning of the stimulating electrodes (Th. Stim and Ctx. Stim.) and the recording electrode. (e) (left) Weak stimulation of the thalamic input (purple circle) results in a transient LTP. No change was observed in the basal synaptic transmission of the cortical input (control pathway, yellow circle). Strong stimulation of the cortical input following the weak stimulation of the thalamic input stabilized synaptic potentiation of the thalamic input (right). Dash line indicates the onset of HFS induction. (f) A paired-comparison of the decay of synaptic potentiation of the thalamic input with (WTh + SCtx) or without (WTh) the strong stimulation of the cortical input. (10 animals, 15 slices; one cell per slice; Welch’s t test, p=0.0062). Results are reported as mean ± S.E.M. *p<0.05; **p<0.01.
© 2024, BioRender Inc. Figure 5 was created using BioRender, and is published under a CC BY-NC-ND license. Further reproductions must adhere to the terms of this license.
Figure 5—figure supplement 1
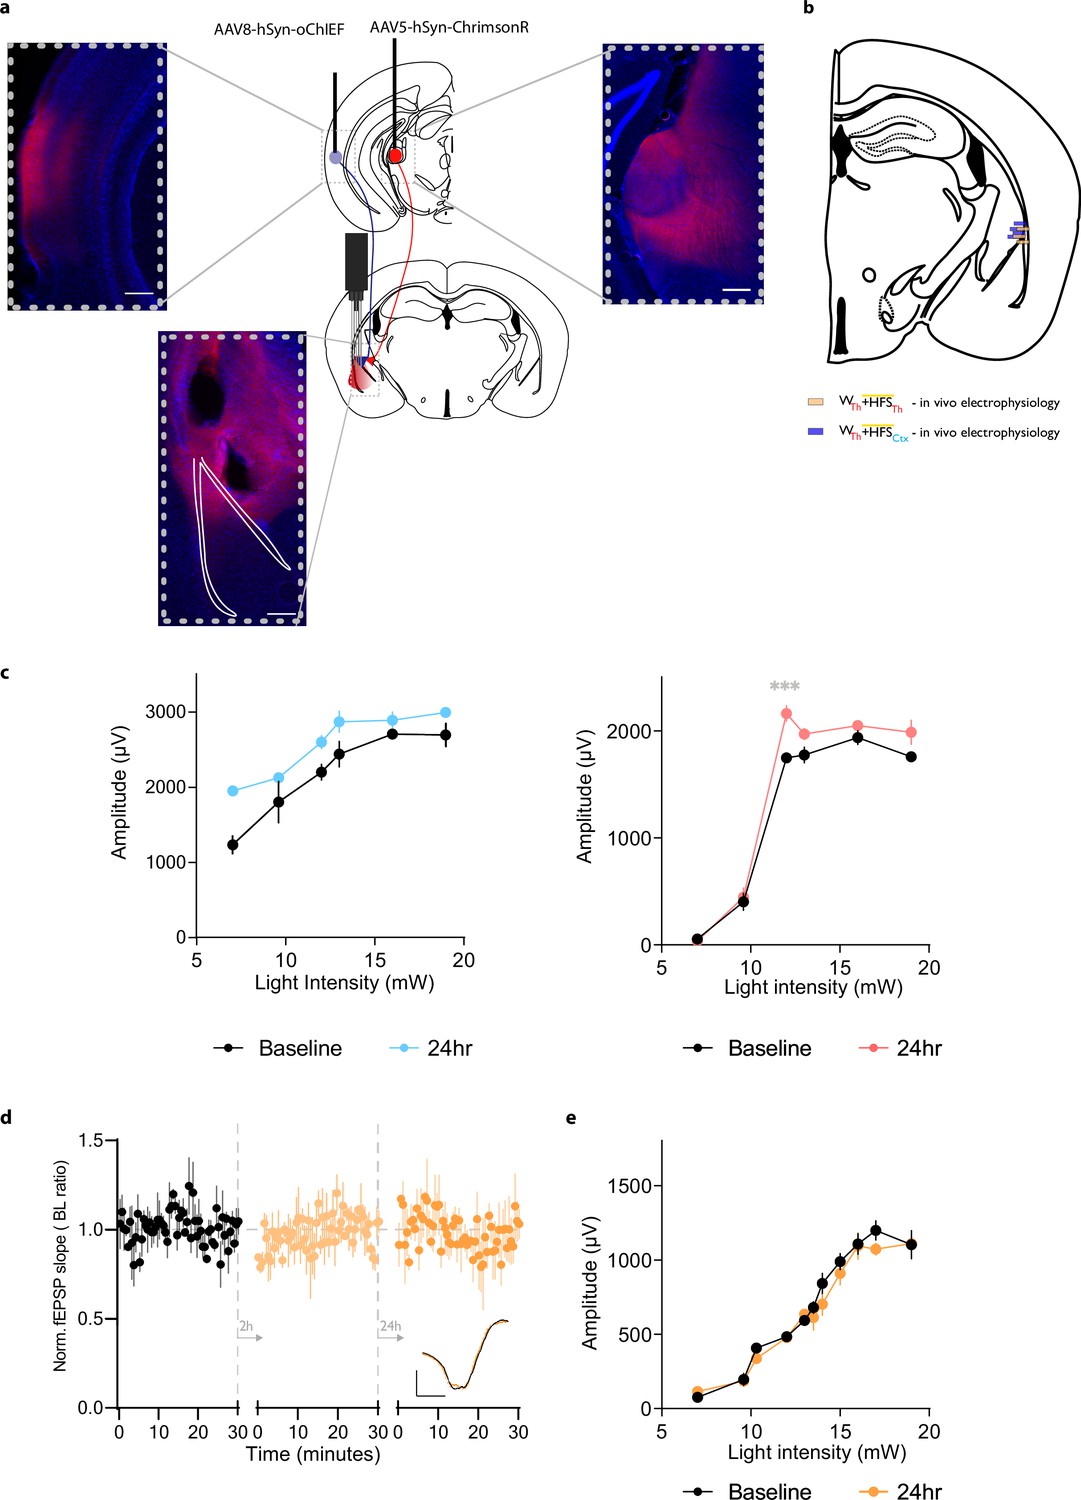
Histological verifications and in vivo freely-moving electrophysiology I/O curves.
(a, b) Diagram and histology of the brain sections showing the AAVs injection sites, and the optetrode implantation sites. Scale bars, 500 um. (c) Representative examples of the EPSP amplitude recorded in the LA by stimulation of cortical axons (left, repeated-measures Two-way RM ANOVA for group by light intensity, F Interaction (5, 20)=2.145 p-value = 0.1017 with Sìdak test correction), and thalamic axons (right, repeated-measures Two-way RM ANOVA for group by light intensity, F Interaction (5, 20)=3.049, p-value = 0.0332 with Sìdak test correction) before and after weak conditioning and cortical long-term potentiation (LTP). (d) Plot of average in vivo field EPSP slope (normalized to baseline period) in LA evoked by optical activation of thalamic inputs before, 2 hr, and 24 hr after a weak thalamic conditioning. In absence of high-frequency stimulation (HFS) of cortical input, there is no change in the field EPSP of thalamic input (n=3; repeated-measures Two-way RM ANOVA for group by time interaction, FInteraction (1.644, 3.288)=0.8228, p-value = 0.4900 with Tukey correction). Superimposed traces of in vivo field response to single optical stimulus before (black line), 2 hr (dash orange line) and 24 hr after (solid orange line) HFS. (e) Representative example of the EPSP amplitude recorded in the LA by stimulation of thalamic axons (repeated-measures Two-way RM ANOVA for group by light intensity, FInteraction (10, 10)=1.235 p-value = 0.3727). Results are reported as mean ± S.E.M. ***p<0.001.
Tables
Key resources table
| Reagent type (species) or resource | Designation | Source or reference | Identifiers | Additional information |
|---|---|---|---|---|
| Antibody | anti-NeuN antibody (Mouse Monoclonal) | Merk Millipore | MAB377 RRID: AB_2298772 | IF (1:500) |
| Antibody | Cy3 Goat anti-Mouse | Thermo Fisher Scientific | A10521 RRID: AB_1500665 | IF (1:500) |
| Other | DAPI | Sigma | D9542 | 5 µg/mL |
| Recombinant DNA reagent | AAV-8/2-hSyn1-oCHIEF_dTomato | VVF | V391-8 | |
| Recombinant DNA reagent | AAV-5/2-hSyn1-chI-jGCaMP7s | VVF | V406-5 | |
| Recombinant DNA reagent | AAV-5/2-mCaMKIIα-jGCaMP8m | VVF | V630-5 | |
| Recombinant DNA reagent | AAV-5/2-hSyn1-chI-ChrimsonR_tdTomato | VVF | V334-5 | |
| Chemical compound, drug | Fentanyl | Hameln | 007007 | |
| Chemical compound, drug | Midazolam | Hameln | 002124 | |
| Chemical compound, drug | Medetomidine | VM Pharma | 087896 | |
| Chemical compound, drug | IsoFlo vet 100% | Zoetis | 37071/4000 | |
| Chemical compound, drug | Urethane | Sigma | U2500 | |
| Chemical compound, drug | NBQX disodium salt hydrate | Sigma | N183 | |
| Chemical compound, drug | Tetrodotoxin citrate | Hellobio | HB1035 | |
| Software, algorithm | GraphPad Prism | GraphPad Software | Version 9 | |
| Software, algorithm | ImageJ | National Institutes of Health | 1.53t | |
| Software, algorithm | Doric Studio | Doric Lenses | 5.4.1.23 | |
| Software, algorithm | MATLAB | MathWorks, Inc. | R2021b | |
| Software, algorithm | Photometry-Signal-Analysis | This paper; NabaviLab-Git, 2024 | https://github.com/NabaviLab-Git/Photometry-Signal-Analysis | Code used for the Fiber photometry analysis. |
Additional files
Download links
A two-part list of links to download the article, or parts of the article, in various formats.
Downloads (link to download the article as PDF)
Open citations (links to open the citations from this article in various online reference manager services)
Cite this article (links to download the citations from this article in formats compatible with various reference manager tools)
Non-Hebbian plasticity transforms transient experiences into lasting memories
eLife 12:RP91421.
https://doi.org/10.7554/eLife.91421.3


