Tuning apicobasal polarity and junctional recycling in the hemogenic endothelium orchestrates the morphodynamic complexity of emerging pre-hematopoietic stem cells
- Department of Developmental and Stem Cell Biology, Institut Pasteur, Université Paris Cité, France
- Sorbonne Université, France
Figures
Figure 1 with 6 supplements
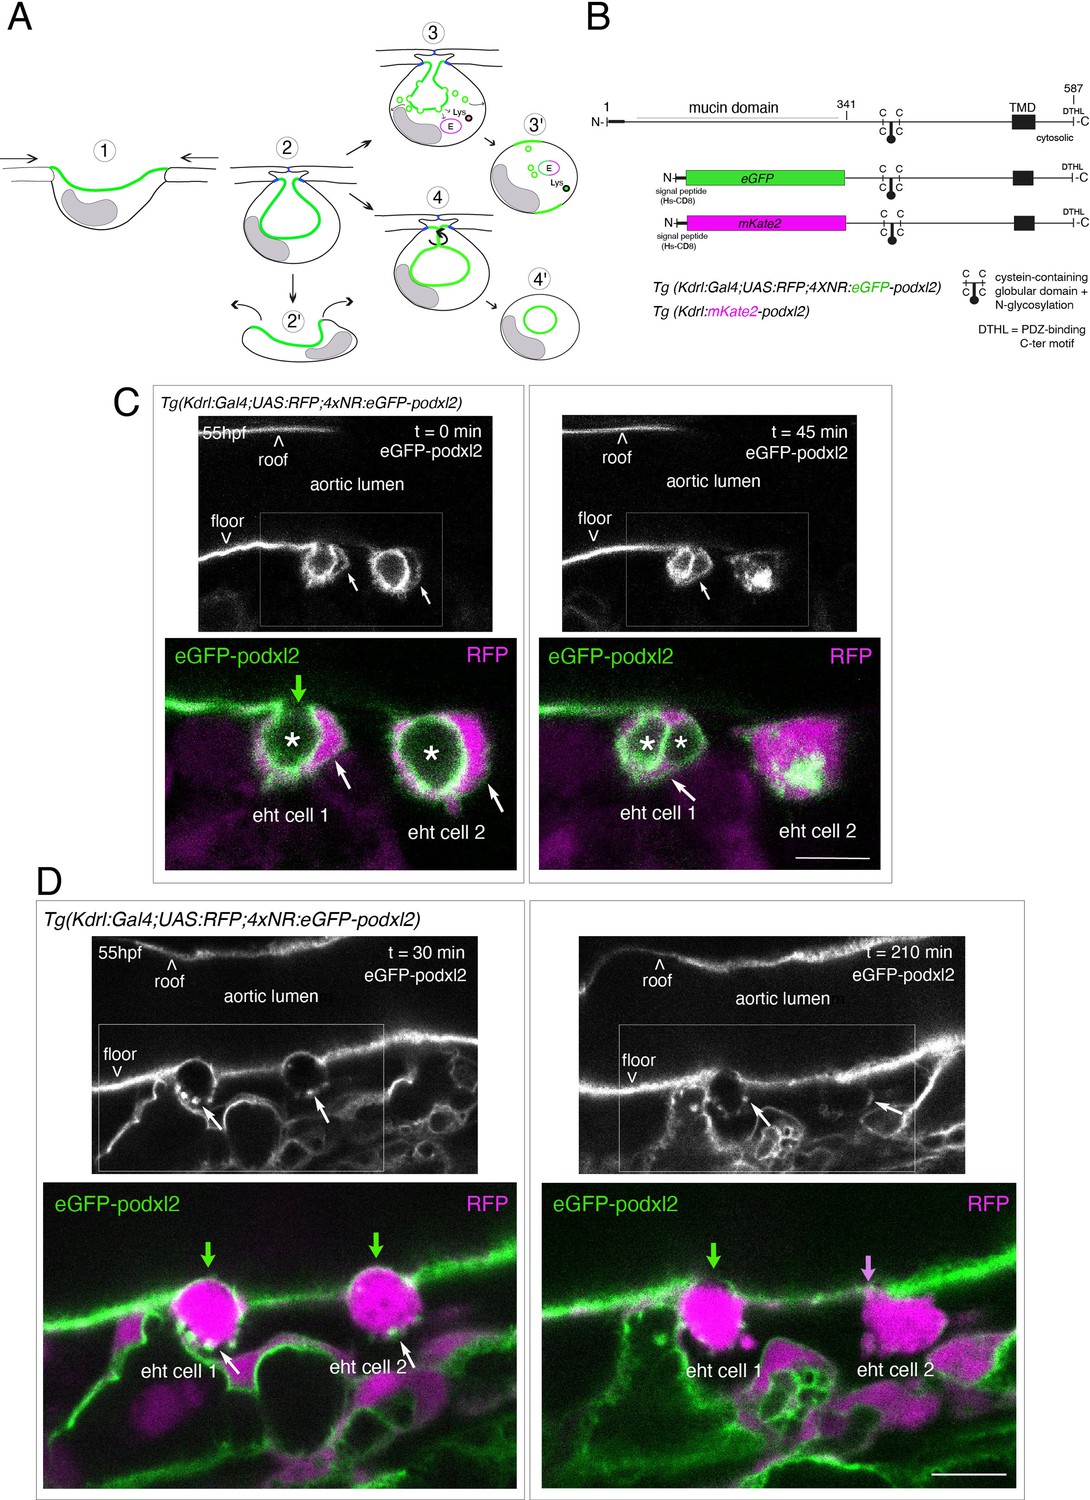
Tracing the evolution of the luminal membrane using the polarity marker Podocalyxin points at the biological significance of apicobasal polarity establishment in EHT cell emergence complexity.
(A) Cartoons depicting the early and late steps of EHT cells emerging from the aortic floor (steps 1 and 2, as previously described in the zebrafish embryo, see Kissa and Herbomel, 2010; Lancino et al., 2018) and with hypothetical evolution of the luminal membrane (in green) before (3 and 4) and after the release 2’, the cell detaches from the endothelial layer via junction downregulation leading to exposure of the luminal membrane with le extracellular milieu; 3’, the luminal membrane is consumed via endocytic recycling (E) and/or lysosomal degradation (Lys) prior to detachment; 4’, the luminal membrane in 4 is released inside the cell (twisted arrow) before detachment. Grey area = nucleus. (B) PodocalyxinL2 (Podxl2) construct designed to establish transgenic fish lines. Cartoons representing full length (top drawing) and deleted Podxl2 (amino-acid sequence 341–587) in which the mucin domain (serine/threonine-rich O-glycosylation domain) is replaced by either eGFP or mKate2. The tetracystein-containing globular domain (subjected to N-glycosylation) was kept as favoring apical membrane retention. TMD, transmembrane domain; DTHL, (C)-terminal peptidic motif involved in partnership with PDZ domain containing proteins. (C, D) EHT performing cells visualized using Tg(Kdrl:Gal4;UAS:RFP;4xNR:eGFP-podxl2) embryos and time-lapse sequences initiated at 55 hpf obtained with spinning disk confocal microscopy (imaging was performed at the boundary between the most downstream region of the AGM and the beginning of the caudal hematopoietic tissue). Top grey panels show the green, eGFP channels for eGFP-podxl2 only. Bottom panels show the merge between green and red (soluble RFP, in magenta) channels. Scale bars = 8 µm. (C) Single plane images of 2 EHT pol+ cells extracted from a time-lapse sequence at t=0 and t=45 min, with the right cell (eht cell 2) more advanced in the emergence process than the left one (eht cell1). Note the enrichment of eGFP-podxl2 at the luminal membrane (surrounding the cavity labeled with an asterisk) in comparison to the basal membrane (white arrow). Note also the evolution of the luminal membranes with time, with the aortic and eht cell 1 lumens still connecting at t=0 (green arrow), the apparent fragmentation of the cytosolic vacuole (2 asterisks for eht cell 1 at t=45 min) and the compaction of Podxl2-containing membranes for eht cell 2 at t=45 min. More details on the evolution of the connection between the aortic/eht cell lumens are shown in Figure 1—figure supplement 1A. (D) Single plane images of 2 EHT pol- cells extracted from a time-lapse sequence at t=30 min and t=210 min (see Figure 1—video 3 for the full-time lapse sequence), with the right cell (eht cell 2) slightly more advanced in the emergence than the left one (eht cell 1, with the latest attachment point between the emerging cell and the aortic floor (pink arrow)). Note, in comparison with the cells in panel (C), the ovoid shapes of cells, the absence of enrichment of eGFP-podxl2 at luminal membranes (green arrows) and the accumulation of eGFP-podxl2 at basal membrane rounded protrusions (white arrows).
Figure 1—figure supplement 1
Evolution of the apical/luminal membrane throughout time.
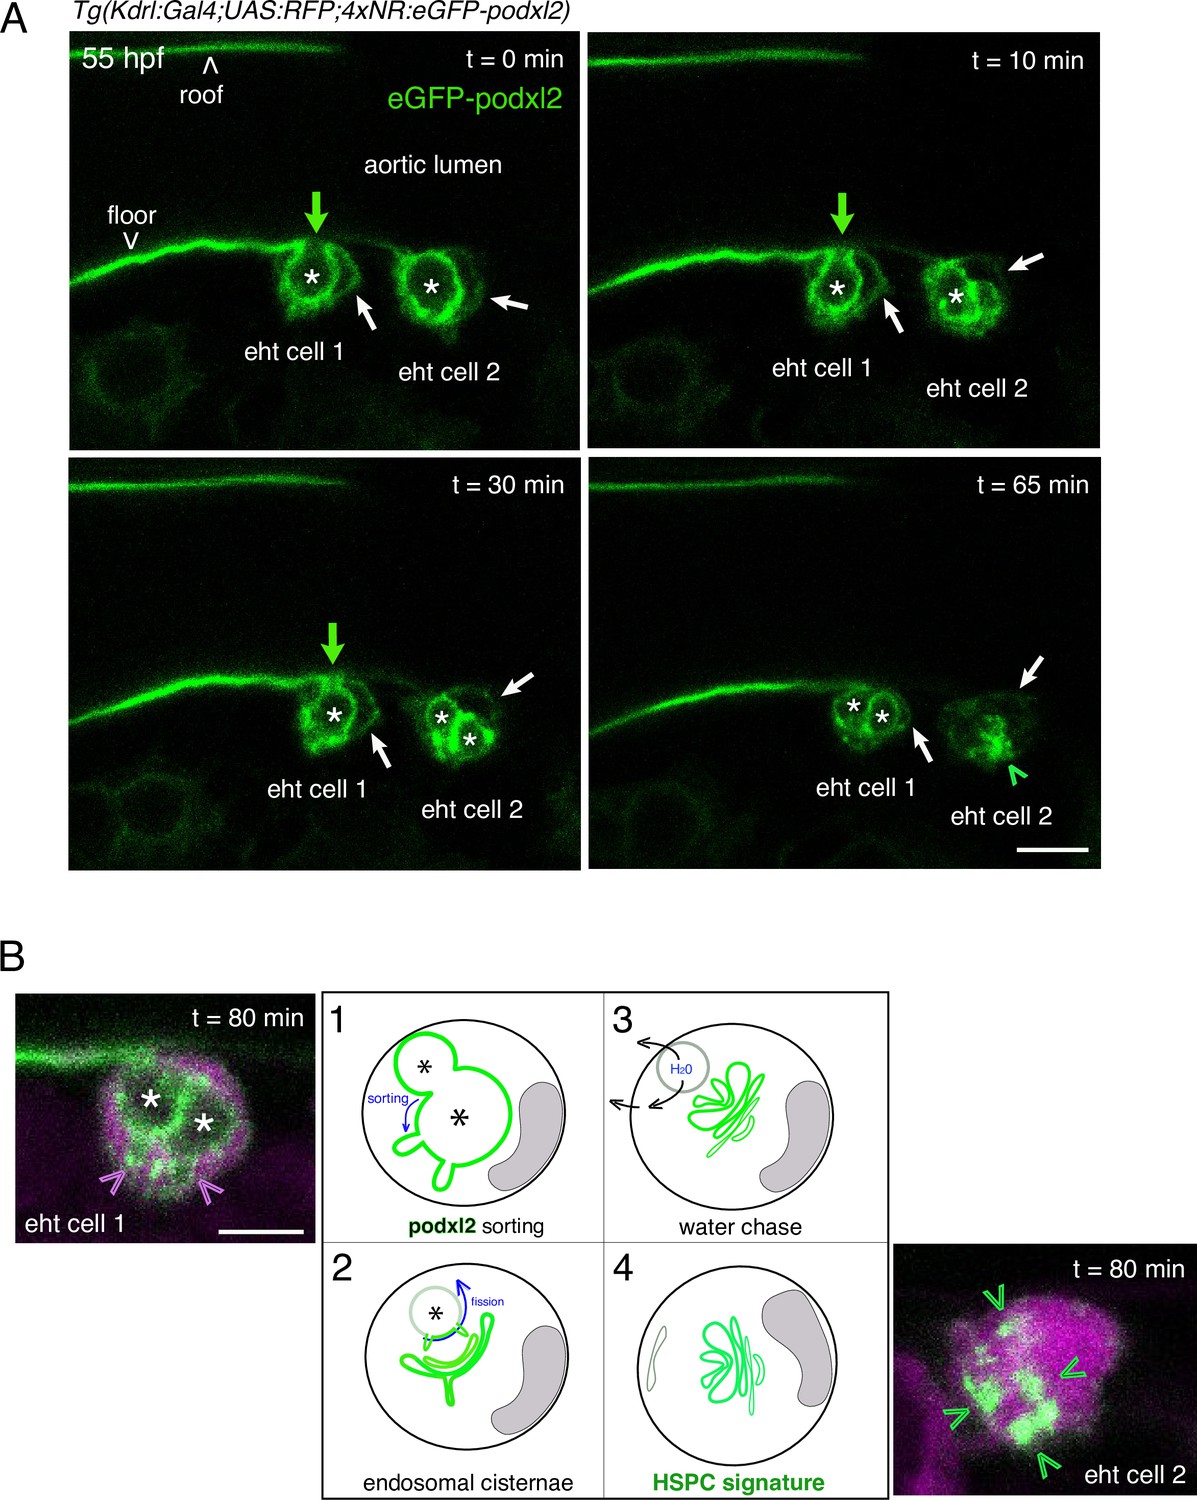
(A) Two EHT pol+ cells visualized using a Tg(Kdrl:Gal4;UAS:RFP;4xNR:eGFP-podxl2) embryo and time-lapse sequence (initiated at 55 hpf) obtained with spinning disk confocal microscopy. The images (single z-planes) are extracted from the same time lapse sequence than the one used for Figure 1C. Green channel (eGFP-podxl2) only is shown. Green arrows point at the evolution of the connection between the aortic/eht cell lumens at t=0, 10, 30 min. Asterisks label the lumen delimited by the luminal/apical membranes. Scale bar = 8 µm. (B) Model summarizing and interpreting the temporal evolution of the luminal/apical membrane (in green, the asterisks mark the lumen of the apparent vacuole-like intracellular membrane structures) after the release of an EHT pol+ cell from the aortic floor. Step 1, the pseudo-vacuole filled with fluid and delimited by eGFP-podxl2 as visualized at t=65 min in (A) (and also at 45 min in Figure 1C, 2 asterisks) is consumed partly via budding (after sorting of eGFP-podxl2); these budding profiles can be seen on the left image (pink arrowheads) corresponding, for eht cell 1, to the plane 16 of the time point t=80 min of the time lapse sequence (see the Z-stack in Figure 1—video 2). Step 2, after sorting and budding, the cell remains with pseudo-endocytic Podxl2 containing membranes and the remaining vacuolar structures filled up with fluid regress, putatively by chasing water as illustrated in step 3. Step 4, the eht cell remains with pseudo-endocytic Podxl2 containing membranes that label newly born precursors of HSPCs. Note that since the cell remains in contact with the aortic floor while the pseudo-vacuole is regressing, the vacuole-like intracellular membrane proximal to aortic cells may never undergo fission (see Figure 1A, steps 4–4’) but gets consumed via budding and flattening upon water chase (steps 1–3 that are similar to Figure 1A, steps 3–3’). Scale bar = 8 µm.
Figure 1—figure supplement 2
EHT pol+ and EHT pol- cells recover their respective morphology after mitosis.
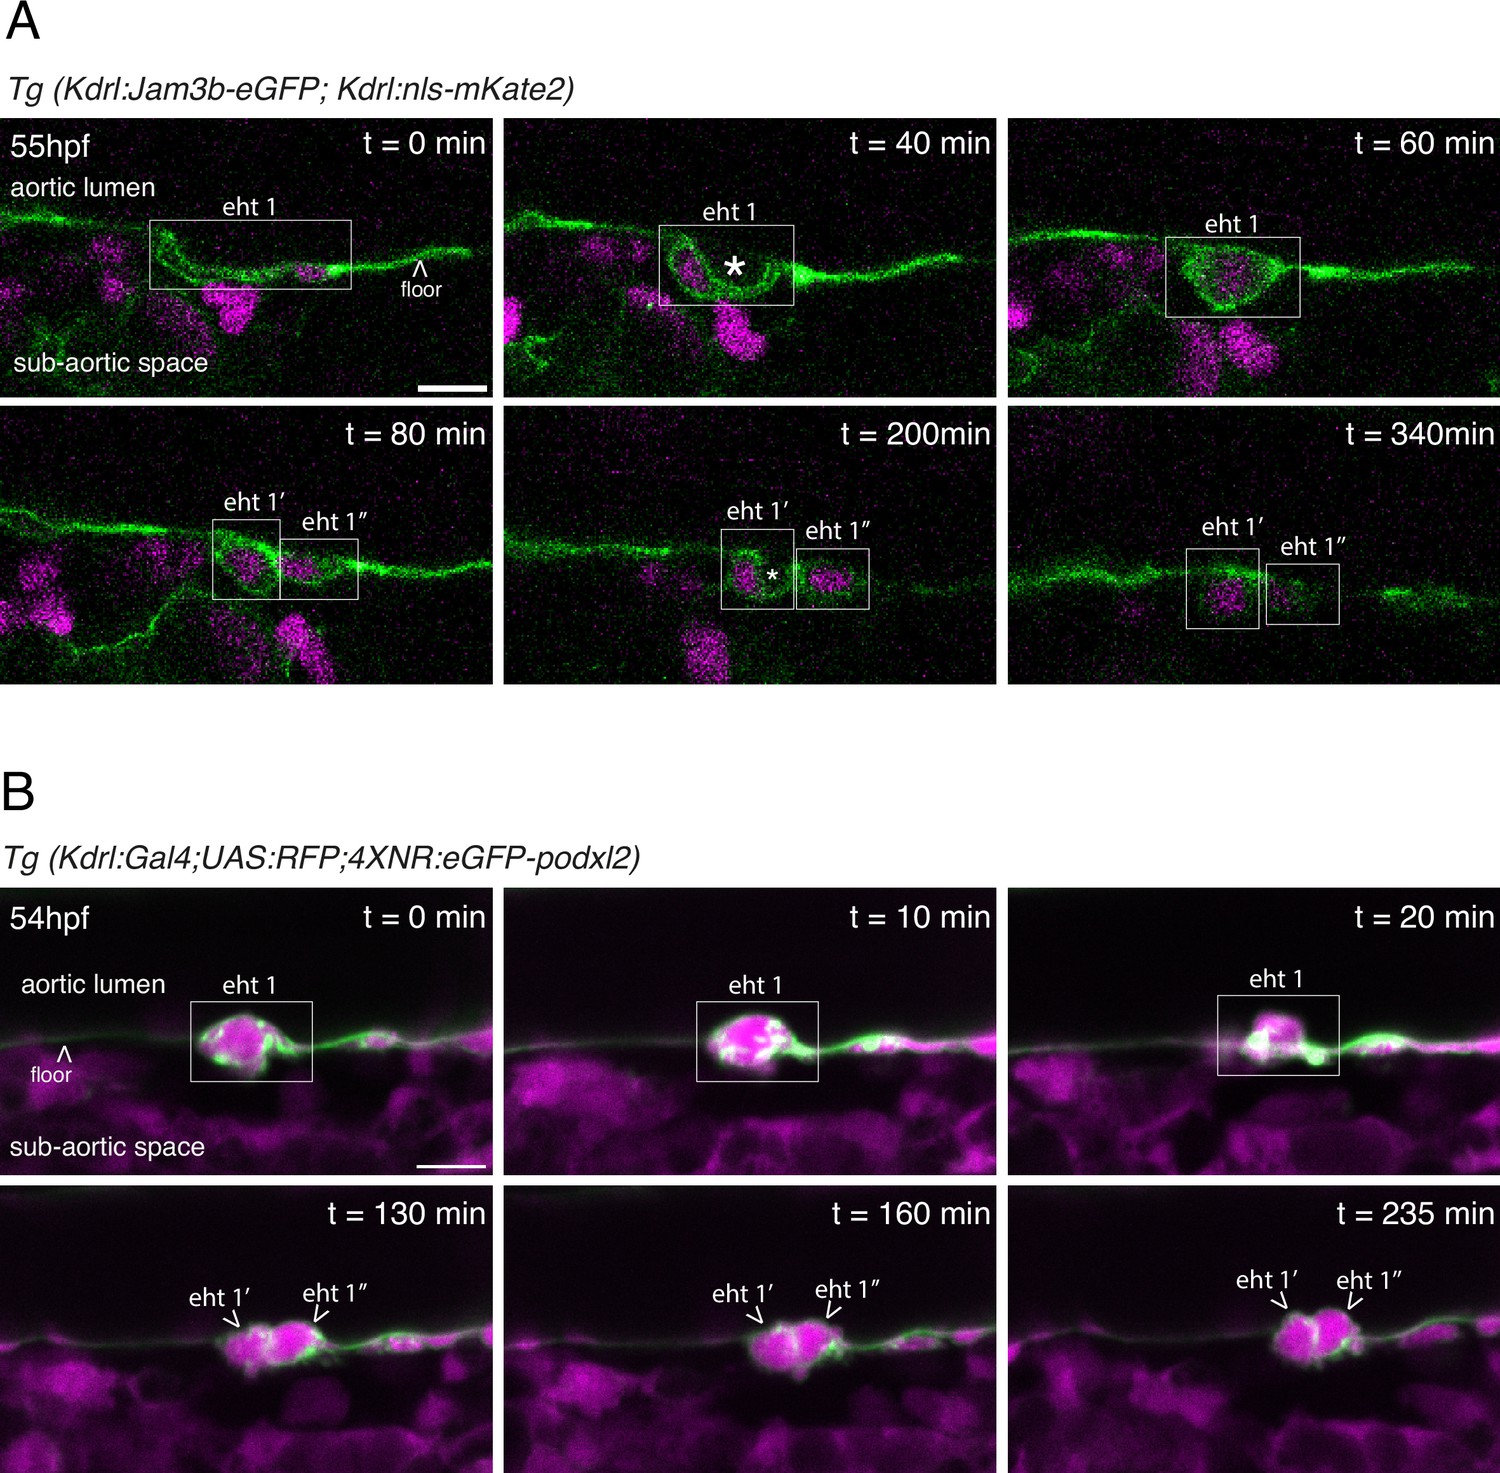
(A) EHT pol+ cell extrusion and division visualized using a Tg(Kdrl:Jam3b-eGFP;Kdrl:nls-mKate2) embryo and time-lapse sequence (initiated at 55 hpf) obtained using laser scanning confocal microscopy (single z-planes). This transgenic line allows the visualization of nuclei (nls-mKate2, magenta) and intercellular contacts as well as plasma membranes (eGFP-Jam3b, see Materials and methods and Figure 5 for more information). The eht 1 cell (white box) starts invaginating before t=0 min, and displays the characteristic luminal membrane invagination of EHT pol+ cells at t=40 min. At t=60 min, the cell undergoes mitosis. At t=80 min, the two daughter cells (eht 1’ and eht 1’’) are still contacting each other. At this point, they still have the slightly rounded morphology of post-mitotic cells. At t=200 min, the eht 1’ cell has resumed its extrusion and its luminal membrane is invaginated. By t=340 min, the extrusion of the eht 1’ cell is complete, and the cell remains in contact with the aortic floor. The eht 1’’ cell resumes its extrusion later, also displaying an invagination of its luminal membrane (but not visible on the same plane as for the eht 1’ cell). White asterisks label the lumen delimited by the luminal/apical membranes. (B) EHT pol- cell extrusion and division visualized using a Tg(Kdrl:Gal4;UAS:RFP;4XNR:eGFP-podxl2) embryo and time-lapse sequence (initiated at 54 hpf) obtained with spinning disk confocal microscopy (single z-planes), at the bottom of the trunk region. The eht 1 cell (white box) is undergoing extrusion at t=0 min, and displays the characteristic rounded/ovoid shape of EHT pol- cells at t=0 min and t=10 min. At t=20 min, the cell starts undergoing mitosis. At t=130 min, we can observe the two daughter cells (eht 1’ and eht 1’’) still contacting each other. From t=130 min to t=235 min, the two daughter cells slowly continue their extrusion, keep contacting each other, and increase their roundness, with partitioning of eGFP-podxl2 between the luminal and basal membranes. All throughout the time-lapse sequence, the eht 1 cell and, subsequently, the eht 1’ and eht 1’’ cells do not display any enrichment of eGFP-podxl2 at their luminal membranes. Scale bars = 10 µm.
Figure 1—figure supplement 3
EHT pol+ and EHT pol- cells express eGFP driven by the CD41 promotor.
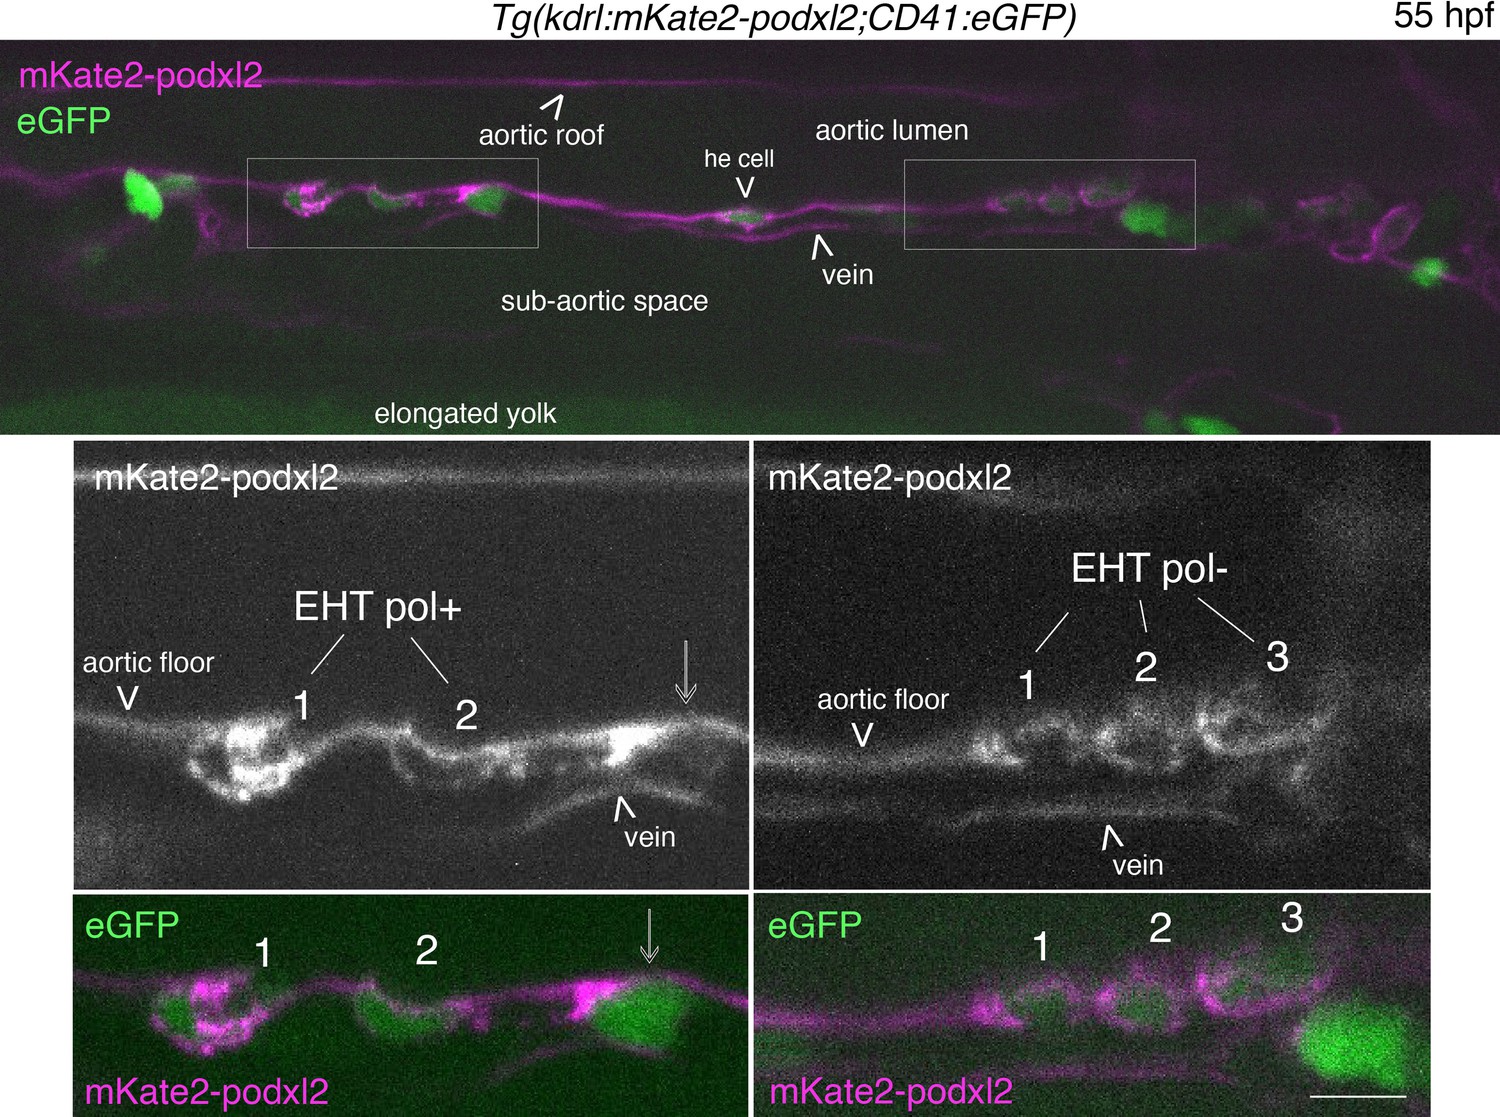
Single z-plane of a 55 hpf Tg(Kdrl:mKate2-podxl2;CD41:eGFP) embryo imaged using spinning disk confocal microscopy, in the trunk region. Top panel, left box (with 2 X magnification beneath): 2 EHT pol+ cells with EHT cell 1 more advanced in its emergence than EHT cell 2; mKate2-podxl2 expressed by EHT cell 1 is enriched at the apical pole of the cell, facing the aortic lumen (as is the case for eGFP-podxl2, see Figure 1C). Top panel, right box (with ×2 magnification beneath): 3 EHT pol- cells with mKate2-podxl2 localized relatively homogenously between luminal and abluminal membranes. All EHT pol+ and EHT pol- cells express cytosolic eGFP, as seen in top and bottom panels (2 channels images). Note that it is also the case for the he cell (hemogenic cell) in the aortic floor, in the middle of the image, top panel. Scale bar = 10 µm.
Figure 1—video 1
EHT pol+ cells at early timing.
Z-stack (37 planes) corresponding to the time point t=0 min whose plane 21 is shown Figure 1C. Scale bar = 10 µm.
Figure 1—video 2
EHT pol+ cells at late timing.
Z-stack (37 planes) corresponding to the time point t=80 min whose planes 16 (for eht cell 1) and 22 (for eht cell 2) are shown Figure 1—figure supplement 1B. Scale bar = 10 µm.
Figure 1—video 3
Emergence of EHT pol- cells.
Time-lapse sequence using a Tg(Kdrl:Gal4;UAS:RFP;4xNR:eGFP-podxl2) embryo, obtained with spinning disk confocal microscopy (38 timing points, each acquired with 10 min intervals, starting at 55 hpf) and from which the images of the 2 emerging EHT pol- cells shown Figure 1D were extracted. Scale bar = 10 µm.
Figure 2 with 2 supplements
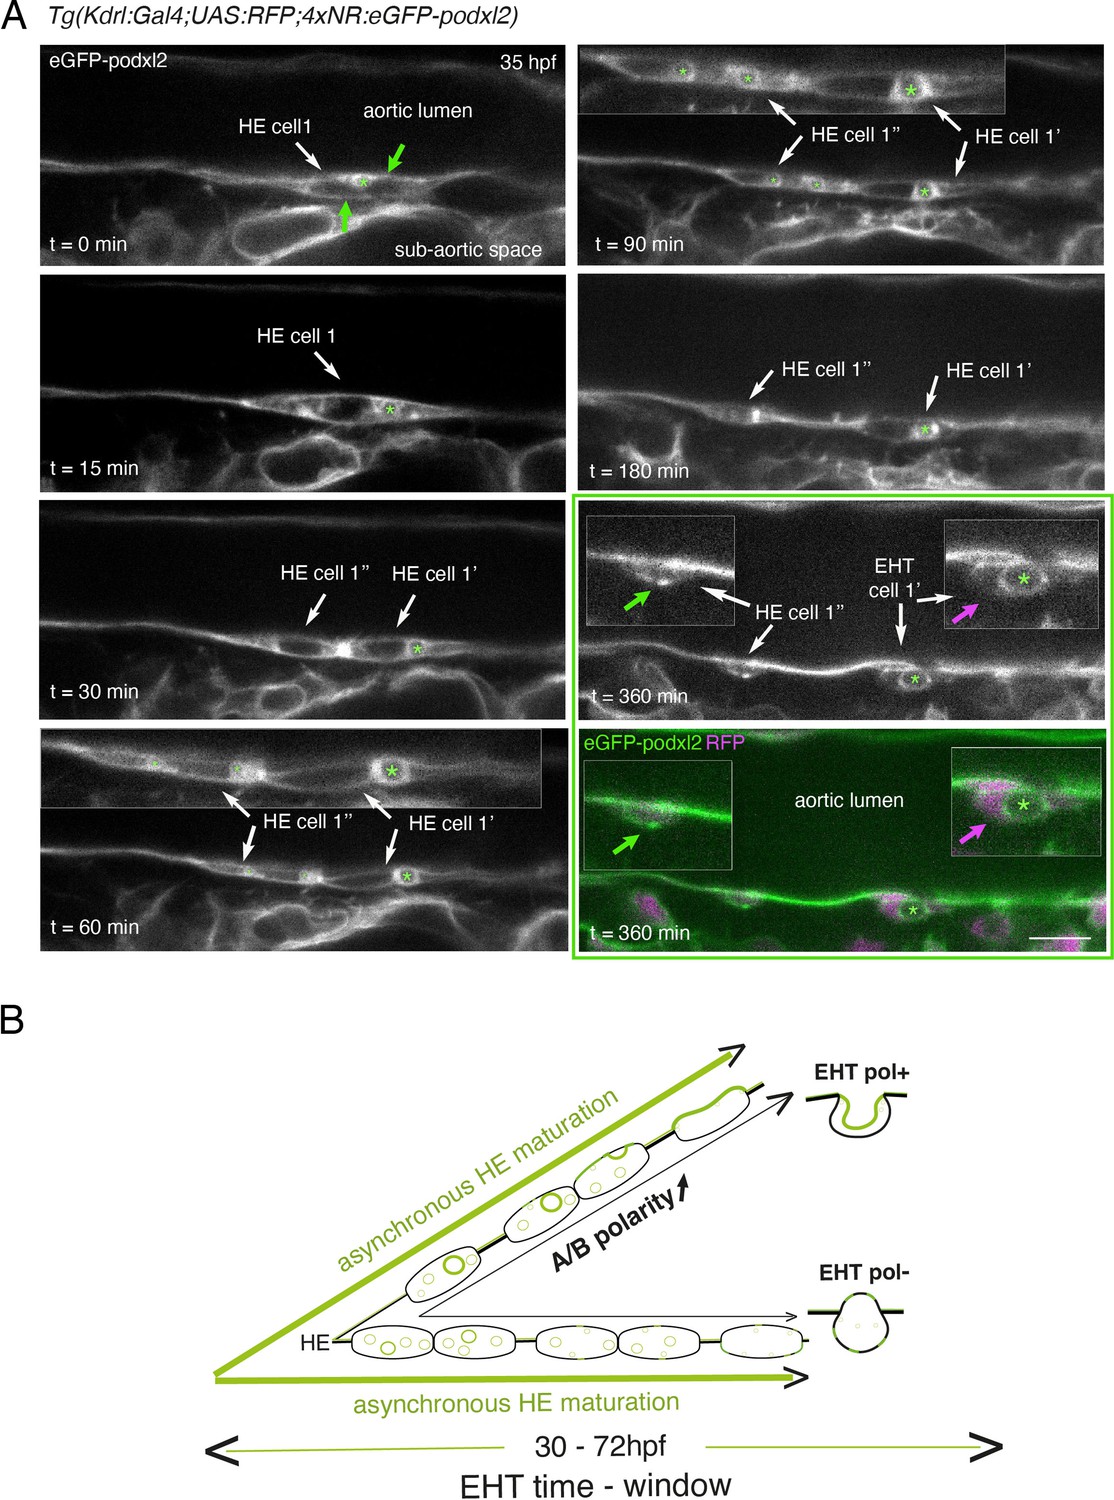
Immature HE is not polarized and controls membrane delivery of intra-cytosolic vesicular pools.
(A) Tg(Kdrl:Gal4;UAS:RFP;4xNR:eGFP-podxl2) embryo imaged using spinning disk confocal microscopy. Black and white images show eGFP-podxl2 only. Images (single z-planes) were obtained from a time-lapse sequence (initiated at 35 hpf) lasting for 435 min (7.25 hr), with intervals of 15 min between each z-stack. Example of an HE cell with equal partitioning of eGFP-podxl2 between luminal and abluminal membranes (at t=0 min), with eGFP-podxl2 containing intra-cytosolic vesicles (one labeled with a green asterisk) and undergoing mitosis at t=30 min (HE cell 1’ and HE cell 1’’ are daughter cells). Note the inheritance of the largest micropinocytic-like vacuole by HE cell 1’ and its maintenance over time until EHT emergence initiation at t=180 min (green asterisk in 1.5 x magnified areas at t=60 and 90 min). At t=360 min (green box) EHT is proceeding and both fluorescence channels are shown; bottom panel: green (eGFP-podxl2), magenta (soluble RFP). The magenta arrow points at the basal side of the EHT pol+ cell (EHT cell 1’, on the right) that does not contain any detectable eGFP-podxl2; on the contrary, eGFP-podxl2 is enriched at the luminal/apical membrane (note that exocytosis of the large vacuolar structure may have contributed to increase the surface of the apical/luminal membrane [the green asterisk is surrounded by the apical/luminal membrane of the EHT pol+ cell]). The green arrow points at the abluminal membrane of the EHT cell derived from HE cell 1’’ (EHT cell 1’’) and that contains eGFP-podxl2 (with no evidence of a significant expansion of a luminal/apical membrane); this indicates that this cell is more likely to be an EHT pol- cell that did not sort the vesicular cargo to the luminal/apical membrane. Scale bar = 10 µm. (B) Hypothetical model summarizing the evolution of HE cells involving the tuning of apicobasal polarity to lead to cells competent for giving birth to either EHT pol+ or EHT pol- cells (including the release of large vesicular macropinocytic-like vacuoles preferentially toward the luminal membrane of future EHT pol+ cells). The polarity status of HE cells is proposed to evolve asynchronously throughout the entire EHT time window, leading to place-to-place ability to give birth to EHT cells (emergence of EHT pol+ and EHT pol- cells are both observed until 72 hpf, see main text).
Figure 2—figure supplement 1
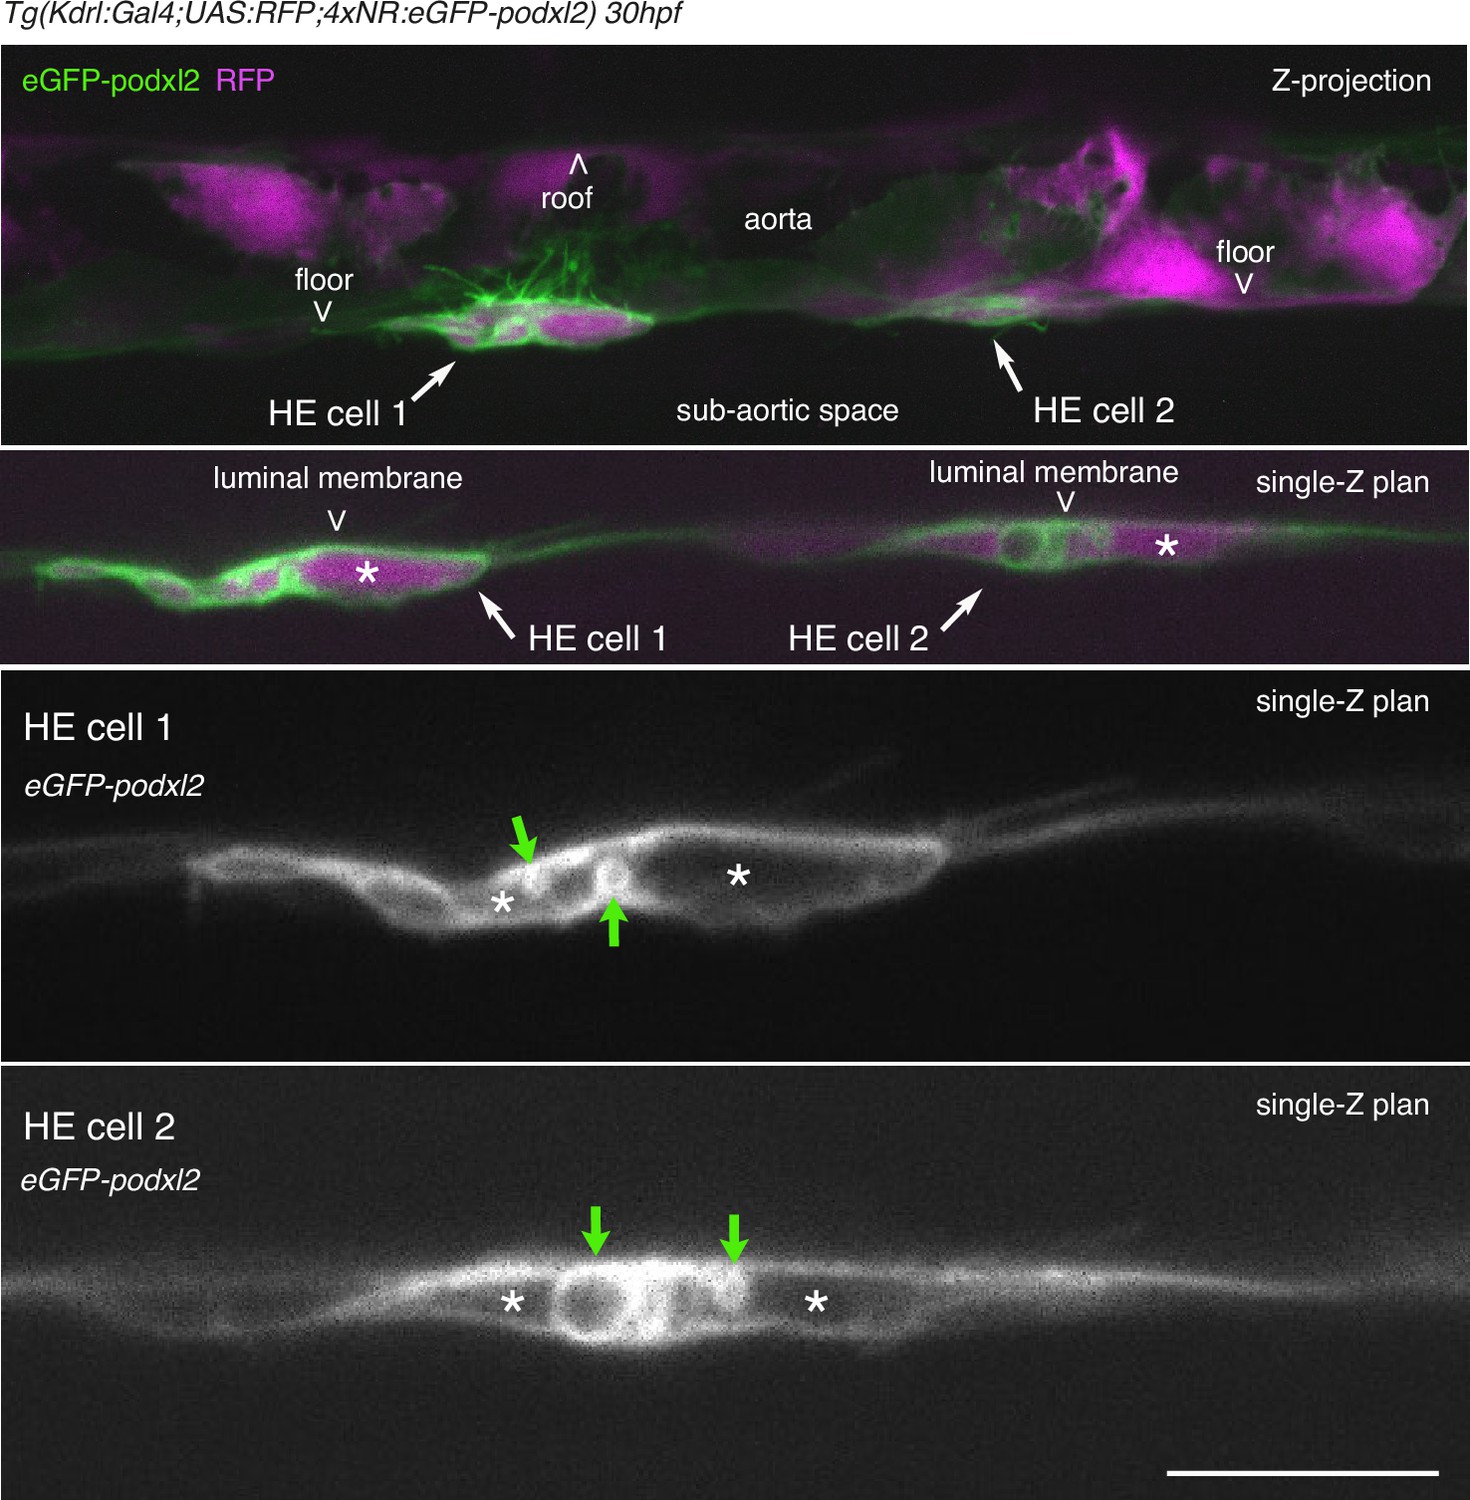
HE cells are not polarized at 30 hpf.
Tg(Kdrl:Gal4;UAS:RFP;4xNR:eGFP-podxl2) 30 hpf embryo imaged using spinning disk confocal microscopy. Top 2 panels: green (eGFP-podxl2) and red (soluble RFP, in magenta) channels. White arrows point at 2 individual EHT cells. Note that HE cell 1 protrudes long filopodia, some of which inside the aortic lumen (live imaging shows that they are moving along the blood flow, data not shown). Bottom 2 panels: 1.625 X magnification of EHT cell 1 and 2 in top panels. Green channel (eGFP-podxl2) only. Green arrows point at very large intracellular vesicles, the largest reaching approximately 30 µm. Asterisks mark the cytoplasm. Scale bar = 100 µm.
Figure 2—figure supplement 2
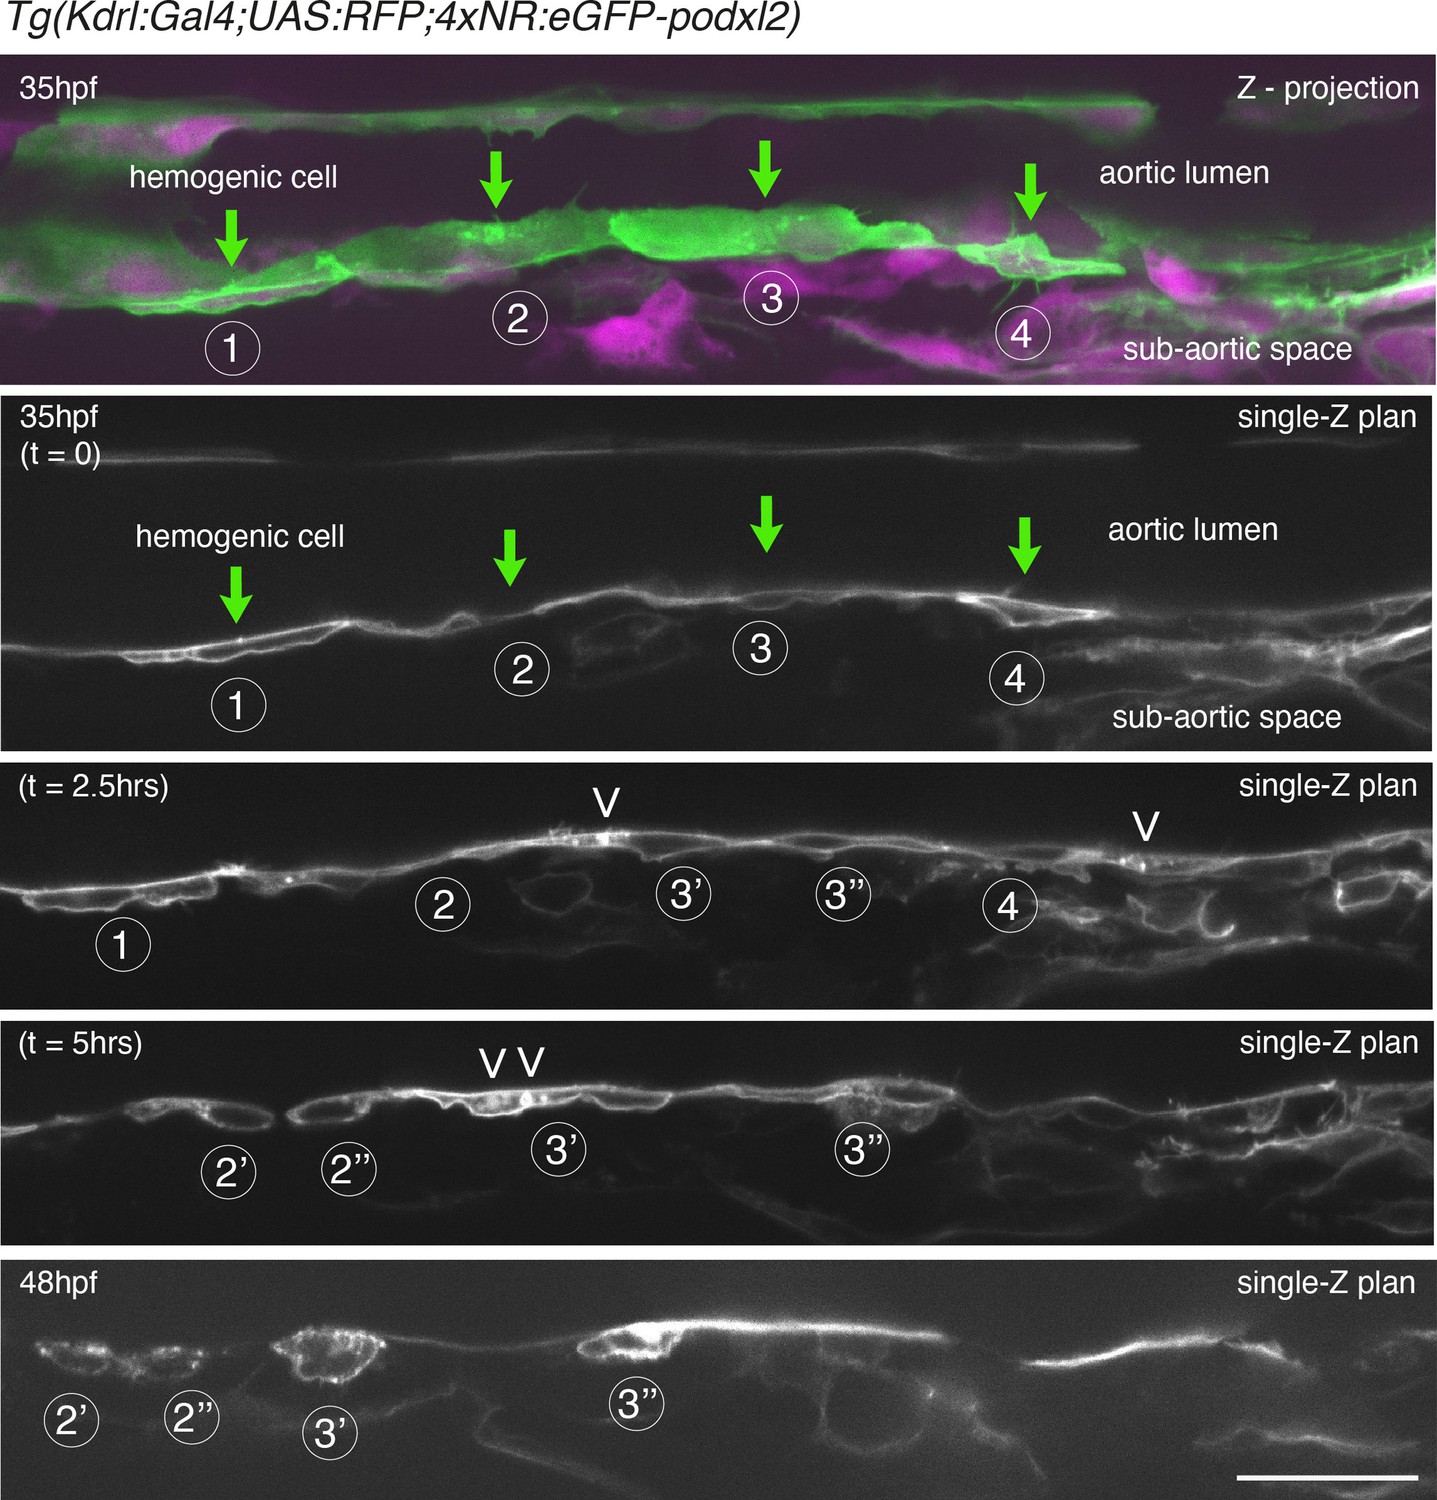
Evolution of non-polarized HE cells throughout emergence.
Tg(Kdrl:Gal4;UAS:RFP;4xNR:eGFP-podxl2) embryo imaged using spinning disk confocal microscopy. Images were obtained from discontinuous time-lapse sequences covering a period of 13 hr (from 35 – to – 48 hpf). Successive phases of the evolution of HE cells are visible, from a non-polarized status (with the accumulation of Podxl2-containing intra-cytosolic vesicles as well as cell division) to post-emergence EHT cells remaining beneath the aortic floor. The top panel is a z-projection of 69 consecutive z-sections interspaced by 0.3 µm; green (eGFP-podxl2) and red (soluble RFP, in magenta) channels are shown; 4 individual HE cells (1–4, green arrows)) are marked, with cells 1 and 4 more advanced in the process of emergence. All the other panels are z-sections focused on the aortic floor, allowing visualizing the progression of the EHT, in particular at 35 hpf (t=0), a timing point at which the separation between the luminal and basal membranes are equally labeled with eGFP-podxl2, attesting for the absence of apicobasal polarity (see cells 1 and 4, see also cell 1 at t=2.5 hr and cells 3’ and 3’’ at t=5 hr). Note, at t=2.5 and 5.0 hr, the presence of intracytoplasmic eGFP-podxl2-labeled vesicles inside HE cells, suggesting vesicular transport (white arrowheads, to be compared with images Figure 2—figure supplement 1, at 30 hpf). At 48 hpf (bottom panel), HE cells have emerged and remain, for some of them, in close contact with the aortic floor (after having performed mitosis (notably for HE cell 2 [the division is visualized at 5 hr] and for HE cell 3, each one giving rise to cells 2’ - 2’’ and 3’ - 3’’ respectively, all containing residual eGFP-podxl2 containing membranes as EHT signature). Scale bar = 80 µm.
Figure 3 with 4 supplements
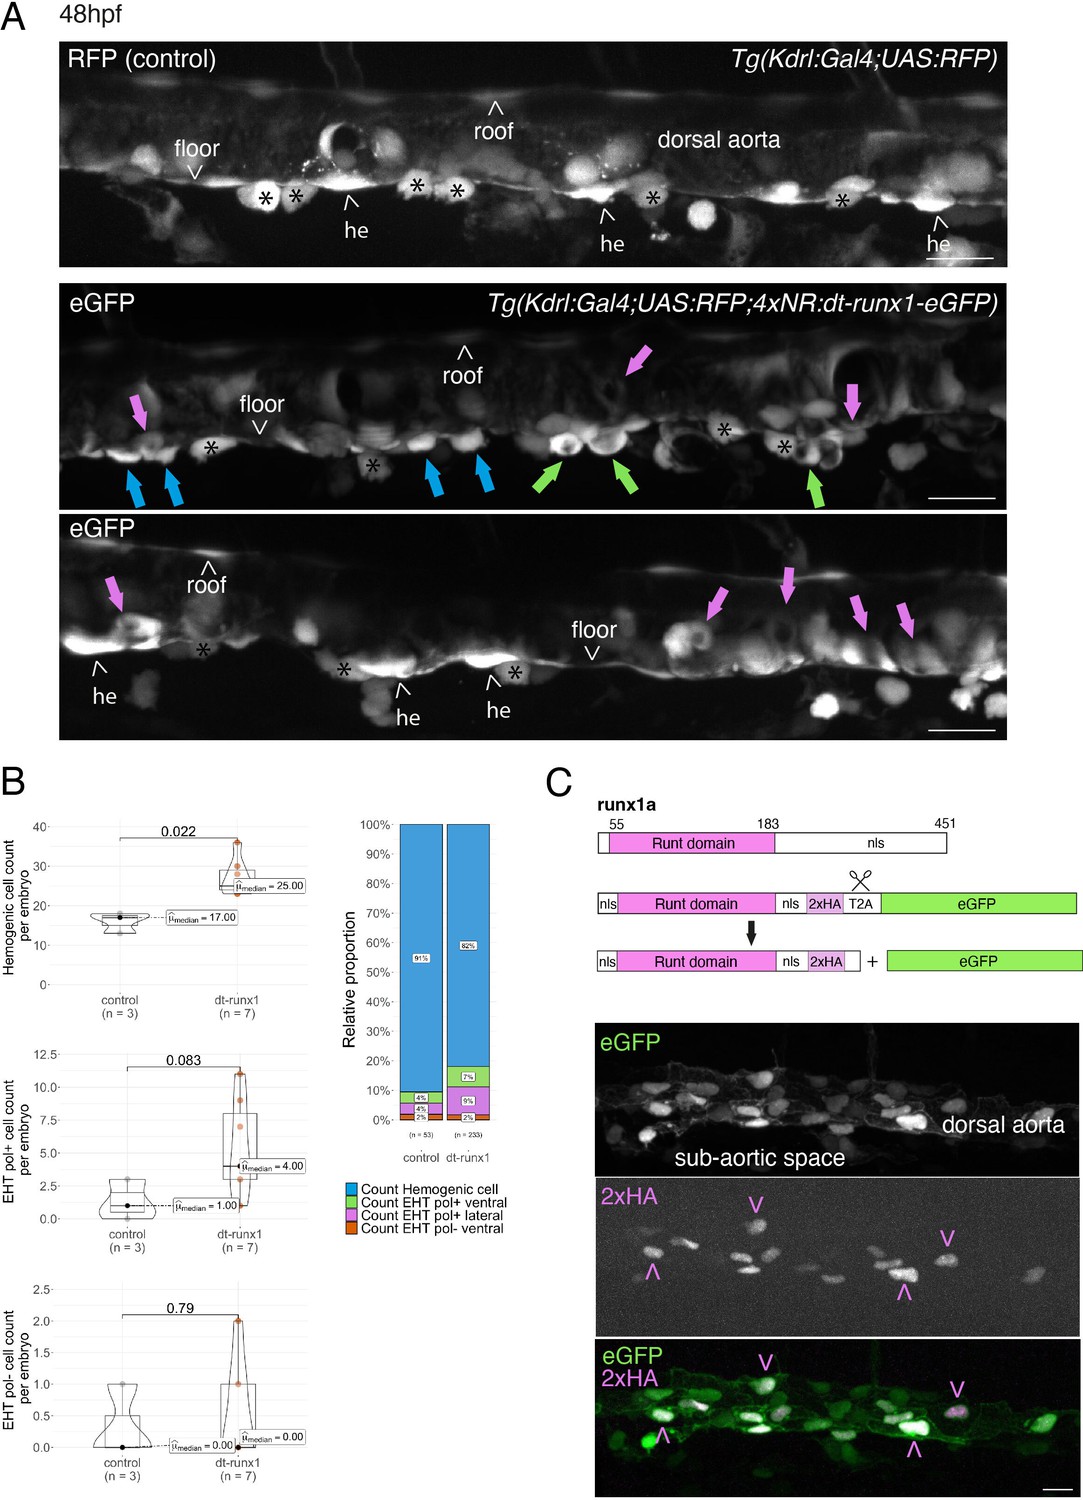
Interference with Runx1 function alters emergence efficiency and induces a bias toward EHT pol+ cells.
(A) Tg(kdrl:Gal4;UAS:RFP;4xNR:dt-runx1-eGFP) mutant embryos imaged using spinning disk confocal microscopy and analyzed in the AGM/trunk region. Z-projections of the dorsal aorta obtained from 52 to 55 hpf embryos. Top panel: fluorescence from the red channel is shown for the Tg(Kdrl:Gal4;UAS:RFP) control. Bottom panels: fluorescence in the green channel only is shown for the mutants (eGFP, released from the dt-runx1-eGFP cleavage). The black asterisks point at emerged cells that are in close contact with the aortic floor. Green arrows: EHT pol+ cells on aortic floor; magenta arrows: EHT pol+ cells in the lateral aortic wall; blue arrows: uncharacterized emerging cells; he: hemogenic cells. Scale bars = 20 µm. (B) Quantitative analysis of the dt-runx1 mutant phenotype. The analysis was carried out on Tg(Kdrl:Gal4;UAS:RFP) control embryos (n=3) and on Tg(kdrl:Gal4;UAS:RFP;4xNR:dt-runx1-eGFP) mutant embryos (n=7). Left top: hemogenic cell count (comprising hemogenic cells, labeled by ‘he’ on panel (A) as well as uncharacterized emerging cells, labeled by blue arrows on panel (A)). Left center: EHT pol+ cell count (sum of EHT pol+ cells emerging ventrally and laterally, respectively labeled by green and magenta arrows on panel (A)). Left bottom: EHT pol- cell count not shown on panel (A). Right: percentage of cell types in control and dt-runx1 embryos (proportions relative to total number of hemogenic and EHT undergoing cells). Statistical comparisons have been performed using two-sided unpaired Wilcoxon tests, all p-values are displayed. (C) Top: cartoons representing the zebrafish full-length runx1a amino acid sequence and the dt-runx1 mutant deleted from the trans-activation domain and of the C-terminus note that the construct encodes for a C-terminal fusion with eGFP that is released upon expression via a cleavable T2A peptide (introduced between the 2xHA tag and the N-terminus of eGFP, to prevent from potential steric hindrance). nls, nuclear localization signal. Bottom: image of an anti-HA tag immunofluorescence obtained after z-projection of the dorsal aorta of a 50 hpf Tg(dt-runx1) embryo. Note the localization of the 2xHA-tagged dt-runx1 protein in nuclei (some of them are pointed by red arrowheads) and of eGFP in nuclei and the cytosol of aortic cells. Scale bar = 25 µm. Raw images (z-stacks) for this figure (dt-runx1 phenotype analysis) are available at https://doi.org/10.5281/zenodo.10932245.
Figure 3—figure supplement 1
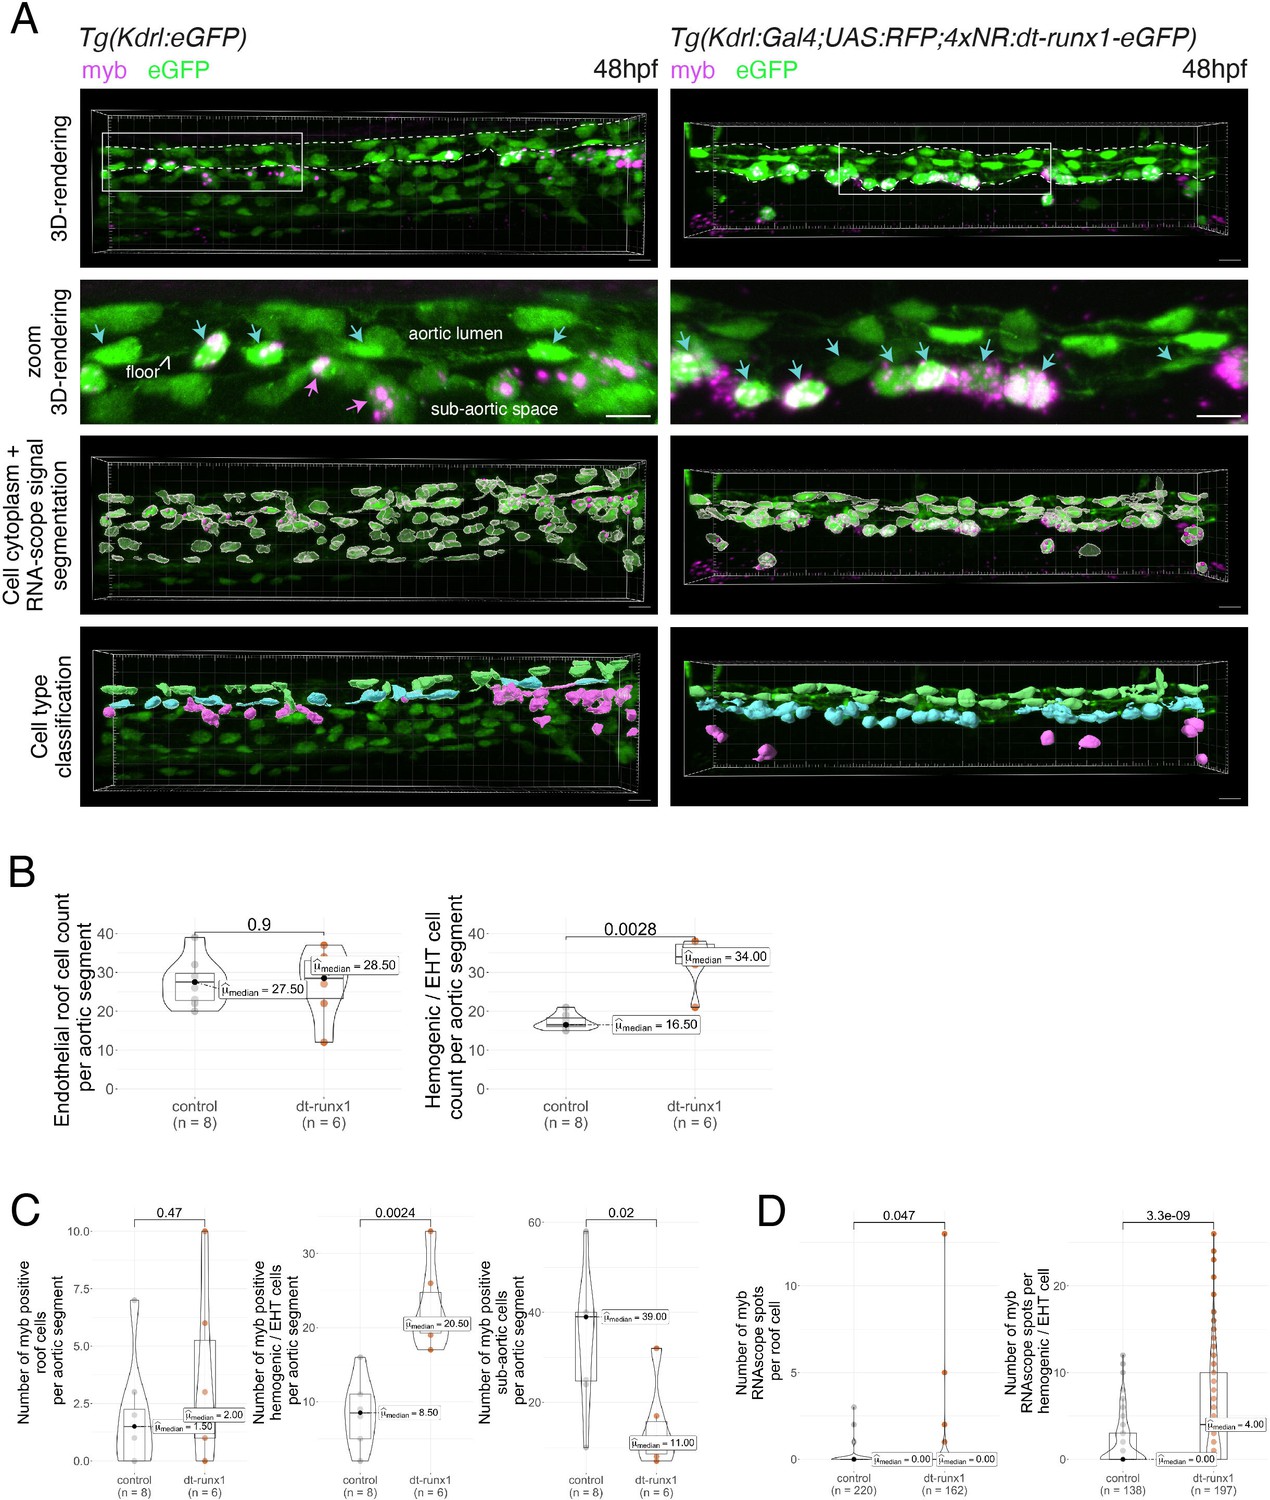
Expression of dt-runx1 triggers the accumulation of myb + cells in the aortic floor.
(A) Representative image (Imaris 3D-rendering) of RNA-scope in situ hybridization for the hematopoietic marker myb in 48–50hpf Tg(Kdrl:eGFP) control embryos (left) and 48–50hpf Tg(Kdrl:Gal4;UAS:RFP;4xNR:dt-runx1-eGFP) mutant embryos (right). Top row: 3D rendering without segmentation. The aorta is outlined with the white dashed lines. Center top row: Magnification of aortic segments (outlined with white boxes on the top rows). Cyan arrows: hemogenic cells (comprising characterized elongated hemogenic cells as well as EHT undergoing cells). Magenta arrows: hematopoietic cells in the sub-aortic space. Center bottom row: GFP + cells segmentation (white cellular outline) and RNAscope signal segmentation (magenta spots). Bottom row: Manual cell classification post segmentation. Aortic roof cells (virtually all negative for myb) are displayed in green, hemogenic and EHT cells in cyan and sub-aortic hematopoietic cells in magenta (all expressing myb). Scale bars = 10 µm. (B) Quantitative analysis of the dt-runx1 expressing mutant phenotype. Left: endothelial roof cell count (green segmented cells on panel (A)). Right: hemogenic/EHT cell count (cyan segmented cells on panel (A)). (C) myb-positive cell count in roof endothelial cells left, corresponding to green cells in panel (A), hemogenic/EHT cells (middle, corresponding to cyan cells in panel (A)) and hematopoietic cells in the sub-aortic region (right, corresponding to magenta cells in panel (A)). (D) Number of segmented RNA-scope myb dots per segmented roof cells (left panel) and hemogenic/EHT cells (right panel). For panels (B, C and D), statistical comparisons have been performed using two-sided unpaired Wilcoxon tests, all p-values are displayed. Analysis was carried out on n=4 control embryos and n=3 mutant embryos, with 2 aortic segments per embryo.
Figure 3—figure supplement 2
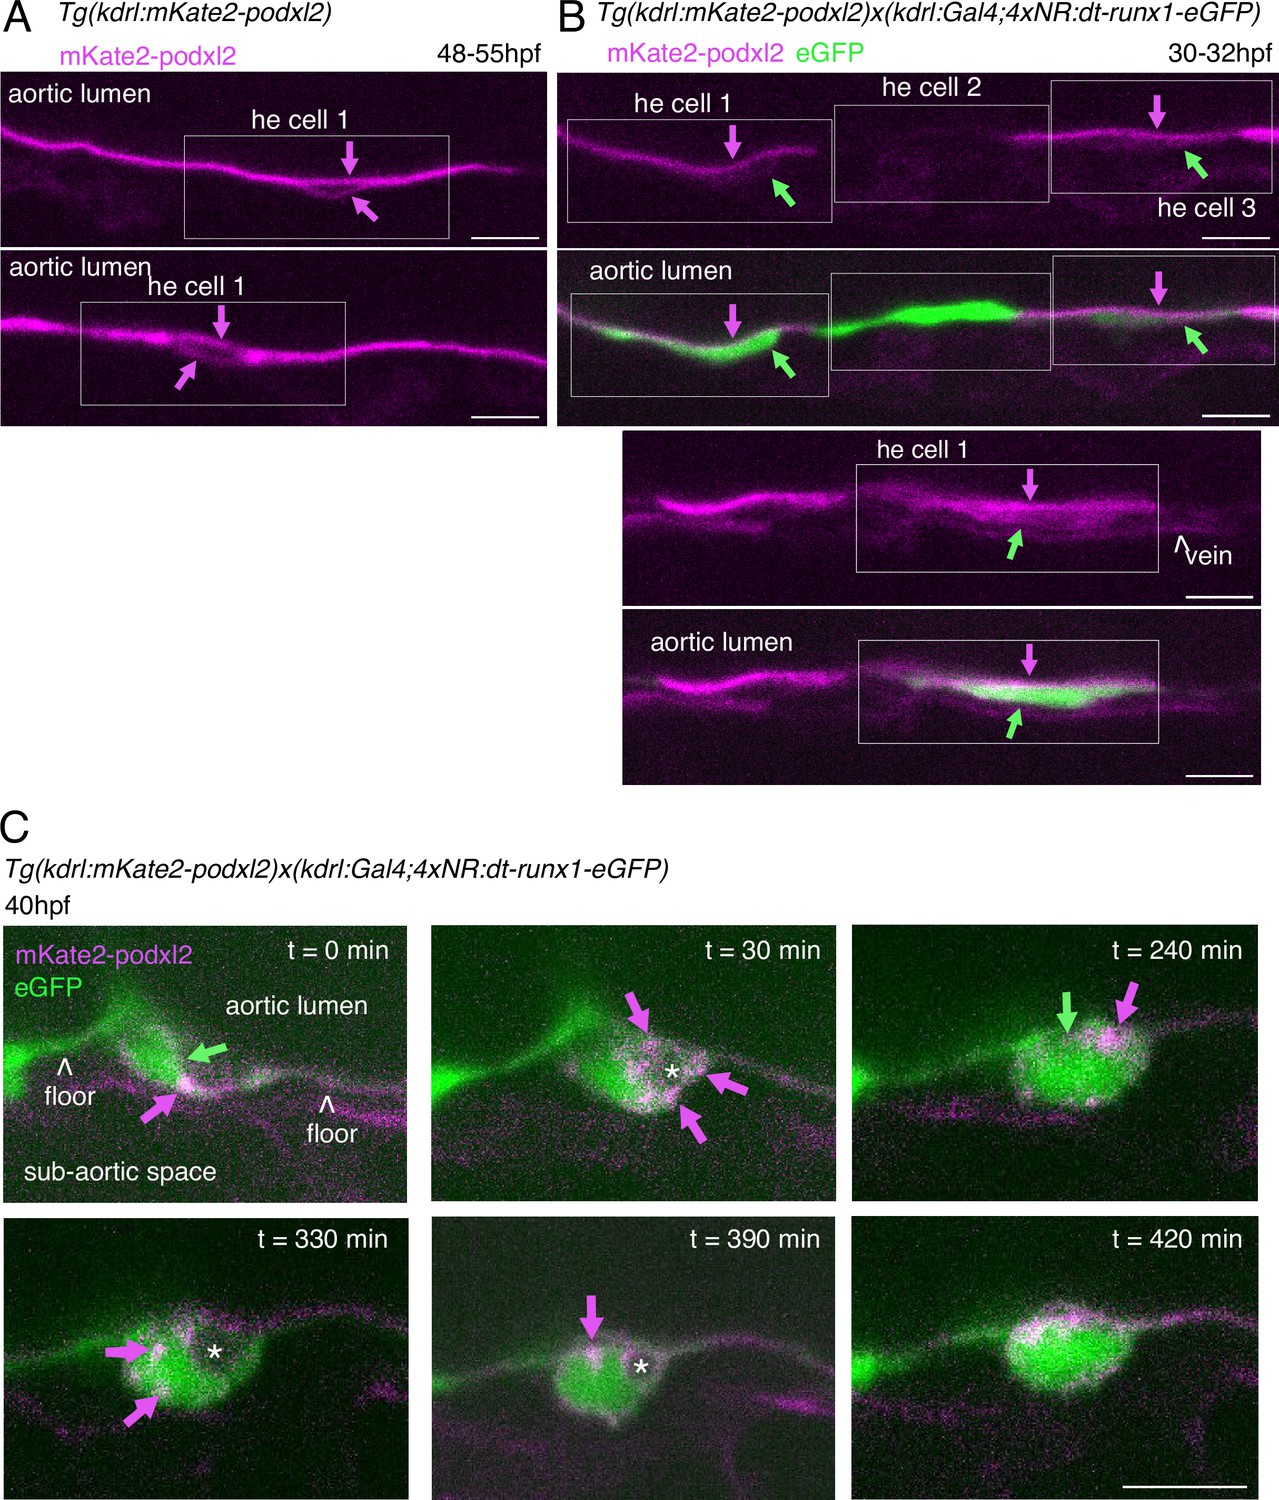
Phenotypic analysis of dt-runx1 expressing mutants: evidence for apicobasal polarity of hemogenic cells.
30–32 hpf and 48 - 55hpf embryos obtained from outcrossed Tg(Kdrl:mKate2-podxl2) X Tg(kdrl:Gal4;UAS:RFP;4xNR:dt-runx1-eGFP) fishes were imaged in the trunk (AGM) region using spinning disk confocal microscopy (single z-planes). (A) Two aortic segments imaged in control sibling embryos (not expressing the dt-runx1 mutant, hence negative for the cleaved eGFP). Typical HE cells are outlined in the white boxes (with the luminal and abluminal membranes clearly separated from each other owing to reduction of their surface area (in comparison to flat aortic cells) and elongation in the antero-posterior axis). Note the absence of enrichment of mKate2-podxl2 in luminal membranes in comparison to basal membranes (magenta arrows). (B) Two aortic segments in dt-runx1 expressing embryos. Images are depicting typical HE cells (in boxes) from hemogenic regions (as in A). Note the enrichment of mKate2-podxl2 in apical/luminal membranes (magenta arrows) in comparison to basal membranes (green arrows). Green: cytosolic eGFP released from the cleavage of dt-runx1-eGFP. Note that because of mosaicism, HE cell 2 does not express mkate2-podxl2. Scale bars = 20 µm. (C) Evolution of an EHT cell extracted from a 7 hr time-lapse sequence (0–420 min, starting from around 40hpf) and showing significant changes in its morphology throughout emergence. Note the sub-luminal and cytosolic localization of pools of Podxl2 (notably at t=30 min, magenta arrows) suggesting enhanced trafficking of the protein and relative instability of apical polarity, consistently with apparent fluctuation of the luminal membrane surface contacting the aortic lumen (green arrows, in particular at t=240 min). At t=420 min, the cell has emerged and Podxl2 containing membranes remain in close contact with the membrane contacting the aortic floor. Scale bar = 10 µm.
Figure 3—figure supplement 3
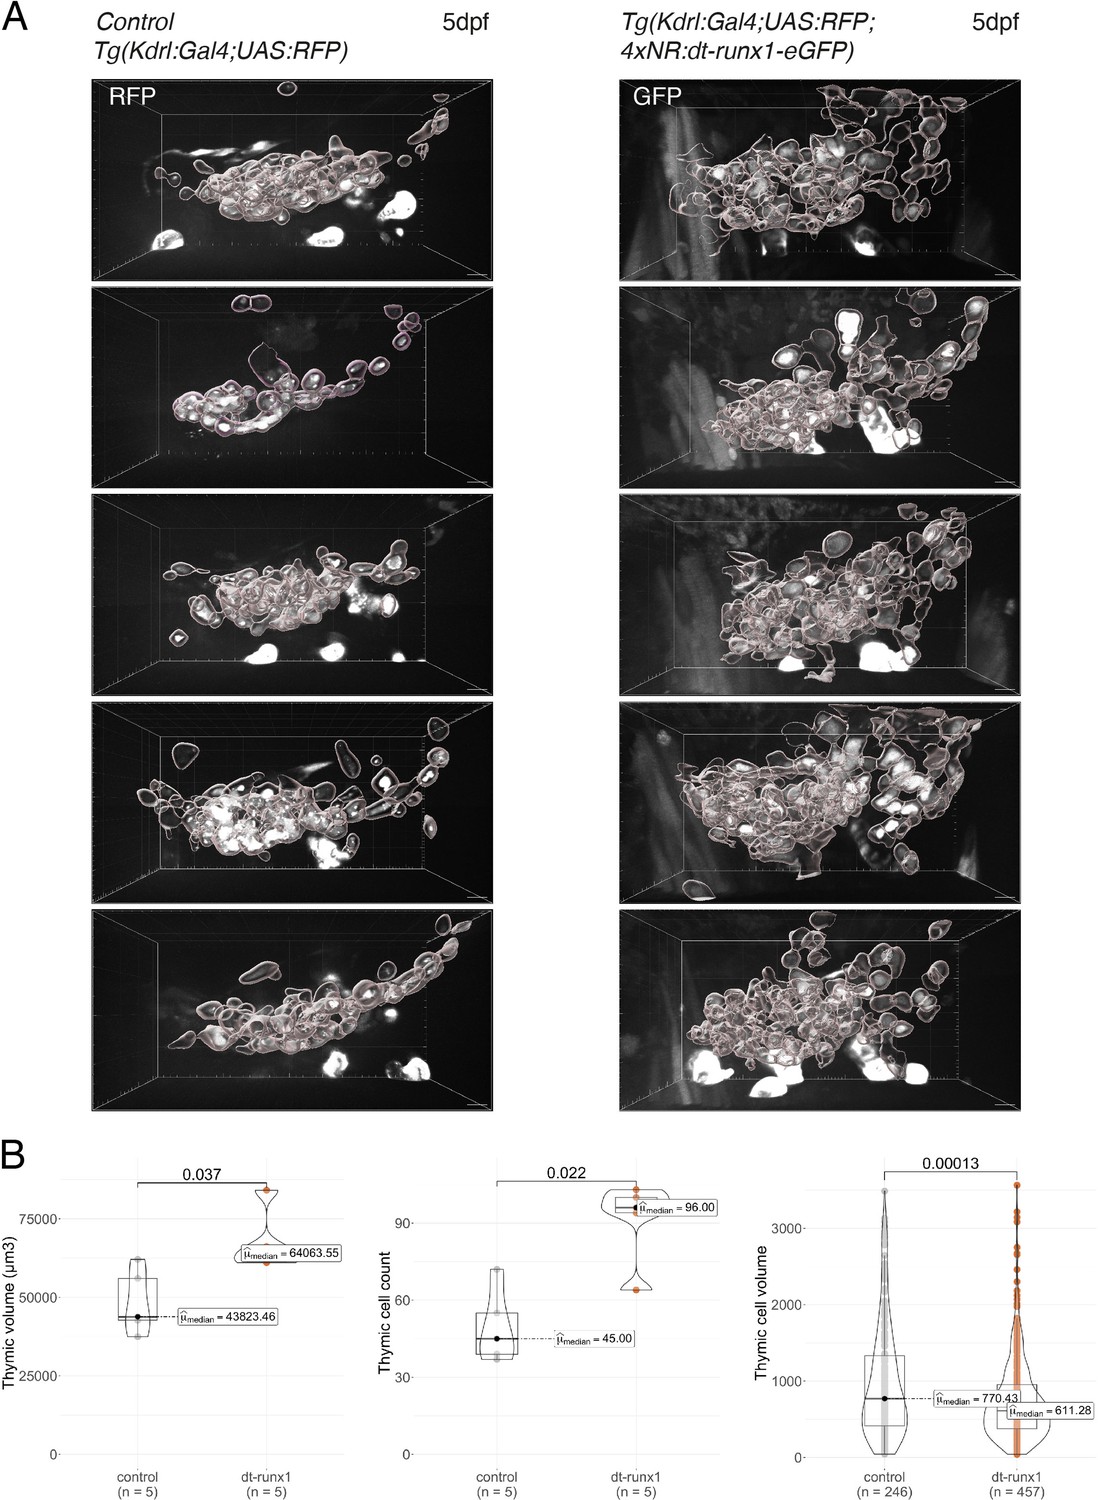
Phenotypic analysis of dt-runx1 expressing mutants: expansion of the thymus.
(A) 3D-rendering of confocal spinning disk sections of the thymus region of 5 dpf Tg(kdrl:gal4;UAS:RFP) (left, control) and incrossed Tg(kdrl:Gal4;UAS:RFP;4xNR:dt-runx1-eGFP) (right, dt-runx1) larva. Thymic cells have been individually segmented. Scale bars = 10 µm. (B) Morphometric analysis of the thymus. Left: thymic volume (in µm3, corresponding to the sum of all thymic cell volumes). Center: cell count. Right: thymic cells volume (in µm3). Statistical comparisons have been performed using two-sided unpaired Wilcoxon tests, all p-values are displayed. Analysis was carried out on n=5 control embryos and n=5 mutant embryos.
Figure 3—video 1
Cellular expansion in the thymus of a dt-runx1 embryo compared to control.
3D-rendering of confocal spinning disk sections of the thymus region of 5 dpf Tg(kdrl:gal4;UAS:RFP) (left, control) and incrossed Tg(kdrl:Gal4;UAS:RFP;4xNR:dt-runx1-eGFP) (right, dt-runx1) larva. Thymic cells have been individually segmented. Scale bar = 10 µm.
Figure 4 with 4 supplements
Pard3ba expression is highly sensitive to interference with Runx1 activity.
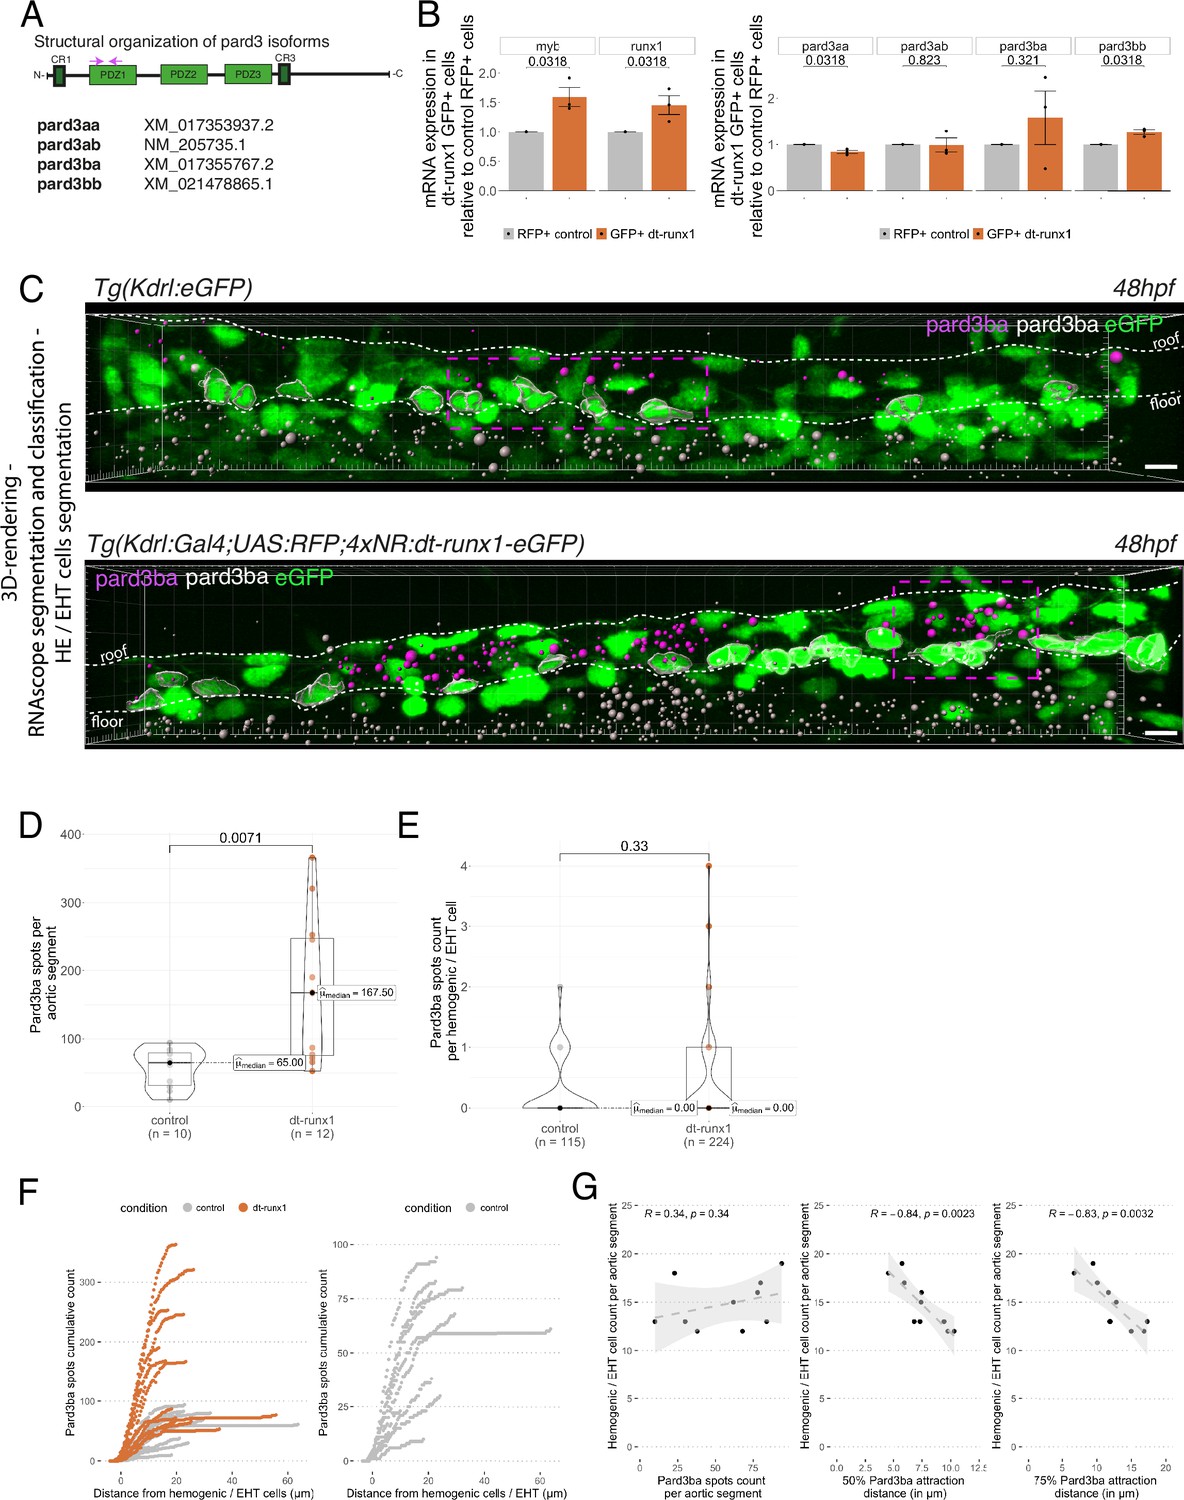
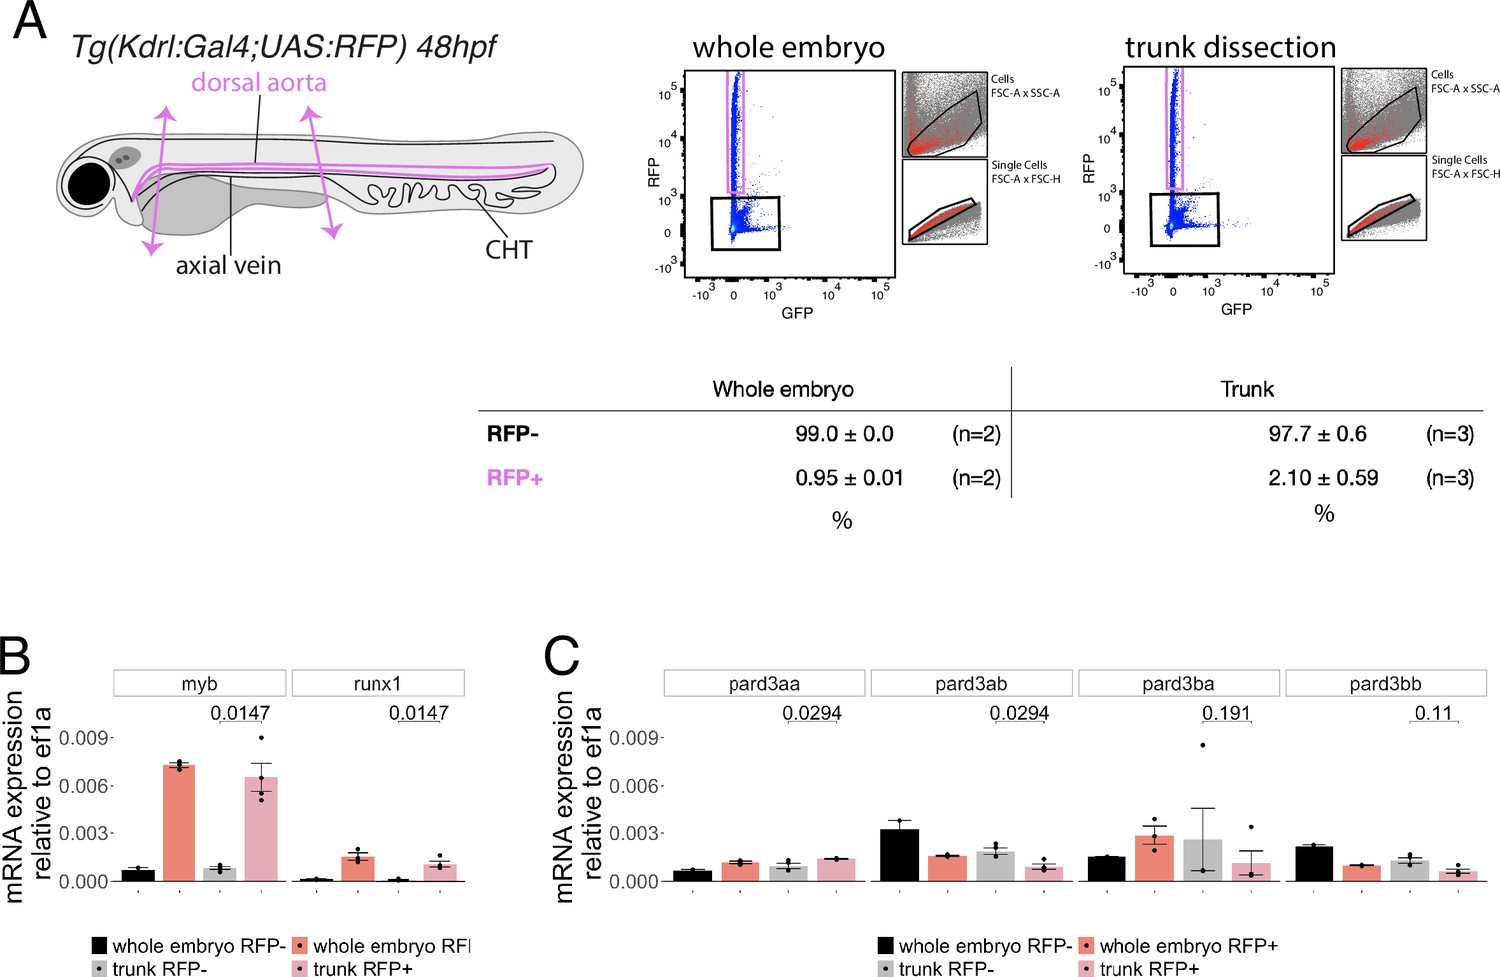
(A) Pard3aa, ab, ba, and bb zebrafish gene products, with their accession numbers. The cartoon represents the common structures of the four proteins, with the three sequential PDZ domains (PDZ1-3), and the CR1 and CR3 conserved regions involved in oligomerization and atypical protein kinase C (aPKC) binding, respectively. The magenta arrows show the positioning of qRT-PCR primers, located in the PDZ1 domain (see Materials and ethods for primer sequences). (B) qRT-PCR analysis of genes expression levels of (left) the hematopoietic markers myb and runx1, (right) the four Pard3 mRNAs (encoding for Pard3aa, ab, ba, and bb) in cell populations isolated from FACS-sorted trunk vascular cells of 48–50 hpf control and mutant embryos (see Figure 4—figure supplement 1, Figure 4—figure supplement 2 and Materials and methods for cell isolation procedures). Graphs show the measured mean fold changes relative to the expression of ef1α and to the expression in RFP+ control cells. Statistical tests: two-sided unpaired two samples Wilcoxon test, all p-values are displayed. Analysis was carried out on n=3 for control and mutant conditions. (C) Representatives images (Imaris 3D-rendering) of RNAscope in situ hybridizations for Pard3ba in 48–50hpf Tg(Kdrl:eGFP) control embryos and Tg(Kdrl:Gal4;UAS:RFP;4xNR:dt-runx1-eGFP) mutant embryos. The aorta is outlined with the white dashed lines. The RNAscope signal was segmented into spots and classified based on its localization: in aortic endothelial and hemogenic cells (magenta spots) or in extra-aortic tissues (grey spots, essentially residing in the sub-aortic space). Magenta dashed boxes delineate examples of mRNA Enriched Regions (MERs) in control and mutant embryos. Scale bars = 10 µm. (D) Pard3ba spots count per aortic segment. (E) Pard3ba spots count per hemogenic/EHT cells. (F) Cumulative Pard3ba spots count relative to hemogenic/EHT cell distance, averaged for each aortic segment, in control embryos (grey) and dt-runx1 mutant embryos (orange). (G) HE/EHT cell count relative to number of spots, all expressed per aortic segment (left), 50% Pard3ba spots attraction distance (in µm) (middle) or 75% Pard3ba spots attraction distance (in µm) (right). 50%/75% spots attraction distance corresponds to the distance from hemogenic/EHT cells within which 50%/75% of Pard3ba spots are located. Grey dash lines correspond to regression lines and light grey background correspond to the confidence interval (95%) of the regression model. Linear correlation coefficient (R, Pearson correlation) is displayed for each condition. For (D and E), statistical tests: two-sided unpaired two samples Wilcoxon test, all p-values are displayed. Analysis was carried out on n=5 control embryos and n=6 mutant embryos, 2 aortic segments per embryos. For (G) p-values were calculated using a t-test. Raw images (z-stacks) for this figure and Figure 4—figure supplement 3 (Pard3 mRNA expression in control and mutant conditions) are available at https://doi.org/10.5281/zenodo.10937428.
Figure 4—figure supplement 1
Expression levels of Pard3 mRNAs in FACS-sorted endothelial cells.
(A) Experimental strategy to isolate endothelial cells for subsequent gene expression analyses by qRT-PCR. 48hpf Tg(Kdrl:Gal4;UAS:RFP) whole embryos and trunk dissected regions (delimited by two magenta arrows) were treated to dissociate cells and populations of interest were sorted by FACS. n=2 experiments were performed for the whole embryo RFP+ cell population (left) and n=3 experiments were performed for the trunk RFP+ cell population (right). Subsequently, RNA was isolated from 20,000 negative cells (RFP-, black) and from 6500 to 9142 cells for the RFP expressing population (RFP+, magenta). The relative proportions of RFP+ and RFP- cells in the two conditions are displayed (table). (B, C) qRT-PCR analysis of gene expression levels of the hematopoietic markers myb and runx1 (B) and of the four Pard3 mRNAs (encoding for Pard3aa, ab, ba, and bb, (C)) in vascular and non-vascular cells from 48 to 50hpf whole embryos and dissected trunks. Graphs show the measured mean fold changes relative to ef1α. Statistical tests (two-sided unpaired two samples Wilcoxon test, all p-values are displayed) were only performed to compare expression levels in RFP + and RFP- cells isolated from trunk regions (three independent experiments).
Figure 4—figure supplement 2
Localization of Pard3 mRNAs using RNAscope.
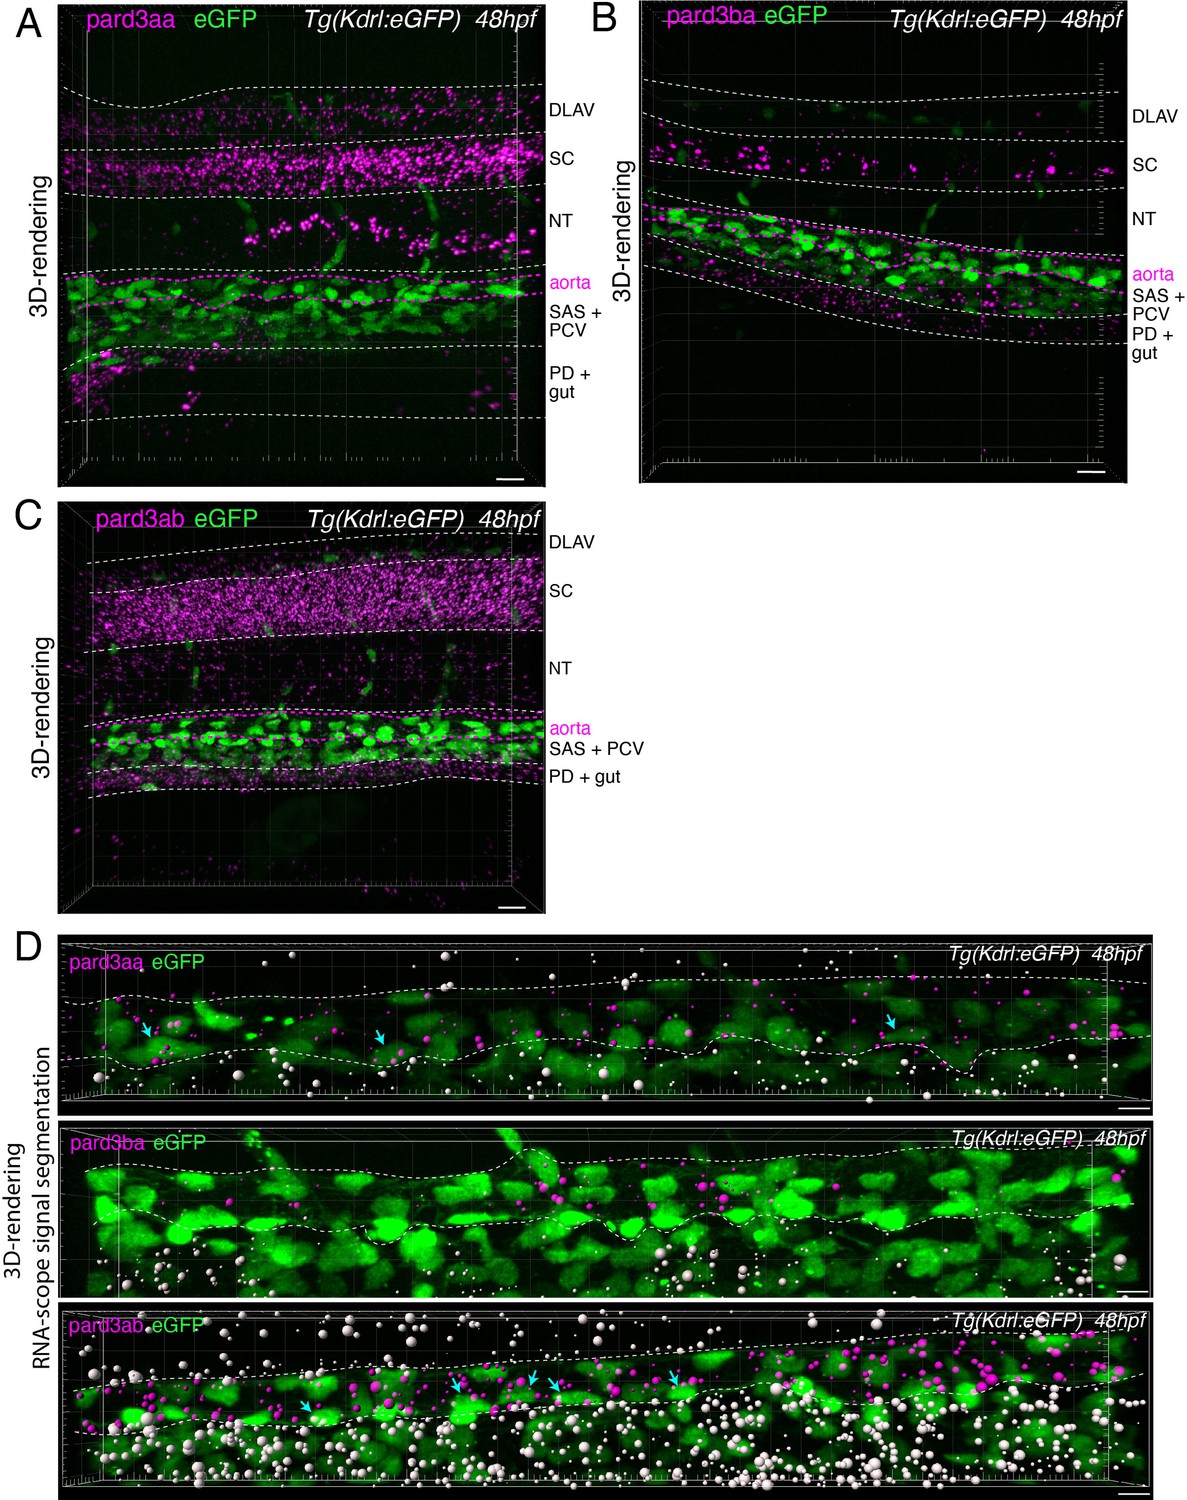
(A-C) Representative images (Imaris 3D-rendering) of RNAscope in situ hybridizations for Pard3aa, Pard3ba, and Pard3ab in 48–50hpf Tg(Kdrl:eGFP) control embryos. Images show the whole pattern of expression of Pard3aa, Pard3ba, and Pard3ab mRNAs in the trunk region (z-projections). Anatomical regions are outlined with white dashed lines, and roughly annotated based on location and with the support of transmitted light images (not shown). The aorta is outlined with magenta dashed lines. DLAV: dorsal longitudinal anastomotic vessels, SC: spinal cord, NT: notochord, SAS: sub-aortic space, PCV: posterior cardinal vein, PD: pronephric duct. Scale bars = 10 µm. (D) Representative images (Imaris 3D-rendering) of RNAscope in situ hybridizations for Pard3aa, Pard3ba, and Pard3ab from trunks narrowed down to aortic and sub-aortic regions of 48–50hpf Tg(Kdrl:eGFP) embryos. The aorta is outlined with white dashed lines. The RNAscope signals were segmented into spots and classified based on their localization: in aortic endothelial and hemogenic cells (magenta spots) or in extra-aortic tissues (grey spots). Scale bars = 10 µm.
Figure 4—figure supplement 3

Expression of Pard3ba is upregulated by dt-Runx1.
(A) Experimental strategy to isolate endothelial cells from Tg(Kdrl:Gal4;UAS:RFP) and Tg(Kdrl:Gal4;UAS:RFP;4xNR:dt-runx1-eGFP) embryos for subsequent gene expression analyses by qRT-PCR. Forty-eight hpf control (left) and dt-runx1 expressing mutant embryos (right) were dissected to isolate trunk regions (delimited by two magenta arrows) that were subsequently treated to dissociate cells and populations of interest were sorted by FACS. n=3 experiments were performed. RNA was isolated from 1900 to 3200 cells for the dt-runx1 mutant (green population) and from 6500 to 9142 cells for control RFP expressing cells (magenta population). (B) Representative images (Imaris 3D-rendering) of RNAscope in situ hybridizations for Pard3ba in 48–50hpf Tg(Kdrl:eGFP) control embryos (left) and dt-runx1 mutant embryos Tg(Kdrl:Gal4;UAS:RFP;4xNR:dt-runx1-eGFP) (right). The aorta is outlined with the white dashed lines. The RNAscope signals were segmented into spots and classified based on their localization: in aortic endothelial and hemogenic cells (magenta spots) or in extra-aortic tissues (grey spots). Scale bars = 10 µm. (C) Hemogenic/EHT cell count per aorta segment, separated based on their pard3ba expression (with, from left to right, 0–4 Par3ba spots). Statistical tests: two-sided unpaired two samples Wilcoxon test, all p-values are displayed. Analysis was carried out on n=5 control embryos and n=6 mutant embryos, 2 aortic segments per embryo.
Figure 4—figure supplement 4
Expression of Pard3aa and Pard3ab are insensitive to dt-Runx1.
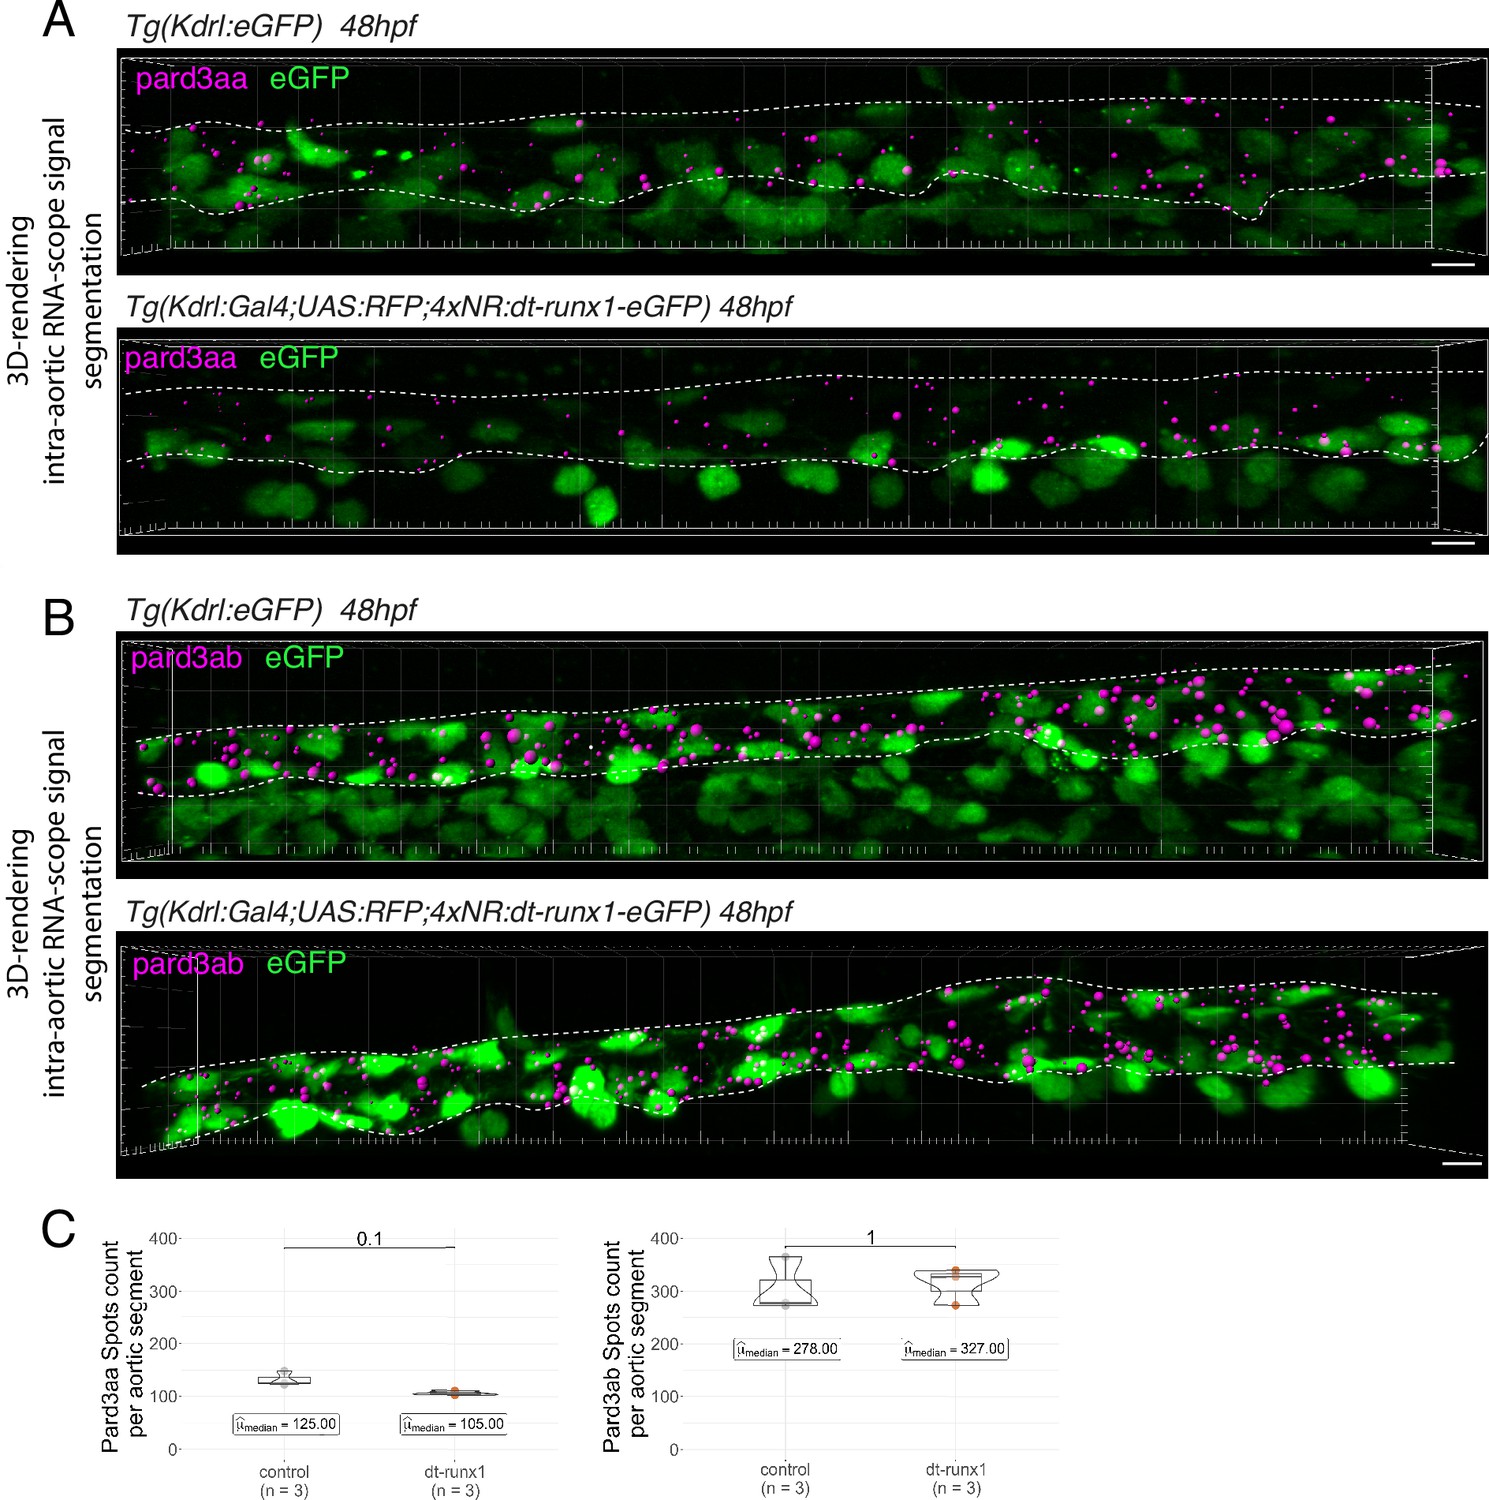
(A, B) Representative images (Imaris 3D-rendering) of RNAscope in situ hybridizations for Pard3aa and Pard3ab in trunk regions of 48 - 50hpf Tg(Kdrl:eGFP) control embryos and Tg(Kdrl:Gal4;UAS:RFP;4xNR:dt-runx1-eGFP) mutant embryos. The aorta is outlined with the white dashed lines. The RNAscope signals were segmented into spots; only the spots localized in the dorsal aorta are represented (magenta spots). Scale bars = 10 µm. (C) Pard3aa (left) and Pard3ab (right) spots count per aortic segment. Statistical tests: two-sided unpaired two samples Wilcoxon test, all p-values are displayed. Analysis was carried out on n=3 control embryos and n=3 mutant embryos.
Figure 5 with 2 supplements
eGFP-Jam3b localization is reinforced at antero-posterior sites of the endothelial/EHT interface and at tri-cellular junctions.
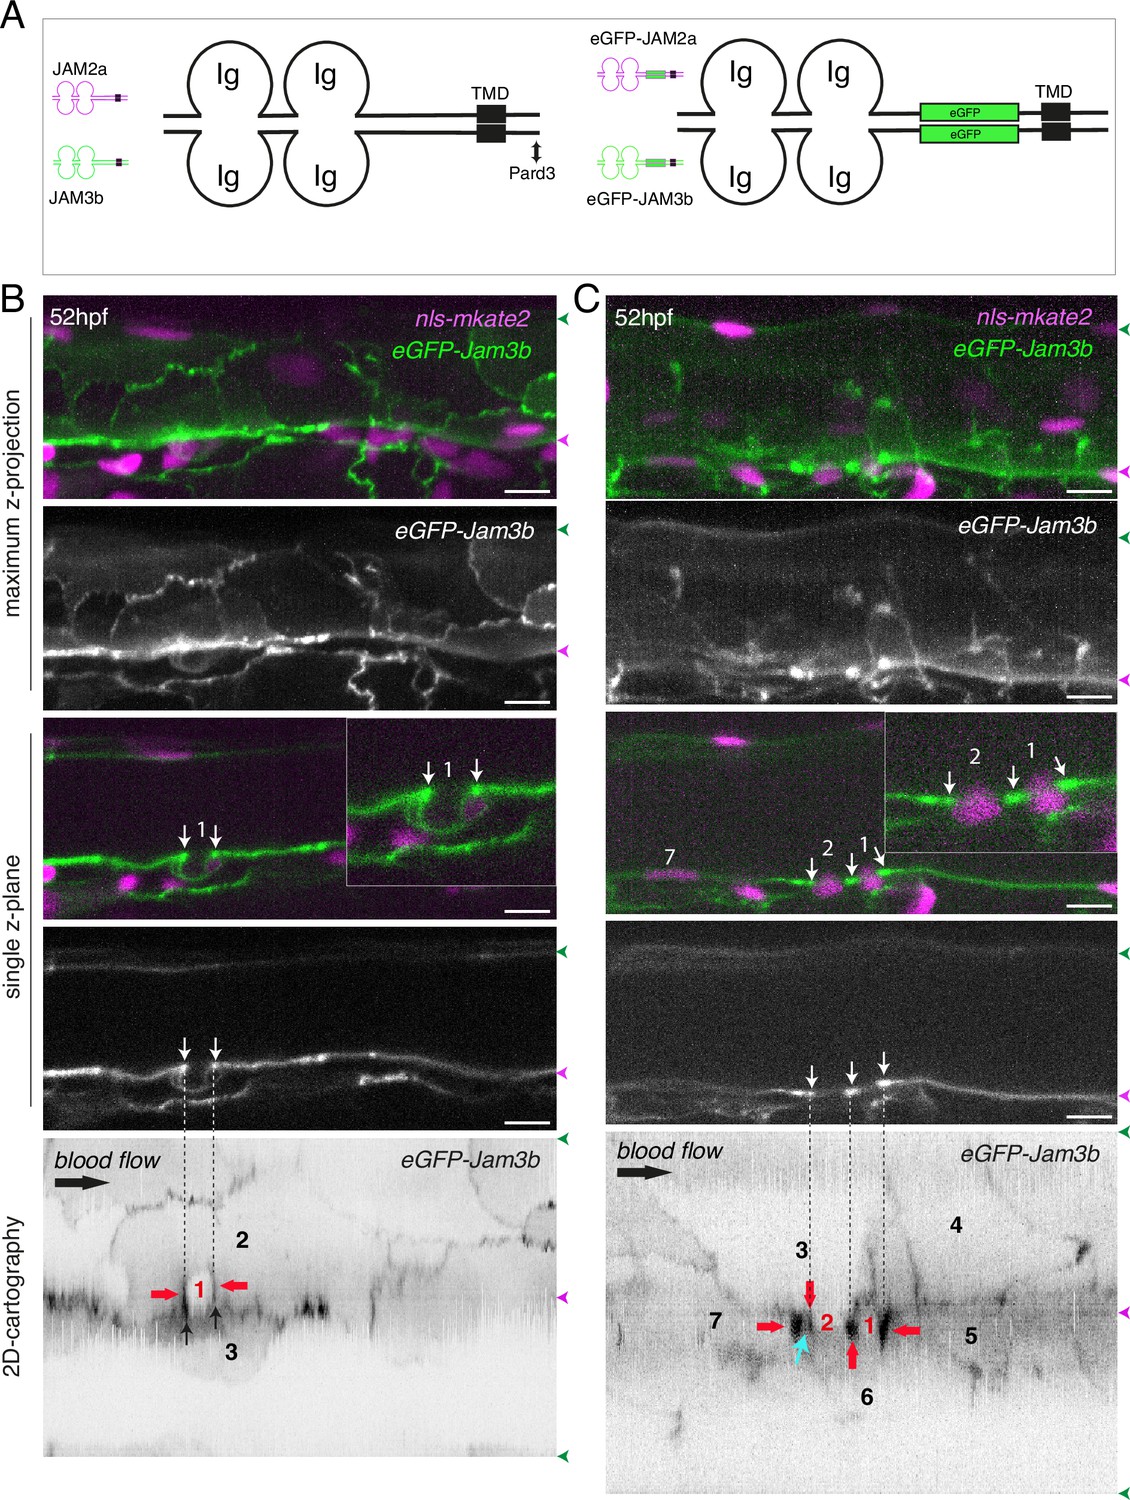
(A) Cartoons representing homodimers of full-length JAMs with the C-terminal cytosolic part interacting with Pard3 (JAMs interact with the first PDZ domain of Pard3) as well as the constructs generated in this study and containing eGFP inserted between the Immunoglobulin-like (Ig) domains and the trans-membrane region (TMD). The constructs were obtained for zebrafish JAM2a and JAM3b. (B, C) 52 hpf Tg(kdrl:eGFP-Jam3b; kdrl:nls-mKate2) embryos were imaged in the trunk region (AGM) using spinning disc confocal microscopy. The panels are either maximum z-projections (top two) or single plane z-sections (bottom two, focusing on the aortic floor) of aortic segments, with either the merged nls-mkate2 and eGFP-Jam3b fluorescence signals (magenta and green) or the eGFP-Jam3b signal only (black and white images). Bottom of the figure: 2D-cartographies obtained after deploying aortic cylinders and showing the eGFP-Jam3b signals only. The white/black vertical dashed lines show the correspondence of the antero-posterior junctional reinforcements in the single z-sections (white arrows) on the respective 2D-cartographies resulting from the deployment of the aortic walls (obtained from the z-stacks). (B) Example of an EHT pol+ cell (cell 1, white arrows point at reinforcement of signal at antero-posterior junctions). On the 2D cartography, cell 1 (red) is contacting endothelial cells 2 and 3; note the reinforcement of eGFP-Jam3b signals along antero-posterior membrane interfaces perpendicular to blood flow (red arrows) as well as at the two tri-cellular junctions visible between cells 1, 2 and 3 (black arrows). (C) Example of two EHT pol- cells (cells 1 and 2, white arrows point at reinforcement of signal at antero-posterior junctions). On the 2D cartography, cells 1 and 2 (red) are contacting endothelial cells 3, 4, 6 and 3, 6 respectively; note the reinforcement of eGFP-Jam3b signals along antero-posterior membrane interfaces perpendicular to blood flow (red arrows) and endothelial cell 6 that has intercalated between endothelial cell 7 and EHT pol- cell 2 (blue arrow). In right margins, magenta and green arrowheads designate the aortic floor and roof, respectively. Scale bars = 10 µm.
Figure 5—figure supplement 1

Model depicting the evolution of junctional interfaces and of the differential mobility of antero-posterior junctional complexes for EHT pol+ and EHT pol- cell emergence types.
Top panel: EHT pol+ cell whose emergence depends on the constriction of circumferential actomyosin (orange, see Lancino et al., 2018) and the reduction of the membrane interface contacting endothelial neighbors shrinking along the longitudinal axis (horizontal double arrows) and in the 2D plane (endothelial neighbors are not depicted and are embedded in the blue X-Y plane). Presumably, the reduction of membrane interfaces relies on consumption via endocytosis. Green ovals: junctional complexes reinforced at antero-posterior poles. Green line: apical/luminal membrane with typical inward bending. Bottom panel: EHT pol- cell whose emergence depends on the dynamics of adhesion pools that move synchronously in 3D (X, Y, Z), both at antero-posterior poles (blue ovals) and at lateral sides of the emerging cell contacting endothelial neighbors (adjoining endothelial cells are not depicted and are embedded in the blue X-Y plane). Presumably, this type of emergence in which endothelial cells crawl over the EHT cell (curved arrows) involves, for the latter, a partial retrograde endocytic recycling of junctional complexes (opposite to the direction of emergence). Note that nuclei are not drawn at scale.
Figure 5—figure supplement 2
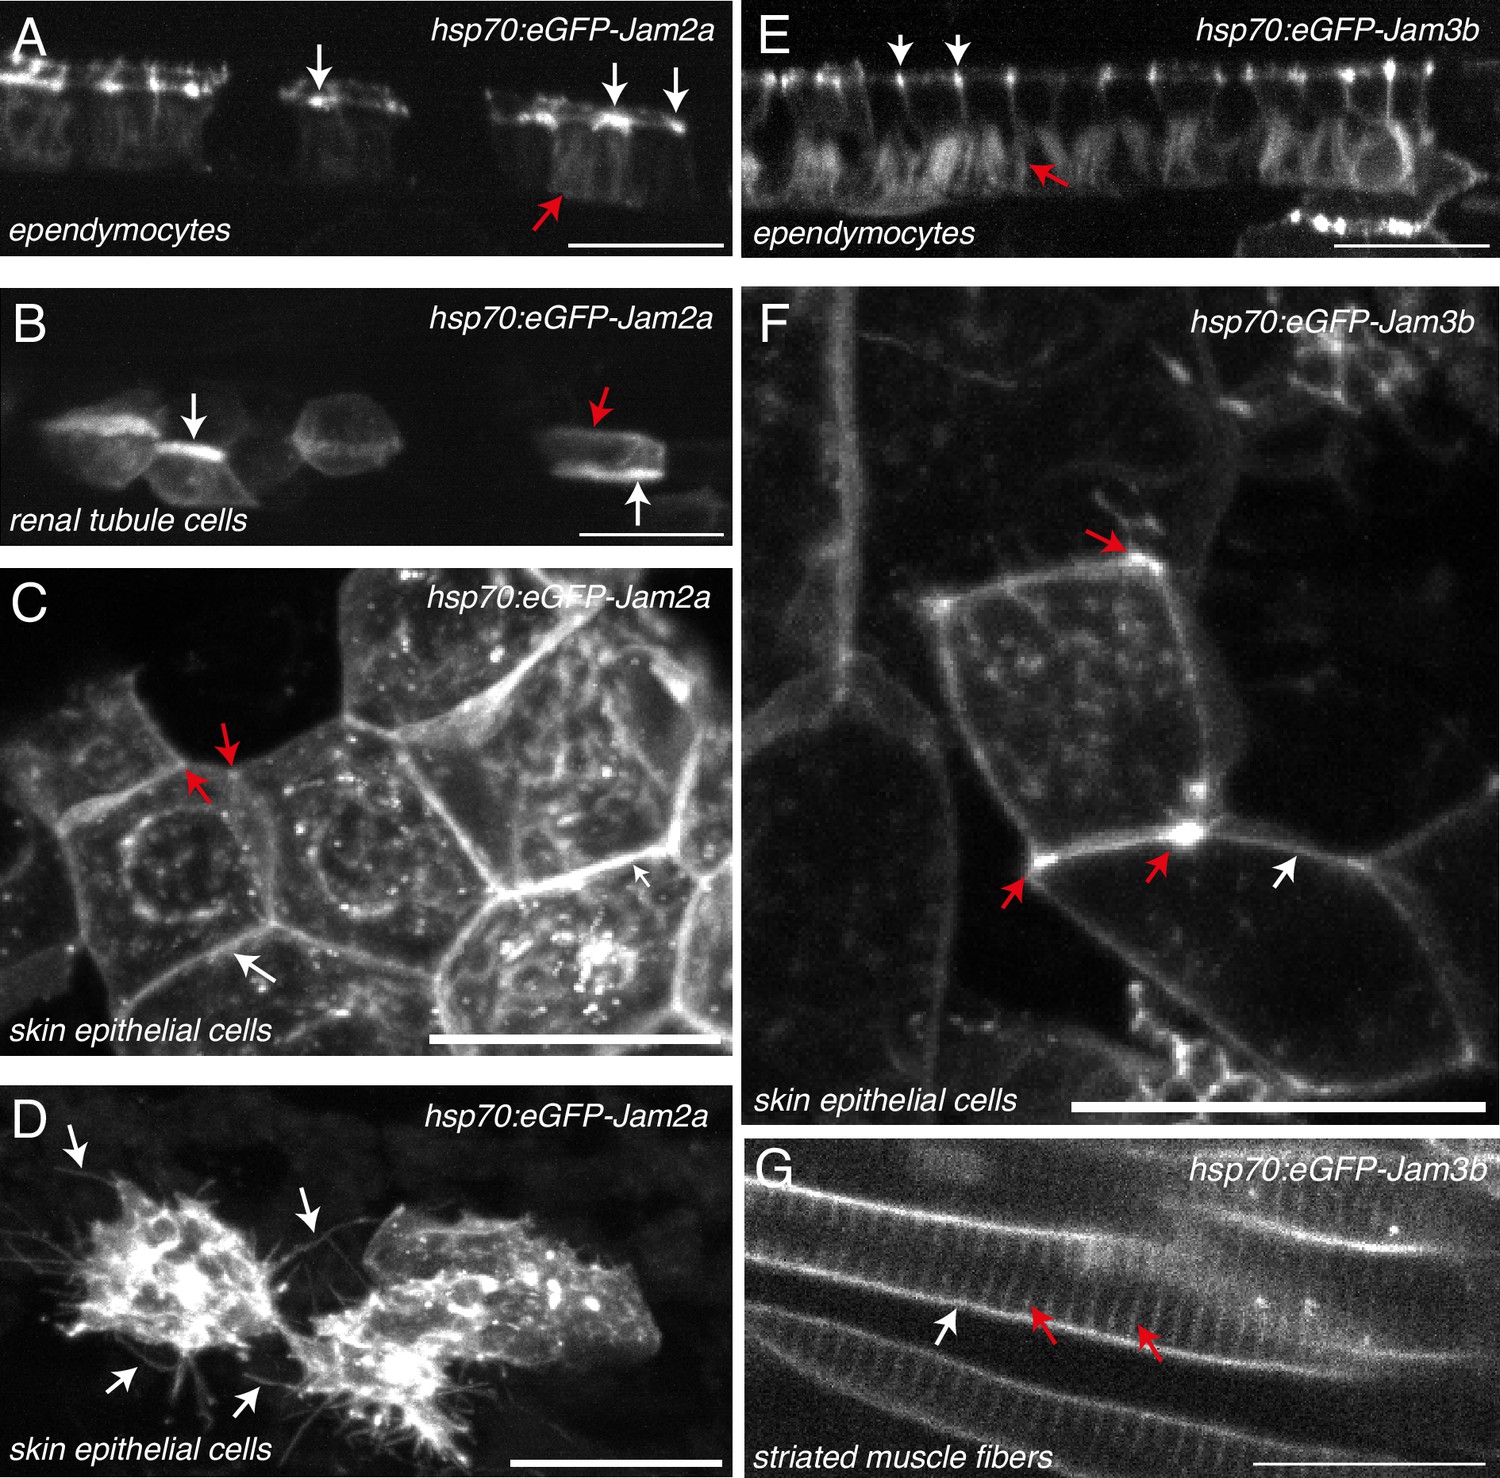
JAM2a and JAM3b expression and localization in diverse embryonic tissues.
Localization of transiently expressed eGFP-Jam2a (A–D) and eGFP-Jam3b (E–G) in 52 hpf embryos, using spinning disk confocal microscopy. Plasmid constructs were expressed under the control of the heat shock Hsp70 promoter. For both constructs, expression was induced approximately 6 hr before imaging, by 1 hr balneation in 39 °C embryo medium. All images are maximum z-projections. (A, E) Ependymal cells. White and red arrows point at reinforcement of eGFP-Jam2a and eGFP-Jam3b at apical intercellular junctions and at basolateral membranes, respectively. (B) Pronephric tubule cells. White arrows point at the reinforcement of the eGFP-Jam2a signal at apical sides of membranes of polarized cells constituting pronephric tubules. The red arrow points at baso-lateral localization of eGFP-Jam2a. (C, F) Skin epithelial cells. White arrows point at the localization of eGFP-Jam2a and eGFP-Jam3b at lateral junctional interfaces between two neighboring cells. Red arrows point at tri-cellular junctions at which the density of eGFP-Jam2a and eGFP-Jam3b is reinforced. (D) Skin epithelial cells. White arrows point at membrane protrusions. (G) Striated muscle cells. Red arrows point at T-tubules (invagination of the sarcolemmal membranes); white arrows point at the plasma membranes of myofibrils. Scale bars = 20 µm.
Figure 6 with 1 supplement
Junctional recycling at tri-cellular contacts is differentially controlled between the two EHT types.
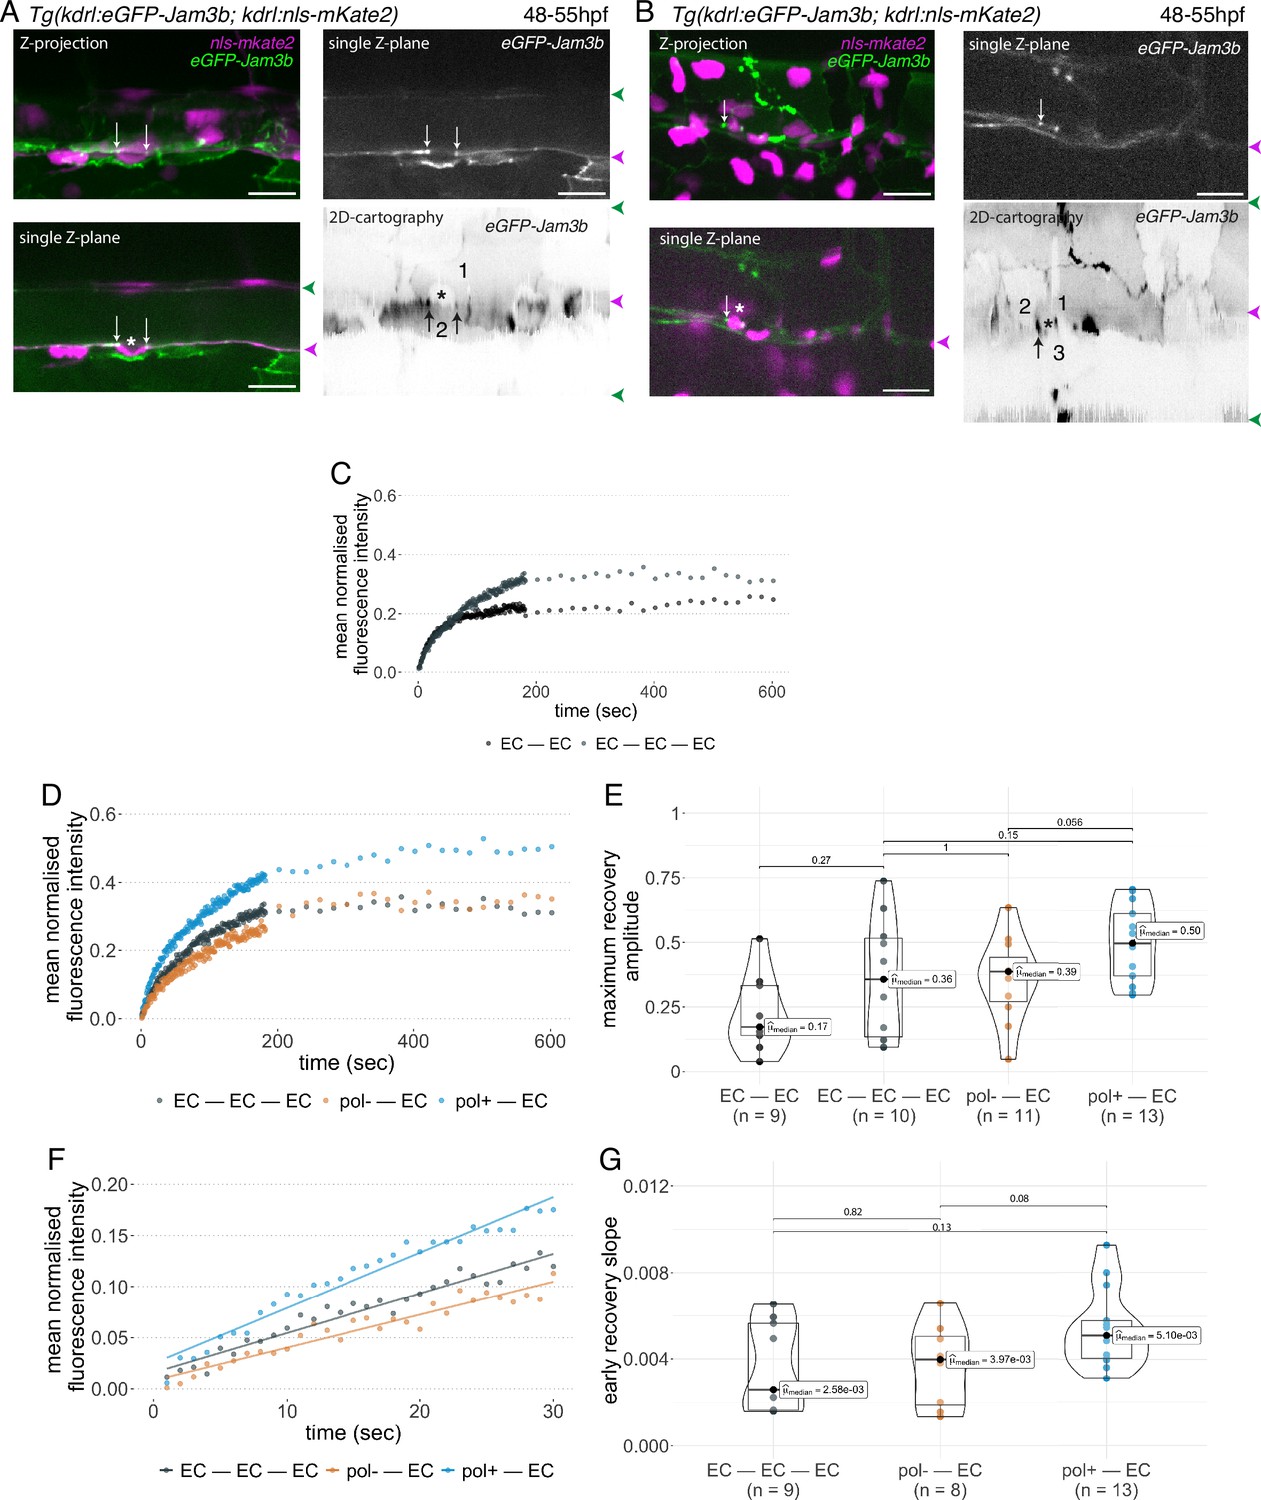
Forty-eight to 55 hpf Tg(kdrl:eGFP-Jam3b; kdrl:nls-mKate2) embryos were imaged using spinning disc confocal microscopy and illuminated for Fluorescence Recovery After Photobleaching (FRAP) in the trunk region (AGM, Aorta Gonad Mesonephros). (A, B) Panels are either maximum z-projections (top left) or single plane z-sections (bottom left and top right, focusing on the aortic floor) of aortic segments, with either the merged nls-mkate2 and eGFP-Jam3b fluorescence signals (magenta and green) or the eGFP-Jam3b signal only (black and white images). White arrows point at reinforcement of signal at antero-posterior junctional pools of an EHT pol+ cell (A) or of an EHT pol- cell (B), both marked by asterisks. Bottom right: 2D-cartographies obtained after deploying aortic cylinders and showing the eGFP-Jam3b signals only. Black arrows point at antero-posterior junctional pools, in particular at tri-junctional regions that exhibit increase in signal density (well visible in A black arrows). 2 and 3 endothelial cells are contacting the EHT pol+ cell (A) and the EHT pol- cell (B), respectively. In right margins, magenta and green arrowheads designate the aortic floor and roof, respectively. Scale bars = 20 µm. (C—G) FRAP analyses. EGFP-Jam3b junctional pools corresponding to the brightest spots inside junctional regions of interest were bleached for FRAP measurements (these high intensity pools were localized at the level of bi- and tri-junctions for endothelial cells (EC) and in tri-junctional regions for EHT pol+ and EHT pol- cells; all these junctional pools were systematically visualized by deploying each aortic segment before bleaching as shown in the 2D-cartographies in A and B as well as in Figure 6—figure supplement 1, see also Materials and methods). FRAP analysis concerned three types of junctional interfaces: between endothelial cells (EC – EC, black and grey), EHT pol- and endothelial cells (pol- – EC, brown), EHT pol+ and endothelial cells (pol+ – EC, blue). (C, D) Evolution of mean fluorescence intensity for each type of junctional interface over time (10 min), after photobleaching (t=0 s). (E) Median maximum amplitude of recovery of all determinations and for each type of junctional interface (maximum of simple exponential fitted curves). (F, G) Early fluorescence recovery. Early evolution (over the first 30 s) of the mean fluorescence intensity for each type of junctional interface over time after photobleaching (t=0 s). (F) The fitted lines correspond to linear regressions of mean fluorescence intensities. (G) Median values of fluorescence recovery slopes (linear regressions) of all determinations and for each type of junctional interface. (E, G) The number of biological replicate (n) is stated on the plots. Statistical tests: two-sided unpaired two samples Wilcoxon test.
Figure 6—figure supplement 1
Examples of junctional contacts targeted by FRAP in the aortic landscape.
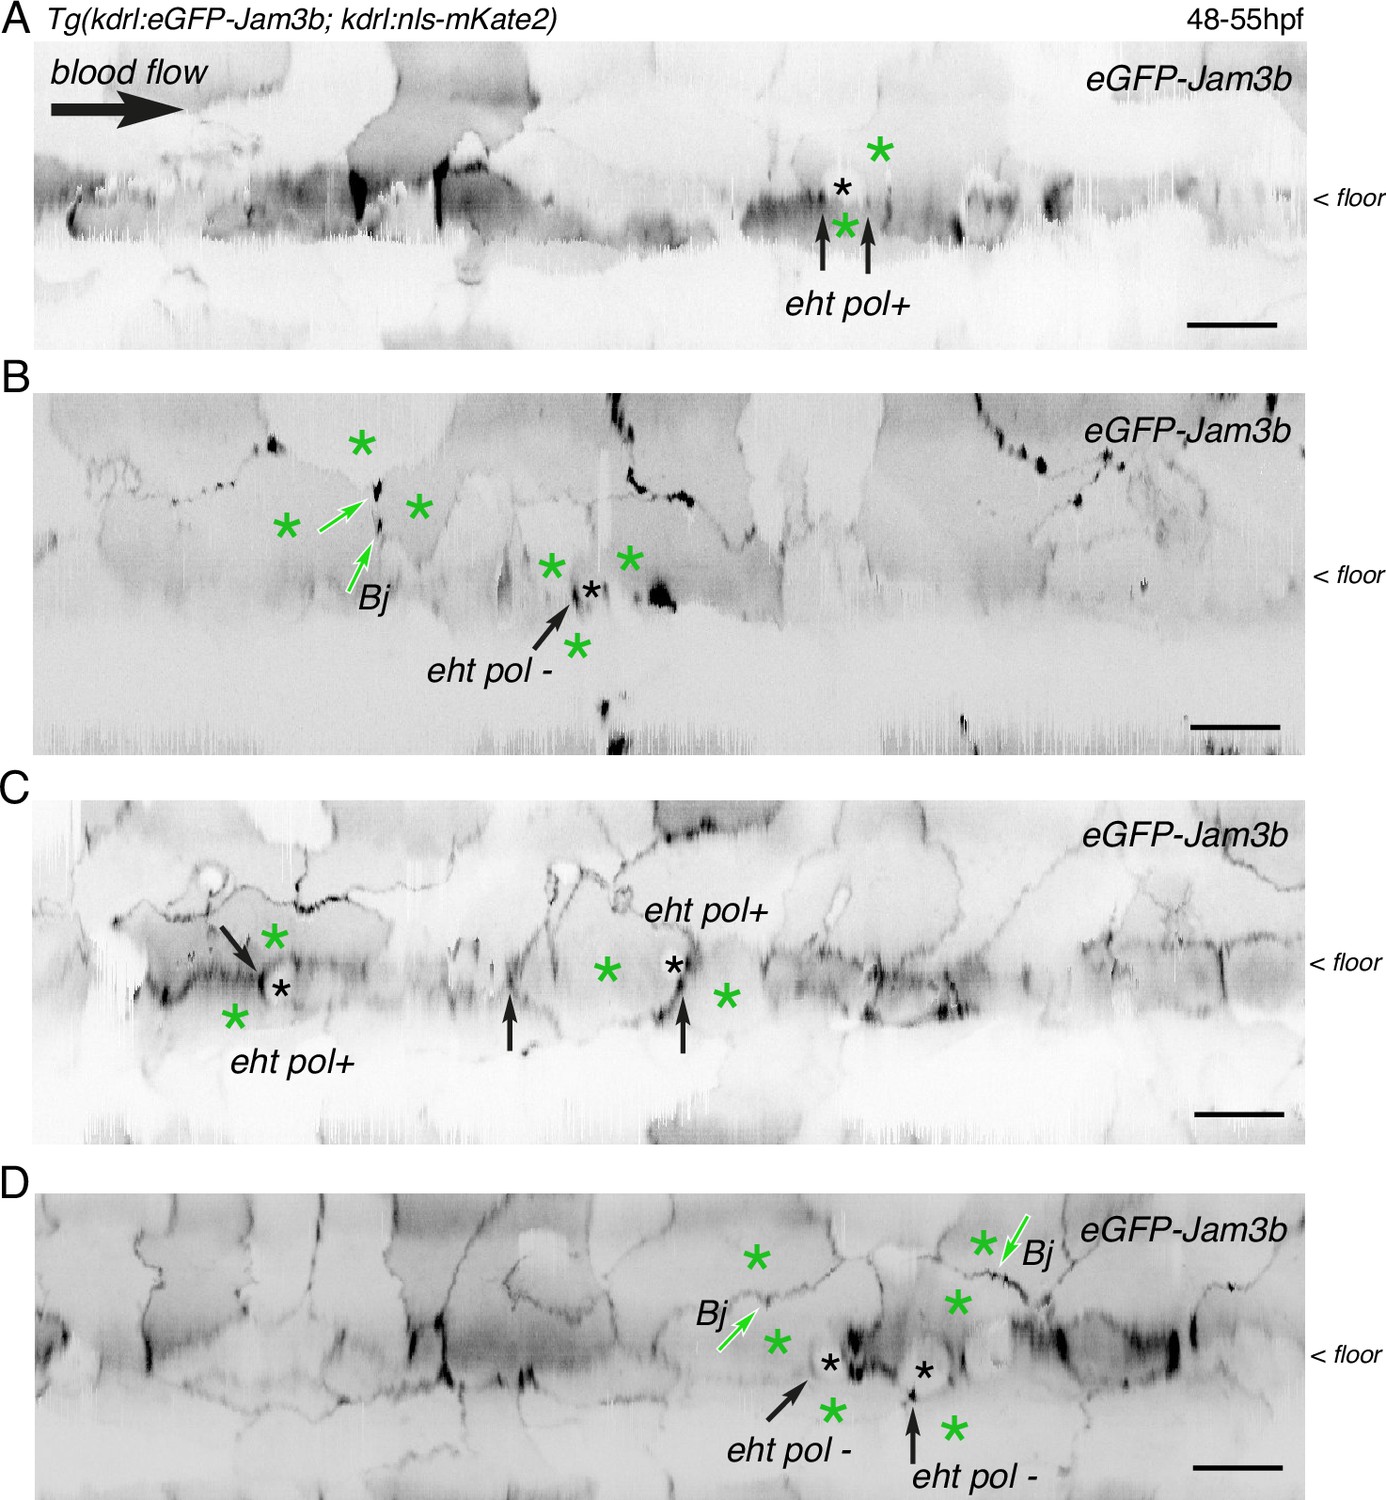
After performing z-stack acquisitions in trunk regions followed by 2D-deployment of aortic segments (A-C), 4 different Tg(kdrl:eGFP-Jam3b; kdrl:nls-mKate2) 48–55 hpf embryos were illuminated for FRAP. Panels (A and B) are the entire segments from which cropped images of EHT pol+ and EHT pol- cells (black asterisks) and surroundings were extracted to build the panels A and B of Figure 6. Panels (C and D) are from two other embryos. The 2D-cartographies allow visualizing the junctions that were selected for FRAP, with the black arrows pointing at junctional interfaces between EHT and endothelial cells (all are in the area of tri-junctions) and the green arrows pointing at bi-junctions (Bj) or tri-junctions between endothelial cells (green asterisks). Scale bars = 20 µm.
Figure 7 with 7 supplements
Interfering with ArhGEF11/PDZ-RhoGEF function leads to the accumulation of hemogenic cells and impairs EHT progression.
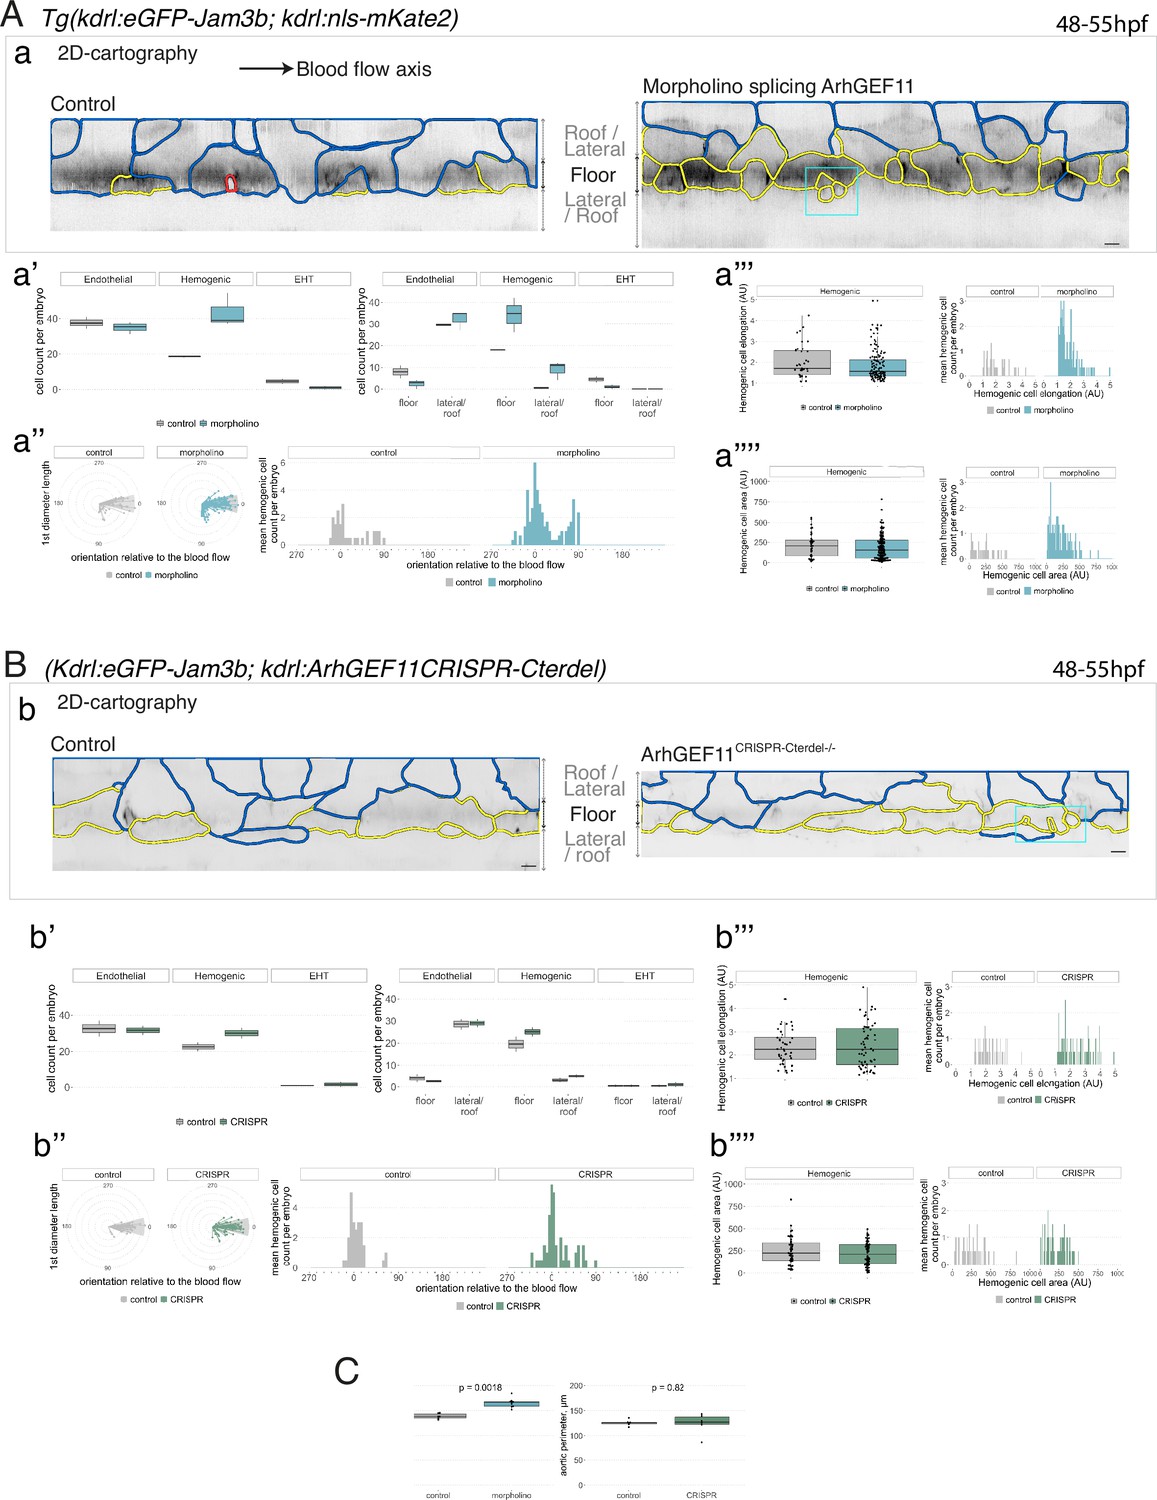
(A-C) Numeration and morphometric analyses of aorta and cell types for Tg(kdrl:eGFP-Jam3b; kdrl:nls-mKate2) ArhGEF11 exon 38 splicing morpholino-injected and control embryos (A), or for (Kdrl:eGFP-Jam3b; kdrl:ArhGEF11CRISPR-Cterdel+/+) homozygous ArhGEF11 C-ter deletion mutants and control siblings. (B) Forty-eight to 55 hpf embryos were imaged using spinning disk confocal microscopy. (Aa, Bb) 2D-cartographies obtained after deploying aortic cylinders and showing the eGFP-Jam3b signals only with cell contours delineated either in blue (endothelial cells), yellow (hemogenic cells, see Materials and methods for their morphological definition), red (morphologically characterized EHT cells, for controls), and small cells delineated by cyan boxes (morphologically uncharacterized EHT cells and putative post-mitotic cells remaining as pairs, included in the numeration as hemogenic cells). Cellular contours have been semi-automatically segmented along the cellular interfaces labeled with eGFP-Jam3b (see Materials and methods). Scale bars: 10 µm. (Aa’, Bb’) Left: numeration of endothelial, hemogenic and EHT-undergoing cells according to the position of their geometrical center (either on the aortic floor, or on the roof, or on the lateral side), for each condition; right: number of endothelial, hemogenic and EHT-undergoing cells in each condition calculated from the segmentation of 3x2D-projections per embryo and covering the entire aortic regions in the trunk. (Aa’’, Bb’’) Left: length of hemogenic cells (in the longest axis) in function of their orientation (°) relative to the blood flow axis (0–180°); right: distribution of the orientation of hemogenic cells relative to the blood flow axis, displayed as a mean distribution of cells per embryo. (Aa’’’, Bb’’’) Hemogenic cell elongation factors in arbitrary Units (scale factor given by the ratio between the first- and the second-best fitting ellipse diameters, the minimum value being 1 for a non-elongated object) represented as boxplot distribution of all segmented cells (left) or as the distribution of cell elongation factor per embryo (right), for controls and for interfering conditions as indicated. (Aa’’’’, Bb’’’’) Hemogenic cell area represented as boxplot distribution of all segmented cells (left) or as the distribution of cell area per embryo (right), for controls and for interfering conditions as indicated. (C) Aaortic perimeter (in µm) for controls and mutant conditions as indicated. Statistical tests: two-sided unpaired two samples Wilcoxon test. For the ArhGEF11 exon 38 splicing morpholino condition, analysis was performed on 2 x control (non-injected embryos) and 3 x embryos injected at the one-cell stage; for the CRISPR mutant condition, analysis was performed on 2 x wild-type siblings for control and 2 x homozygous mutant embryos whose DNA mutation was confirmed by sequencing. Three consecutive aortic segments per embryo were analyzed to cover the whole length of the dorsal aorta, in the trunk region (covering a distance of 990 µm per embryo). Raw images (z-stacks and 2D cartographies) for panel (A) and Figure 7—figure supplement 5 (morphometric analysis of aortic cells in control and ArhGEF11 morpholino splicing conditions) are available at https://doi.org/10.5281/zenodo.10937430. Raw images (z-stacks and 2D cartographies) for panel (B) and Figure 7—figure supplement 6 (morphometric analysis of aortic cells in control and ArhGEF11 CRIPSR mutant conditions) are available at https://doi.org/10.5281/zenodo.10937434.
Figure 7—figure supplement 1
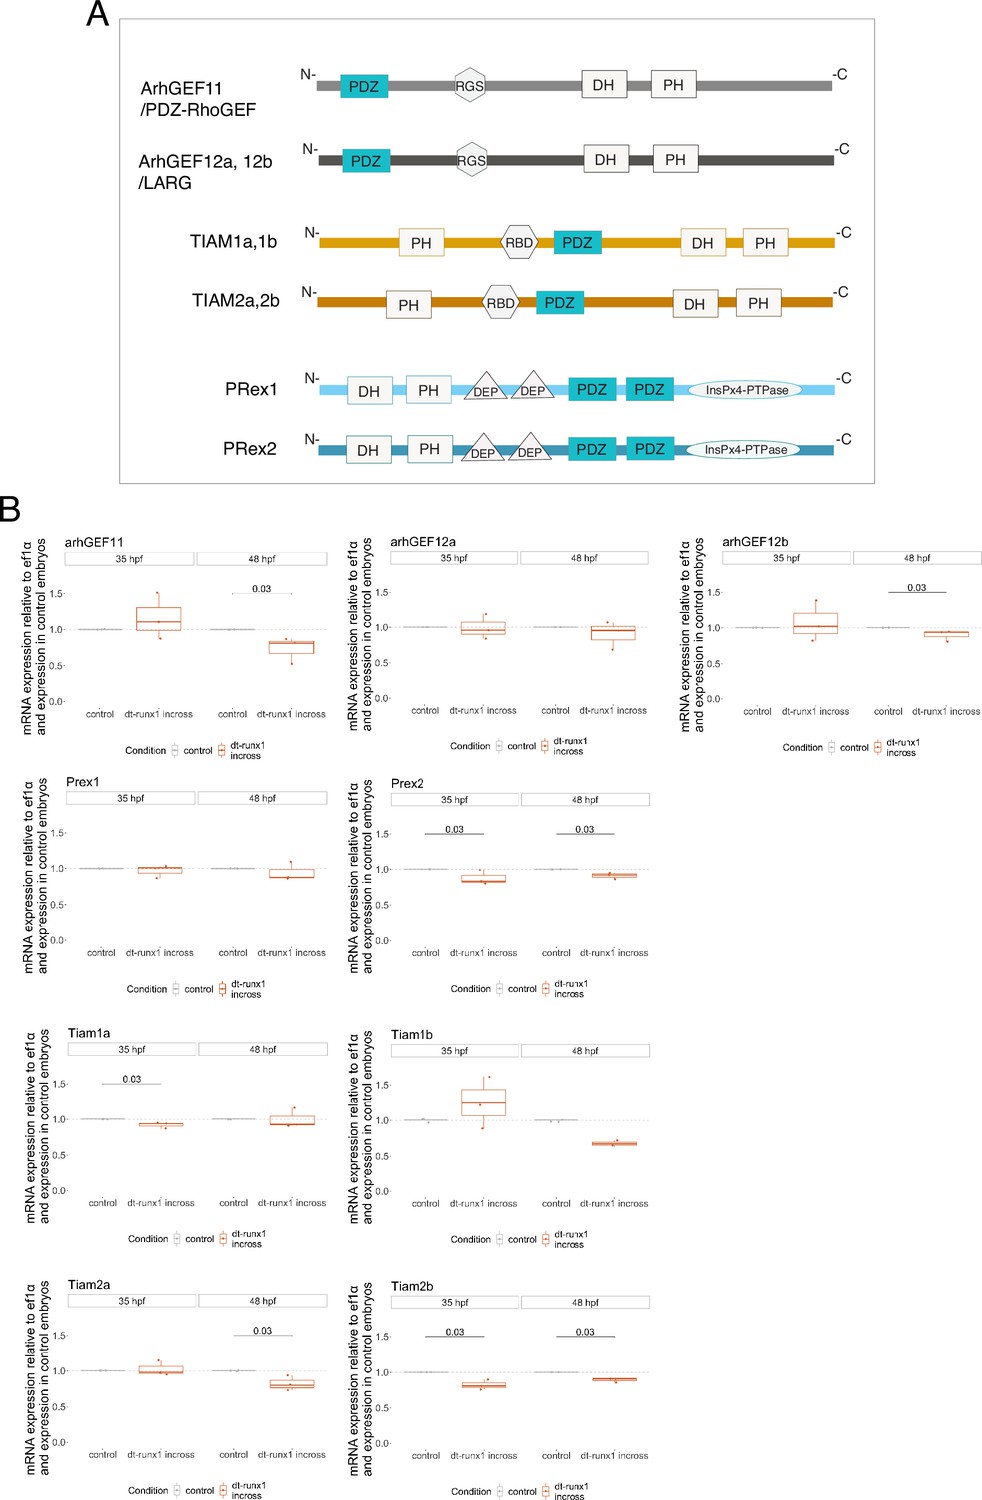
Searching for PDZ-domain containing RhoGEFs potentially involved in the EHT.
(A) Cartoons representing the domains composing the nine PDZ domain-containing RhoGEFs that were investigated in this study (all these RhoGEFs are encoded by different genes in the zebrafish; protein respective length is not drawn at scale). (B) Results obtained from three independent qRT-PCR experiments and performed on material extracted from trunk regions of 35 and 48 hpf embryos obtained from incrossed Tg(kdrl:Gal4;UAS:RFP;4xNR:dt-runx1-eGFP) adult fishes. Statistical tests: two-sided unpaired two samples Wilcoxon test, with p-values of significant differences. GEF: guanine nucleotide-exchange factor; PDZ: postsynaptic density protein of 95 kDa, Discs large and Zona occludens-1; PH: Plekstrin homology; RGS: regulator of G-protein signaling; DH: Dbl (diffuse B-cell lymphoma) homology; RBD: Ras-binding domain; DEP: Dishevelled Egl-10 and Plekstrin; InsPx4-PTPase: PtdIns(1,3,4,5)P4 phosphatidylinositol phosphatase; TIAM: T-cell-lymphoma invasion and metastasis; LARG: leukemia-associated Rho guanine-nucleotide exchange factor; PRex: PtdIns(3,4,5)P3-dependant Rac exchanger-1 and 2.
Figure 7—figure supplement 2
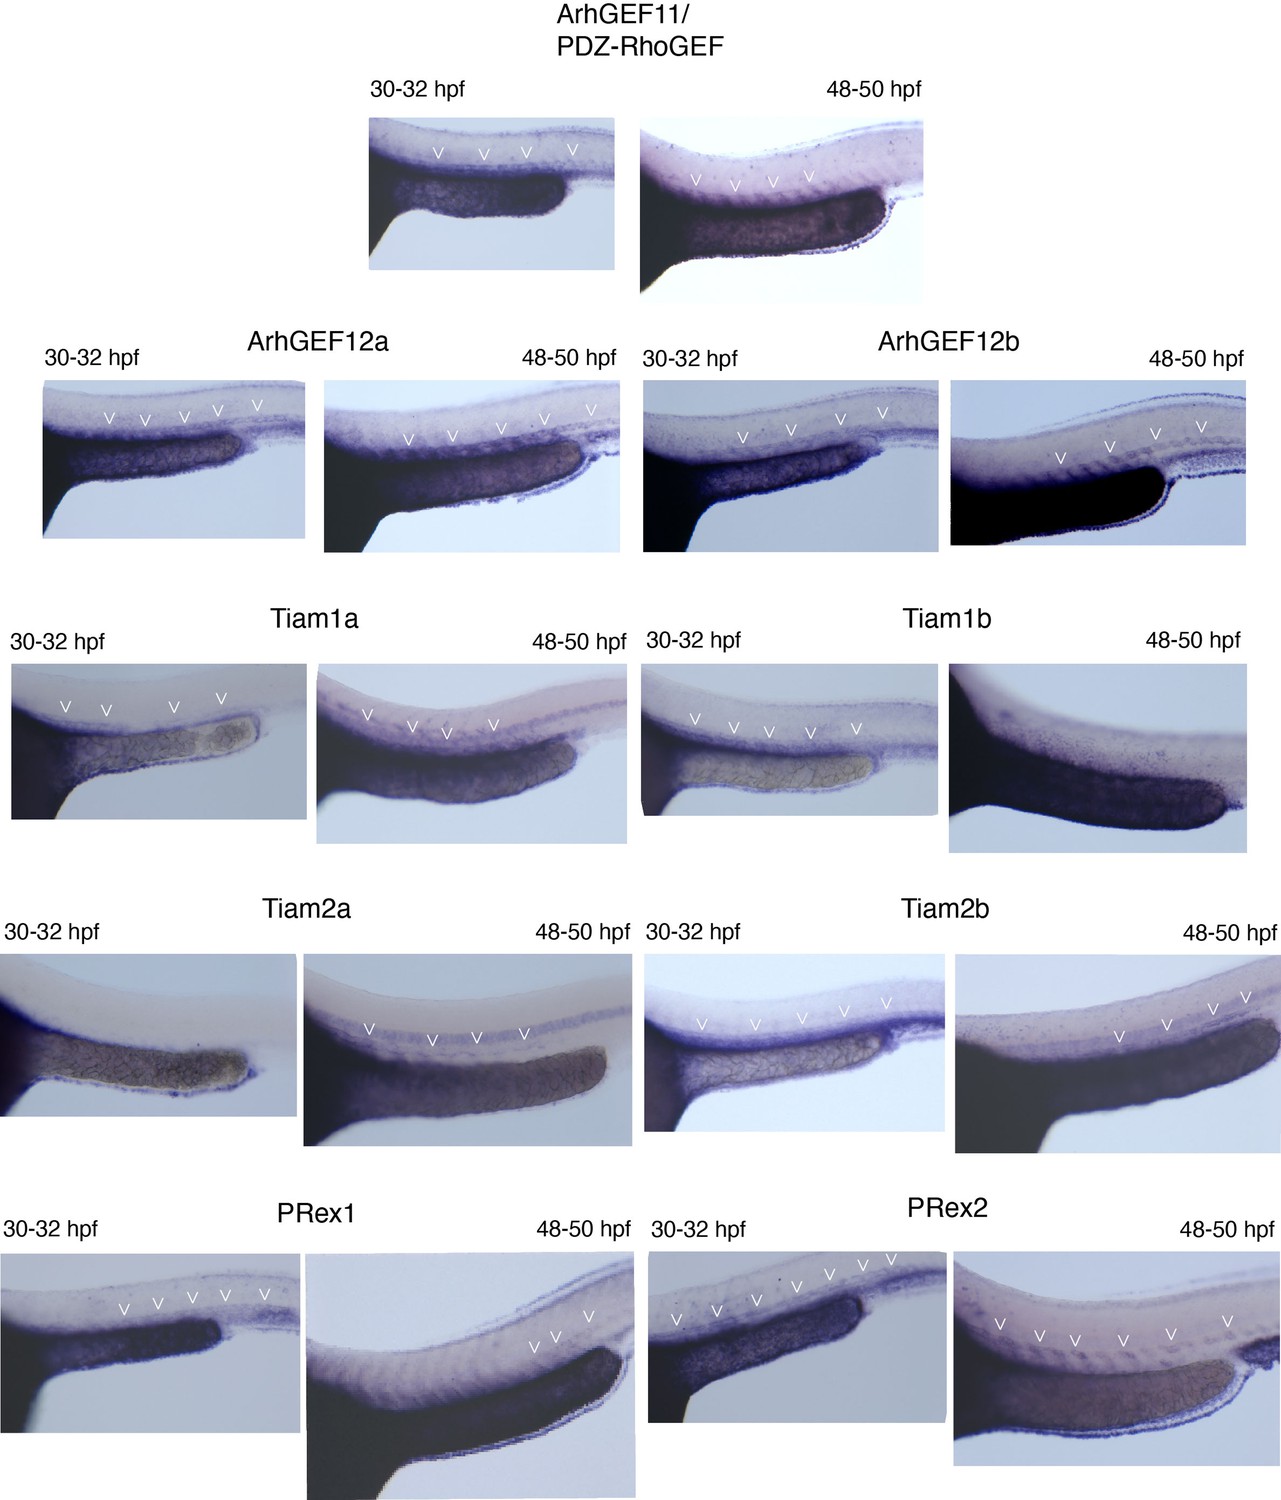
Whole mount in situ hybridizations (WISH) performed on 30–32 hpf and 48–50 hpf embryos, with probes specific for all nine PDZ-domain containing RhoGEFs that were investigated in this study.
Note that all RhoGEFs are detected in the dorsal aorta of the trunk region (white arrowheads).
Figure 7—figure supplement 3
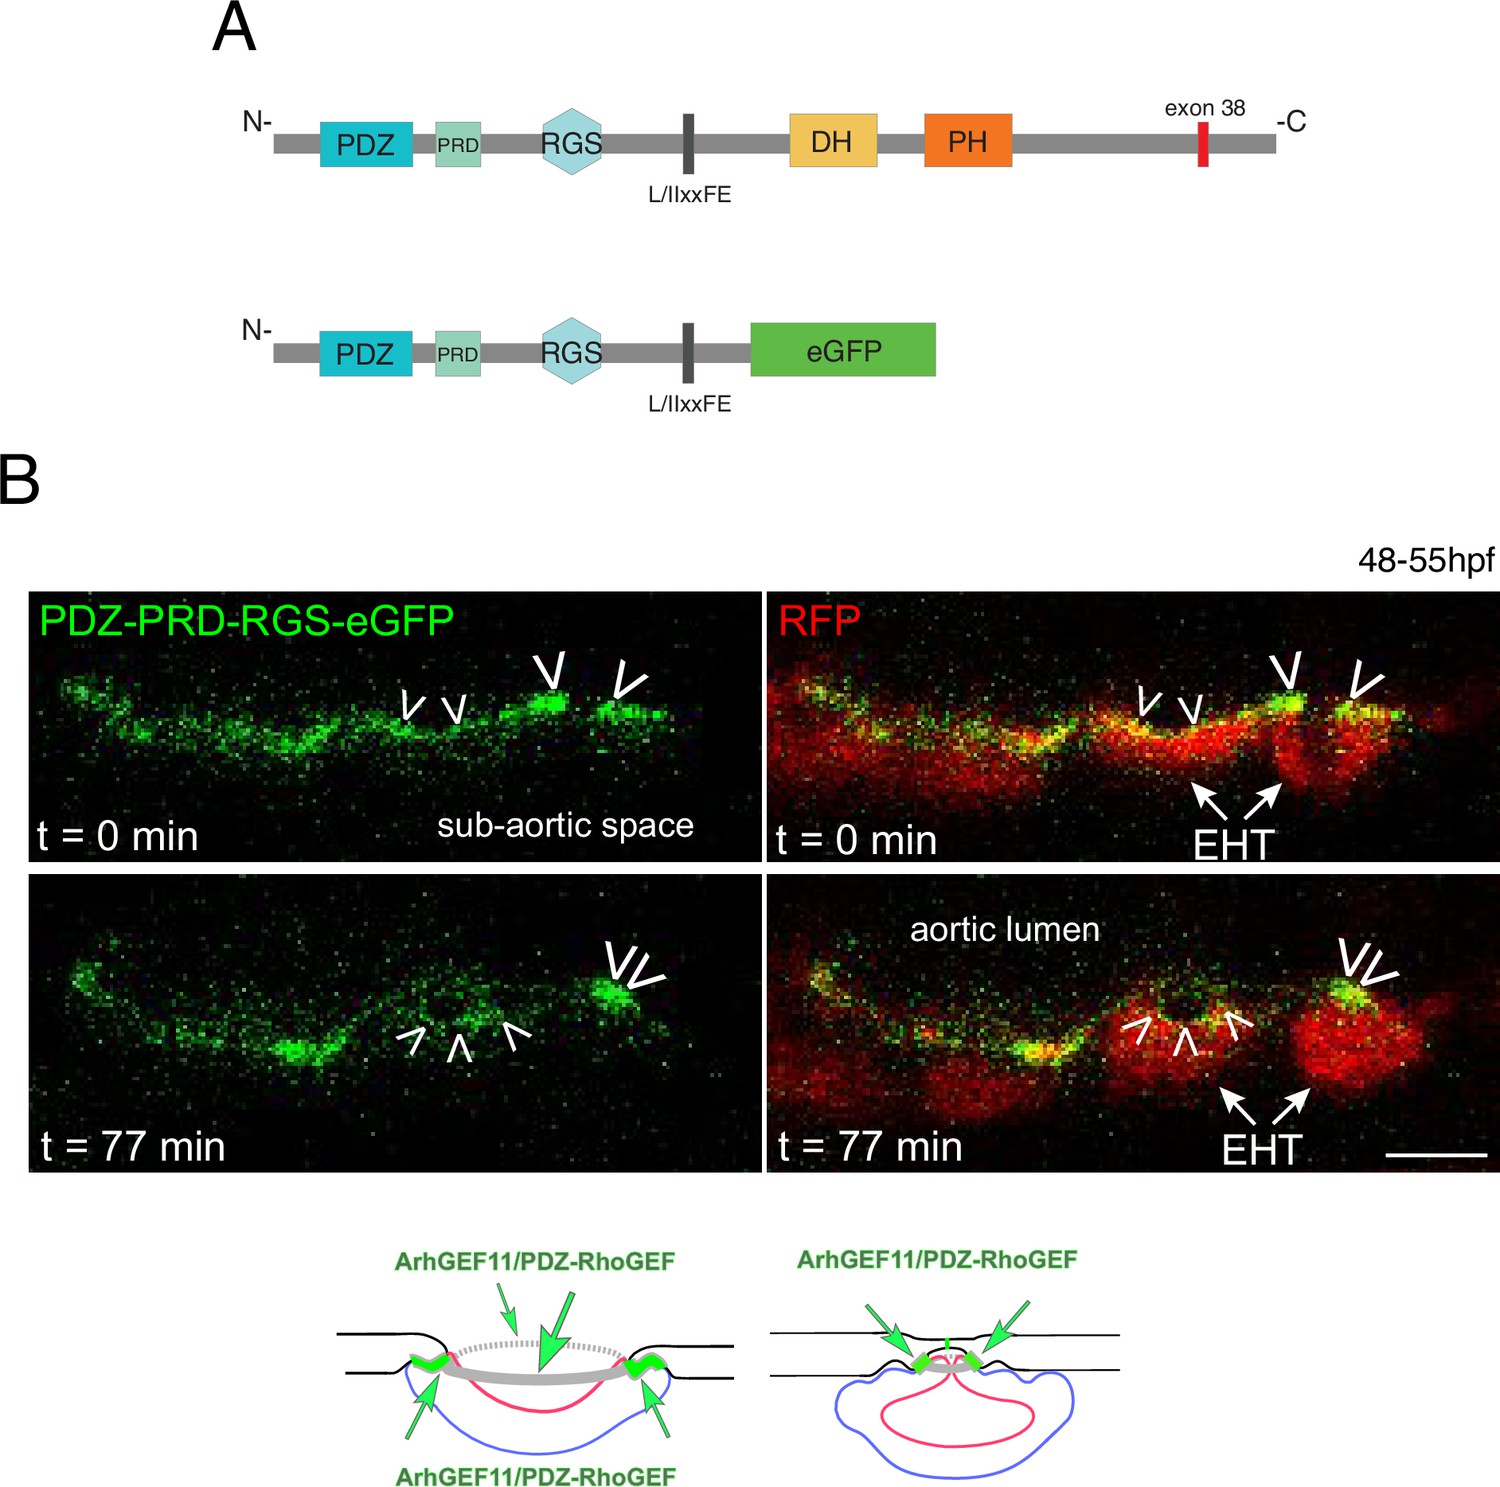
A N-terminal fragment of ArhGEF11/PDZ-RhoGEF localizes at junctional membranes with enrichment at antero-posterior sites of EHT cells.
(A) Domains of ArhGEF11, including its actin binding site (L/IIxxFE) and the position of exon 38 encoded peptide. The bottom cartoon represents a protein deleted from its DH-PH domains and C-terminus that are replaced by eGFP (PDZ-PRD-RGS-eGFP) to follow the localization of the truncated fusion protein in expressing cells. (B) Localization of the ArhGEF11 PDZ-PRD-RGS-eGFP fusion protein after transient expression in the aorta (expression was obtained after injection of the plasmid, at the one-cell stage, in the Tg(Kdrl:Gal4;UAS:RFP) fish line). Confocal images (z-projection) extracted from a time-lapse sequence (timing points t=0 and t=77 min) and showing either the eGFP channel only (left), or the merge between the green and the red channels (RFP labels the cytoplasm). Note the localization of PDZ-PRD-RGS-eGFP at membrane interfaces at early time point of the emergence and at the rim of an emerging cell (white arrowheads, second cell from the right) and its enrichment at antero-posterior sites of an EHT pol+ cell proceeding throughout emergence (right cell, at t=0 and t=77 min and bottom cartoons, green arrows point at localization/concentration of PDZ-PRD-RGS-eGFP). Scale bar = 10 µm.
Figure 7—figure supplement 4
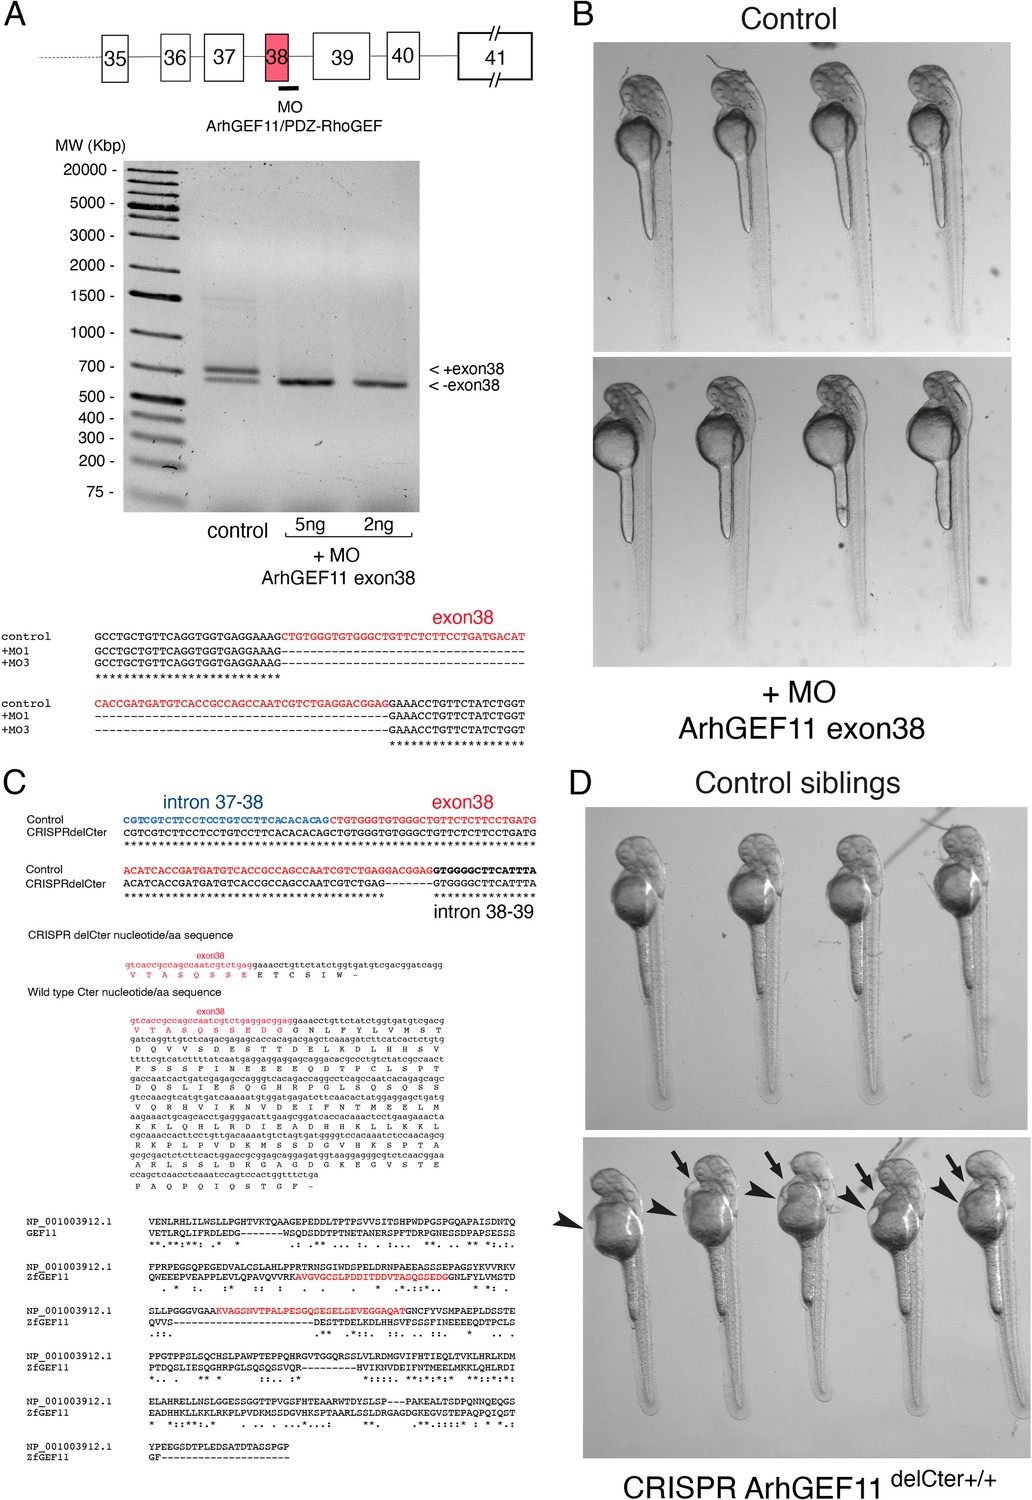
MO and CRISPR approaches to investigate the function of ArhGEF11/PDZ-RhoGEF in the EHT.
(A) Splicing MO interfering with integration of exon 38. Top panel: cartoon representing exons/introns (not drawn at scale) composing the 3-prime region of the gene encoding for ArhGEF11, with the position of the splicing MO. Middle panel: agarose gel showing the two alternative mRNAs encoding for ArhGEF11 in control animals (left track, control) and after injection of the MO at the one cell stage (right track,+MO at 2 and 5 ng). Bottom panel: ArhGEF11 DNA sequences obtained after RT-PCR, cloning and sequencing for 1 control and 2+MO clones (+MO1,+MO3). (B) Morphologies of control and +MO injected 48 hpf embryos. Note the absence of malformations. (C) Top panel: ArhGEF11 wild type and CRISPR-mediated 7 bp deletion in the 3-prime region of exon 38 leading to a frame-shift in the ORF and a downstream premature stop codon; middle panel: CRISPR del/C-ter nucleotide/aa sequence and wild type nucleotide/aa sequence covering the extreme C-ter of the full-length protein; bottom panel: CLUSTAL 2.1 multiple sequence alignment of mouse and zebrafish C-termini highlighting the sequences of spliced variants of potentially similar activity in the regulation of ArhGEF11 activity on RhoA. Accession numbers: NP_001003912.1 and NP_001027010.1 for the mouse and Danio rerio sequence, respectively. (D) Morphologies of control and homozygous ArhGEF11CRISPR-Cterdel+/+ 48 hpf embryos ((Kdrl:eGFP-Jam3b; kdrl:ArhGEF11CRISPR-Cterdel+/+) embryos). Note the edema in the cardiac region (35 hpf embryos also exhibited retardation in blood circulation). Raw image of agarose gel showing the 2 alternative mRNAs encoding for ArhGEF11 in control animals (left track, control) and after injection of the MO at the one cell stage (right track, +MO at 2 and 5 ng) are available at https://doi.org/10.5281/zenodo.11355396.
Figure 7—figure supplement 5
Supplementary data on the ArhGEF11/PDZ-RhoGEF exon 38 splicing morpholino phenotype.
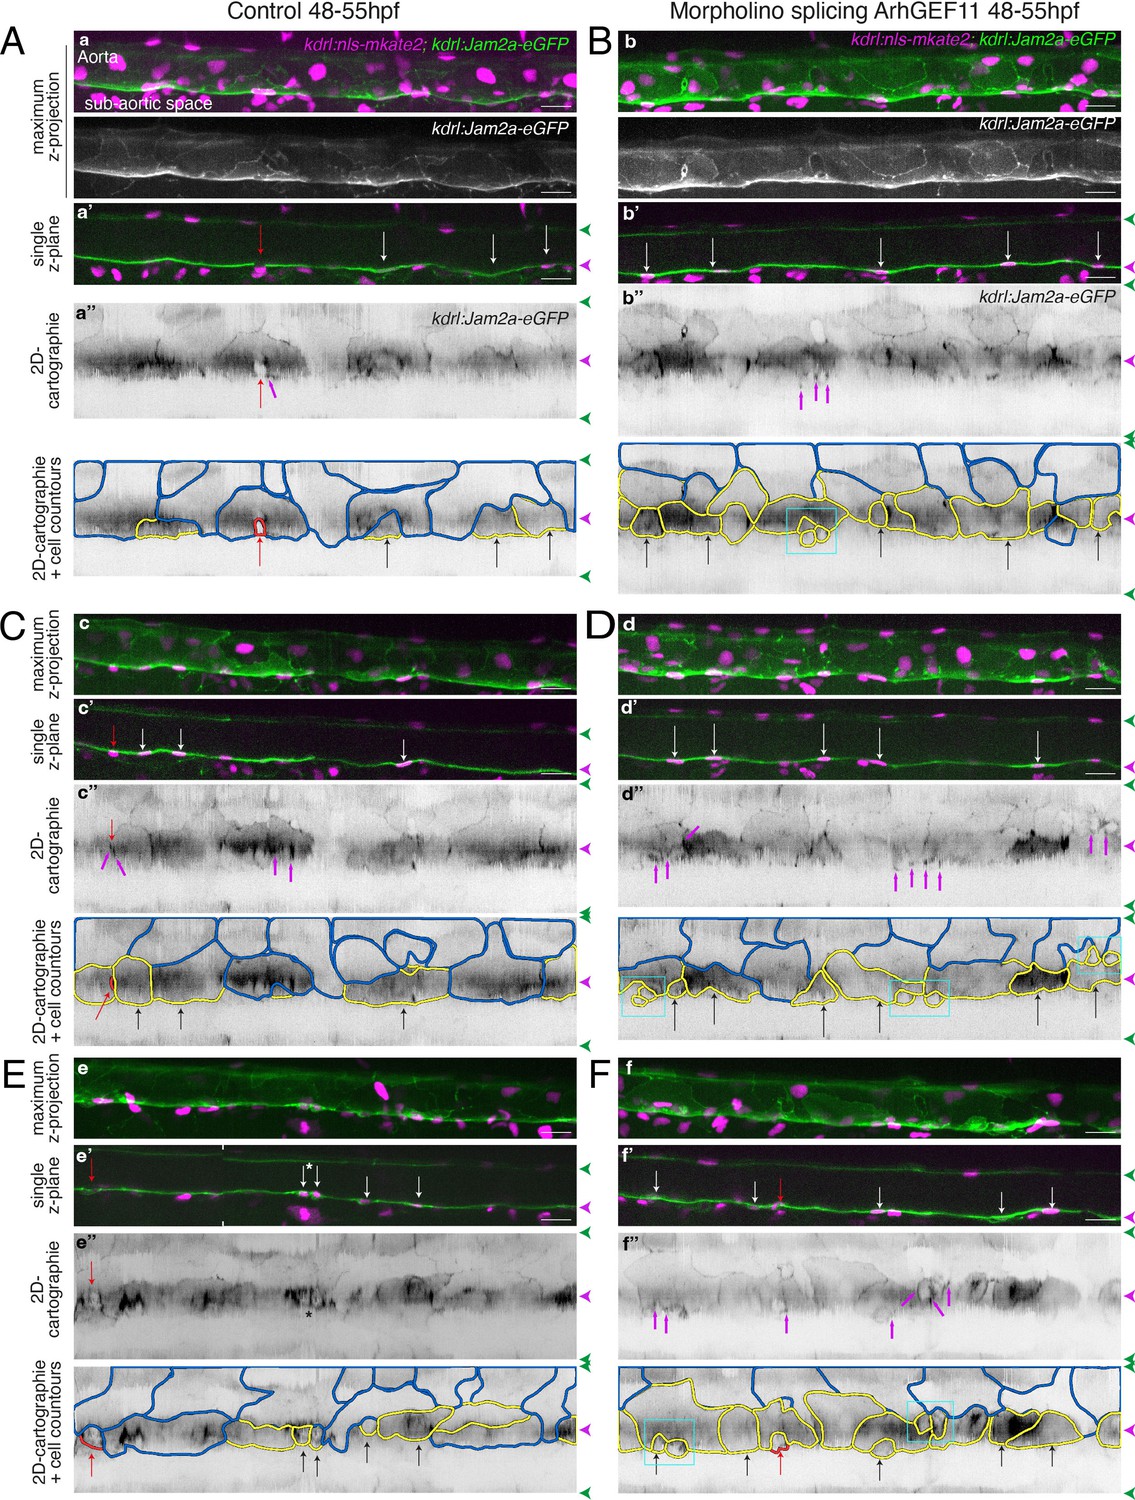
Tg(kdrl:eGFP-Jam2a; kdrl:nls-mKate2) control (A, C, E) or MO-injected (B, D, F) embryos were imaged using spinning disk confocal microscopy (48–55 hpf time-window). Aorta segments (330 µm each) were imaged in the trunk region (AGM). The 2D-cartographies with delimited cellular contours in panels (A and B) are presented Figure 7A with the corresponding un-modified 2D-cartographies shown on top for unmasking of contours. Panels (A and C) illustrate two different segments from the same embryo. Panels (B, D, F) illustrate segments from three different embryos. (a–f) Maximum z-projections of merged nls-mkate2 and eGFP-Jam2a signals for control (a, c, e) and for ArhGEF11 exon 38 splicing morpholino (b, d, f) conditions. For panels (a) and (b), maximum z-projections of the eGFP-Jam2a signal only are also shown. (a’-f’) Single z-plane images of merged nls-mkate2 and eGFP-Jam2a signals for control (a’, c’, e’) and for ArhGEF11 exon 38 splicing morpholino (b’, d’, f’) conditions. For e’, the image is a composition of two different z-planes from the same field (the boundaries are marked with white ticks). In right margins, magenta and green arrowheads designate the aortic floor and roof, respectively. (a’’-f’’) 2D-cartographies (bottom, with delineated cellular contours) obtained from eGFP-Jam2a signals for control (a’’, c’’, e’’) and for the ArhGEF11 exon 38 splicing morpholino (b’’, d’’, f’’) conditions, respectively. Cell contours are delineated either in blue (endothelial cells), yellow (hemogenic cells), red (morphologically characterized EHT cells, red arrows), and small cells delineated by cyan boxes (morphologically uncharacterized EHT cells and putative post-mitotic cells remaining as pairs). Cellular contours have been semi-automatically segmented along the cellular interfaces labeled with eGFP-Jam3b (see Materials and methods). White and black arrows designate hemogenic cells with their nucleus visible on the z-section. Analyses were performed on 2 x control non-injected embryos and 3 x embryos injected at the one-cell stage with the ArhGEF11 exon 38 splicing MO. Scale bars = 20 µm.
Figure 7—figure supplement 6
Supplementary data on the ArhGEF11/PDZ-RhoGEF CRISPR C-ter deletion phenotype.
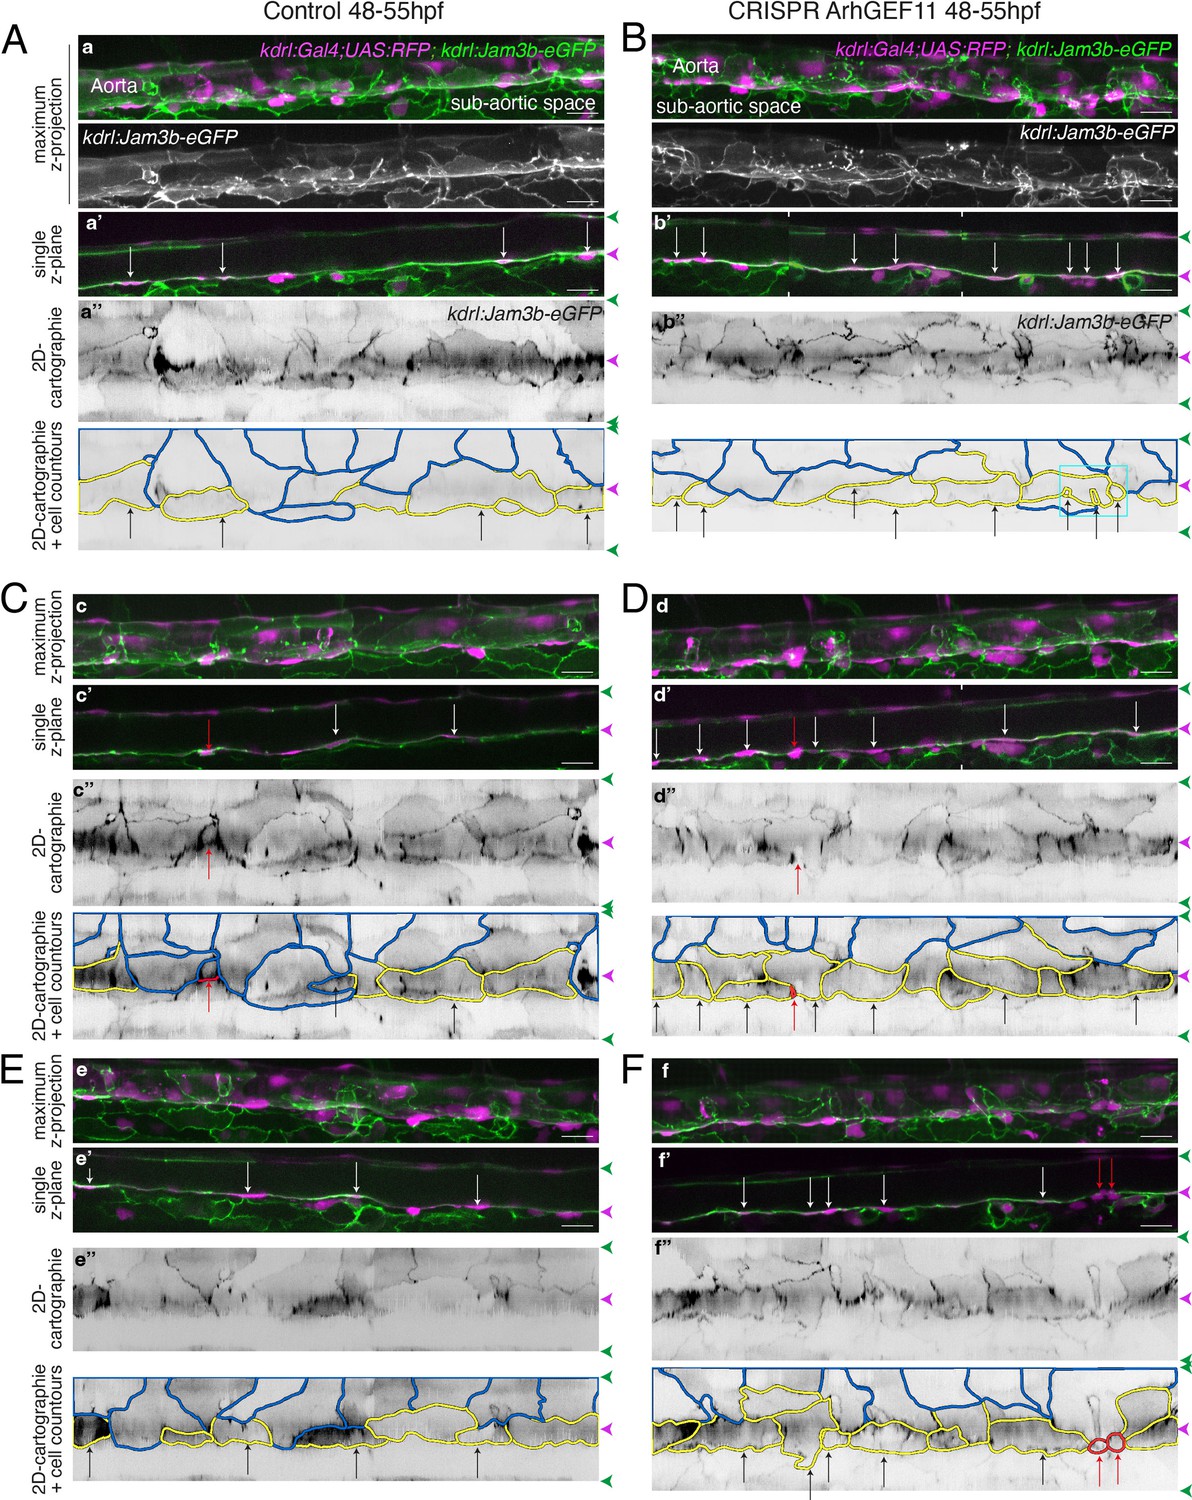
(Kdrl:eGFP-Jam3b; kdrl:ArhGEF11CRISPR-Cterdel+/+) homozygous ArhGEF11 C-ter deletion mutants (CRISPR ArhGEF11: panels B, D, F) and control siblings (Control: panels A, C, E) were imaged using spinning disk confocal microscopy (48-55hpf time-window). Note that the genetic background of the CRISPR fish line is (Kdrl:GAL4; UAS:RFP) thus allowing the red cytosolic staining of aortic and hemogenic cells. Aorta segments (330 µm each) were imaged in the trunk region. The 2D-cartographies with delimited cellular contours in panels (A and B) are presented Figure 7B with the corresponding un-modified 2D-cartographies shown on top for unmasking of contours. Panels (A, C) and (D, F) illustrate 2 different segments from the same embryo. (a–f) Maximum z-projections of merged nls-mkate2 and eGFP-Jam3b signals for control (a, c, e) and for the CRISPR mutant (b, d, f) conditions. For panels (a and b), maximum z-projections of the eGFP-Jam2a signal only are also shown. (a’-f’) Single z-plane images of merged nls-mkate2 and eGFP-Jam3b signals for control (a’, c’, e’) and for ArhGEF11 exon 38 splicing morpholino (b’, d’, f’) conditions. For b’ and d’, the image is a composition of 2 different z-planes from the same field (the boundaries are marked with white ticks). In right margins, magenta and green arrowheads designate the aortic floor and roof, respectively. (a’’-f’’) 2D-cartographies (bottom, with delineated cellular contours) obtained from eGFP-Jam3b signals for control (a’’, c’’, e’’) and for the CRIPR mutant (b’’, d’’, f’’) conditions, respectively. Cell contours are delineated either in blue (endothelial cells), yellow (hemogenic cells), red (morphologically characterized EHT cells, red arrows), and small cells delineated by cyan boxes (morphologically uncharacterized EHT cells). Cellular contours have been semi-automatically segmented along the cellular interfaces labeled with eGFP-Jam3b (see Materials and methods). White and black arrows designate hemogenic cells with their nucleus visible on the z-section. Analyses were performed on 2 x wild-type siblings for controls and 2 x mutant embryos whose mutation was confirmed by DNA sequencing. Scale bars = 20 µm.
Figure 7—figure supplement 7
MO interference with ArhGEF11 exon 38 splicing leads to the accumulation of CD41 positive cells in the aortic floor and negatively impacts on the generation of hematopoietic precursors.
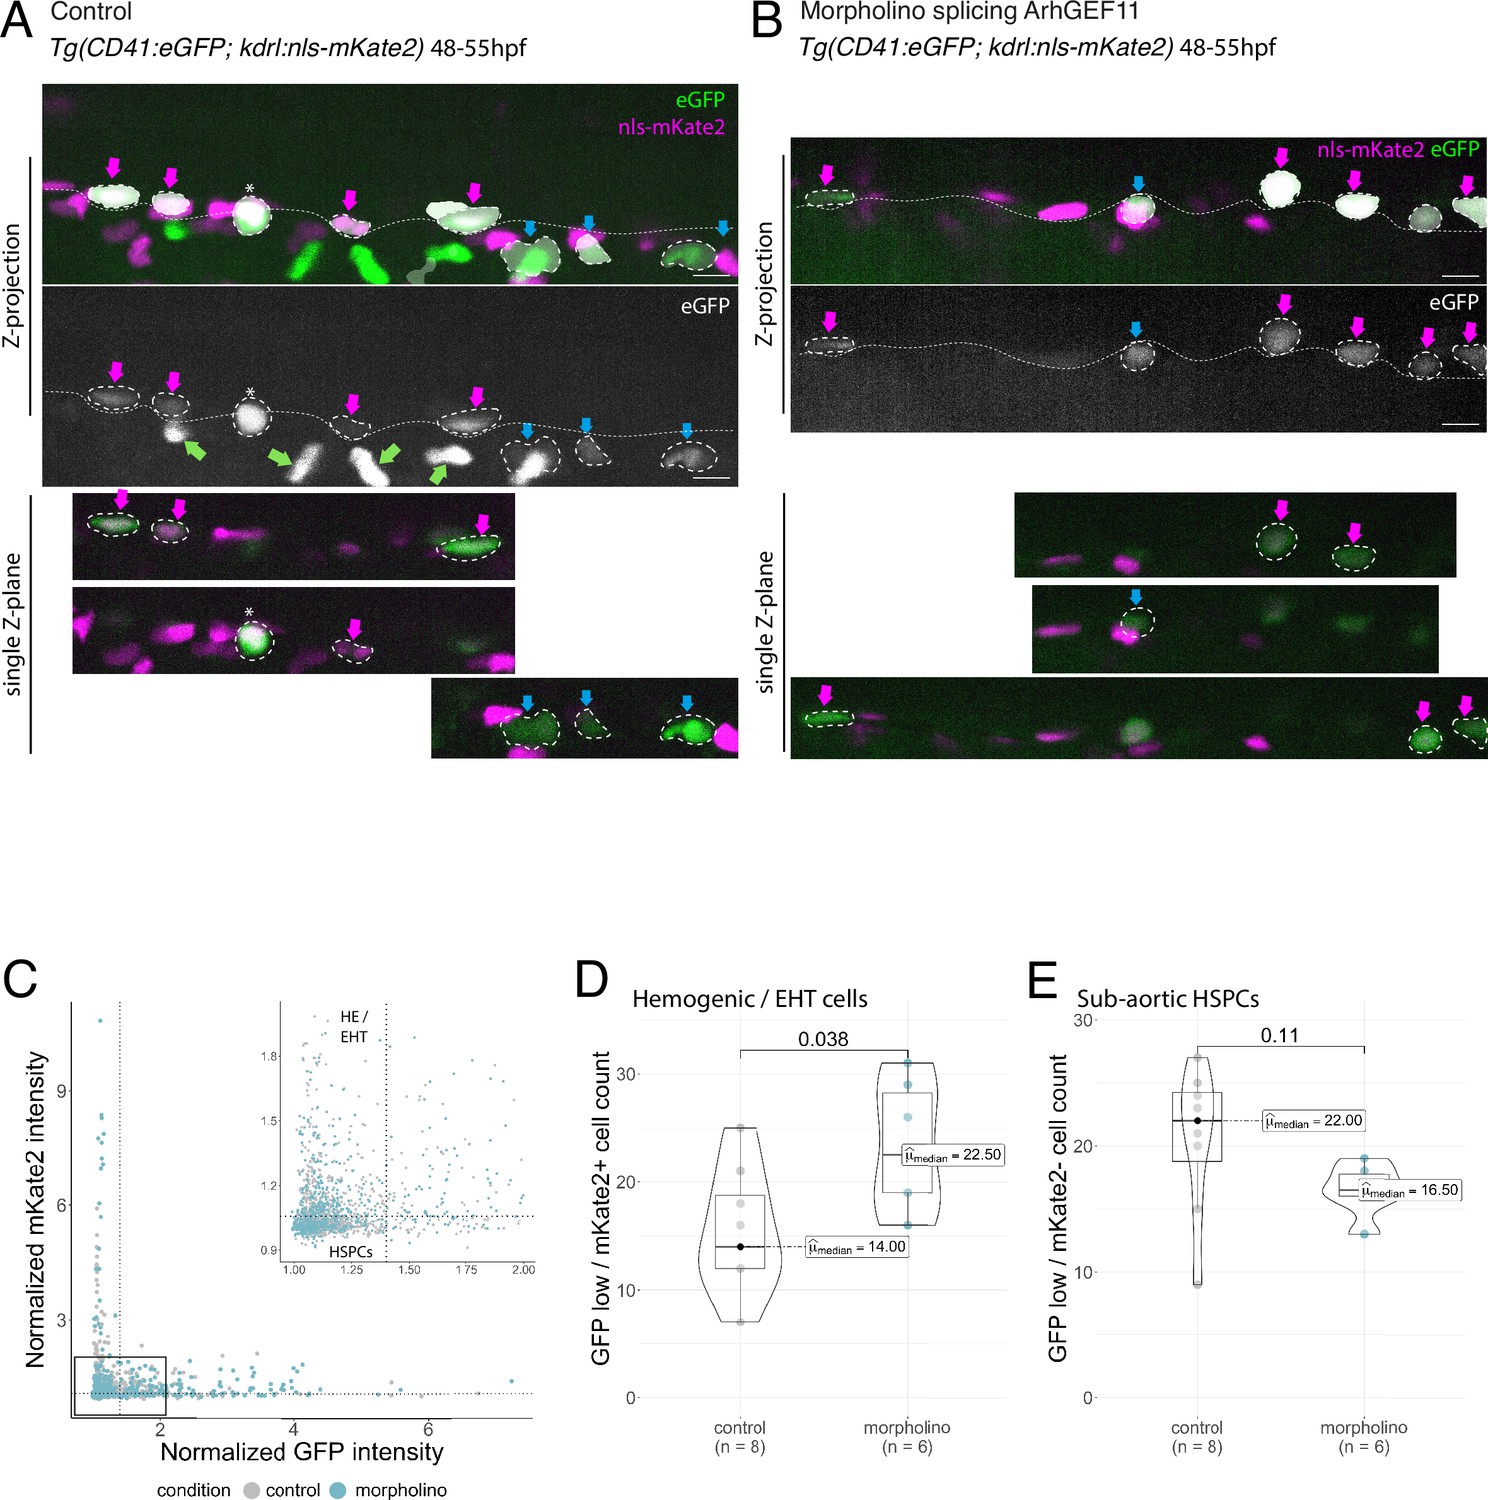
(A, B) Representative images of AGM region of double transgenic Tg(CD41:eGFP; Kdrl:nls-mKate2) embryos, injected with control (A) or ArhGEF11 exon 38 splicing morpholino (B) at 48–55hpf. The two top panels show maximum z-projection of aortic segments (top panels with the CD41:eGFP signal in green and the Kdrl:nls-mKate2 signal in magenta, bottom panel only with the CD41:eGFP signal in white). The three bottom panels show single z-planes extracted from the above z-projections. Automatically segmented GFP-positive cells are outlined in white. Magenta arrows point at double positives (GFPlow/kdrl + cells), corresponding to hemogenic/EHT cells. Blue arrows point at single positive (GFPlow/kdrl- cells) HSPC precursors. Green arrows point at circulating thrombocytes that were automatically eliminated from the segmentation. The asterisk labels a non-moving thrombocyte (GFPhigh/kdrl- cells). The aortic floor is outlined by the white dashed line. Scale bars = 10 µm. (C) GFP and mKate2 fluorescence intensity was automatically extracted for each segmented cell and normalized to background. Vertical and horizontal dashed lines on the plot and on the zoomed plot represent the threshold selected for the classification of mKate2+ versus mKate2- (1.05, horizontal line) and eGFPhigh versus eGFPlow (1.4, vertical line). (D) Hemogenic/EHT cell count. (E) HSPC precursors cell count. For (D and E) Statistical tests: two-sided unpaired two samples Wilcoxon test, all p-values are displayed. Analysis was carried out on n=8 control and n=6 mutant embryos.
Figure 8
Interfering with the function of ArhGEF11/PDZ-RhoGEF suggests an activity at the interface between endothelial and hemogenic cells that relies on restricting the mobility of junctional pools at tri-cellular junctions, with a prominent role of the +exon 38 variant during endothelial cell intercalation.
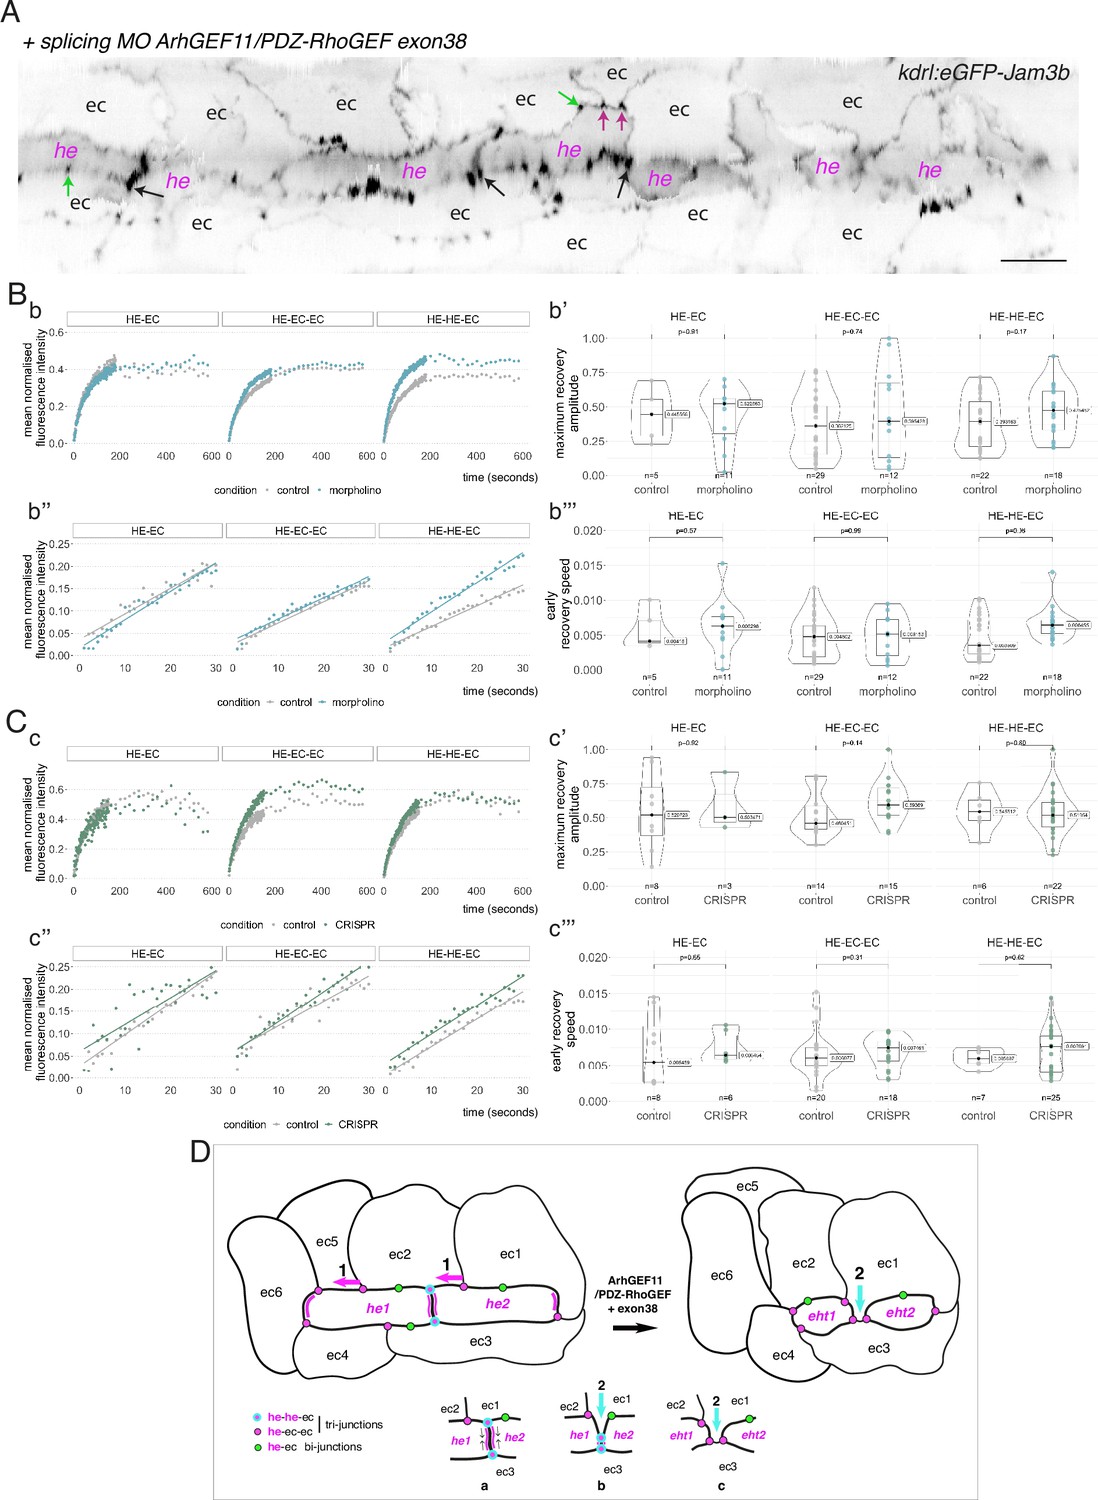
(A) 2D-cartography of an aortic segment of a Tg(kdrl:eGFP-Jam3b; kdrl:nls-mkate2) embryo injected at the one cell stage with the ArhGEF11 exon 38 splicing morpholino. All the arrows pointing at reinforced junctional contacts between cells were bleached and imaged for FRAP analysis (the bleached areas correspond to the spots of highest intensities in the regions of interest, as visualized at the fluorescent confocal microscope, see Materials and methods). Black and Magenta arrows point at he-he-ec and he-ec-ec tri-cellular junctions, respectively (he: hemogenic cell; ec: endothelial cell). Green arrows point at he-ec bi-cellular junctions. ec: endothelial cell, he: hemogenic cell. Scale bar = 20 µm. (B, C) FRAP analysis of bleached eGFP-Jam3b localized in regions of interest in controls (grey) and ArhGEF11 exon 38 splicing morpholino injected embryos (blue) or homozygous ArhGEF11CRISPR-Cterdel+/+ mutants (green). The number of biological replicates (n) is stated on the plots. Statistical tests: two-sided unpaired two samples Wilcoxon test. Bb, Cc, evolution, after photobleaching (at t=0 s), of the mean fluorescence intensity per condition at HE-EC, HE-EC-EC and HE-HE-EC bi- and tri-junctions over time (10 min). Bb’, Cc’, median values for maximum amplitude of recovery (maximum of simple exponential fitted curves, see Materials and methods). Bb’’, Cc’’, early evolution, after photobleaching (at t=0 s), of the mean fluorescence intensity per condition over time (for the first 30 s). The fitted lines correspond to the linear regression of the mean fluorescence intensities. Bb’’’, Cc’’’, median fluorescence recovery slopes (linear regression). (D) Model (2D deployment of the aortic wall) representing the endothelial/hemogenic dynamic interplay and the proposed function of ArhGEF11 and of its + exon 38 peptide encoding variant at junctional and membrane interfaces. This interplay involves 2 essential dynamic events requiring junctional remodeling: 1 (left cartoon, magenta arrows), the mobility of he-ec-ec tri-junctional contacts accompanying the movement of endothelial cells (ex: for ec1 and ec2) along lateral sides of hemogenic cells which is required to decrease the number of adjoining cells (see Lancino et al., 2018). This takes place contemporarily to - or in alternance with -, the contraction of HE and EHT cells as they are progressing throughout the emergence and reducing contacting membrane surfaces along the longitudinal axis (the reduction in contacting membrane surfaces also involves membrane retrieval, hypothetically via endocytosis). Our data obtained with the CRISPR deletion mutants (a slight tendency to increase, on average, the turnover and mobile pool of these he-ec-ec junctions) suggest that ArhGEF11, in the wild type condition, should be slowing down the recycling of junctional components at tri-junctions, which hypothetically should contribute to increase adhesion strength. This may be required also to stabilize the junction-cytoskeleton interface involved in controlling the contraction/shrinkage of HE cells along the longitudinal axis, a hypothesis that is compatible with the mutant phenotype observed in this study, that is the increase in frequency of more elongated HE cells and the decrease in HE cell progression throughout EHT (see Figure 7); 2 (right cartoon, cyan arrow and bottom cartoons a-c), the intercalation of an endothelial cell to isolate two adjacent hemogenic cells or two daughter cells after mitosis (not depicted). This is mandatory for EHT progression and completion which requires adjoining endothelial cells to protrude membrane extensions that will anastomose to seal the aortic floor (see Lancino et al., 2018). The accumulation of adjoining cells of rather small length and apparently impaired in EHT progression that we describe in Figure 7 upon MO interference (that may also indicate impairment in abscission completion) suggests that the ArhGEF11 + exon 38 peptide encoding variant is more specifically involved in controlling the remodeling of the he/he interface that leads to endothelial cell intercalation (bottom cartoons, the remodeling of he-he-ec junctions is leading to he-ec-ec junctions and takes place between b and c). The increase in the recycling parameters that we measure in this interfering condition (mobile pool and early speed of recovery) indicates that the activity of ArhGEF11, and in particular of its + exon 38 peptide encoding variant, negatively controls junctional recycling. Hypothetically, the junctional adhesion strengthening triggered by reducing the recycling of junctional components at the he/he interface may be required during the early phase and progression of intercalation to support increase in membrane tension and environmental constraints (intercalation contributes to reducing the length/surface of the he/he membrane interface preceding junctional remodeling (cartoons b and c); this reducing membrane interface is in addition submitted to the shear stress imposed by blood flow).
Author response image 1

All cells from the aortic floor, at 48hpf, express the hematopoietic marker Gata2b.
48 hpf Tg(Kdrl:eGFP) fixed embryos were used for RNAscope using a probe designed to detect Gata2b mRNAs. Subsequently, images were taken using spinning disk confocal microscopy. The image in the top panel is a z-projection of the entire aortic volume of one embryo and shows the full portion of the dorsal aorta from the anterior part (left side, at the limit of the balled yolk) down to the urogenital orifice (UGO, right side). The 4 boxes (1 - 4) delineate regions that have been magnified beneath (2X). The 2X images corresponding to each box are z-projections (top views) or z-sections (bottom views). The bottom views allow to visualize the aortic floor and to mark its position on top views. Pink arrows point at HE cells (elongated in the anteroposterior direction) and at EHT cells (ovoid/round cells; EHT pol+ cell morphology is not preserved after fixation and RNAscope; thus, it cannot be distinguished from ovoid/round EHT pol- cells). Pink dots = RNAscope spots of various sizes. The green cells in the subaortic space that are marked by RNAscope spots are newly born hematopoietic stem and progenitor cells (see for example box 1). This embryo is representative of n = 5 embryos treated and imaged.
Tables
Key resources table
| Reagent type (species) or resource | Designation | Source or reference | Identifiers | Additional information |
|---|---|---|---|---|
| Strain, strain background (zebrafish Danio rerio) | AB | Zebrafish International Resource Center (ZIRC) | ZFIN: ZDB-GENO-960809–7 | |
| Strain, strain background (zebrafish D. rerio) | Tg(kdrl:HsHRAS -mCherry): s916Tg | Chi et al., 2008 | ZFIN ID: ZDB-ALT-090506–2 | referred to as Tg(kdrl:Ras-mCherry) |
| Strain, strain background (zebrafish D. rerio) | Tg(6.0itga2b:EGFP) | Lin et al., 2005 | ZFIN ID: ZDB-ALT-051223–4 | referred to as Tg(CD41:eGFP) |
| Strain, strain background (zebrafish D. rerio) | Tg(kdrl:eGFP) | Jin et al., 2005 | ZFIN ID: ZDB-ALT-050916–14 | |
| Strain, strain background (zebrafish D. rerio) | Tg(kdrl:nls-mKate2) | N/A | N/A | |
| Strain, strain background (zebrafish D. rerio) | Tg(kdrl:Gal4;UAS:RFP) | N/A | N/A | |
| Strain, strain background (zebrafish D. rerio) | Tg(kdrl:Gal4;UAS:RFP;4xNR:eGFP-Podxl2) | This paper | N/A | See Materials and Methods ‘Transient and stable transgenesis’ |
| Strain, strain background (zebrafish D. rerio) | Tg(kdrl:mKate2-Podxl2) | This paper | N/A | See Materials and Methods ‘Transient and stable transgenesis’ |
| Strain, strain background (zebrafish D. rerio) | Tg(kdrl:eGFP-Jam2a) | This paper | N/A | See Materials and Methods ‘Transient and stable transgenesis’ |
| Strain, strain background (zebrafish D. rerio) | Tg(kdrl:eGFP-Jam3b) | This paper | N/A | See Materials and Methods ‘Transient and stable transgenesis’ |
| Strain, strain background (zebrafish D. rerio) | Tg(kdrl:Gal4;UAS:RFP;4xNR:dt-runx1-eGFP) | This paper | N/A | See Materials and Methods ‘Transient and stable transgenesis’ |
| Strain, strain background (zebrafish D. rerio) | Tg(ArhGEF11CRISPR-Cterdel-/+) | This paper | N/A | See Materials and Methods ‘CRISPR methodology and GEF11 mutant transgenic line screening’ |
| Recombinant DNA reagent | pG1-flk1-MCS-tol2 | Jin et al., 2005 | N/A | |
| Recombinant DNA reagent | pEGFP-C1 | Clontech | N/A | |
| Recombinant DNA reagent | Transposase pCS-zT2TP | Suster et al., 2011 | N/A | |
| Recombinant DNA reagent | pmKate2-f-mem | Evrogen | Cat# FP186 | |
| Antibody | goat polyclonal anti-rabbit Alexa Fluor 488 | Invitrogen | Cat# A11070 | 1/400 |
| Antibody | rabbit polyclonal anti-GFP | MBL | Cat# 598 | 1/300 |
| Antibody | mouse monoclonal anti-HA | Sigma | Cat# 12ca5 | 1/50 |
| Antibody | goat polyclonal anti-mouse HRP-conjugated | Thermo Fisher Scientific | Cat# G-21040 | 1/300 |
| Sequence-based reagent | Morpholino sih | Sehnert et al., 2002 | ZDB-MRPHLNO-060317–4 | CATGTTTGCTCTGATCTGACACGCA |
| Sequence-based reagent | Morpholino ArhGEF11 exon 38 | This paper | N/A | GAAATAAATGAAGCCCCACCTCCGT, see Materials and Methods ‘Morpholinos and injections’ |
| Sequence-based reagent | Oligo for CRISPR: Alt-R CRISPR-Cas12a (Cpf1) crRNAs –1 | This paper | N/A | TATCACACACACATCACCTTCTA, see Materials and Methods ‘CRISPR methodology and GEF11 mutant transgenic line screening’ |
| Sequence-based reagent | Oligo for CRISPR: Alt-R CRISPR-Cas12a (Cpf1) crRNAs –2 | This paper | N/A | TTTCTCAGCGCTCCTGACAGATG, see Materials and Methods ‘CRISPR methodology and GEF11 mutant transgenic line screening’ |
| Sequence-based reagent | Oligo for CRISPR: Alt-R CRISPR-Cas9 crRNAs | This paper | N/A | AGCCAATCGTCTGAGGACGG, see Materials and Methods ‘CRISPR methodology and GEF11 mutant transgenic line screening’ |
| Sequence-based reagent | Oligo for CRISPR: Alt-R tracrRNA | IDT | Cat# 1072532 | see Materials and Methods ‘CRISPR methodology and GEF11 mutant transgenic line screening’ |
| Sequence-based reagent | Oligo for WISH: RNAscope Probe- Dr-myb-C3 | ACD-Biotechne | Cat No. 558291 C3 | Cat No. 558291 C2 |
| Sequence-based reagent | Oligo for WISH: RNAscope Probe- Dr-pard3ab-C3 | ACD-Biotechne | Cat No. 1282521 C3 | |
| Sequence-based reagent | Oligo for WISH: RNAscope Probe- Dr-pard3ba-C2 | ACD-Biotechne | Cat No. 1309581 C2 | |
| Sequence-based reagent | Oligo for WISH: RNAscope Probe- Dr-pard3aa-C2 | ACD-Biotechne | Cat No. 1305321 C2 | |
| Software, algorithm | Imaris | Oxford Instruments | https://imaris.oxinst.com/ | v10.1.0 |
| Software, algorithm | CRISPRscan | Moreno-Mateos et al., 2015 | N/A | |
| Software, algorithm | Zen Pro2 software | Zeiss | https://www.zeiss.com/microscopy/en/products/software/zeiss-zen.html | N/A |
| Software, algorithm | QUANTSTUDIO DESIGN & ANALYSIS 2 | Thermofisher | https://apps.thermofisher.com/apps/da2/ | N/A |
| Software, algorithm | MetaMorph software | Molecular Devices | https://www.moleculardevices.com/products/cellular-imaging-systems/acquisition-and-analysis-software/metamorph-microscopy | N/A |
| Software, algorithm | Acquisition-Imaging analysis-LAS X | Leica | http://www.leica-microsystems.com | N/A |
| Software, algorithm | Image Analysis-Fiji | NIH | https://imagej.net/Fiji | N/A |
| Software, algorithm | Image Analysis Icy | de Chaumont et al., 2012 | http://icy.bioimageanalysis.org/ | N/A |
| Software, algorithm | Image Analysis TubeSkinner plugin for Icy | Lancino et al., 2018 | https://icy.bioimageanalysis.org/plugin/tubeskinner/ | N/A |
| Software, algorithm | Figures-Illustrator CC 2017.1.1 | Adobe | http://www.adobe.com/cn/ | N/A |
| Software, algorithm | Active contour plugin | Dufour et al., 2011 | https://icy.bioimageanalysis.org/plugin/active-contours/ | N/A |
| Software, algorithm | NIS software | Nikon | https://www.microscope.healthcare.nikon.com/en_EU/products/software/nis-elements | N/A |
| Software, algorithm | Rstudio | RStudio Team, 2020 | http://www.rstudio.com/ | N/A |
| Software, algorithm | ggplot2 | Wickham, 2016 | https://ggplot2.tidyverse.org | N/A |
| Software, algorithm | readr, version 2.1.5 | Wickham et al., 2024a; Wickham et al., 2024b | https://github.com/tidyverse/readr | N/A |
| Software, algorithm | cowplot | Wilke, 2020 | https://wilkelab.org/cowplot/ | N/A |
| Software, algorithm | dplyr, version 1.1.4 | Wickham et al., 2023a; Wickham et al., 2023b | https://github.com/tidyverse/dplyr | N/A |
| Software, algorithm | wesanderson, version 0.3.6 | Ram and Wickham, 2018 | https://github.com/karthik/wesanderson | N/A |
| Software, algorithm | matrixStats, version 1.3.0 | Bengtsson, 2024a 10/04/2024 10:05:00 | https://github.com/HenrikBengtsson/matrixStats | N/A |
| Software, algorithm | stringr, version 1.5.1 | Wickham, 2023a; Wickham, 2023b | https://github.com/tidyverse/stringr | N/A |
| Software, algorithm | ggsci, version 3.0.3 | Xiao, 2024a; Xiao, 2024b | https://github.com/nanxstats/ggsci | N/A |
| Software, algorithm | ggpubr | Kassambara, 2020 | https://rpkgs.datanovia.com/ggpubr/ | N/A |
| Software, algorithm | ggstatsplot | Patil, 2024 | https://indrajeetpatil.github.io/ggstatsplot/index.html | N/A |
| Software, algorithm | ggbeeswarm, version 0.7.2 | Clarke and Sherrill-Mix, 2023 | https://github.com/eclarke/ggbeeswarm | N/A |
| Software, algorithm | DT, version 0.33 | Xie et al., 2024 | https://github.com/rstudio/DT | N/A |
| Software, algorithm | SciViews | Grosjean, 2019 | https://www.sciviews.org/SciViews/ | N/A |
| Software, algorithm | nls.multstart, version 1.3.0 | Padfield and Matheson, 2023a; Padfield and Matheson, 2023b | https://github.com/padpadpadpad/nls.multstart | N/A |
Additional files
-
Supplementary file 1
Materials and methods - Supplementary Table.
- https://cdn.elifesciences.org/articles/91429/elife-91429-supp1-v1.xlsx
-
MDAR checklist
- https://cdn.elifesciences.org/articles/91429/elife-91429-mdarchecklist1-v1.docx
Download links
A two-part list of links to download the article, or parts of the article, in various formats.
Downloads (link to download the article as PDF)
Open citations (links to open the citations from this article in various online reference manager services)
Cite this article (links to download the citations from this article in formats compatible with various reference manager tools)
Tuning apicobasal polarity and junctional recycling in the hemogenic endothelium orchestrates the morphodynamic complexity of emerging pre-hematopoietic stem cells
eLife 12:RP91429.
https://doi.org/10.7554/eLife.91429.3


