Biocalcification in porcelaneous foraminifera
- Ecological Chemistry, Alfred-Wegener-Institut Helmholtz-Zentrum für Polar- und Meeresforschung, Germany
- GFZ German Research Centre for Geosciences, Telegrafenberg, Germany
- Faculty of Geology, University of Warsaw, Poland
- Research Centre in Kraków, Institute of Geological Sciences, Polish Academy of Sciences, Poland
- Marine Biogeosciences, Alfred-Wegener-Institut Helmholtz-Zentrum für Polar- und Meeresforschung, Germany
- Burgers’ Ocean, Royal Burgers’ Zoo, Netherlands
Figures
Figure 1
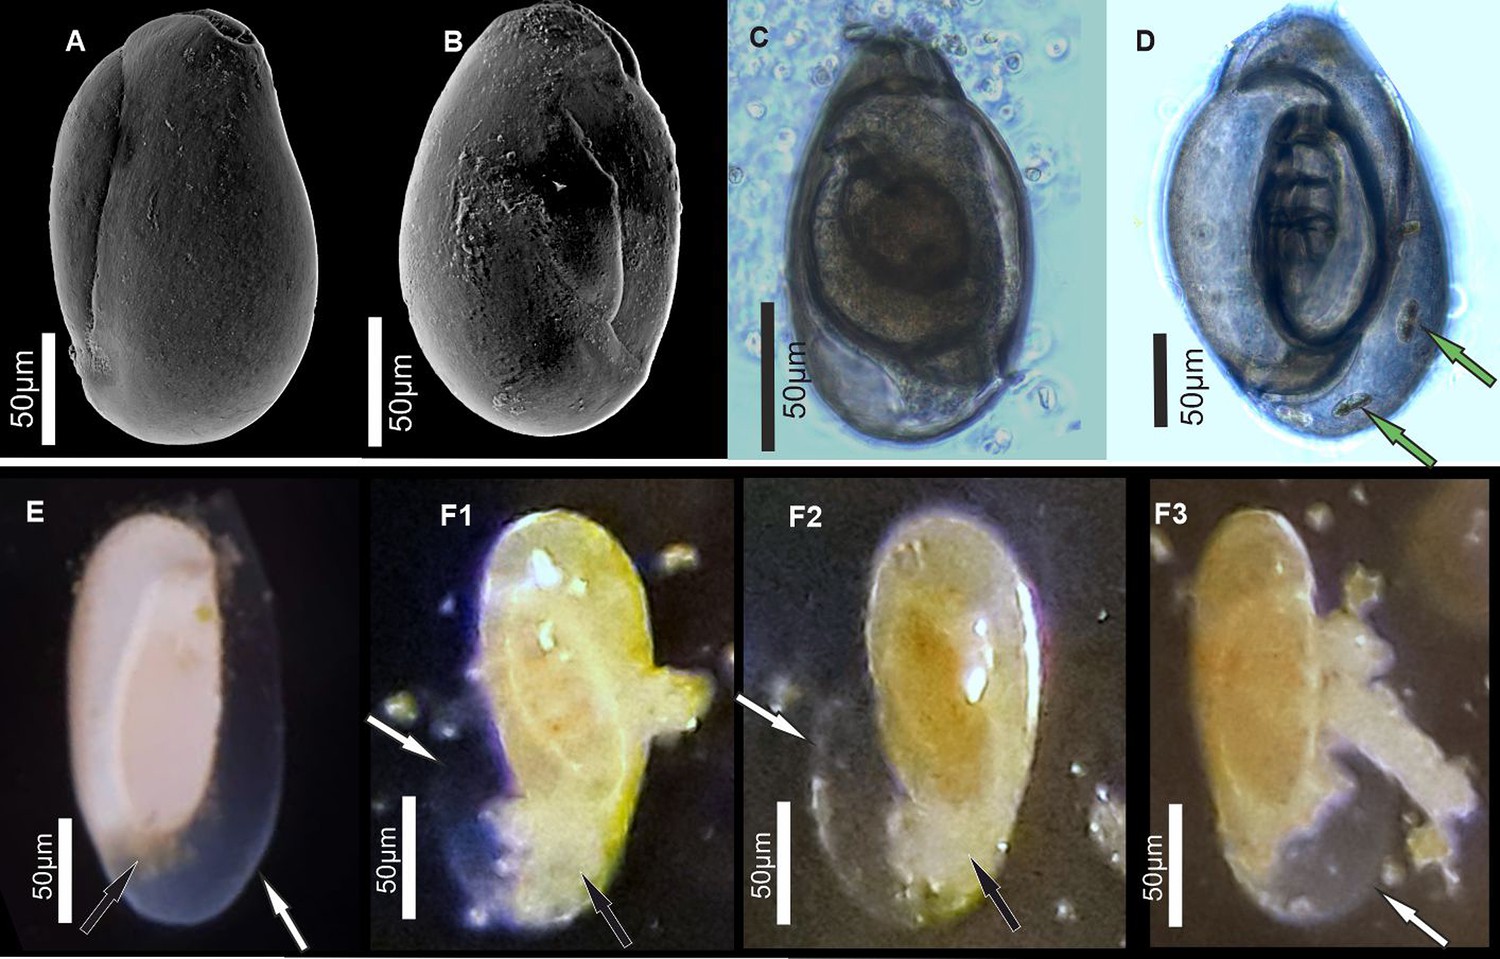
Specimens of miliolid foraminifera, identified as P. eburnea (d’Orbigny), used for experimental studies.
(A, B) Scanning electron microscopy (SEM), (C, D) transmitted light microscope, and (E, F) stereomicroscope images. White arrows show the outer organic sheath of a new chamber during its gradual calcification expressed by its gradual appearance from complete transparency to milky and opaque aspect (E, F). Black arrows indicate a small mass of cytoplasm extruded from the aperture of the existing chamber. Green arrows point to incorporated algae.
Figure 2 with 4 supplements
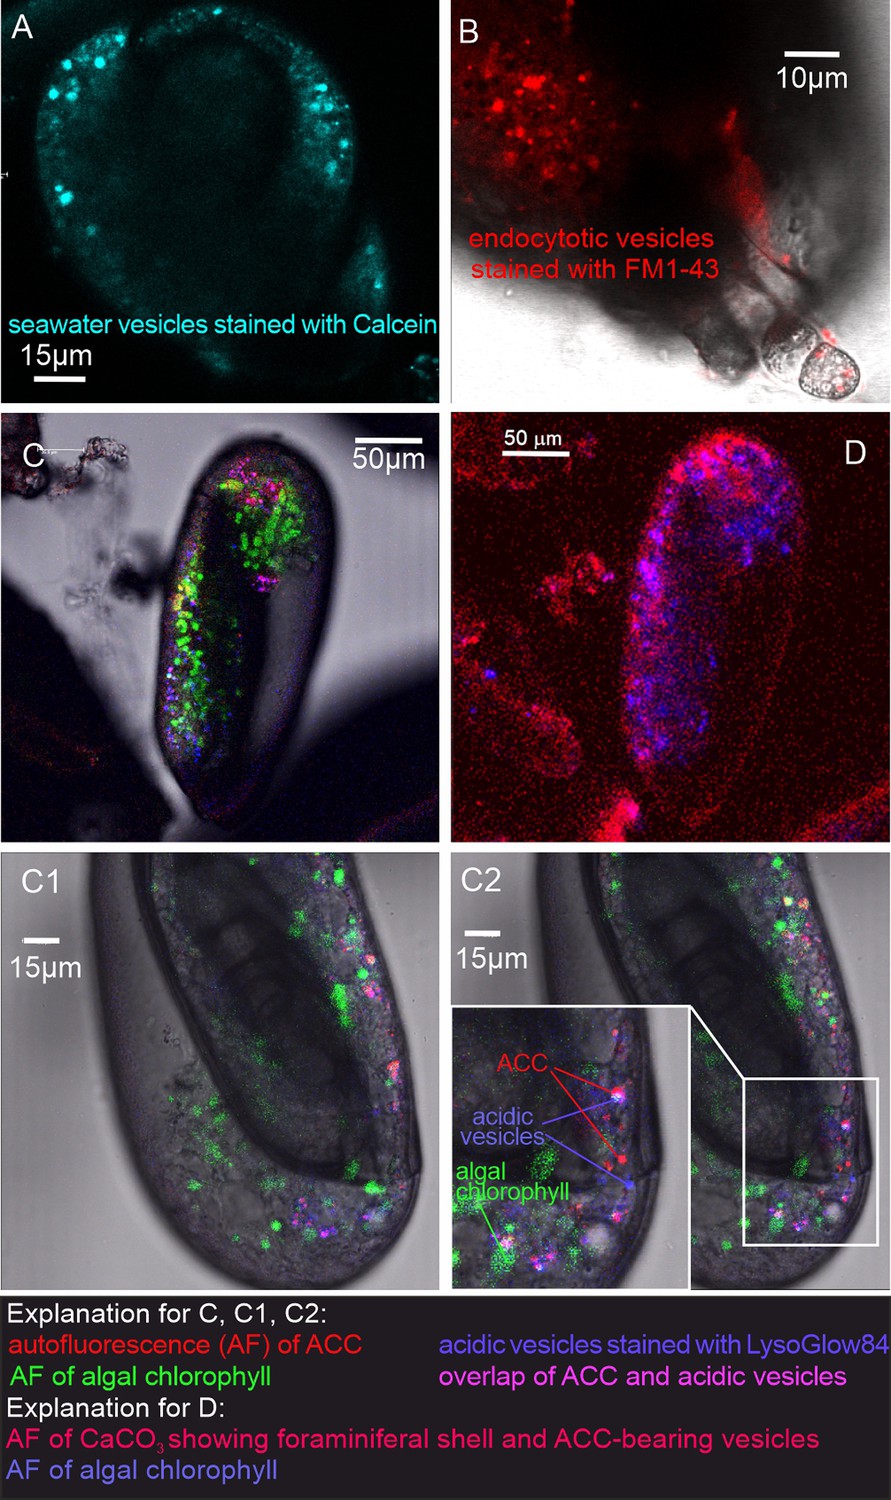
Fluorescence images of living P. eburnea conducted by confocal laser scanning microscopy.
(A) Cell-impermeable Calcein (cyan) indicating endocytotic seawater vesicles, see Figure 2—video 1. (B) FM1-43 membrane dye indicating endocytotic vesicles (red), see Figure 2—video 2. (C) LysoGlow84 indicating acidic vesicles (navy blue), autofluorescence of chloroplasts (green), and Mg-ACC pools (red), see Figure 2—videos 3 and 4 (note the overlap of ACC and acidic vesicles is marked in lilac). (D) Autofluorescence image with reduced threshold of the studied Miliolida species (exc. 405 nm) showing algal chlorophyll (blue) and CaCO3 (red), both ACC and calcite shell.
Figure 2—video 1
Living P. eburnea showing cell-impermeable Calcein (blue, exc. 488 nm, em. 505–555) in a series of 107 overlaid images taken during 428 s.
Calcein staining indicates the occurrence of seawater vesicles inside the cytosol.
Figure 2—video 2
FM1-43 membrane probe fluorescent signals (red, exc. 488 nm, em. 580–620 nm) emitted by intracellular vesicles within cytosol of P. eburnea.
Because FM1-43 stains only the cell membrane, the observed vesicles must be originated during the process of endocytosis. The movie was taken by overlaid of 84 images during 433 s.
Figure 2—video 3
Living P. eburnea showing fluorescence signal inside the cytosol: autofluorescence of Mg-ACC pools (red, exc. 405 nm, em. 420–490 nm) and algal chloroplasts (green, exc. 633 nm, em. 640–690 nm), fluorescent signal of LysoGlow84 pH-sensitive dye (exc. MP 720 nm, em. 440–470 nm) indicating acidic vesicles.
The movie was taken by overlaid of 37 images during 555 s.
Figure 2—video 4
Living P. eburnea showing fluorescence signal inside the cytosol: autofluorescence of Mg-ACC pools (red, exc. 405 nm, em. 420–490 nm) and algal chloroplasts (green, exc. 633 nm, em. 640–690 nm), fluorescent signal of LysoGlow84 pH-sensitive dye (exc. MP 720 nm, em. 440–470 nm) indicating acidic vesicles.
The movie was taken by overlaid of 37 images during 555 s.
Figure 3 with 5 supplements
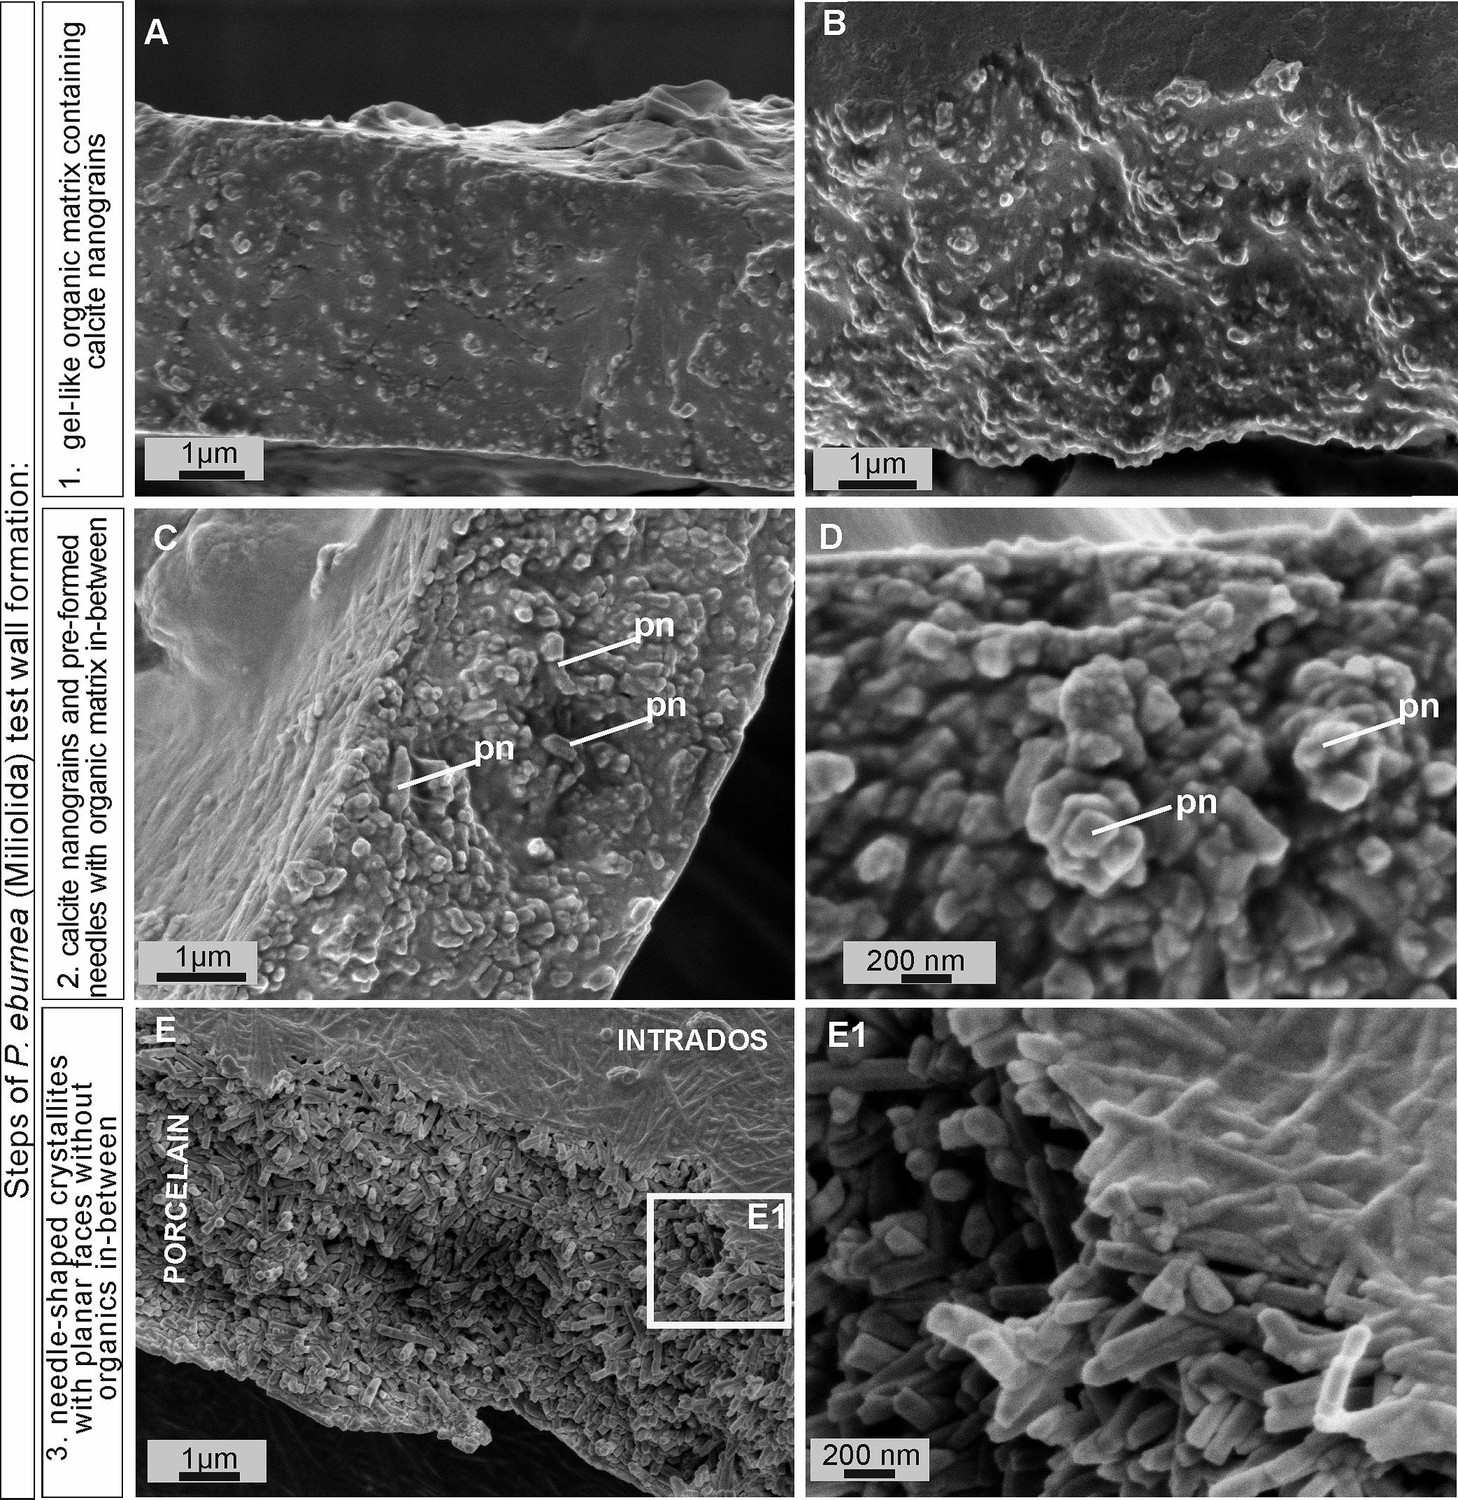
Scanning electron microscopy (SEM) images of the major steps of the formation of P. eburnea shell-building components.
Test cross-section showing: (A, B) carbonate nanograins within organic matrix, (C, D) nanograins merging into needle-like mesocrystals, (E) fully developed needle-shaped elements; pn – nanograins partly transformed to short needles.
-
Figure 3—source data 1
SEM images of fixed P. eburnea.
- https://cdn.elifesciences.org/articles/91568/elife-91568-fig3-data1-v1.zip
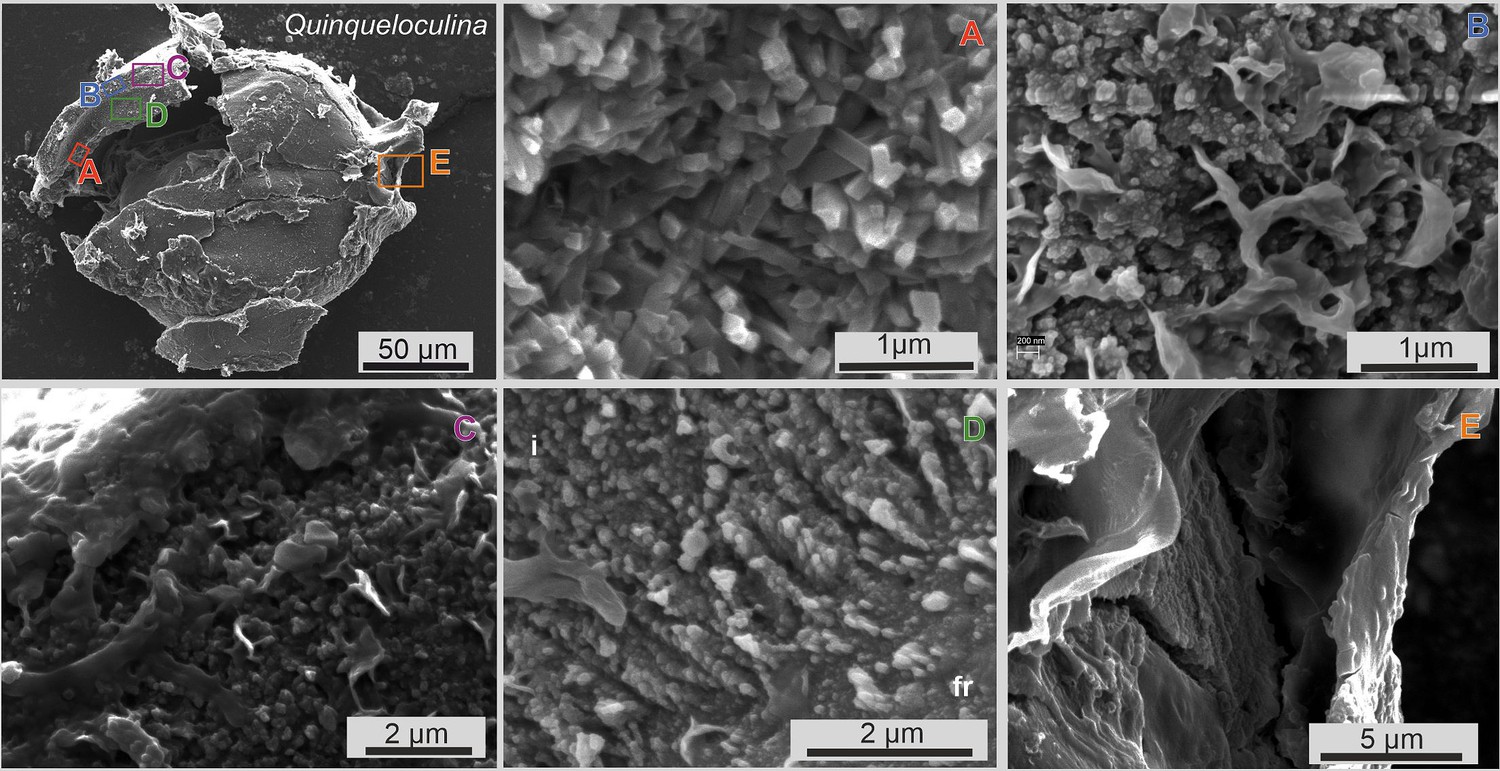
Figure 3—figure supplement 1
Scanning electron microscopy (SEM) images of the new shale formation site of P. eburnea.
SEM images of broken specimen of P. eburnea (d’Orbigny) showing the test wall made of calcite nanograins (A–E) within organic gel-like fluids in-between, and cytoplasmic structures below a newly created chamber (G), and diatoms (white arrows) inside the test (G, H).
-
Figure 3—figure supplement 1—source data 1
SEM images of fixed P. eburnea.
- https://cdn.elifesciences.org/articles/91568/elife-91568-fig3-figsupp1-data1-v1.zip
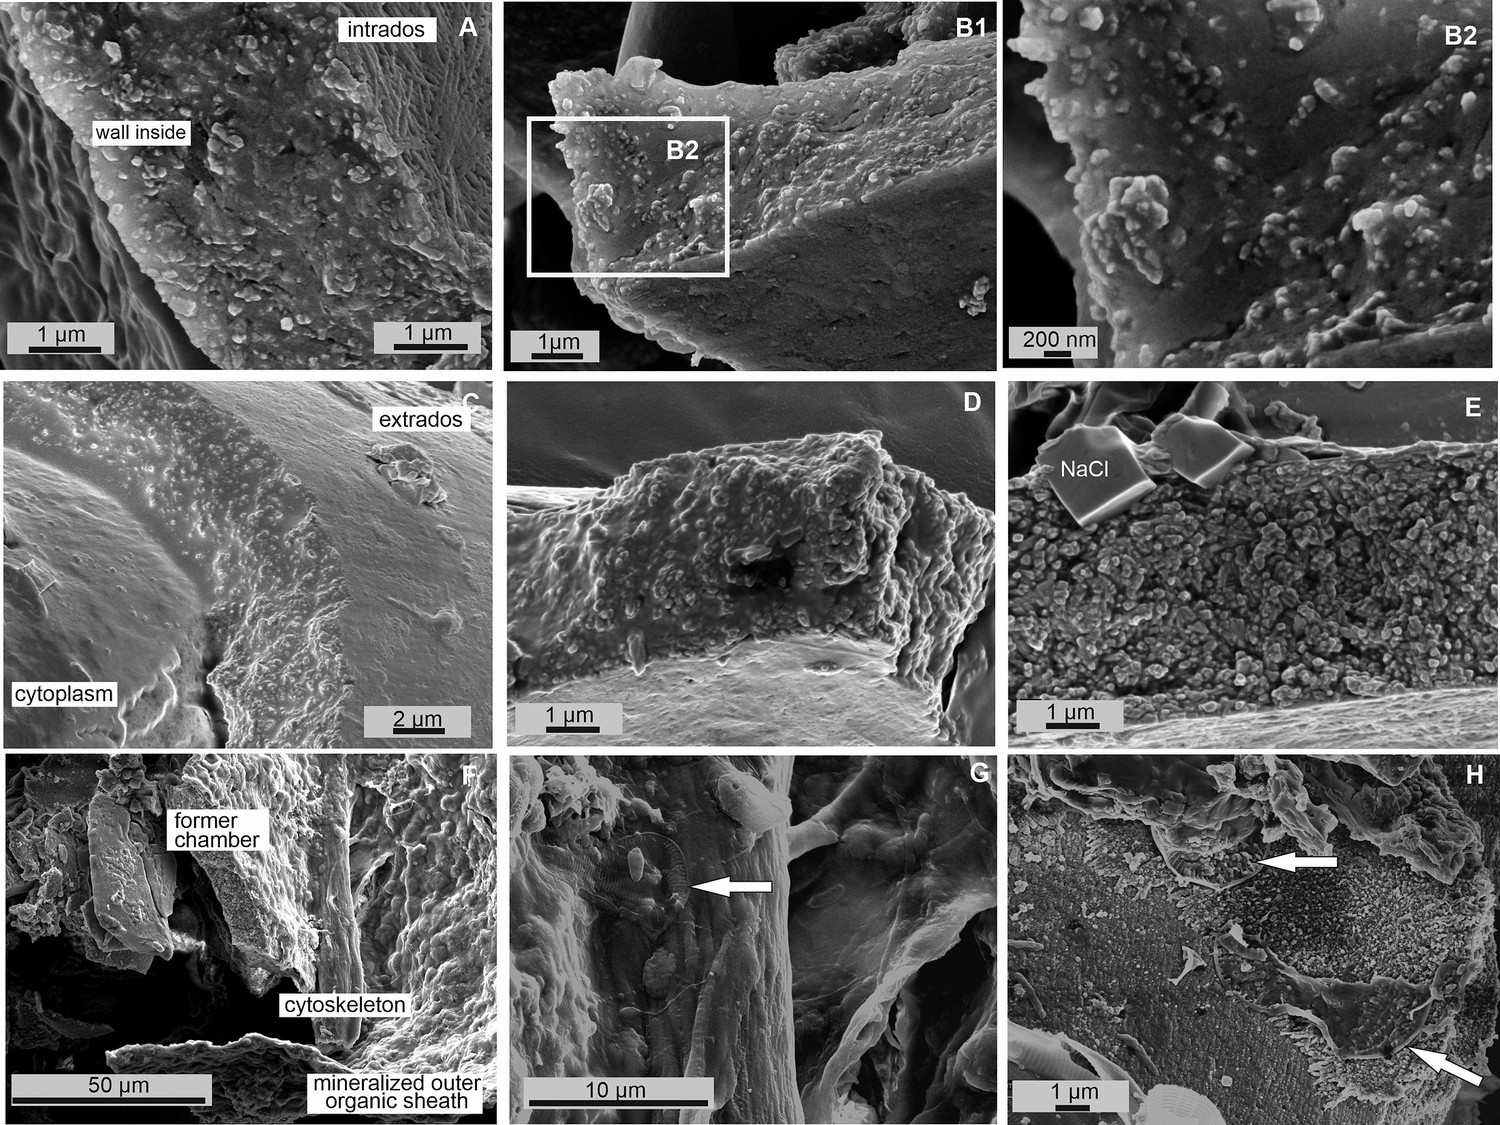
Figure 3—figure supplement 2
Scanning electron microscopy (SEM) images of fixed P. eburnea during calcification process.
SEM images of broken specimen of P. eburnea (d’Orbigny) showing a cross-section of the mineralized outer organic sheath of the last chamber (A, B) and the fully mineralized test wall of the former chamber (C).
-
Figure 3—figure supplement 2—source data 1
SEM images of fixed P. eburnea.
- https://cdn.elifesciences.org/articles/91568/elife-91568-fig3-figsupp2-data1-v1.zip
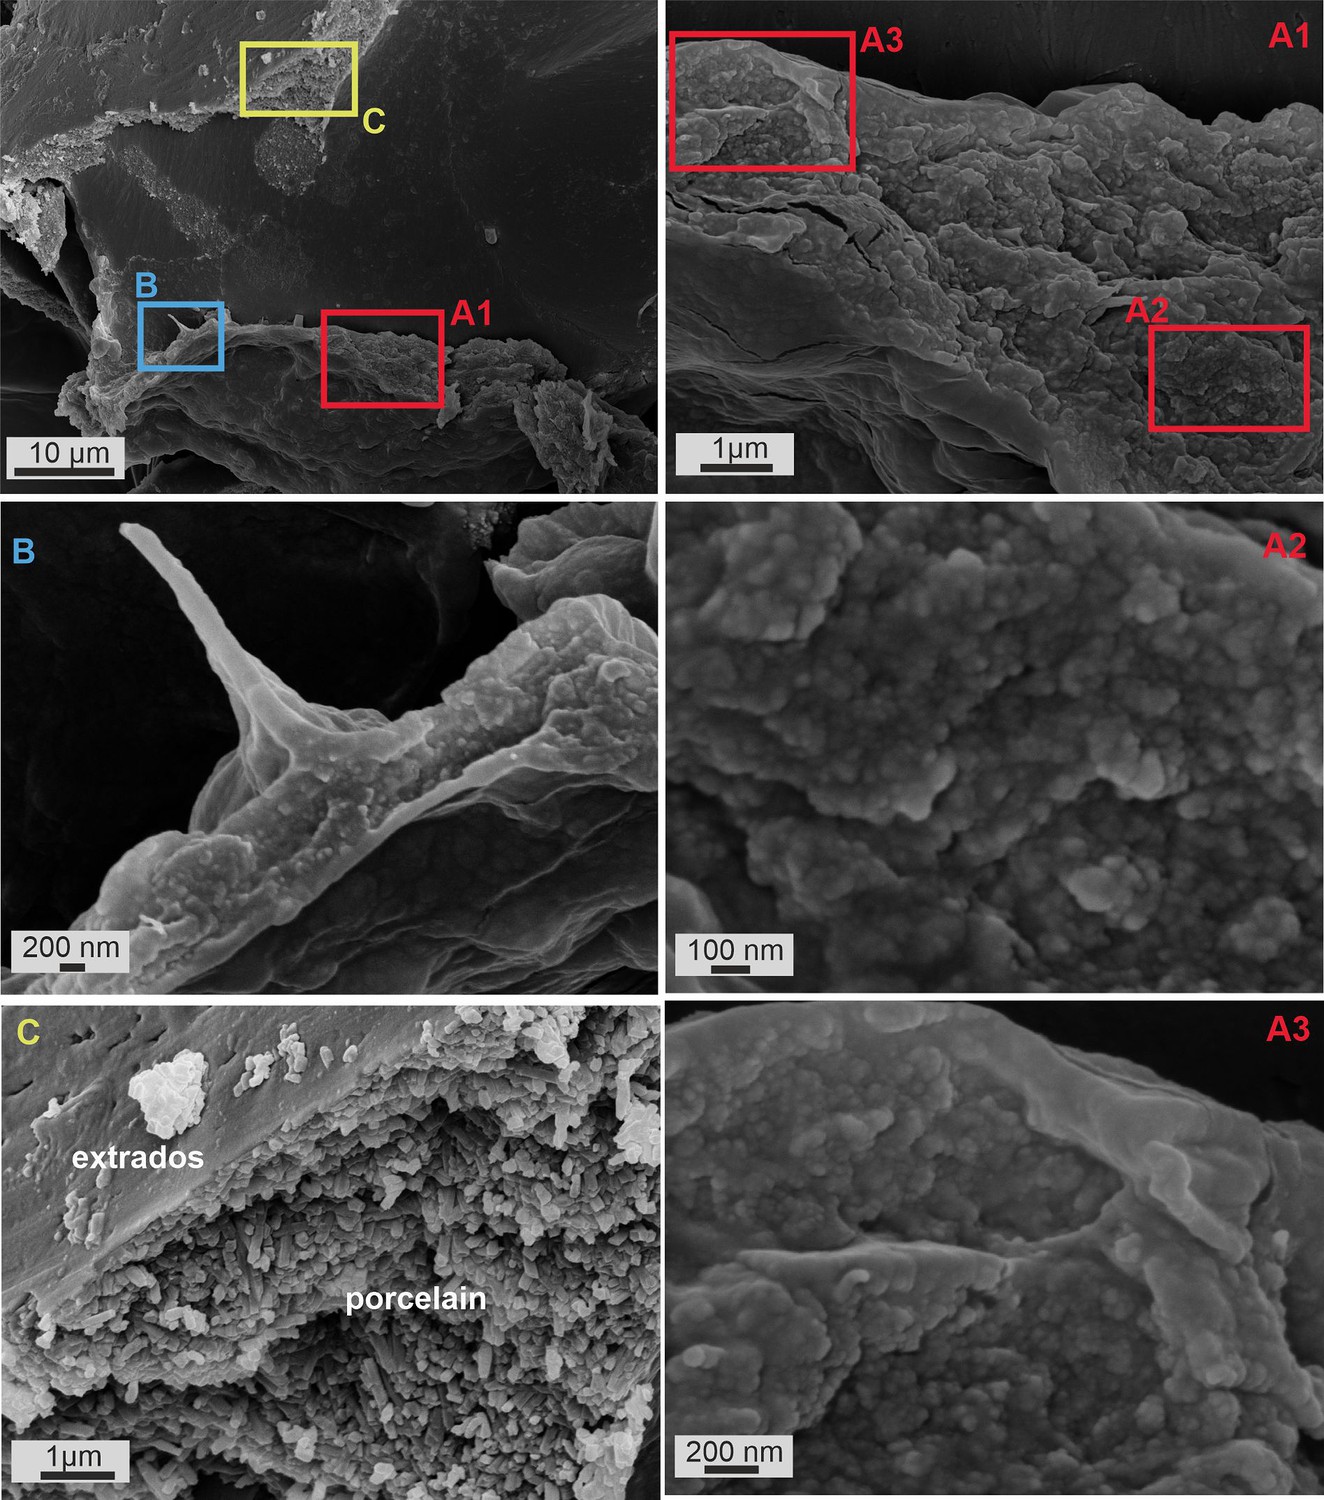
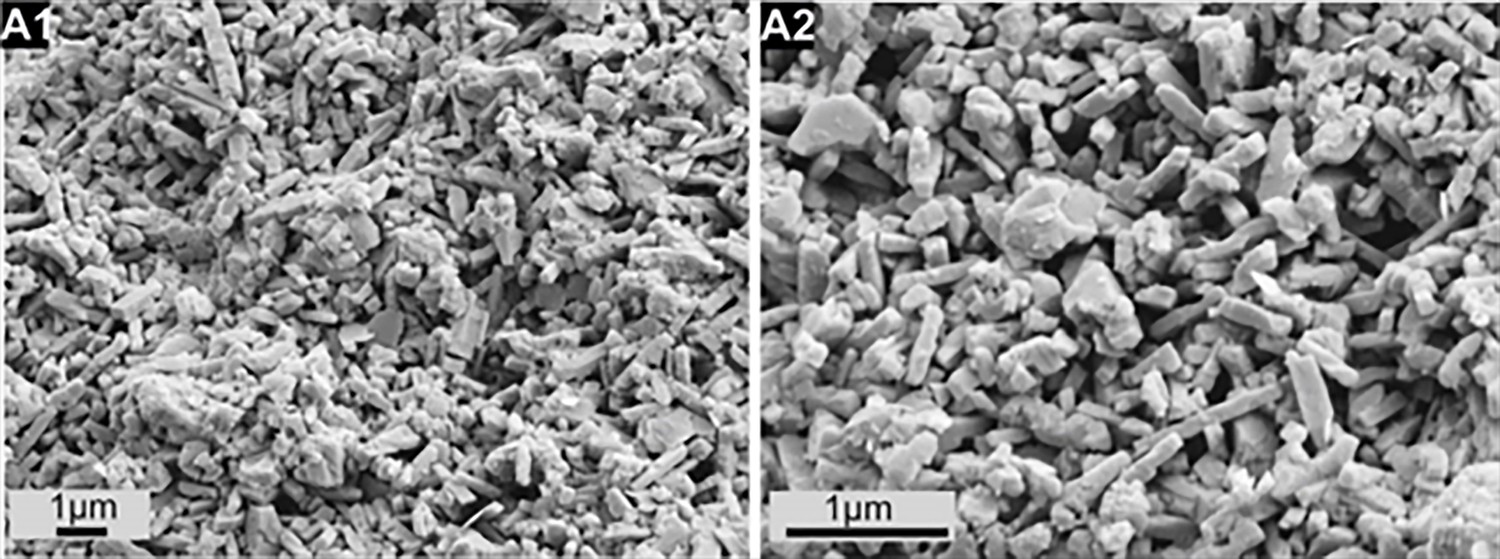
Figure 3—figure supplement 3
Scanning electron microscopy (SEM) images of newly built chamber and previous chambers of one specimen of P. eburnea.
SEM images of different parts of the broken test of the P. eburnea (d’Orbigny) specimen showing (A) a fully developed test wall made of randomly oriented calcite needle-shaped crystals with planar faces; (B) test inside of newly built chamber wall made of calcite nanograins and some organic matter between the needles; (C) test inside of newly built chamber wall covered with an outer organic sheath; (D) rudiments of needles of extrados composed of rows of calcite nanograins and attached to the former chamber (fr); (E) outer organic sheath.
-
Figure 3—figure supplement 3—source data 1
SEM images of P. eburnea.
- https://cdn.elifesciences.org/articles/91568/elife-91568-fig3-figsupp3-data1-v1.zip
Figure 3—figure supplement 4
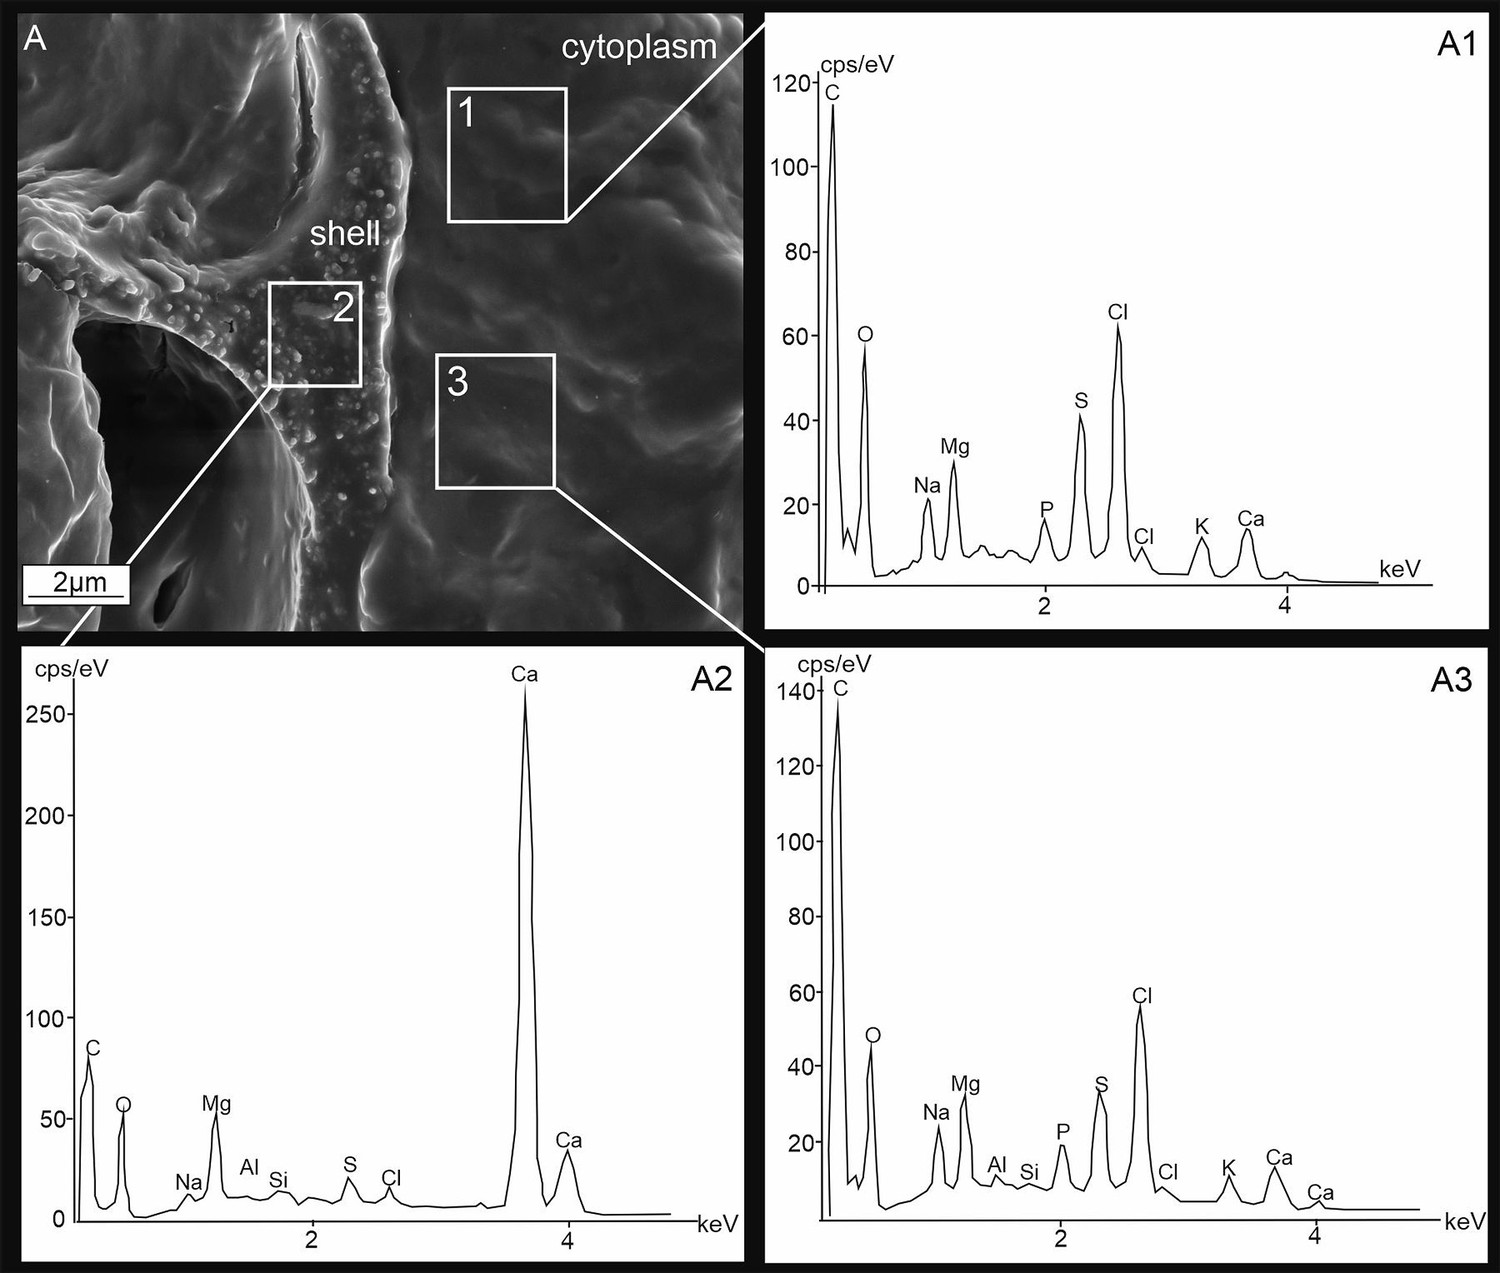
Energy-dispersive X-ray spectrometry (EDS) analysis.
Scanning electron microscopy (SEM) images (A) and EDS spectra (A1–A3) of P. eburnea fixed cytosol (A1, A2) and newly created chamber (A3) indicating the chemical composition of both structures. cps/eV: counts per second per electron-volt.
Figure 3—figure supplement 5
Scanning electron microscopy (SEM) images of miliolid Agathamina pusilla Geinitz from the Lower Permian (ca. 290 Mya) of the Holy Cross Mountains (Poland) showing needle test structure identical to that of Recent taxa.
Figure 4
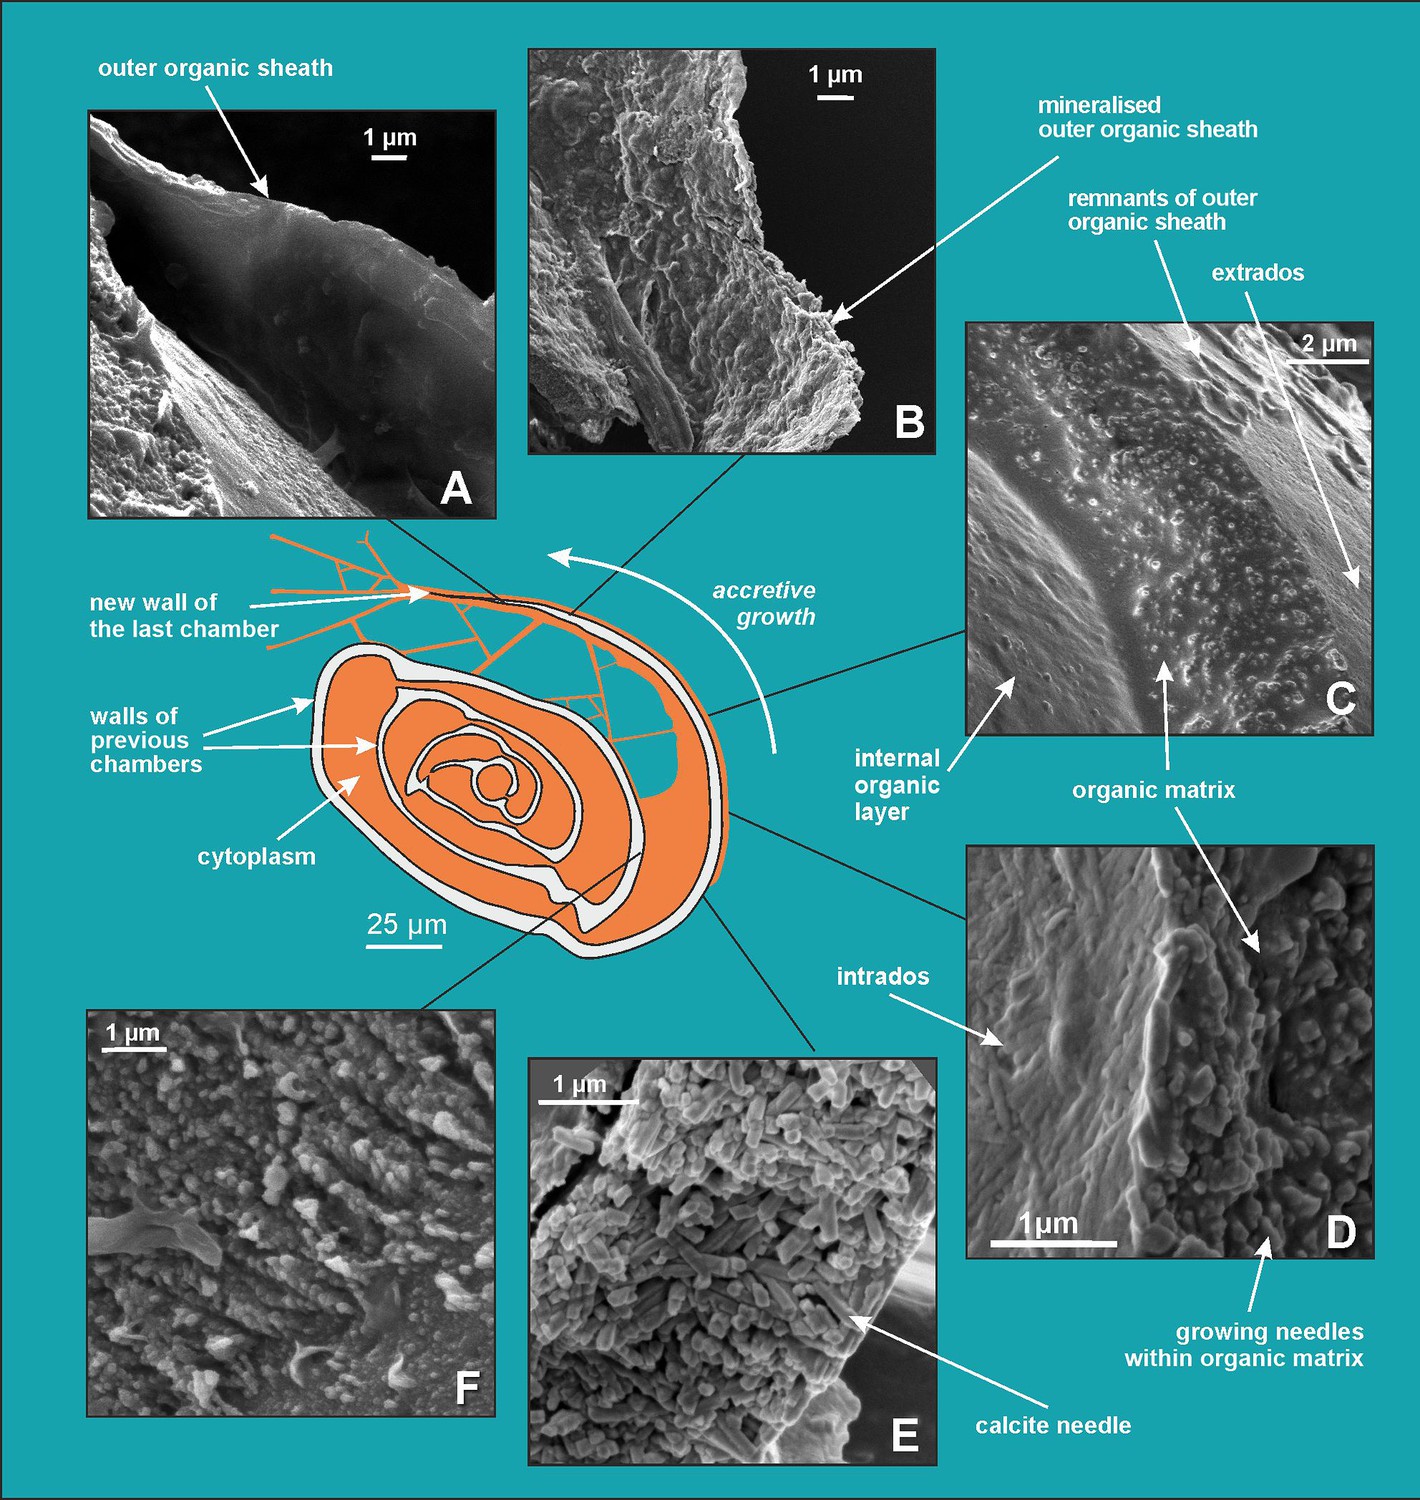
Scanning electron microscopy (SEM) images showing successive stages of new chamber formation in P. eburnea.
(A) Outer organic sheath, (B) mineralized outer organic sheath, (C) calcite nanograins within a gel-like organic matrix, (D) needle-shaped mesocrystal growth, (E) needle-like calcite building elements, (F) nanogranular shell (interval view).
-
Figure 4—source data 1
SEM images of P. eburnea.
- https://cdn.elifesciences.org/articles/91568/elife-91568-fig4-data1-v1.zip
Figure 5
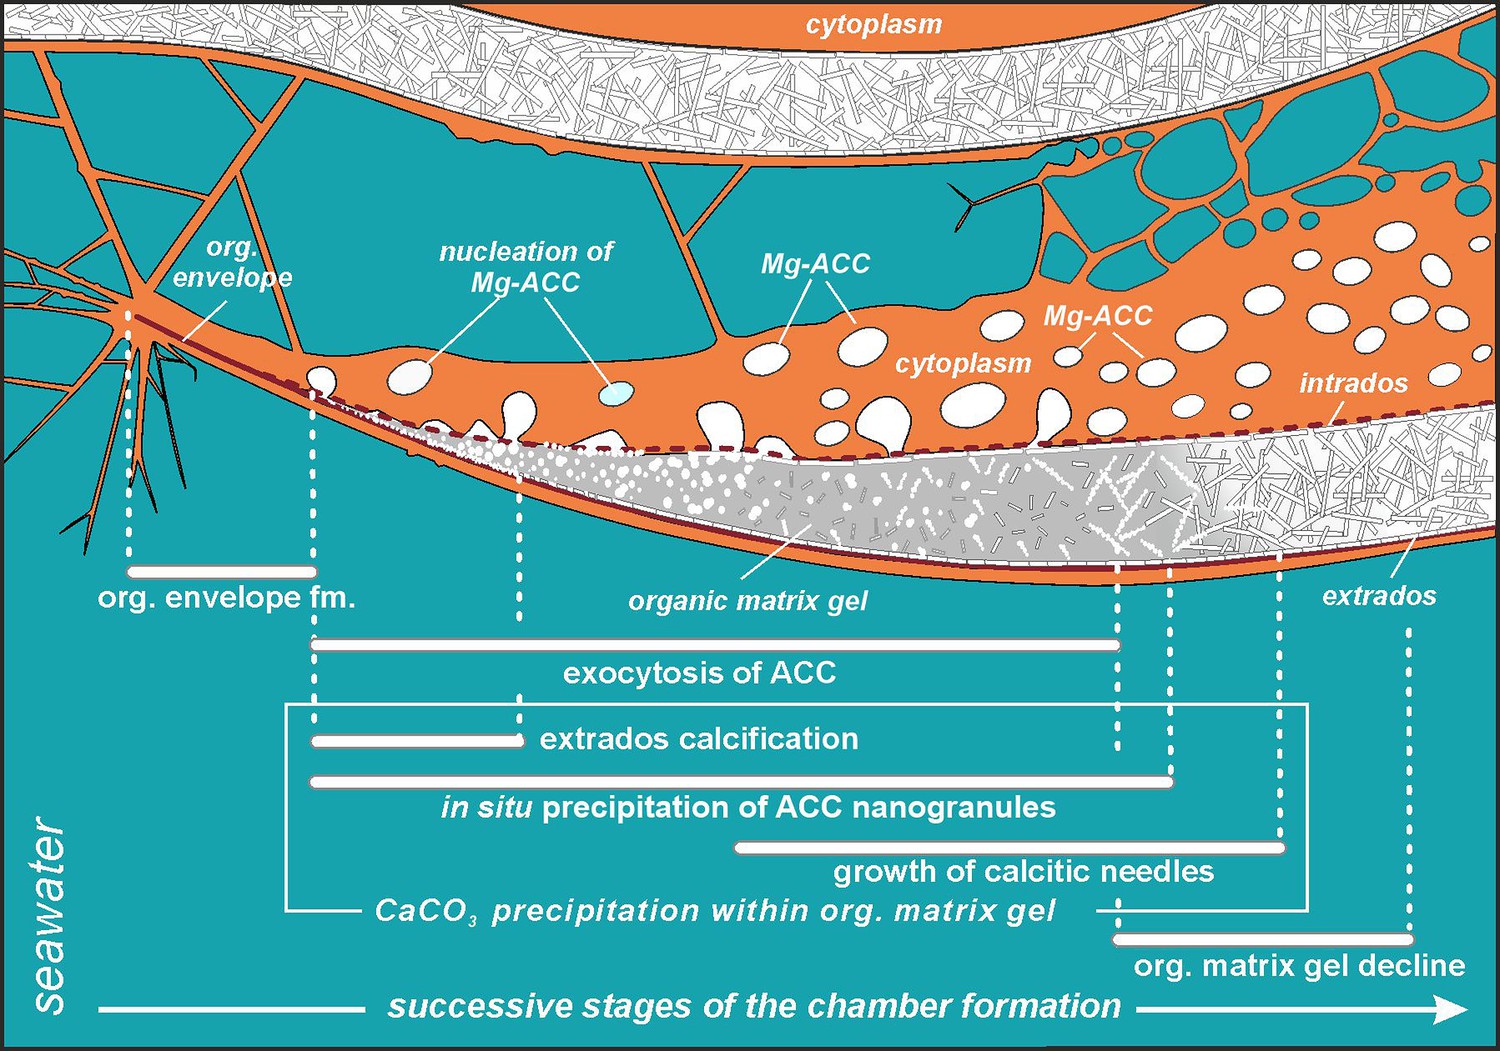
Simplified model of porcelaneous wall construction based on foraminifer P. eburnea.
White spots labeled as Mg-ACC represent vesicles with Mg-rich amorphous calcium carbonates.
Author response image 1

Autofluorescence image of studied Miliolida species (exc. 405 nm) showing algal chlorophyll (blue) and CaCO3 (red), both ACC and calcite shell.
Tables
Table 1
Wavelengths and dyes.
| Dye | Concentration | Excitation nm | Emission nm | Source | Function |
|---|---|---|---|---|---|
| LysoGlow84 | 50 µM | Multiphoton 730 | 380–415/450–470 | Marnas Biochemicals | pH, membrane permeable |
| FM1-43 | 1 µM | Argon 488 or Multiphoton 1000 nm | 580–620 | Thermo Fisher Scientific | Membrane staining |
| Calcein | 0,7 mg/10 mL | Argon 488 | 510–555 | Thermo Fisher Scientific | Membrane -impermeable water soluble dye |
| Autofluorescence | Diode 405 MP 800 | 420–490 | CaCO3, ACC | ||
| Autofluorescence | Diode 405/HeNe 633 | 650–700 | Chlorophyll of algae |
Additional files
Download links
A two-part list of links to download the article, or parts of the article, in various formats.
Downloads (link to download the article as PDF)
Open citations (links to open the citations from this article in various online reference manager services)
Cite this article (links to download the citations from this article in formats compatible with various reference manager tools)
Biocalcification in porcelaneous foraminifera
eLife 13:RP91568.
https://doi.org/10.7554/eLife.91568.3


