Conserved regulatory motifs in the juxtamembrane domain and kinase N-lobe revealed through deep mutational scanning of the MET receptor tyrosine kinase domain
- Tetrad Graduate Program, University of California, San Francisco, United States
- Cardiovascular Research Institute, University of California, San Francisco, United States
- Department of Cellular and Molecular Pharmacology, University of California, San Francisco, United States
- Department of Bioengineering and Therapeutic Sciences, University of California, San Francisco, United States
- Quantitative Biosciences Institute, University of California, San Francisco, United States
- Helen Diller Family Comprehensive Cancer Center, University of California, San Francisco, United States
- Department of Medicine/Hematology and Oncology, University of California, San Francisco, United States
Figures
Figure 1
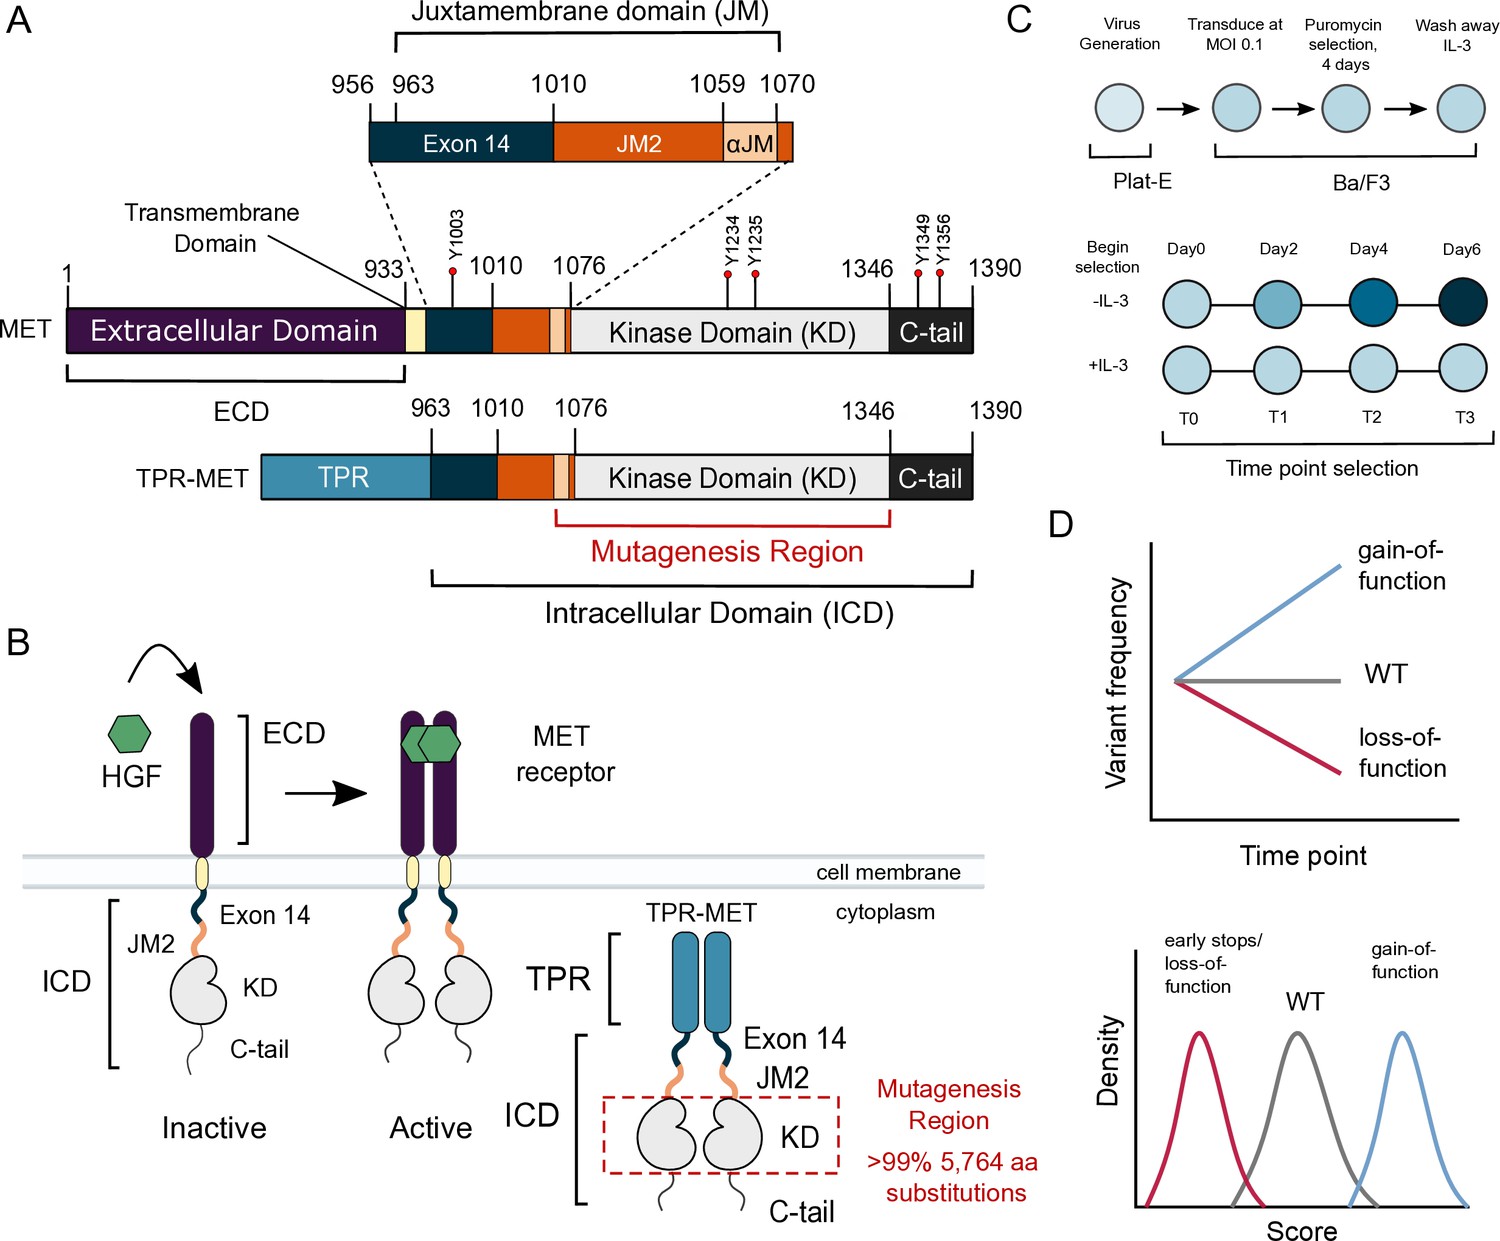
MET domain boundaries and deep mutational scan (DMS) experimental workflow.
(A) Domain boundaries of the full-length MET receptor (MET) and TPR-MET fusion (TPR-MET). Extracellular domain (ECD) and intracellular domain (ICD) are distinguished with important phosphorylation sites highlighted in red. Juxtamembrane domain (JM) boundaries are sectioned to annotate the exon 14 coding region and the remainder of the JM (JM2), which includes a ⍺JM-helix (⍺JM). (B) Schematic of the full-length, membrane-associated MET receptor with posited MET ECD dimerization upon hepatocyte growth factor (HGF) binding; schematic of the cytoplasmically expressed, constitutively dimerized TPR-MET construct. The DMS mutagenesis region of the kinase domain (KD) is bordered in red. (C) Experimental screen workflow applied to generate and express kinase domain variants prior to selection, beginning with virus generation in Plat-E cells, transduction into Ba/F3 cells at a 0.1 multiplicity of infection (MOI), puromycin selection to enrich for positively infected cells, followed by the IL-3 selection process and time point collection for deep sequencing. (D) Post-selection method for analyzing and validating mutation scores based on observed variant frequencies at each time point, measured as a slope which can then be plotted as a distribution.
Figure 2 with 2 supplements
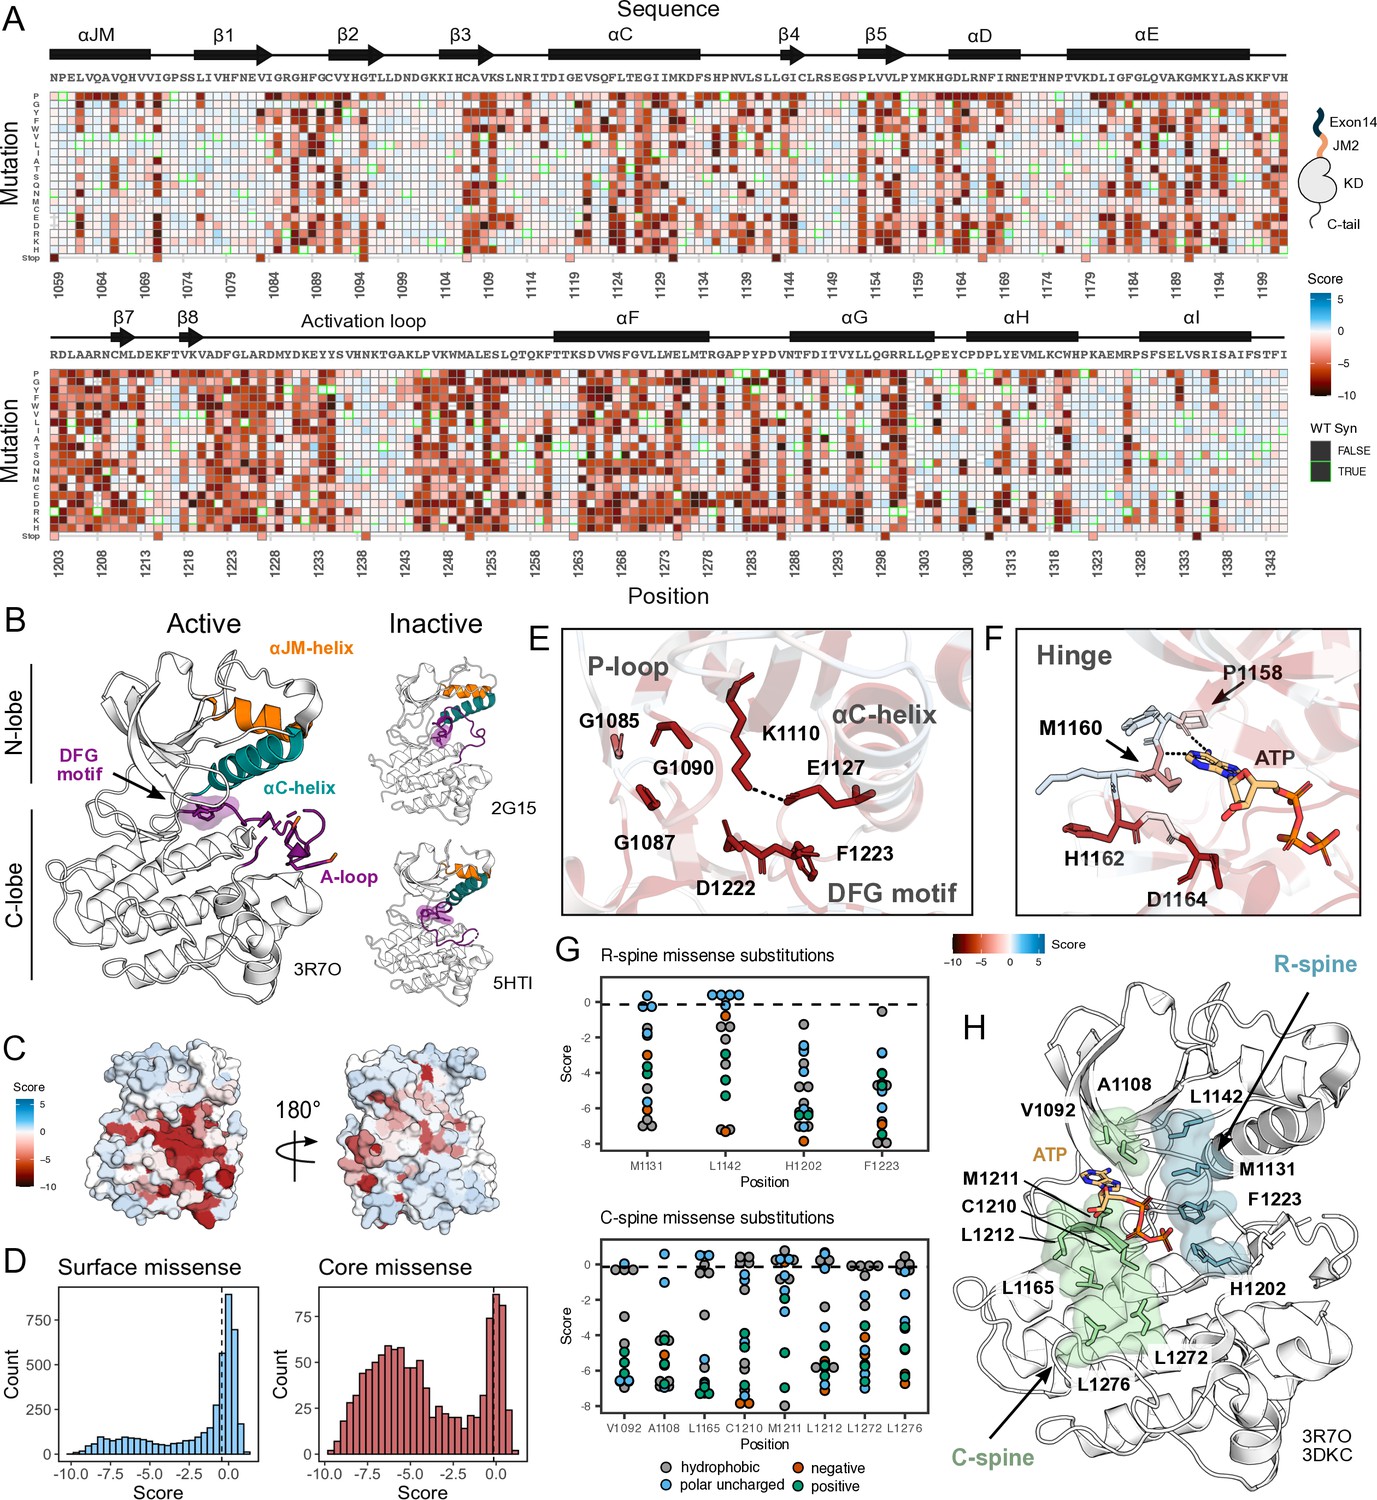
Measured effect of MET kinase domain variants across 287 amino acid positions in the context of the full-length juxtamembrane.
(A) Heatmap of MET kinase domain mutation scores. Wild-type (WT)-synonymous substitutions are outlined in green. (B) Active structure of the MET kinase domain (PDB 3R7O), and two representative inactive structures (PDB 2G15, 5HTI) with motif details highlighted. (C) Surface representation of average mutational scores mapped on an active structure (PDB 3R7O). Synonymous and nonsense mutations were left out of the averaging and surface representation. Residues at the N- and C-term that were not screened, but modeled in the crystal structure are in white and not considered in the averaging and mapping. (D) Comparison of surface and core residue scores distributions. A vertical dashed line in both graphs represents the mean score of WT-synonymous mutations. (E) Catalytic site and key residues involved in ATP binding and stabilization. Average score of variants mapped onto an active structure (PDB 3R7O). (F) Hinge region residues are involved in ATP binding and stabilization. Average score of variants mapped onto an active structure (PDB 3R7O), and overlaid with the ATP molecule of the ATP-bound MET structure (PDB 3DKC). (G) Mutation scores and physiochemistry of variants are shown for each residue position of the R- and C- spine of MET. (H) R-spine (blue) and C-spine (green) residues are highlighted on an active structure (PDB 3R7O) overlaid with the ATP molecule of the ATP-bound MET structure (PDB 3DKC).
Figure 2—figure supplement 1
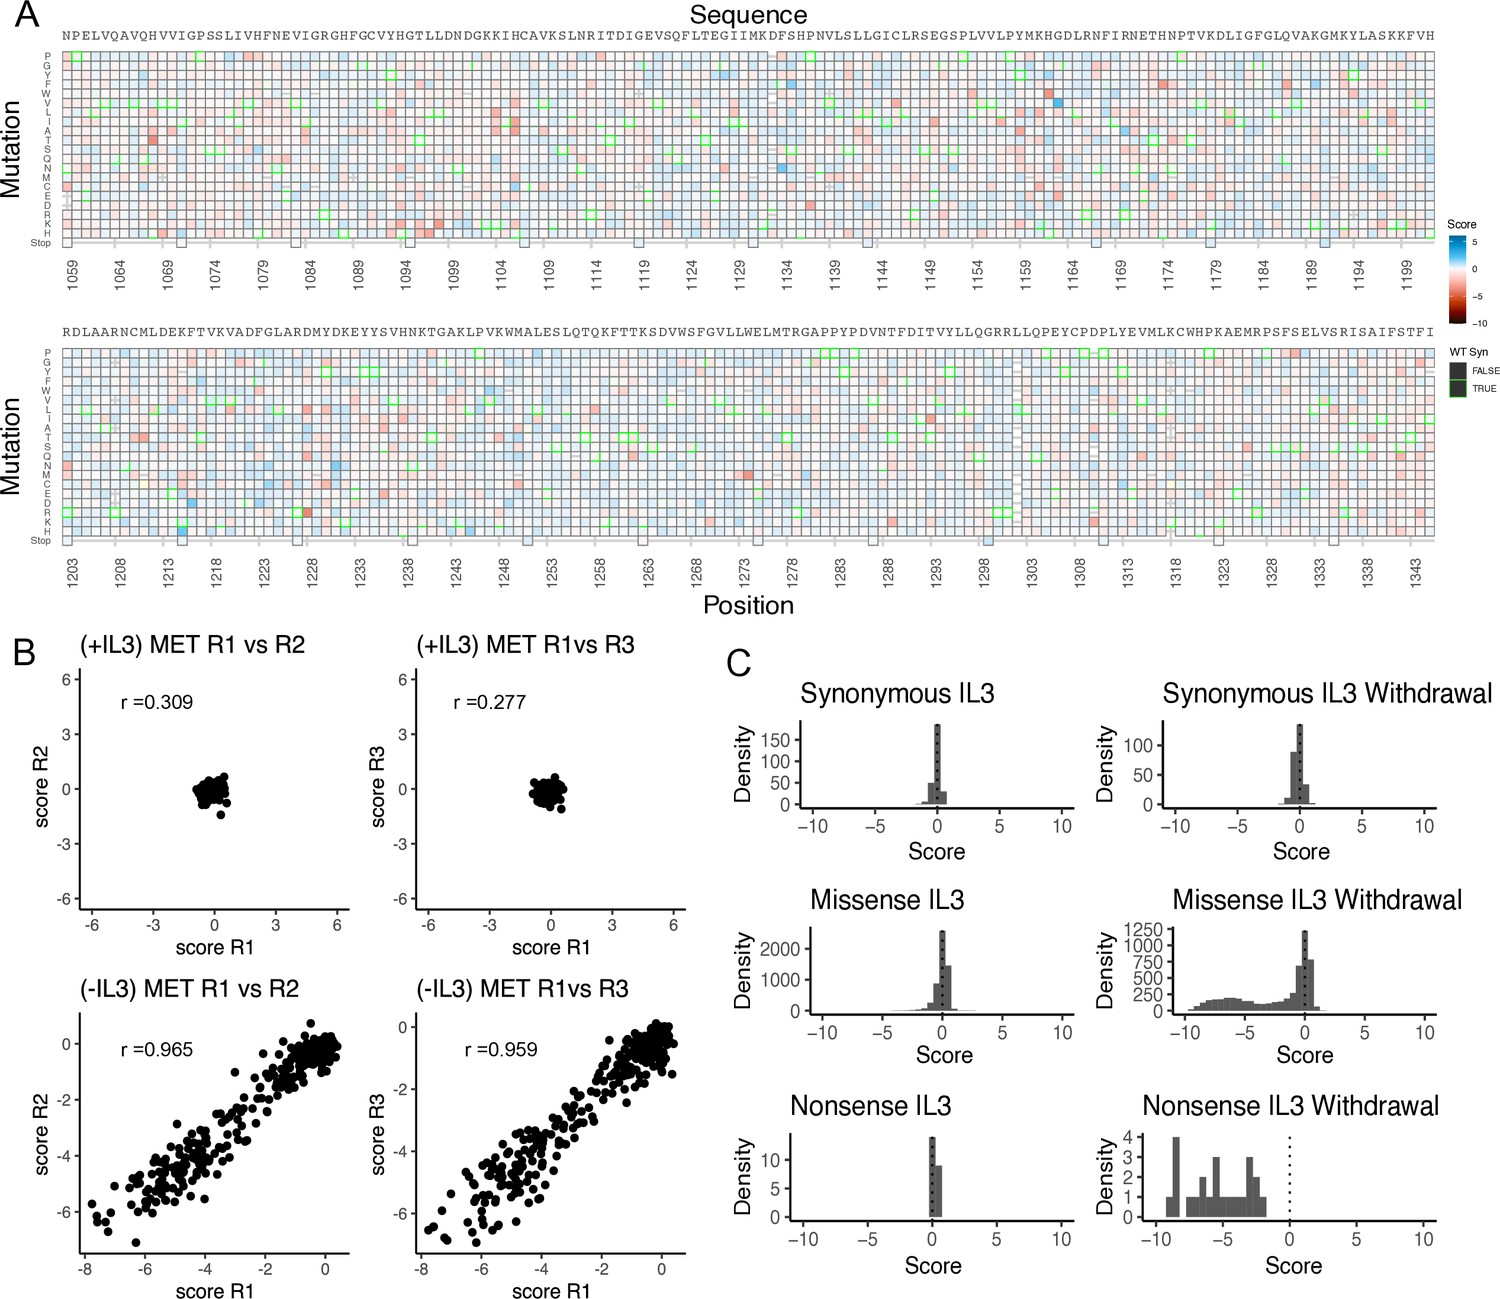
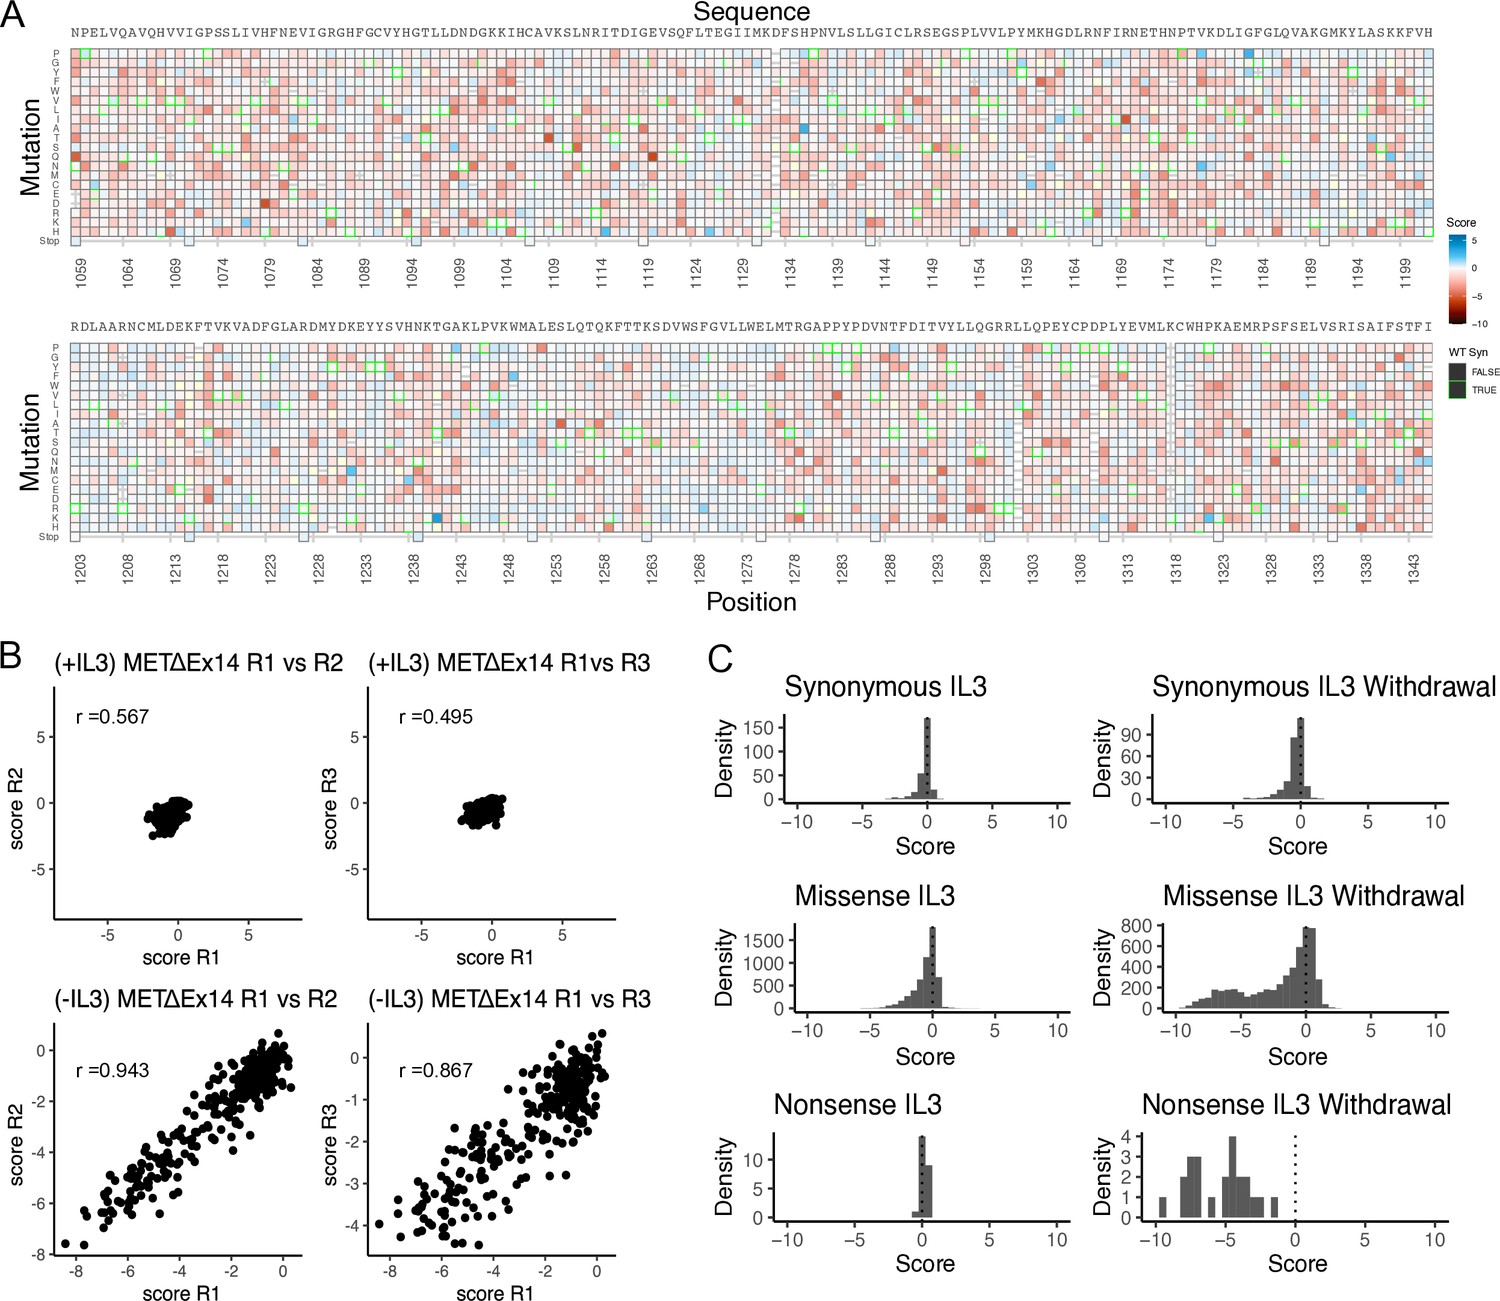
Validation of the MET kinase domain saturation mutagenesis library in IL-3 and IL-3 withdrawal selections.
(A) Heatmap of TPR-MET kinase domain variants in the full-length juxtamembrane background for the IL-3 control condition that was run in parallel to the IL-3 withdrawal selection. (B) Replicate correlation analysis for both IL-3 and IL-3 withdrawal conditions, where the mean score for each position was plotted against the replicate value. Pearson’s correlation score is reported in each respective graph. (C) Distributions of synonymous, missense, and nonsense mutations for IL-3 and IL-3 withdrawal conditions.
Figure 2—figure supplement 2
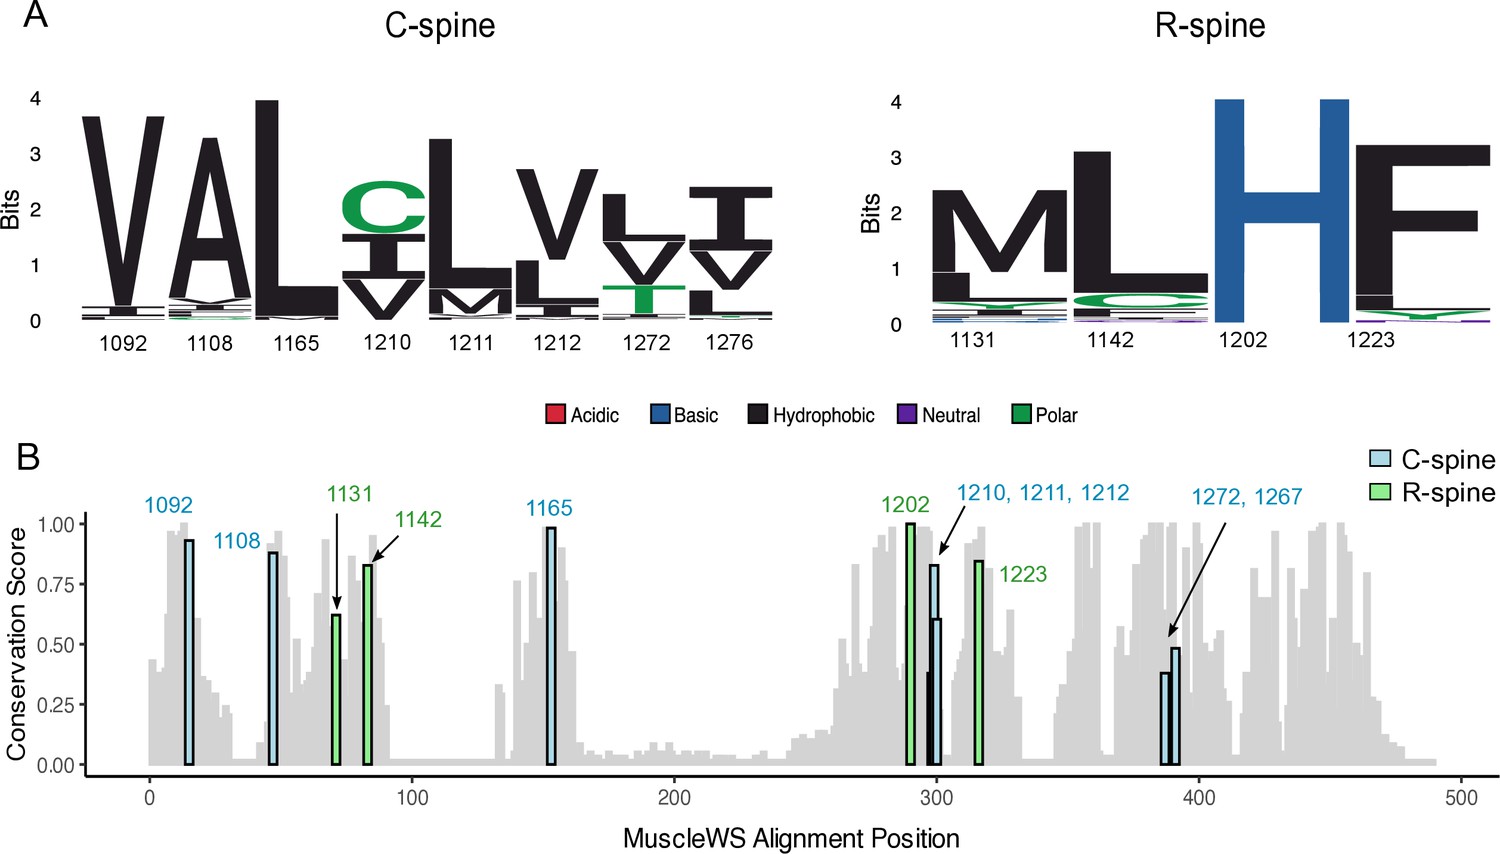
Analysis of RTK R- and C-spine protein sequence conservation.
(A) Logo diagram representing the amino acid conservation of the C- and R-spine across all receptor tyrosine kinase (RTK) domain protein sequences, aligned by MuscleWS. (B) Conservation score of residues at the corresponding MET C- and R-spine positions for all RTK kinase domain protein sequences, aligned by MuscleWS and scored through the bio3D package ‘conserv’ function using a BLOSUM62 scoring matrix.
Figure 3
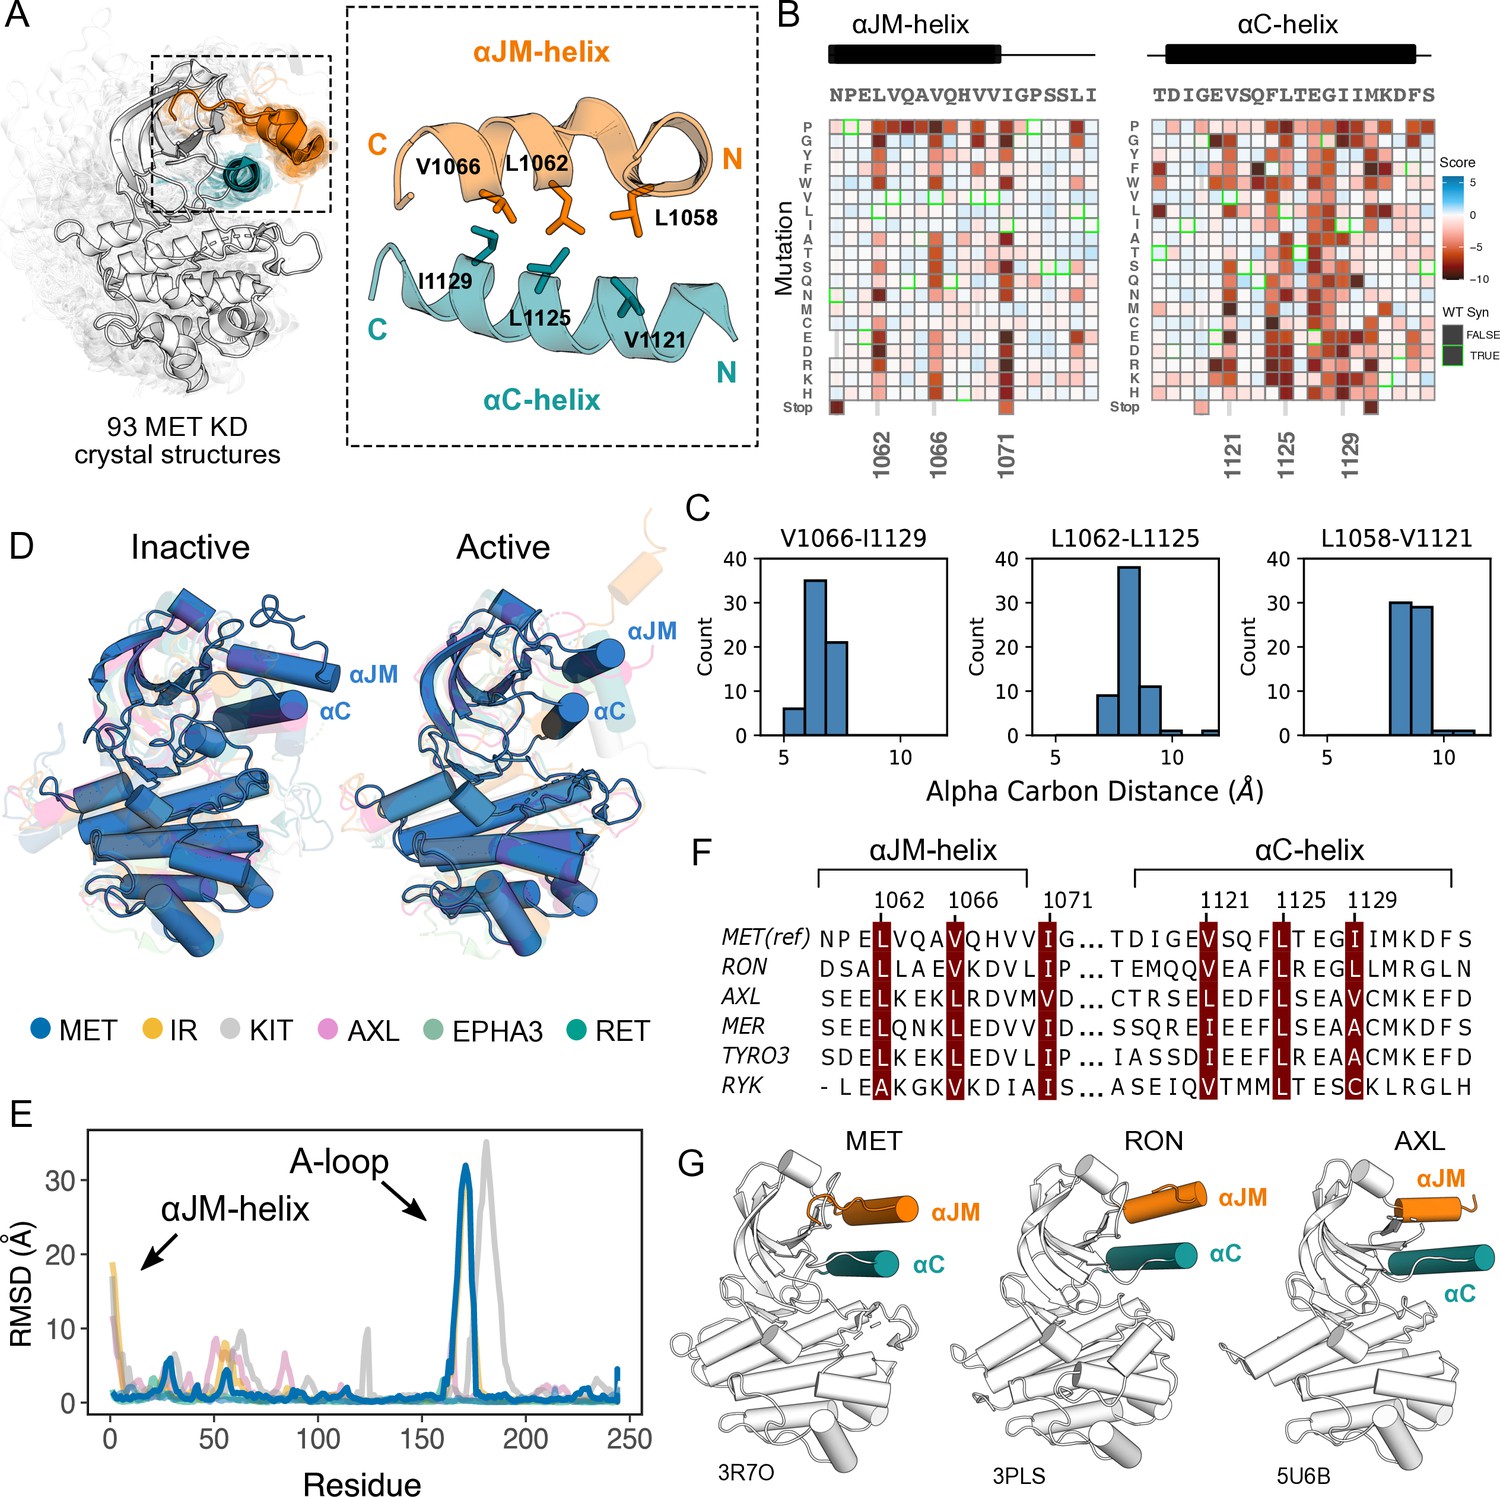
Essential ⍺JM and ⍺C interactions were revealed through variant and structural analysis.
(A) Ensemble of 93 MET kinase domain crystal structures available in the PDB. All structures, independent of conformation, were locally aligned to JM residues 1059–1070 (all resolved JM and ⍺JM-helix residues in orange), and ⍺C-helix residues 1117–1134 (teal). In solid gray is a representative active structure (PDB 3R7O). Residues involved in the ⍺JM-helix and ⍺C-helix interface. (B) Heatmap sections of the ⍺JM-helix and ⍺C-helix from the MET intracellular domain (ICD) screen. (C) Distribution of alpha carbon distances for residues in the ⍺JM-helix and ⍺C-helix interface, shown for 63 MET crystal structures in the ensemble with residues modeled for positions 1058, 1062, 1066, 1121, 1125, and 1129. Distances are independent of conformation. (D) Global alignment of inactive and active RTK kinase domain structures with resolved JM regions. (E) Residue-by-residue, backbone RMSD comparisons of inactive and active structures of MET, AXL, IR, EPHA3, KIT, and RET. (F) MuscleWS alignment of human MET and TAM family juxtamembrane helix sequences. (G) Crystal structures of MET (PDB 3R7O), RON (PDB 3PLS), and AXL (PDB 5U6B) kinase domains, with ⍺JM-helix (orange) and ⍺C-helix (teal) highlighted. The inactive conformation of AXL shows an ⍺JM-helix and ⍺C-helix hydrophobic interaction similar to MET, but unlike MET, these interactions are slightly pivoted by an ⍺JM-helix turn in its active conformation.
Figure 4 with 1 supplement
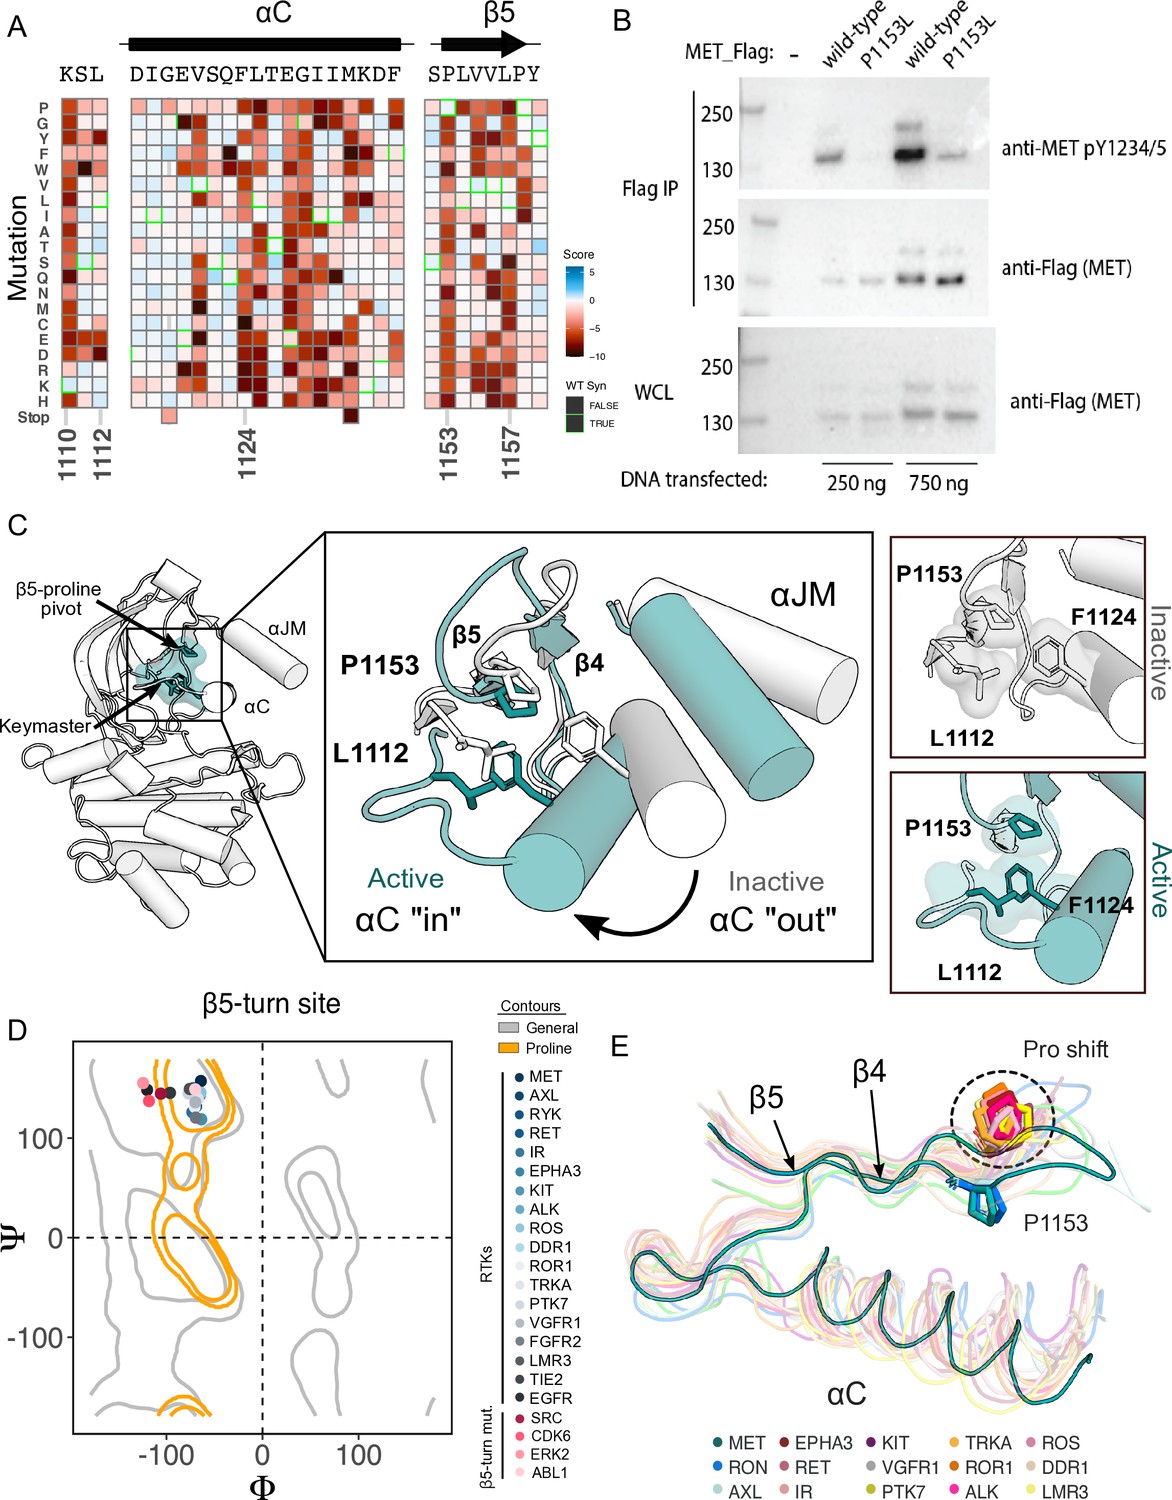
β5 Proline motif is a structural pivot for the MET kinase domain.
(A) Respective sections of the MET intracellular domain (ICD) heatmap. (B) FLAG-IP western blot of the P1153L mutation post 24 hr expression in HEK293 cells. (C) Residues of the MET P1153 N-lobe network are displayed in an active (PDB 3R7O) and inactive structure (PDB 2G15). Surface representation of residues involved in the P1153 network. (D) Ramachandran plot and structural position of P1153 in MET and one representative kinase domain of each receptor tyrosine kinas (RTK) subfamily. (E) Structural representation of the RTK Pro shift of the β4–5 loop. One representative RTK kinase domain from each sub-family is locally aligned to β4–5 of MET.
-
Figure 4—source data 1
Uncropped FLAG-IP western blot of the P1153L mutant in MET.
Original uncropped whole cell lysate (WCL) and FLAG-IP western blots comparing expression of the wild-type MET receptor to the P1153L mutant (bottom) transfected with 250 ng or 750 ng DNA input, juxtaposed next to the cropped blot (top).
- https://cdn.elifesciences.org/articles/91619/elife-91619-fig4-data1-v1.zip
-
Figure 4—source data 2
Raw unedited blots for (Figure 4).
- https://cdn.elifesciences.org/articles/91619/elife-91619-fig4-data2-v1.zip
Figure 4—figure supplement 1
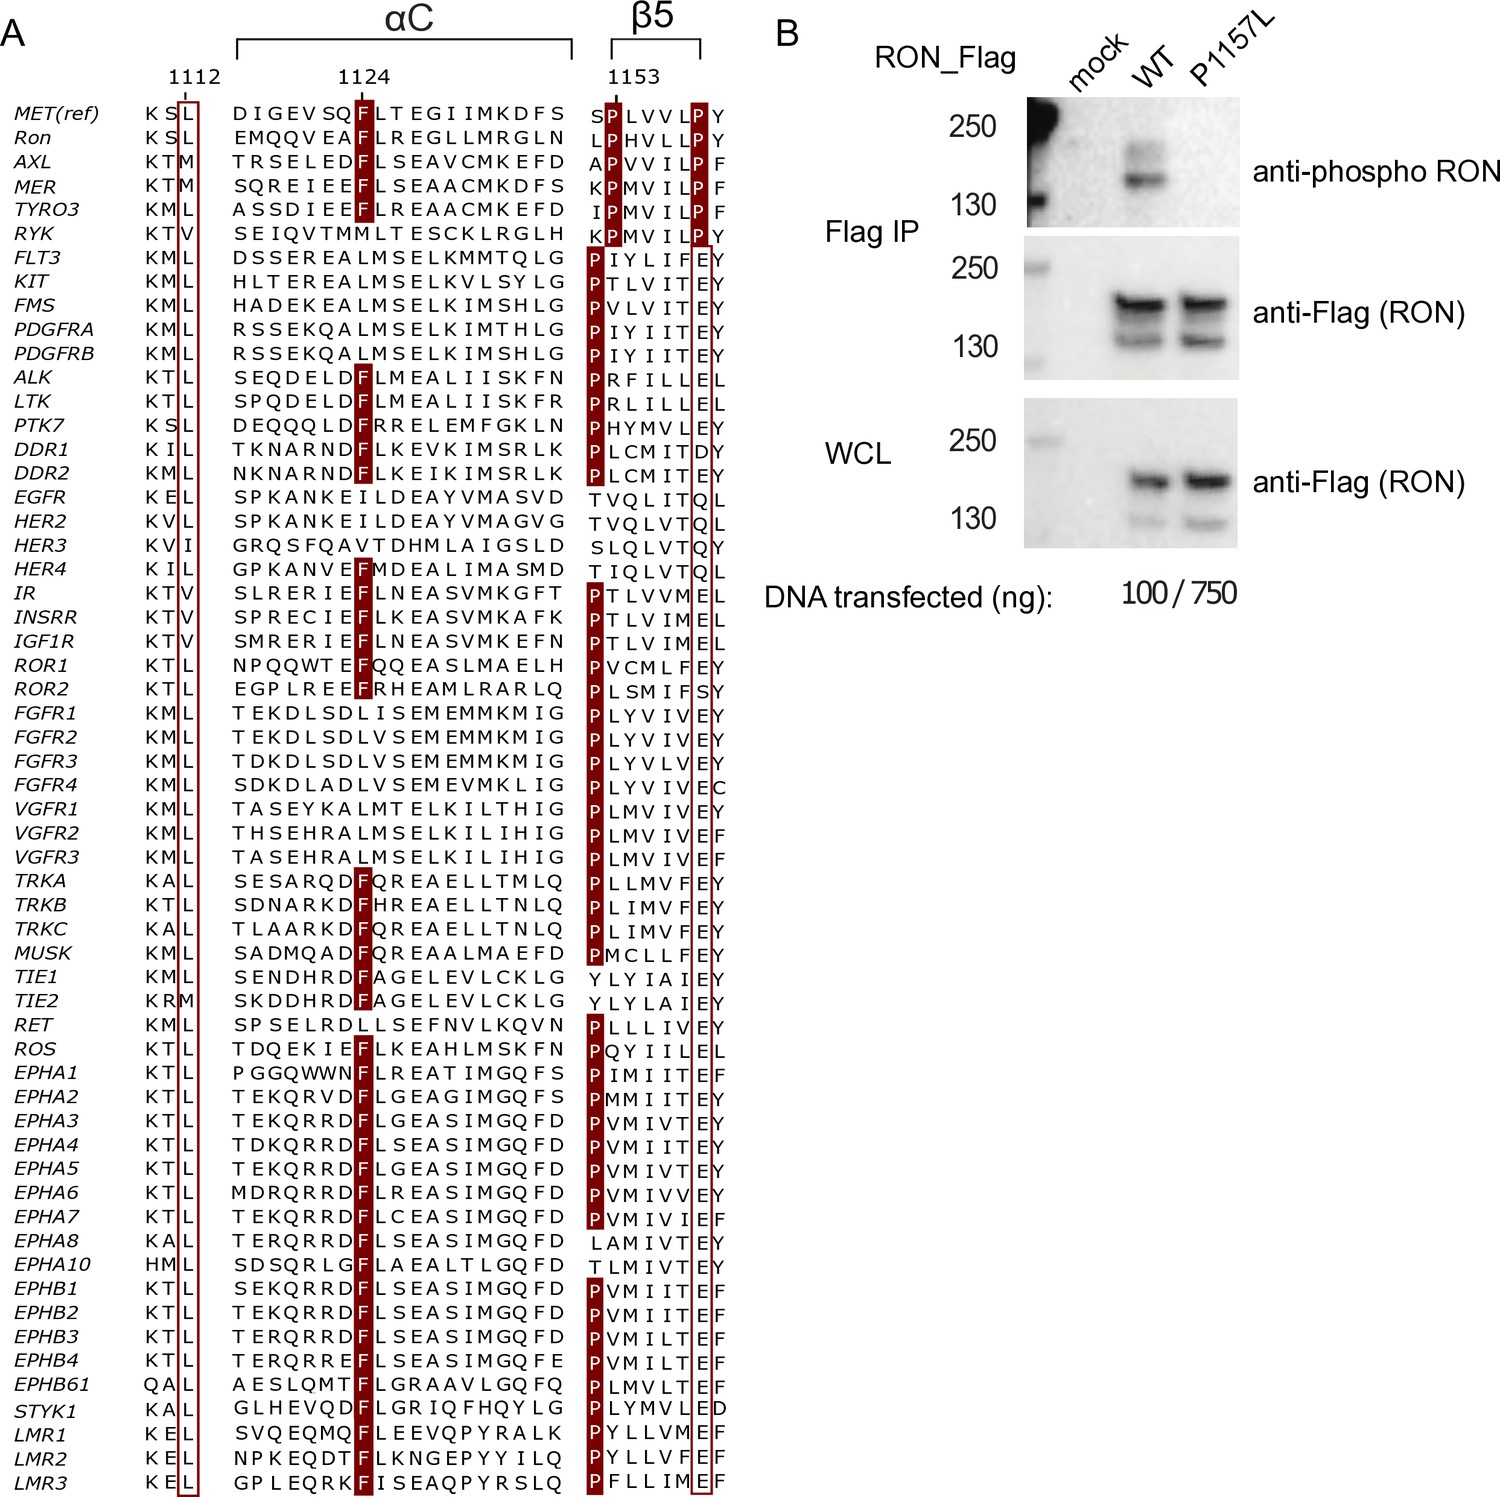
Receptor tyrosine kinase (RTK) β5-turn site sequence analysis and validation in RON.
(A) Protein sequence alignment of human RTK kinase domains with conservation highlighted for residues corresponding to MET positions 1112, 1124, 1153, and 1158. (B) FLAG-IP Western blot of RON with a P1157L mutation at the corresponding β5-turn site in the MET receptor, expressed for 24 hr in HEK293 cells with input transfection DNA concentrations for wild-type RON and P1157L constructs.
-
Figure 4—figure supplement 1—source data 1
Uncropped FLAG-IP western blot of the P1157L mutant expressed in RON.
Original uncropped whole cell lysate (WCL) and FLAG-IP western blots of the wild-type RON receptor against the P1157L RON mutant, transfected with 100 ng or 750 ng DNA input.
- https://cdn.elifesciences.org/articles/91619/elife-91619-fig4-figsupp1-data1-v1.zip
-
Figure 4—figure supplement 1—source data 2
Raw unedited blots for (Figure 4—figure supplement 1).
- https://cdn.elifesciences.org/articles/91619/elife-91619-fig4-figsupp1-data2-v1.zip
Figure 5 with 3 supplements
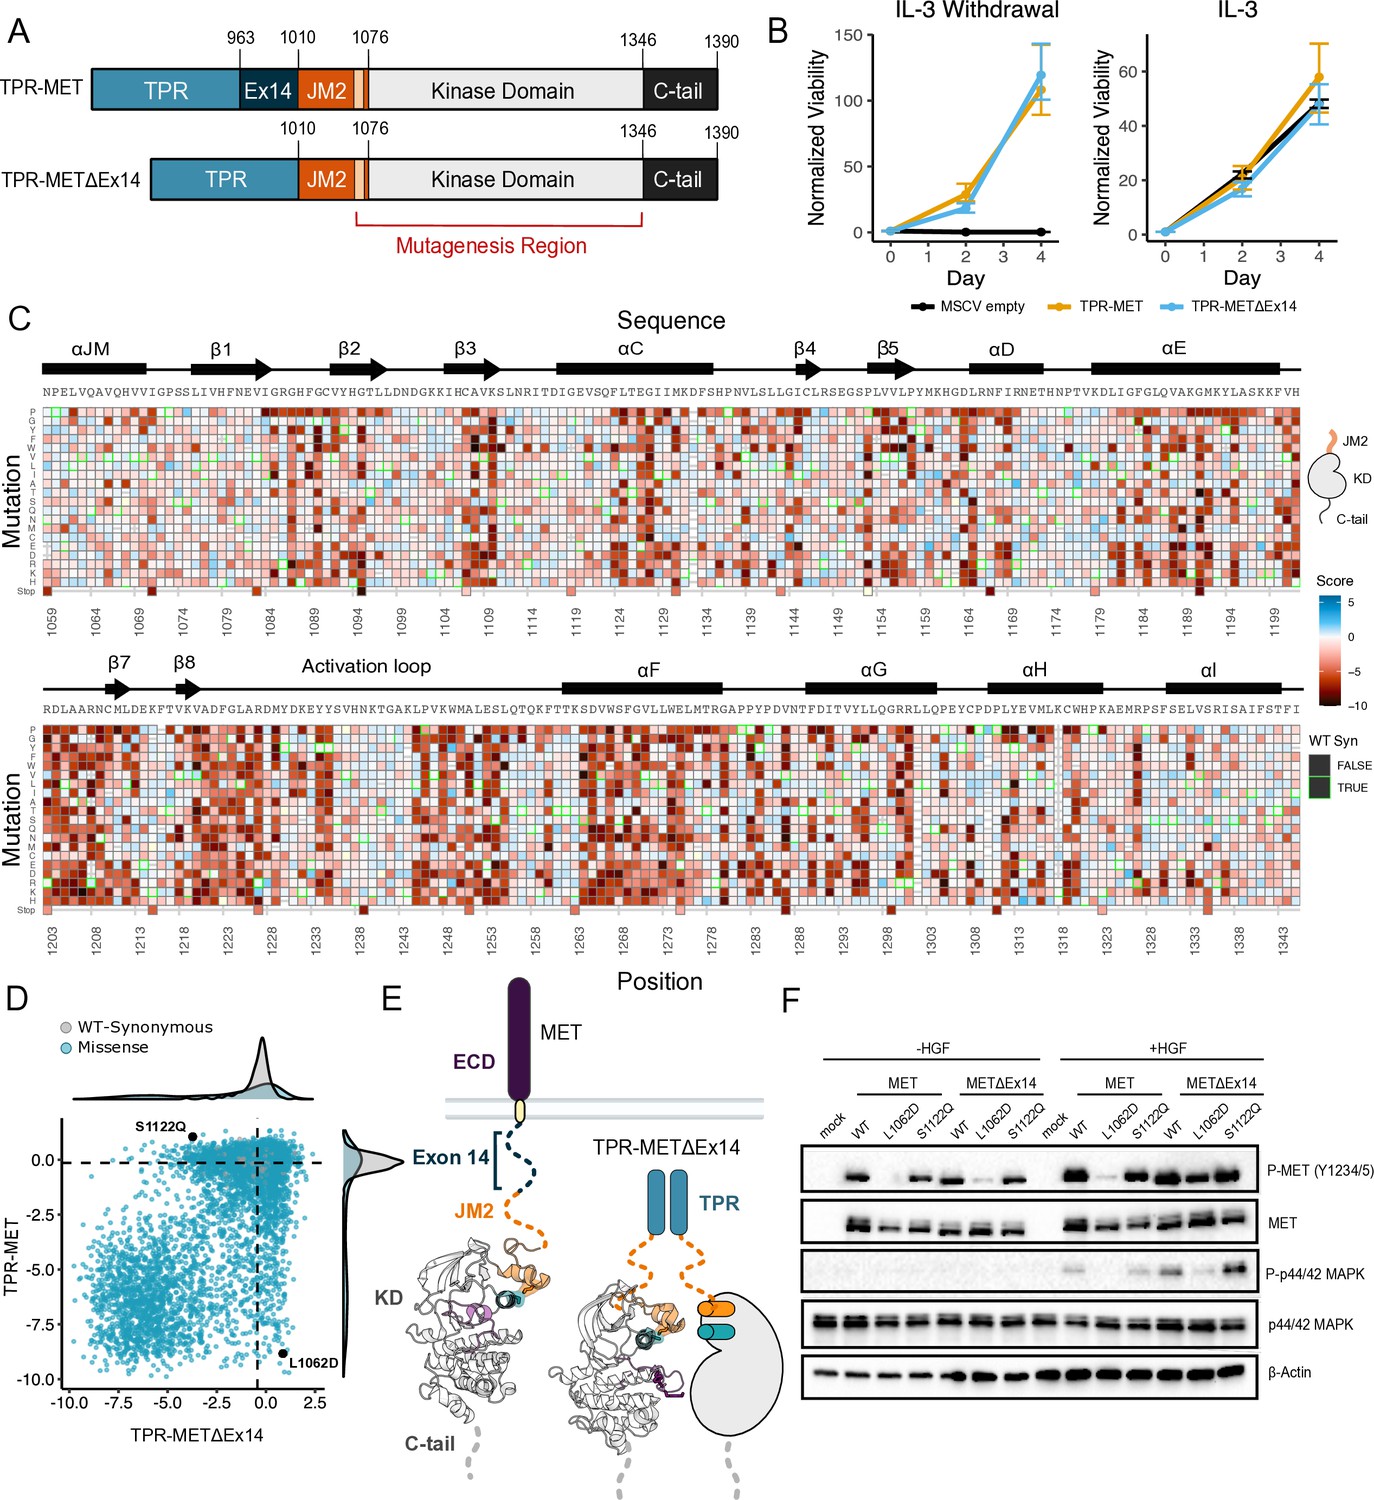
Comparative measurement of MET kinase domain variants across 287 amino acid positions in the absence (TPR-METΔEx14) and presence of exon 14 (TPR-MET).
(A) Domain boundaries and schematics of the TPR-MET ICD and TPR-METΔEx14 ICD constructs. (B) Proliferation assay of parental TPR-MET, TPR-METΔEx14, and MSCV empty vectors expressed in Ba/F3 under IL-3 withdrawal and IL-3 conditions. Cell viability was normalized to day 0 (n = 3). (C) Heatmap of METΔEx14 kinase domain variant scores. Wild-type (WT)-synonymous substitutions are outlined in green. (D) Scatter plot of TPR-METΔEx14 versus TPR-MET scores for each variant with distributions displayed on the margins. Dashed lines represent the WT synonymous average score for METΔEx14 versus MET. (E) Schematic of the kinase domain (PDB 2G15, 3R7O) in a full-length receptor and TPR-METΔEx14 context. (F) Western blot of endogenous MET KO HeLa cells transiently transfected with L1062D and S1122Q mutants in the MET and METΔEx14 receptor, with and without HGF stimulation (50 ng/ml, 15 min stimulation, 37 °C).
-
Figure 5—source data 1
Uncropped western blots and exposures for L1062D and S1122Q mutations.
(A) Side-by-side comparison of exposures for human MET knockout HeLa cells expressing an FL-MET or FL-METΔEx14 (wild-type, L1062D mutant, and S1122Q mutant) in the presence and absence of HGF (50 ng/ml, 15 min stimulation, 37 °C). (B) Uncropped western blots at varying exposures for each antibody.
- https://cdn.elifesciences.org/articles/91619/elife-91619-fig5-data1-v1.zip
-
Figure 5—source data 2
Raw unedited blots for (Figure 5).
- https://cdn.elifesciences.org/articles/91619/elife-91619-fig5-data2-v1.zip
Figure 5—figure supplement 1
Validation of the METΔEx14 saturation mutagenesis library in IL-3 and IL-3 withdrawal selections.
(A) Heatmap of TPR-METΔEx14 kinase domain variants in the IL-3 control condition that was run in parallel to the IL-3 withdrawal selection. (B) Replicate correlation analysis for both IL-3 and IL-3 withdrawal, where the mean score for each position was plotted against the replicate value. Pearson’s correlation score is reported in each respective graph. (C) Distributions of synonymous, missense, and nonsense mutations for IL-3 and IL-3 withdrawal conditions.
Figure 5—figure supplement 2
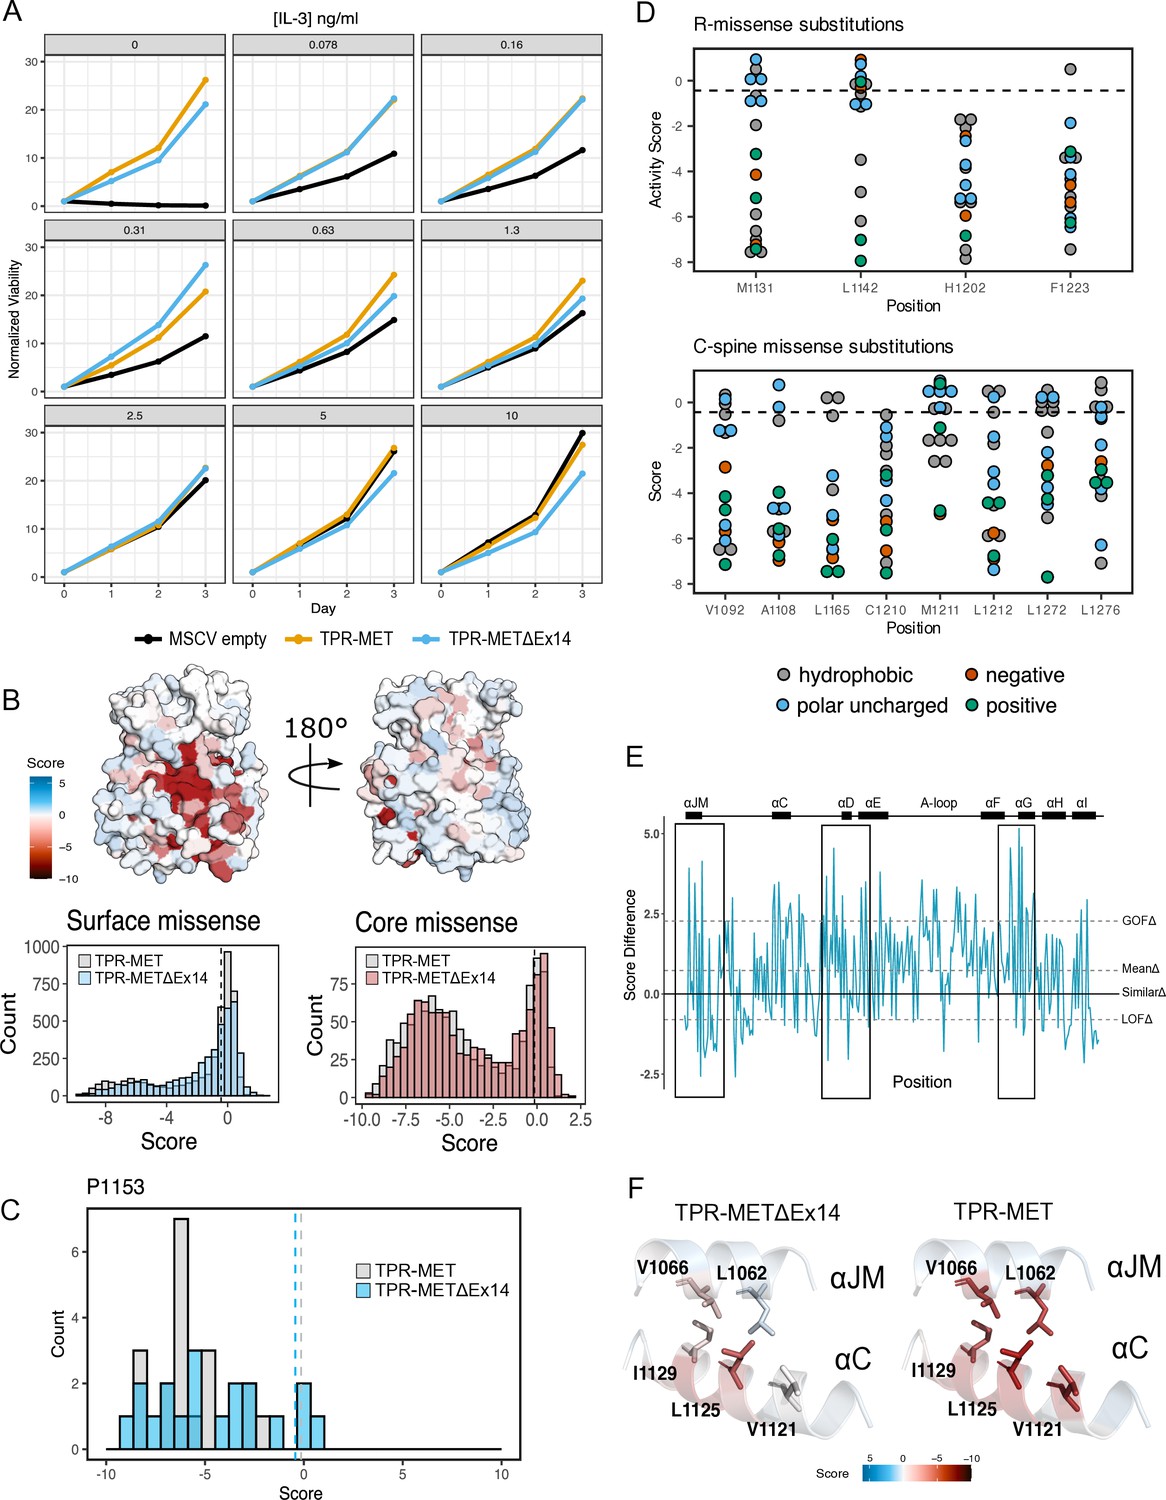
Comparative analysis of the TPR-METΔEx14 and TPR-MET mutational landscapes.
(A) IL-3 titration proliferation assay comparing Ba/F3 cells stably expressing TPR-MET, TPR-METΔEx14, and MSCV empty constructs over the course of 3 days at an IL-3 concentration range of 0, 0.078, 0.16, 0.31, 1.3, 2.5, 5, 10 ng/ml. Cell viability was normalized to day 0 for each condition. (B) Surface representation of TPR-METΔEx14 average mutational scores mapped on a TPR-MET kinase domain structure (PDB 3R7O). Synonymous and nonsense mutations were left out of the averaging and surface representation. Residues at the N- and C-term that were not screened, but modeled in the crystal structure are in white and not considered in the averaging and mapping. Comparison of surface and core residue scores distributions for TPR-METΔEx14, overlayed with the distributions for TPR-MET. A vertical dashed line in both graphs represents the mean score of WT-synonymous mutations. (C) Mutational distributions of P1153 variants for TPR-METΔEx14 (blue) and MET (gray). Dashed lines represent the mean of the WT-synonymous distribution for each library. (D) Mutation scores and physiochemistry of variants are shown for each residue position of the R- and C- spine of TPR-METΔEx14. (E) Mean difference plot for TPR-METΔEx14 and TPR-MET at each screened position. (E) Average score of mutations at the hydrophobic interface of ⍺JM and ⍺C for both TPR-METΔEx14 and TPR-MET.
Figure 5—figure supplement 3
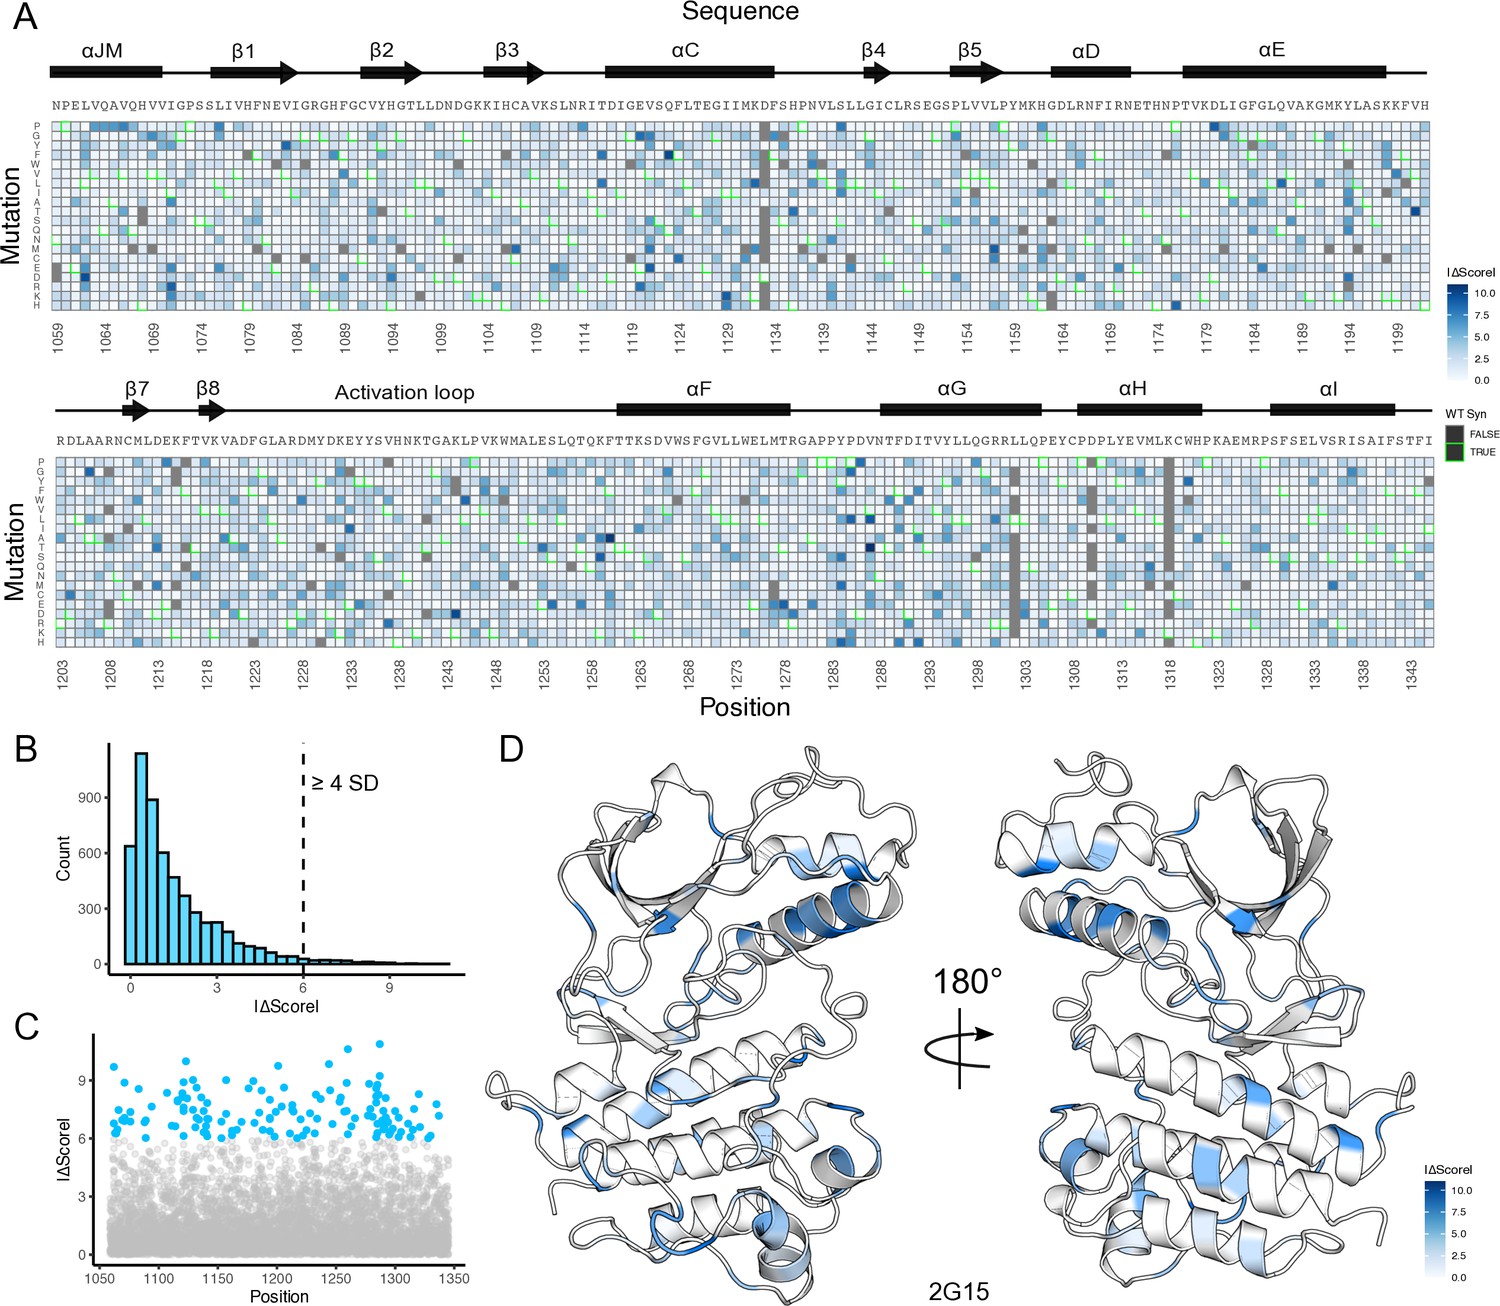
Landscape of fitness and gain-of-function mutational differences between METΔEx14 and MET kinase domain libraries.
(A) Heatmap showing the absolute difference between TPR-METΔEx14 and TPR-MET kinase domain mutation fitness scores. Mutations missing values for either one or both libraries are denoted in gray. (B) Distribution of the absolute score difference (|ΔScore|) between TPR-METΔEx14 and TPR-MET with a dashed line at the boundary for score differences above or equal to 4 standard deviations (SD) from the average |ΔScore|. (C–D) Scatter plot of all fitness score differences, with the specific mutations above a difference of four SD highlighted in blue, and further structurally mapped on a representative structure (PDB 2G15).
Figure 6 with 3 supplements
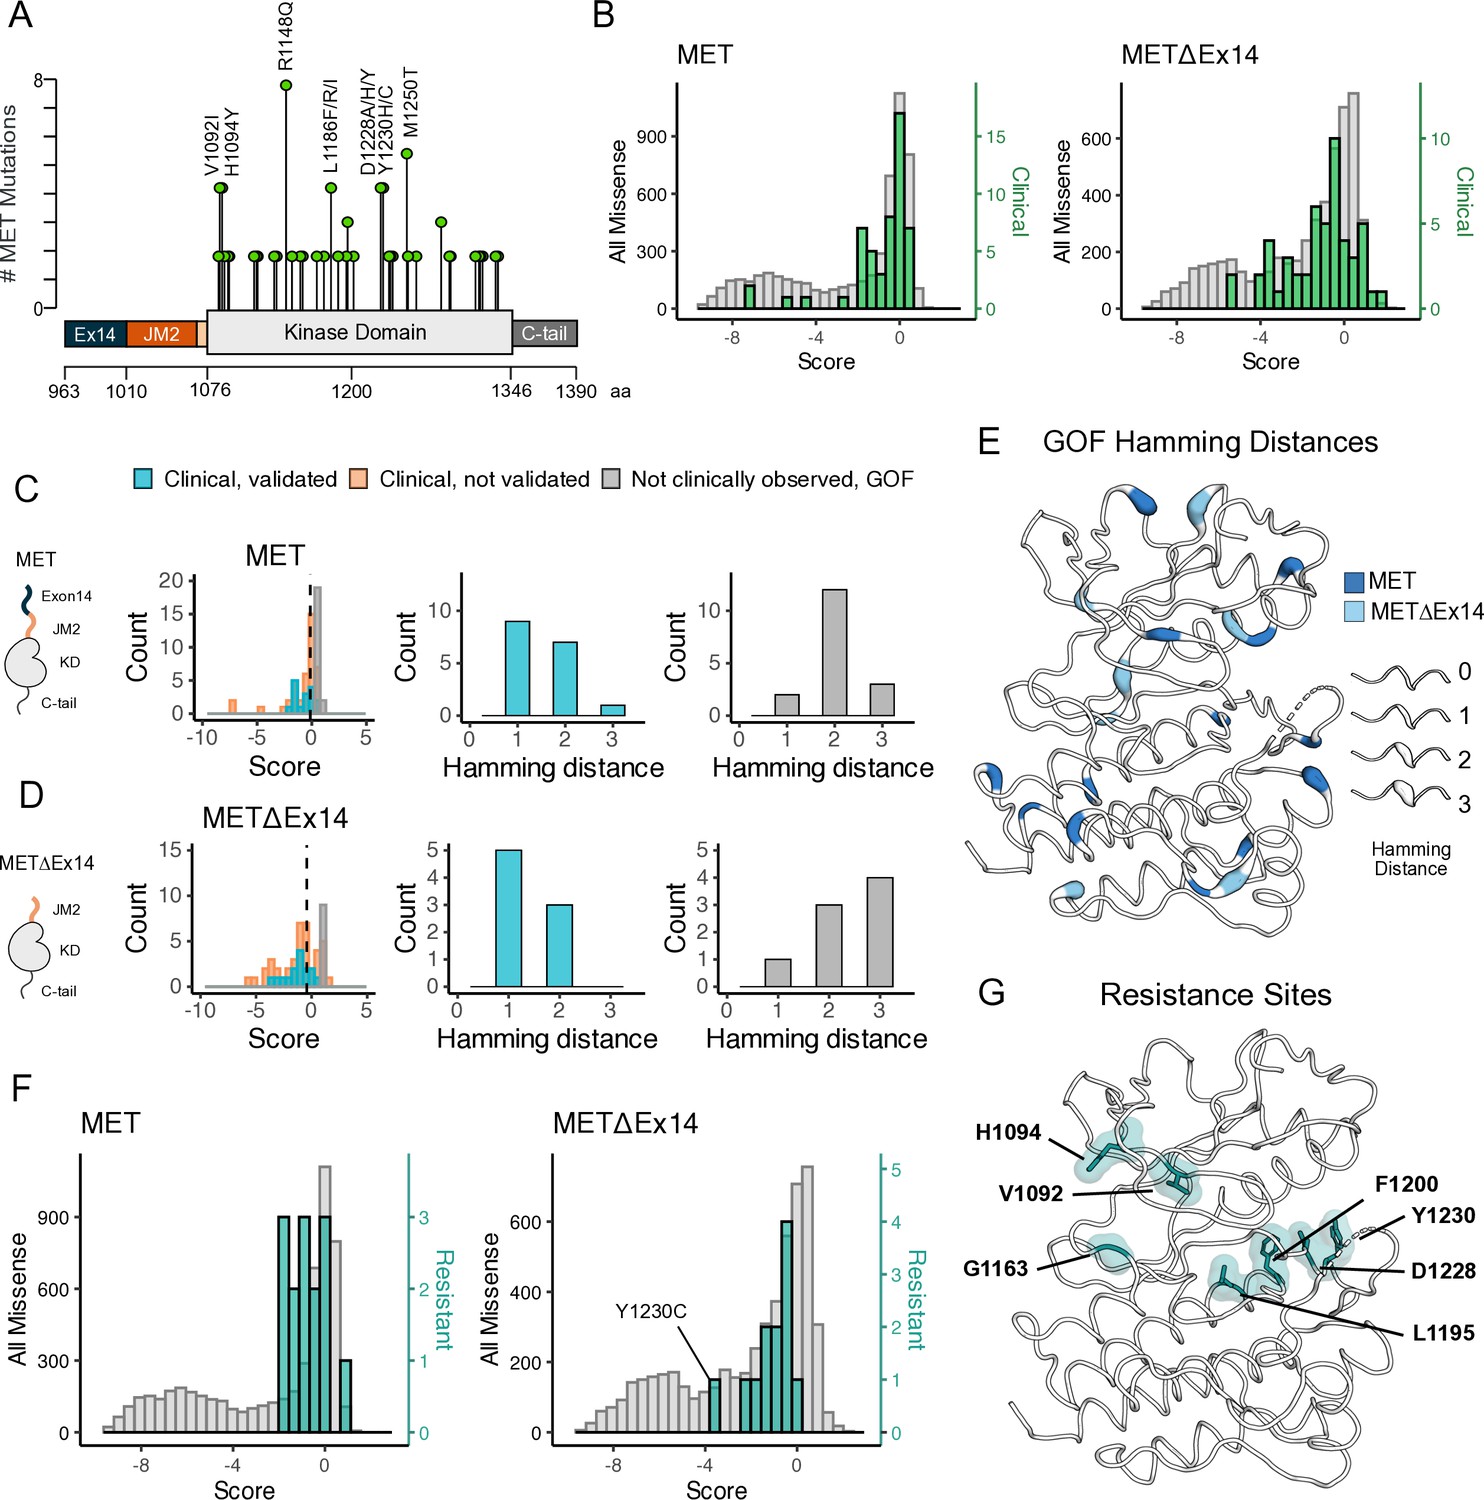
Mutations with greater proliferative effects than cancer-associated mutations, and differential sensitivities between MET and METΔEx14 identified.
(A) Lollipop diagram of MET kinase domain mutations and frequencies annotated in cBioPortal. (B) Distributions of clinically-associated mutations (green, right y-axis scale) overlaid with all missense mutations (gray, left y-axis scale). (C–D) Distributions of categorized cancer-associated mutations. Hamming distance distributions of clinical, validated MET cancer mutations and clinically unobserved, gain-of-function (GOF) mutations detected in the screen for both intracellular domain (ICD) backgrounds. (E) Cancer-associated mutations mapped onto a MET kinase domain structure, colored according to MET and METΔEx14 backgrounds, with Hamming distance represented by the ribbon thickness at each position (PDB 3R7O). (F) Reported resistance mutation distributions (teal, right y-axis scale) for MET and METΔEx14, overlaid with their respective missense distributions (gray, left y-axis scale). (G) Inhibitor resistance mutation positions shown on an active MET kinase domain structure in teal (PDB 3R7O).
Figure 6—figure supplement 1
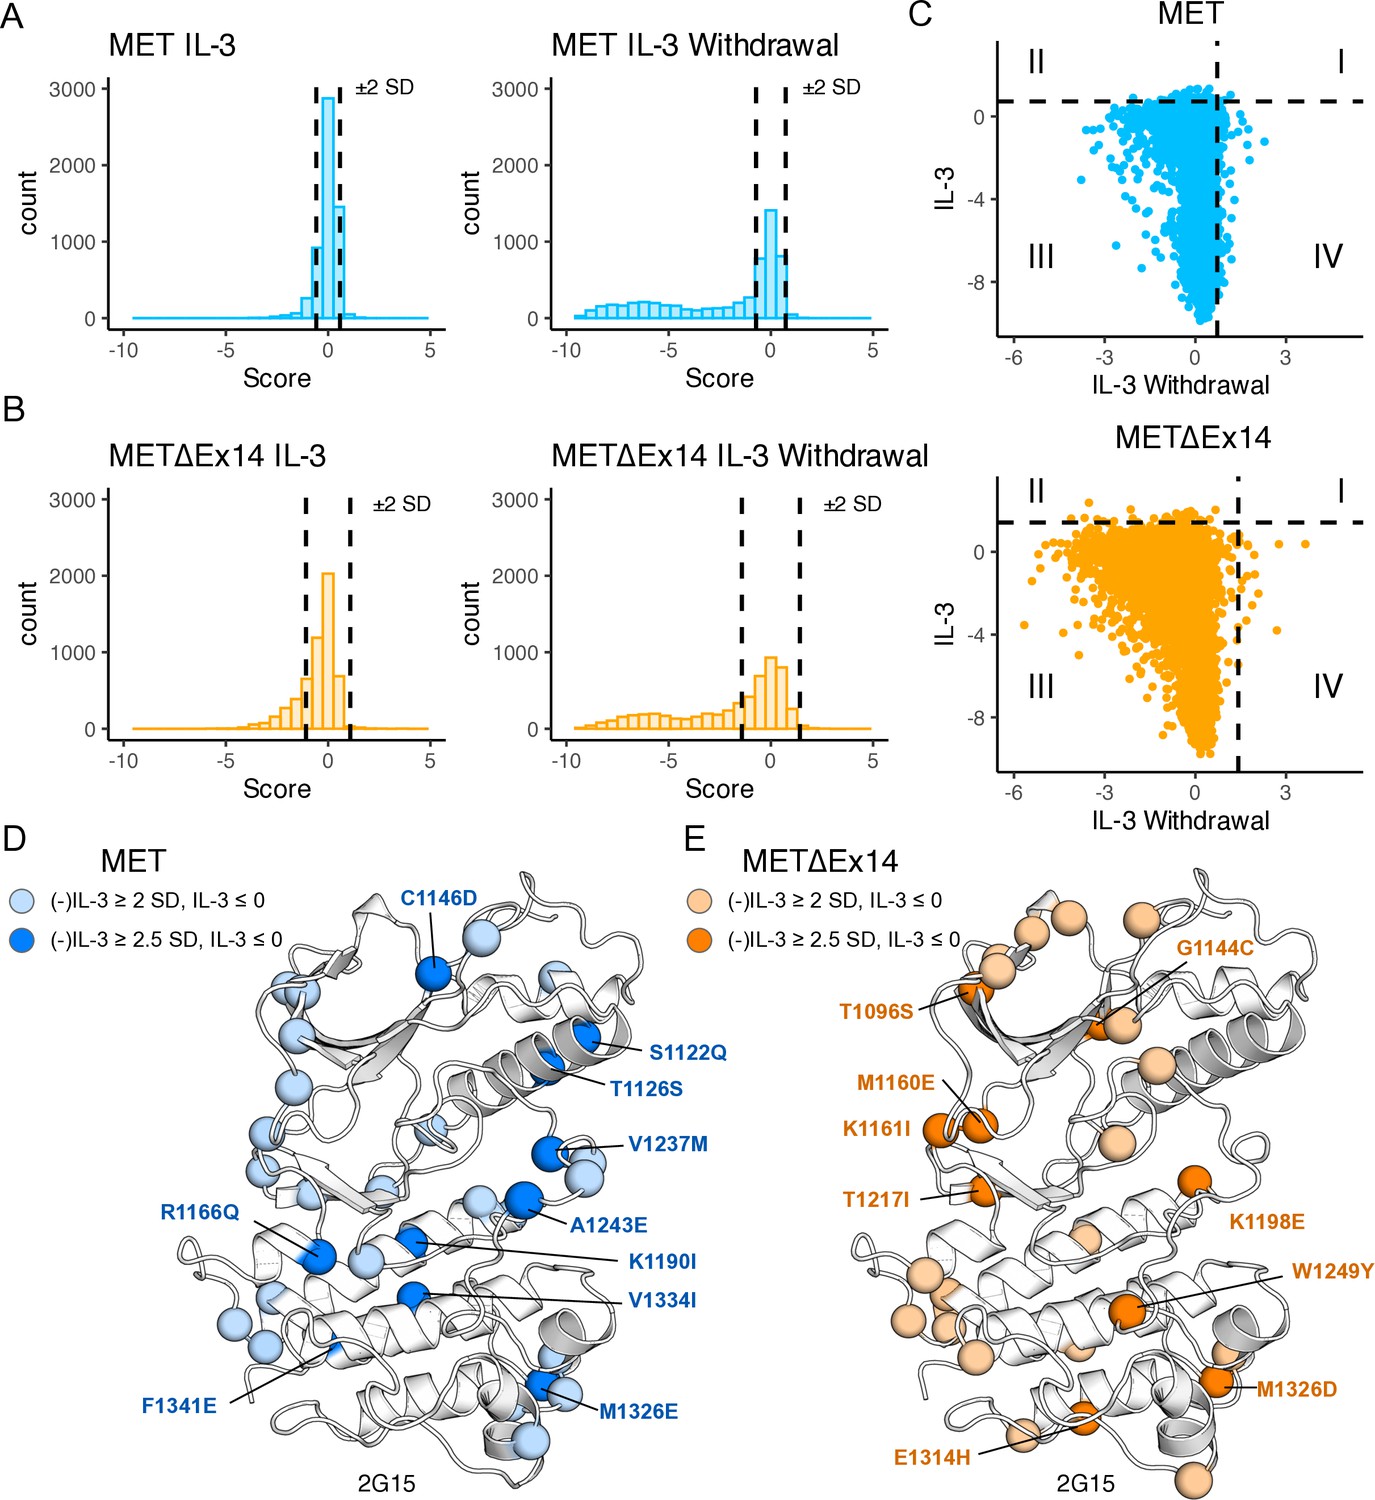
Statistical analysis and classification of gain-of-function mutations across libraries.
(A–B) Distribution of all mutations for TPR-MET and TPR-METΔEx14 kinase domain libraries with vertical dashed lines showing the ±2 SD threshold from the wild-type synonymous average. Mutations with fitness scores outside of these boundaries pass the initial filter for classification as gain-of-function (GOF) or loss-of-function (LOF). (C) Fitness score scatterplots for mutations under IL-3 withdrawal selection versus IL-3 maintenance for the TPR-MET and TPR-METΔEx14 kinase domain, with the +2 SD threshold displayed as a dashed line for both conditions, splitting the plot into four quadrants. Data points within quadrant IV are representative of mutations that have high fitness under IL-3 withdrawal selective pressure, that are otherwise null or loss-of-function in the absence of selection. (D–E) Statistically filtered mutations with high fitness scores mapped onto a representative structure (PDB 2G15). Here mutations were filtered and mapped if the IL-3 withdrawal score ‘(-)IL-3’ was ≥+2 or +2.5 SD from the average wild-type synonymous score, in the absence of selection the ‘IL-3’ fitness score was ≤0, and that the propagated error between the (-)IL-3 and IL-3 scores was less than their difference.
Figure 6—figure supplement 2
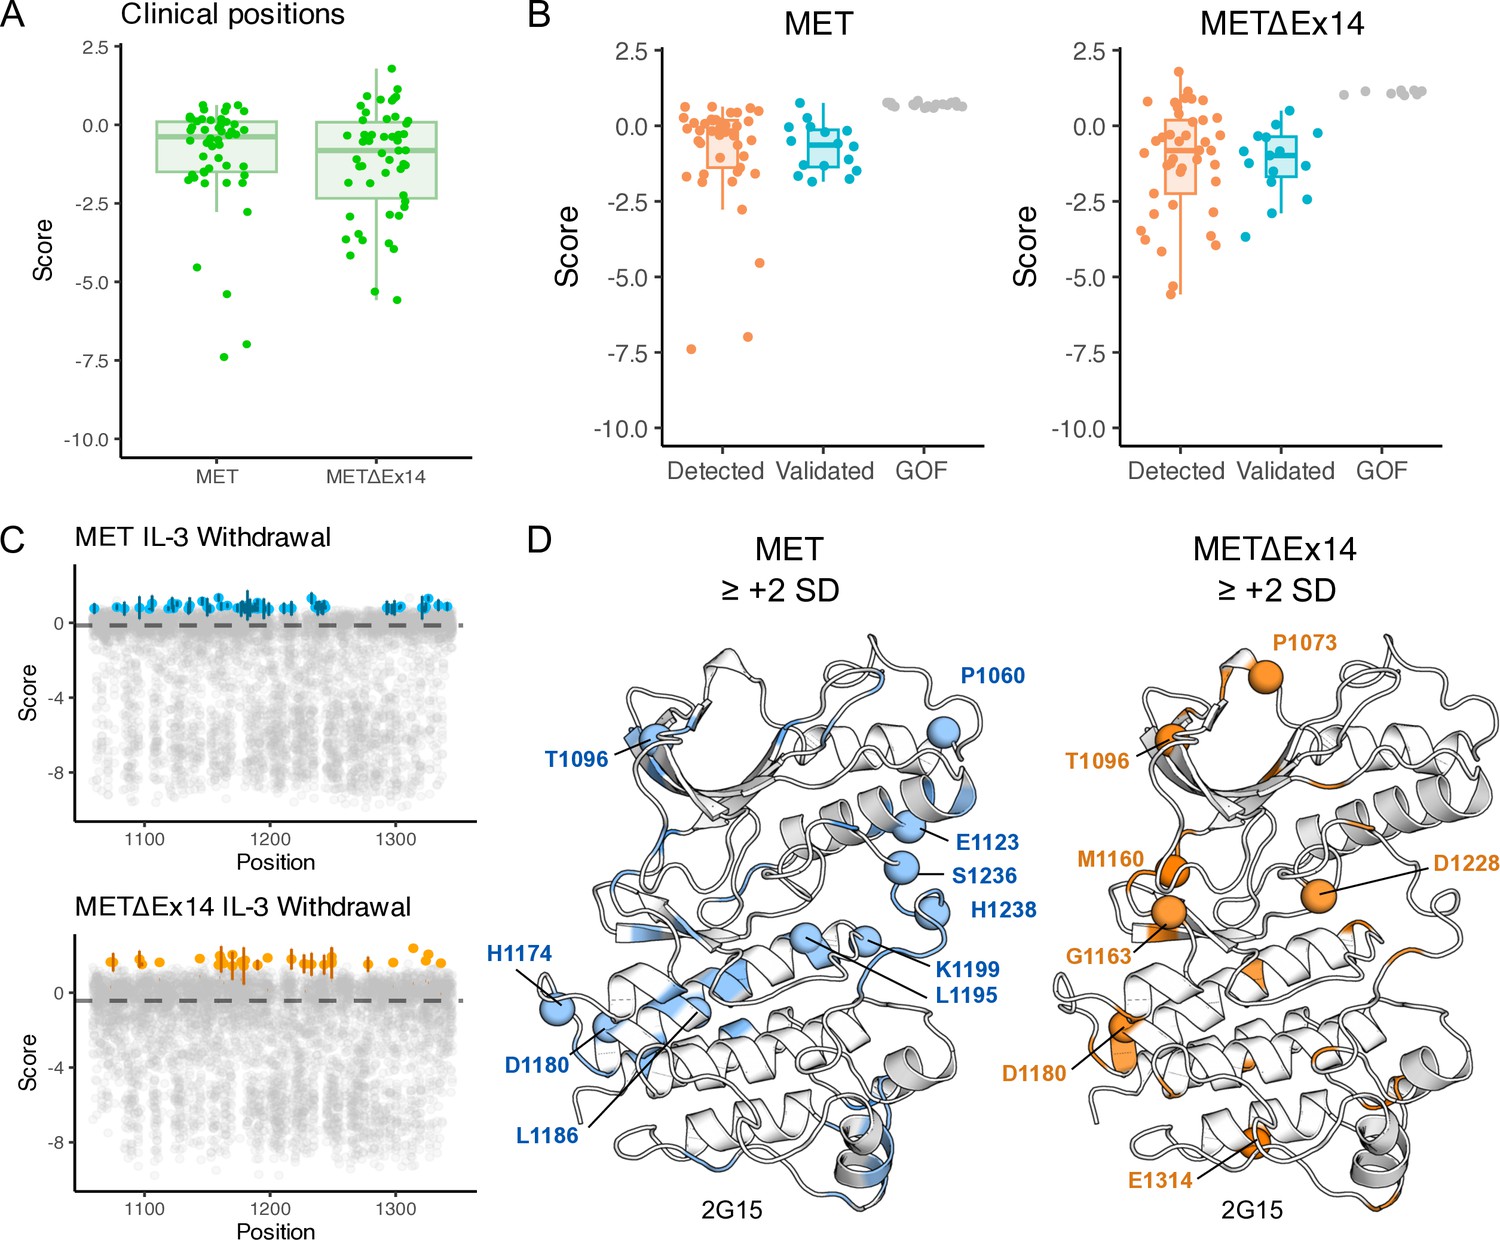
Identification and analysis of clinically associated mutations across MET kinase domain libraries.
(A–B) Box plots showing the distribution of mutations and fitness scores at clinically-associated residue positions annotated in cBioPortal, and further categorized based on level of literature validation (clinically detected but not validated, validated, gain-of-function (GOF) within our screen but not clinically detected). (C) Scatter plots showing the fitness scores for each mutation per kinase domain position under IL-3 withdrawal selection for TPR-MET and TPR-METΔEx14, with the average fitness scores of the wild-type synonymous population of each displayed in a dashed line. Specific mutations that are ≥+2 standard deviations (SD) from the wild-type synonymous mean are highlighted with standard error displayed (TPR-MET, blue; TPR-METΔEx14, orange; n = 3). (D) Structurally mapped mutations with fitness scores ≥+2 SD form the respective wild-type synonymous mean for TPR-MET and TPR-METΔEx14, with clinically-associated mutations highlighted as spheres (PDB 2G15).
Figure 6—figure supplement 3
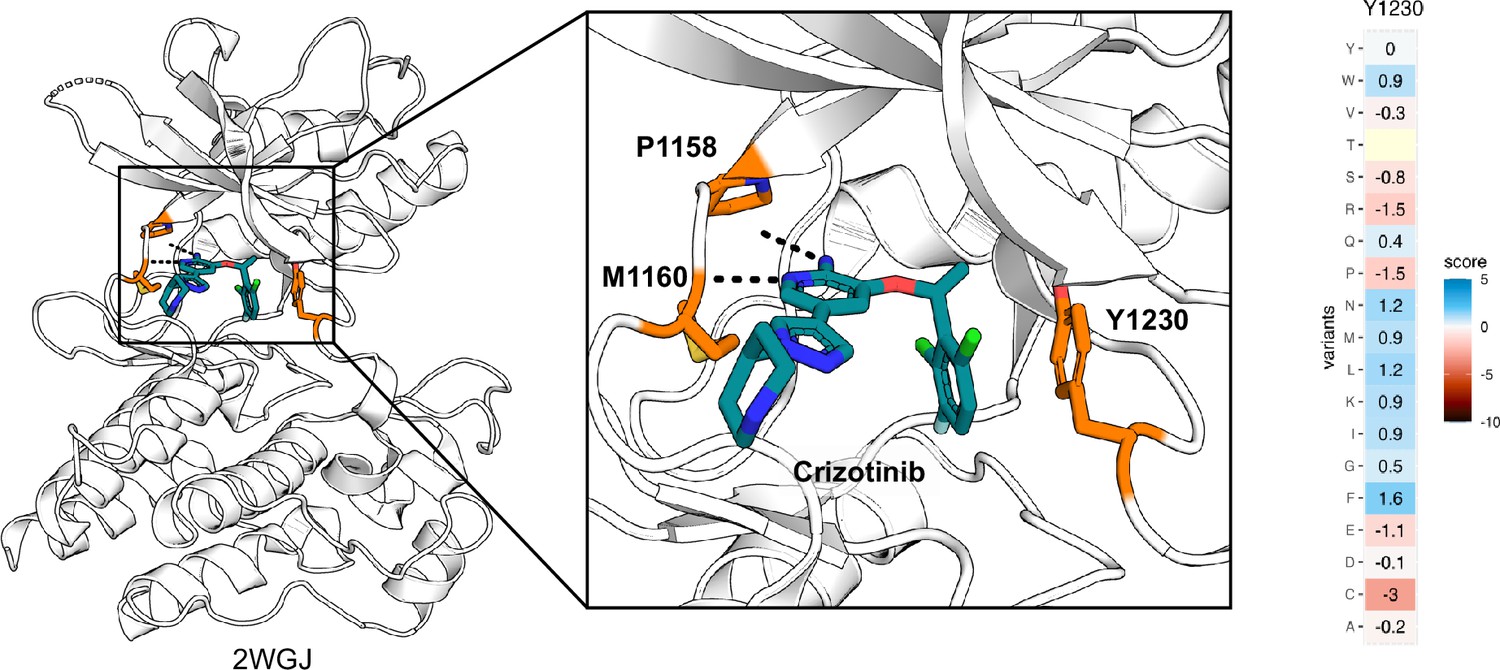
Inhibitor-protein interactions for Y1230 and crizotinib.
Crizotinib-bound MET kinase domain (2WGJ) illustrates the inhibitor-protein interactions at the active site with the loss-of-function Y1230 position annotated. Heatmap for Y1230 in METΔEx14 showing missense scores subtracted from wild-type (WT) synonymous.
Additional files
Download links
A two-part list of links to download the article, or parts of the article, in various formats.
Downloads (link to download the article as PDF)
Open citations (links to open the citations from this article in various online reference manager services)
Cite this article (links to download the citations from this article in formats compatible with various reference manager tools)
Conserved regulatory motifs in the juxtamembrane domain and kinase N-lobe revealed through deep mutational scanning of the MET receptor tyrosine kinase domain
eLife 12:RP91619.
https://doi.org/10.7554/eLife.91619.3


