Modeling apical and basal tree contribution to orientation selectivity in a mouse primary visual cortex layer 2/3 pyramidal cell
- Department of Biology, University of Crete, Greece
- IMBB, FORTH, Greece
- Department of Neurology, Brigham and Women’s Hospital and Jamaica Plain Veterans Administration Hospital, Harvard Medical School, United States
Figures
Figure 1 with 1 supplement
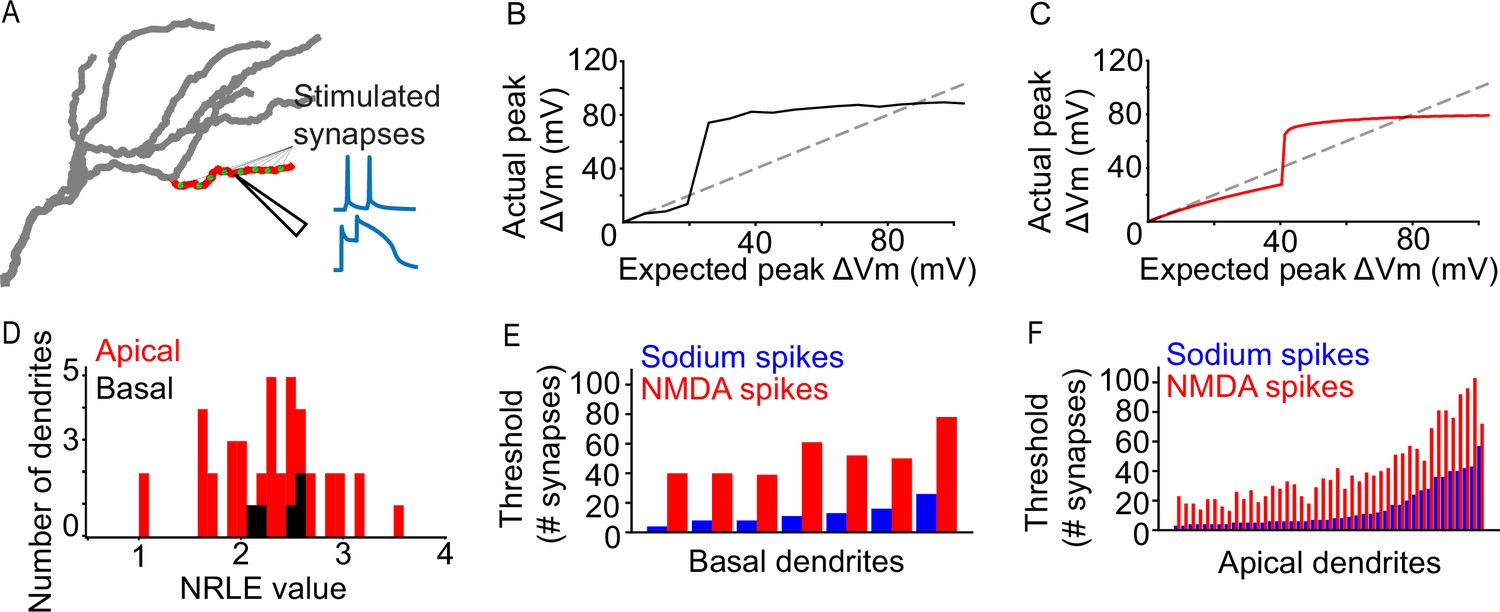
Dendritic properties of a L2/3 V1 neuron model.
(A) Graphical representation of the iterative paired-pulse protocol. Green dots represent allocated synapses. Synapses were activated only within the designated (red) dendritic segment, with all other segments being passive. We record the voltage response of the dendritic segment with NMDA channels disabled or enabled, acquiring information on dendritic sodium and NMDA spikes, respectively. (B) Example of an ‘expected vs. actual plot’, showing the response produced by a single basal dendritic segment (solid black line) as a result of voltage-gated sodium channel activity elicited through simultaneous activation of 1–200 AMPA synapses. The dashed black line indicates the expected dendritic response assuming a linear dendrite. (C) Same as B, but for an apical dendritic segment. (D) NRLE value histogram for all apical (red) and basal (black) dendritic segments. (E) Bar plot of per-dendrite nonlinearity thresholds for all basal dendritic segments, sorted by the sodium spike thresholds. Note that NMDA spike thresholds largely follow the sodium spike threshold increase. (F) As E, for all apical dendritic segments.
Figure 1—figure supplement 1
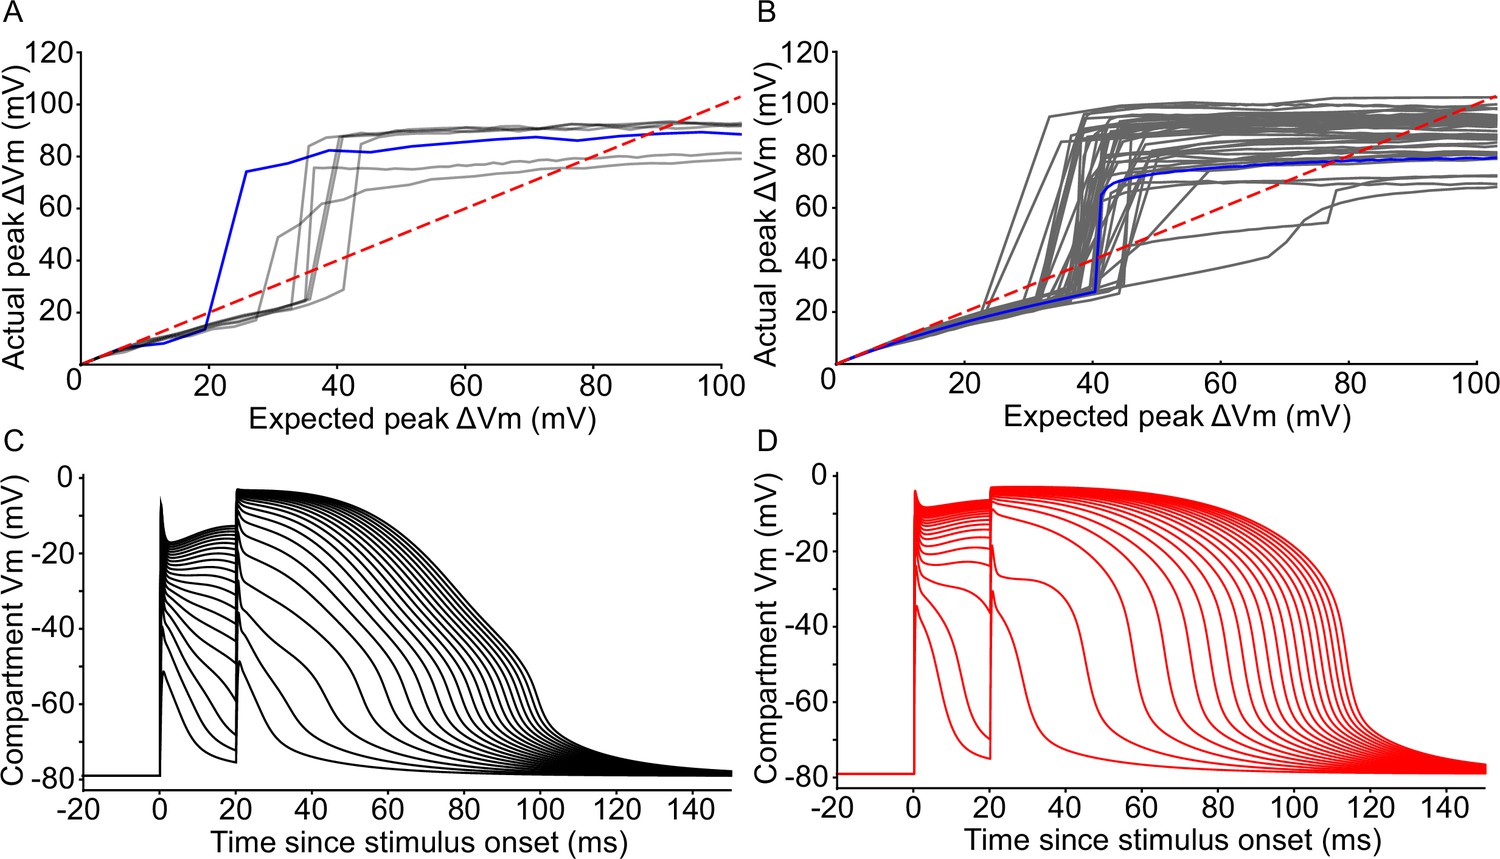
Visualization of dendritic non-linear properties.
(A) Expected vs Actual plot for all basal dendrites undergoing the I3P protocol for 1–200 synapses. Blue line represents the dendrite in Figure 1B (basal dendrite #0). (B) Same as A, but for all apical dendrites. Blue line represents dendrite in Figure 1C (apical dendrite #0). (C) Example traces from the I3P protocol for NMDA spike generation from basal dendrite #0. Traces are 10 synapses apart from each other. (D) Same as C, but for apical dendrite #42 (oblique branch). Dendrites in C and D chosen to show examples of NMDA spiking.
Figure 2 with 5 supplements
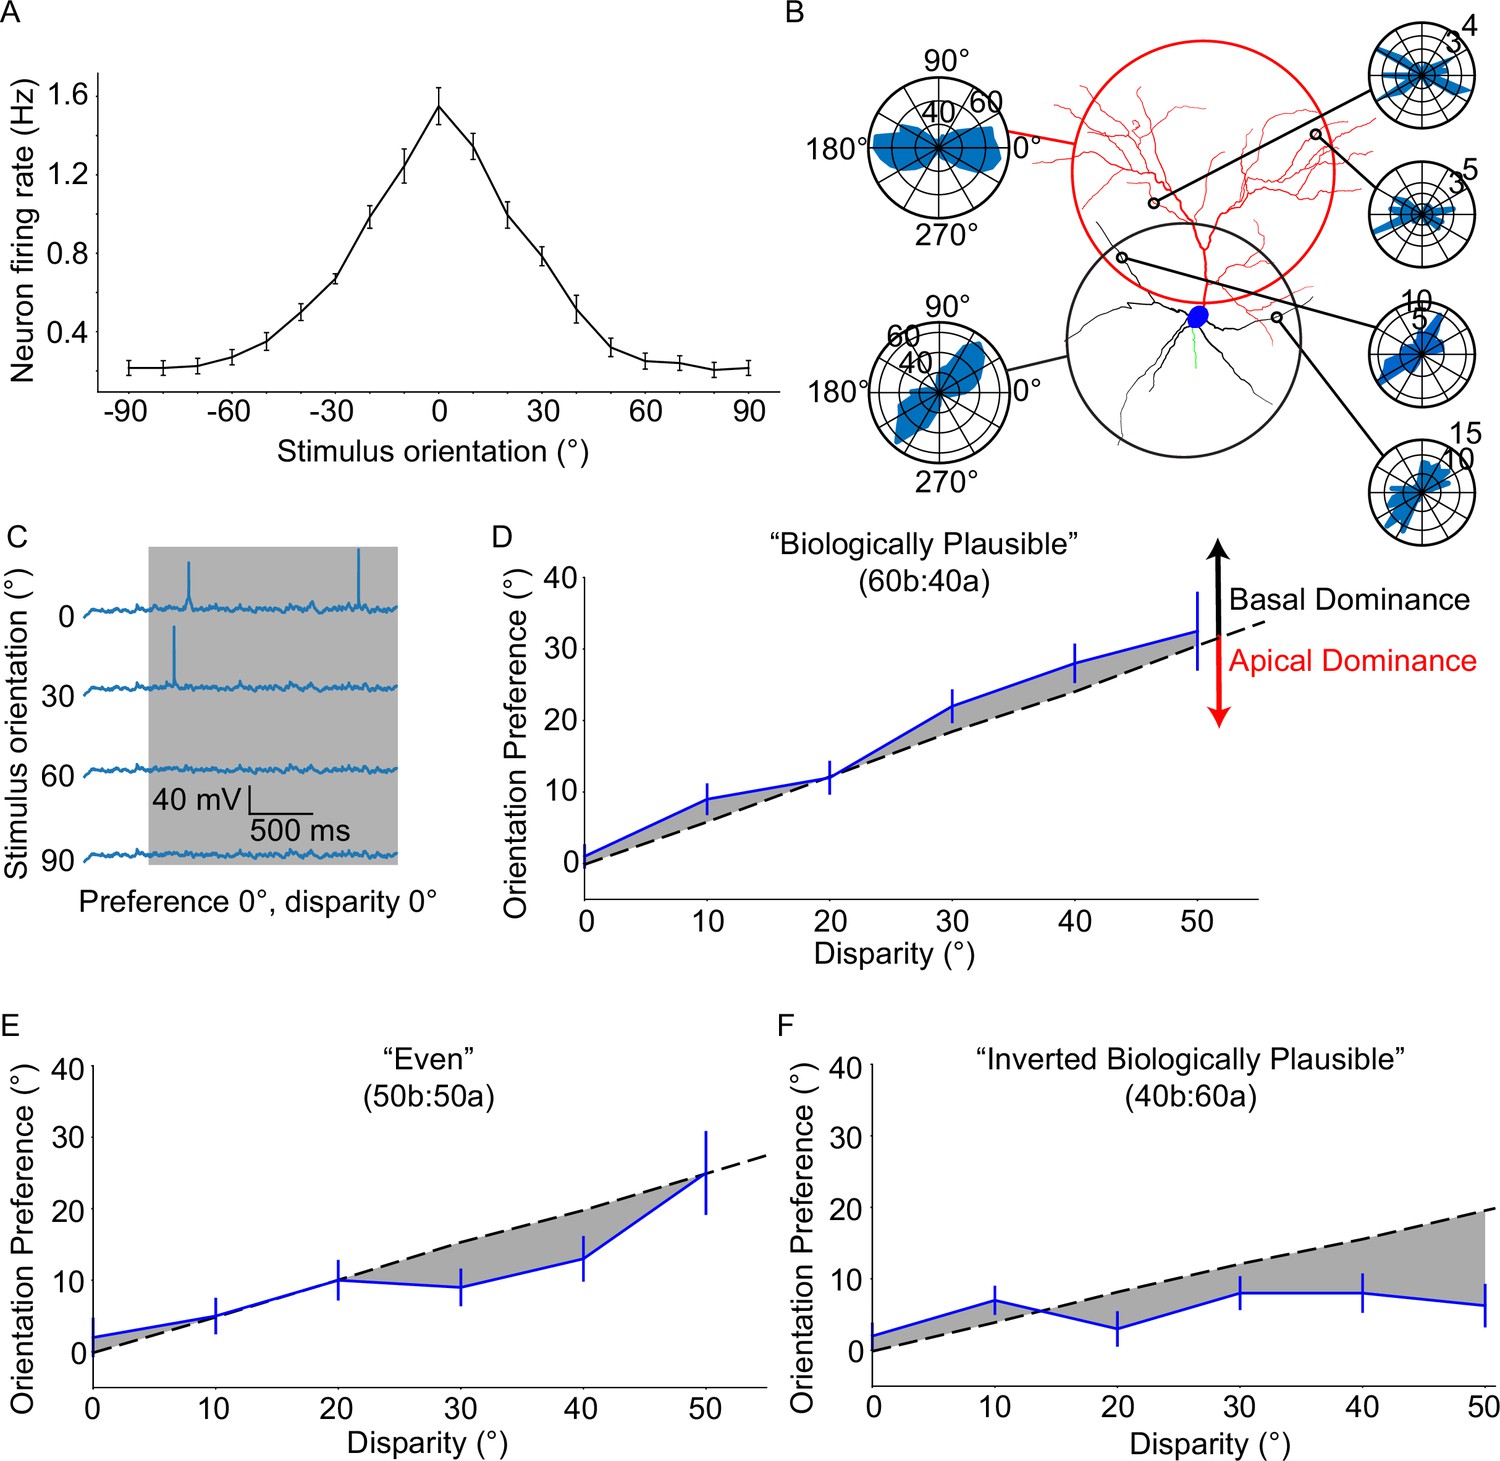
Neuronal orientation preference is robust and resists dendritic tuning disparity.
(A) Orientation tuning curve for the ‘biologically plausible’ model. (B) Example from a configuration of a model neuron set to a disparity of 40°. Right-side polar plots display the distribution of synaptic orientation preferences for the indicated dendritic segments. Left-side polar plots display the distribution of synaptic orientation preferences for the apical (top) and basal (bottom) dendritic trees. (C) Example voltage traces recorded at the soma of a model neuron from (A) Note the clearly different responses between the preferred orientation (0°) and all others. (D) Orientation preference plot for the ‘biologically plausible’ model featuring various degrees of disparity. Grey dashed line denotes the expected orientation preference per degree of disparity. Black and red arrows point in the direction of basal and apical dominance, respectively. (E) As D, but for the ‘even’ model. Note that dominance has shifted from the basal domain towards the apical domain. (F) As D, but for the ‘inverted biologically plausible’ model. This configuration clearly features apical dominance. Error bars: Standard error of the mean, for all panels.
Figure 2—figure supplement 1
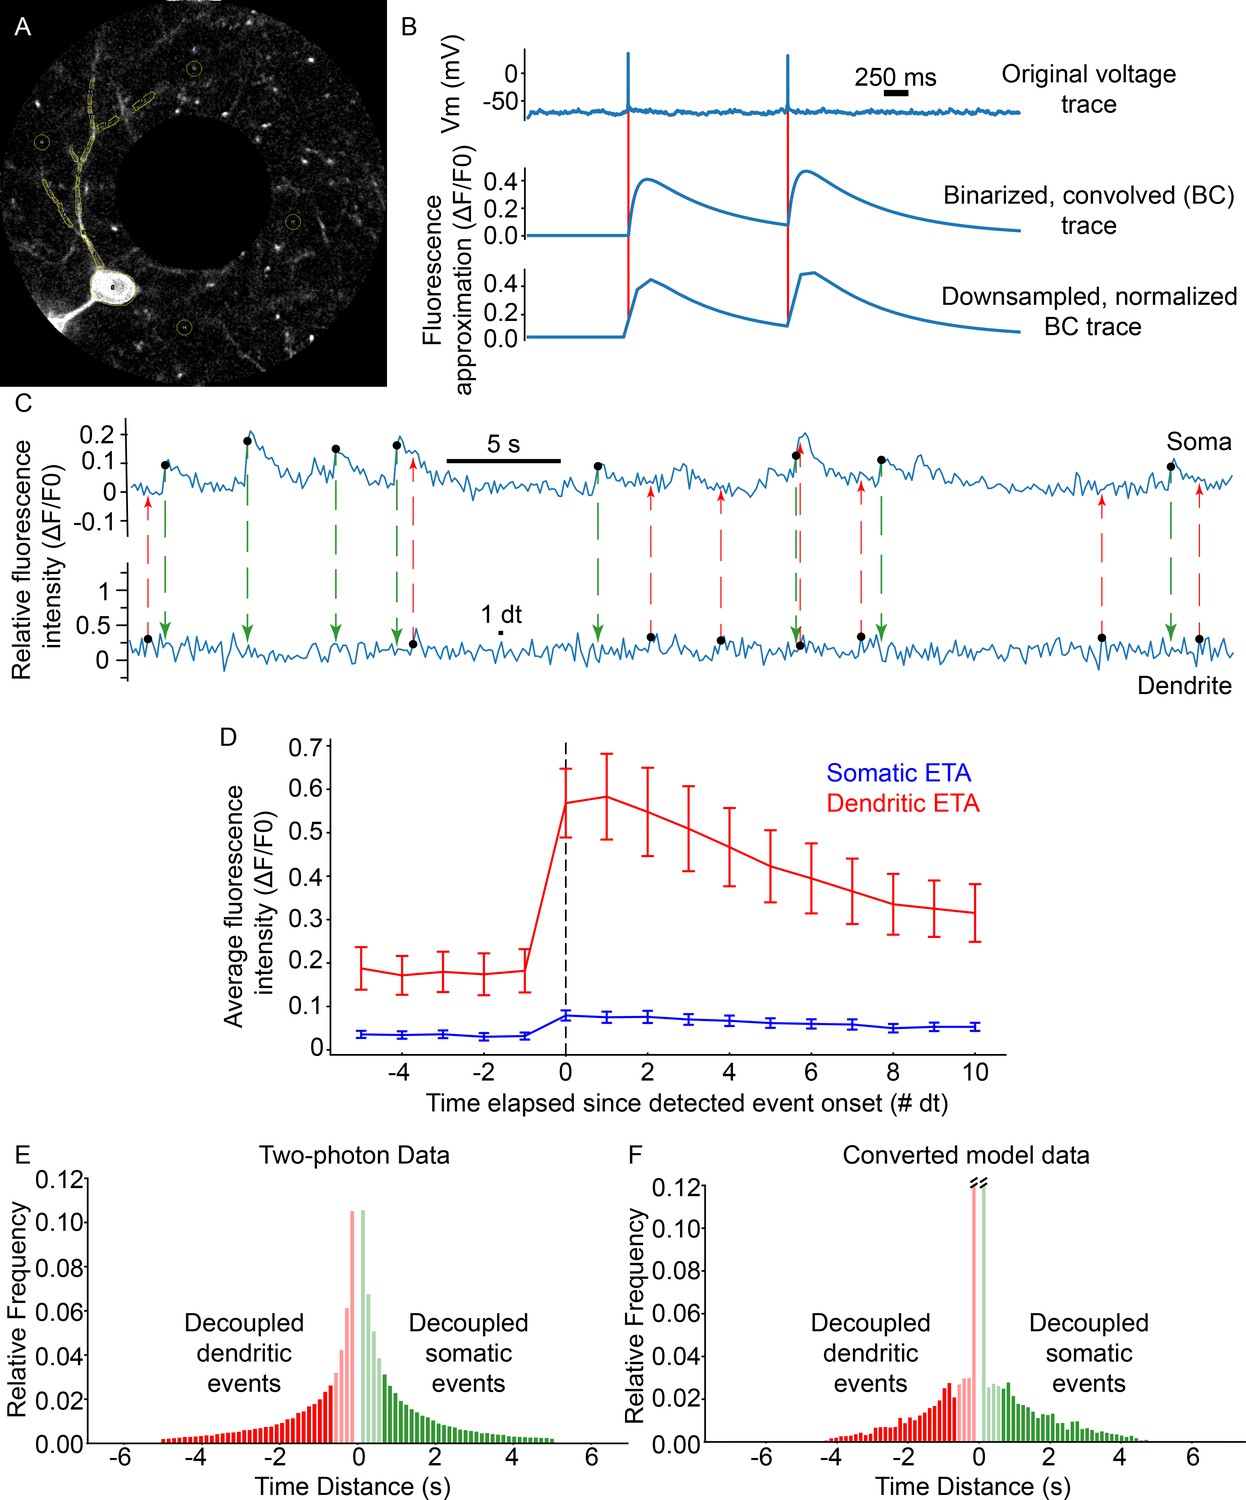
Comparing model output with two-photon imaging data.
Simultaneous recordings from basal dendritic segments and somata of L2/3 V1 pyramidal neurons were performed in anesthetized mice (spontaneous activity of 11 neurons from 2 mice, see Extended methods, Data analysis; panel A). These imaging data were compared to modeling data generated using the spontaneous activity protocol, whereby simulations feature only background activity, that is noise, in the absence of a visual stimulus (see Extended methods, Spontaneous activity protocol). (A) Image from one of the neurons in the dataset. Note the separate, multiple ROIs per dendritic segment, as well as the four circular ROIs used for background fluorescence calculation. (B) Example traces from the model data conversion pipeline. Voltage spiking data is binarized and convolved with a GcaMP6s kernel function (Figure 2—figure supplement 2). Resulting data is downsampled to two-photon sampling rates (~7.25 Hz) from the original sampling rate (10 KHz), and processed exactly like in vivo two-photon fluorescence data. Red vertical lines show the timing of the original spikes. (C) Example somatic (top) and distal dendritic (bottom) ΔF/F0 traces from the neuron in (A) Black dots at the origin of colored dashed lines denote detected events. Note that somatic events (green dashed lines/arrows) are not necessarily coincident with dendritic events (red dashed lines/arrows). (D) Event-triggered averages for all somatic (blue) and basal dendritic segment ROIs (1 dt ≃ 0.138 s; error bars: Standard error of the mean). (E) Event pair timing difference histogram for the two-photon data. A total of 48.12% of event pairs feature basal dendritic events that are decoupled from the soma (red; dendritic events occur at least 1 dt before the onset of a somatic spike), with 27.8% being decoupled if the four bins (~552ms) closest to zero are excluded (excluded data marked as lightly shaded bars). (F) Event pair timing difference histogram for the converted model data; 48.79% of event pairs feature basal dendritic events that are decoupled from the soma (red; dendritic events occur at least 1 dt before the onset of a somatic spike), with 24.3% being decoupled if the 4 bins (~552ms) closest to zero are excluded (excluded data marked as lightly shaded bars). Note that in both D and E, the zero-difference bin was removed, as it is assumed to contain the majority of backpropagating events. The middle two bars in F have been truncated for visualization purposes; the corresponding values are (left to right) 0.15958 and 0.16533, respectively. Some of the detected somatic events are not closely preceded by any detected basal dendritic events (panel F, green bars), suggesting that other events, perhaps arising in the apical tree or basal dendritic segments not in the recording field of view, contribute to somatic activity in such cases.
Figure 2—figure supplement 2
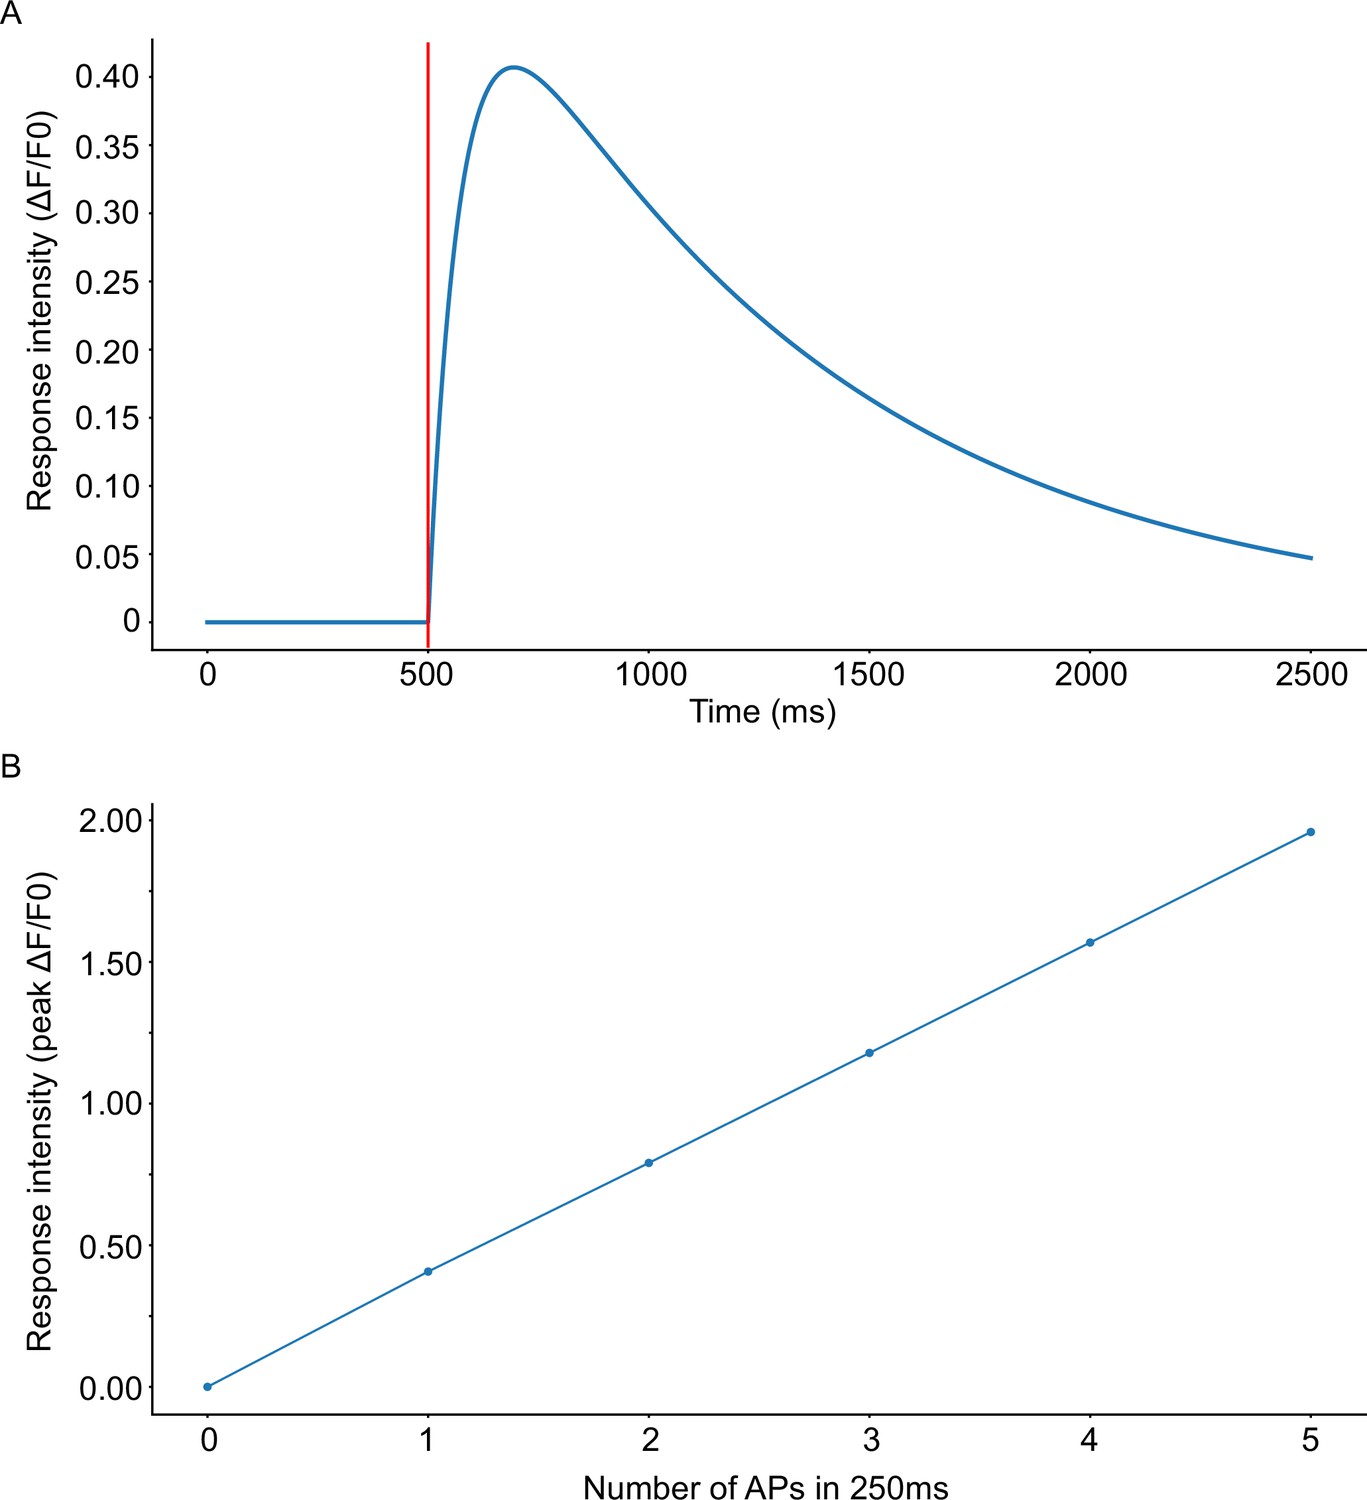
Properties of the GcaMP6s kernel.
(A) Illustration of the output of the kernel function for a single event (AP) occurring at t0 = 500ms. (marked as a red line). (B) Response intensity as a function of the number of events (APs) within a 250ms window. Compare with (Chen et al., 2013).
Figure 2—figure supplement 3
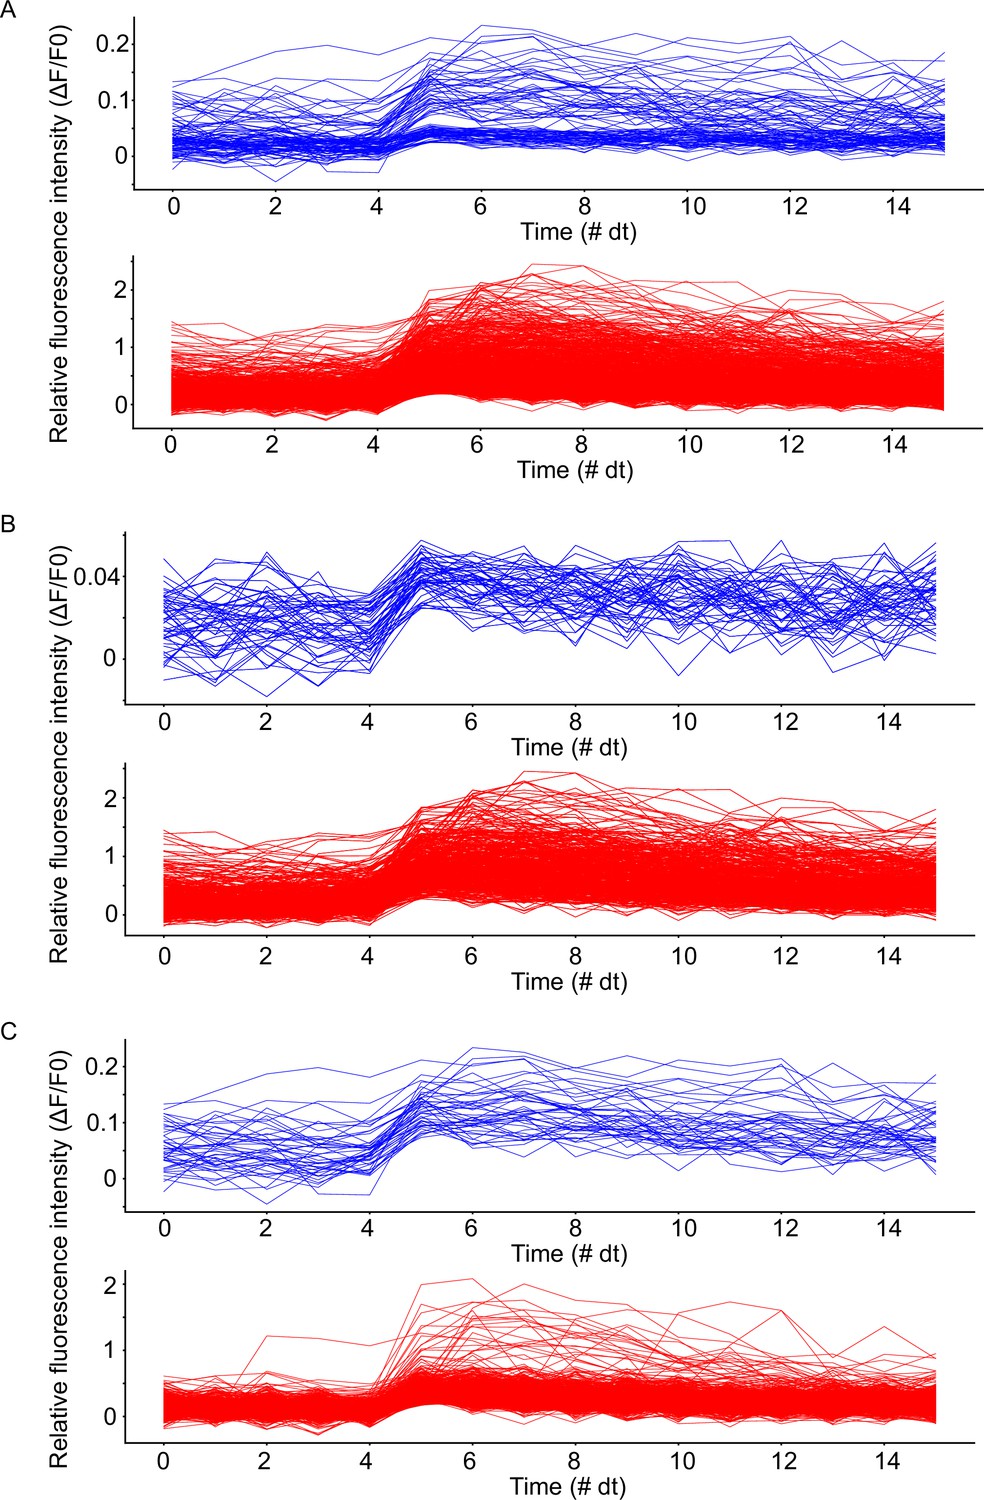
Waveforms of detected calcium fluorescence events.
Somatic waveforms in blue, basal dendritic waveforms in red. Spike onset detected at t=5 dt. (A) Waveforms from all detected events from both mice. (B) Waveforms from all detected events in mouse 1. (C) Waveforms from all detected events from mouse 2. Note: 1 dt is equal to approximately 0.138 s, and exactly equal to the microscope recording frame time.
Figure 2—figure supplement 4
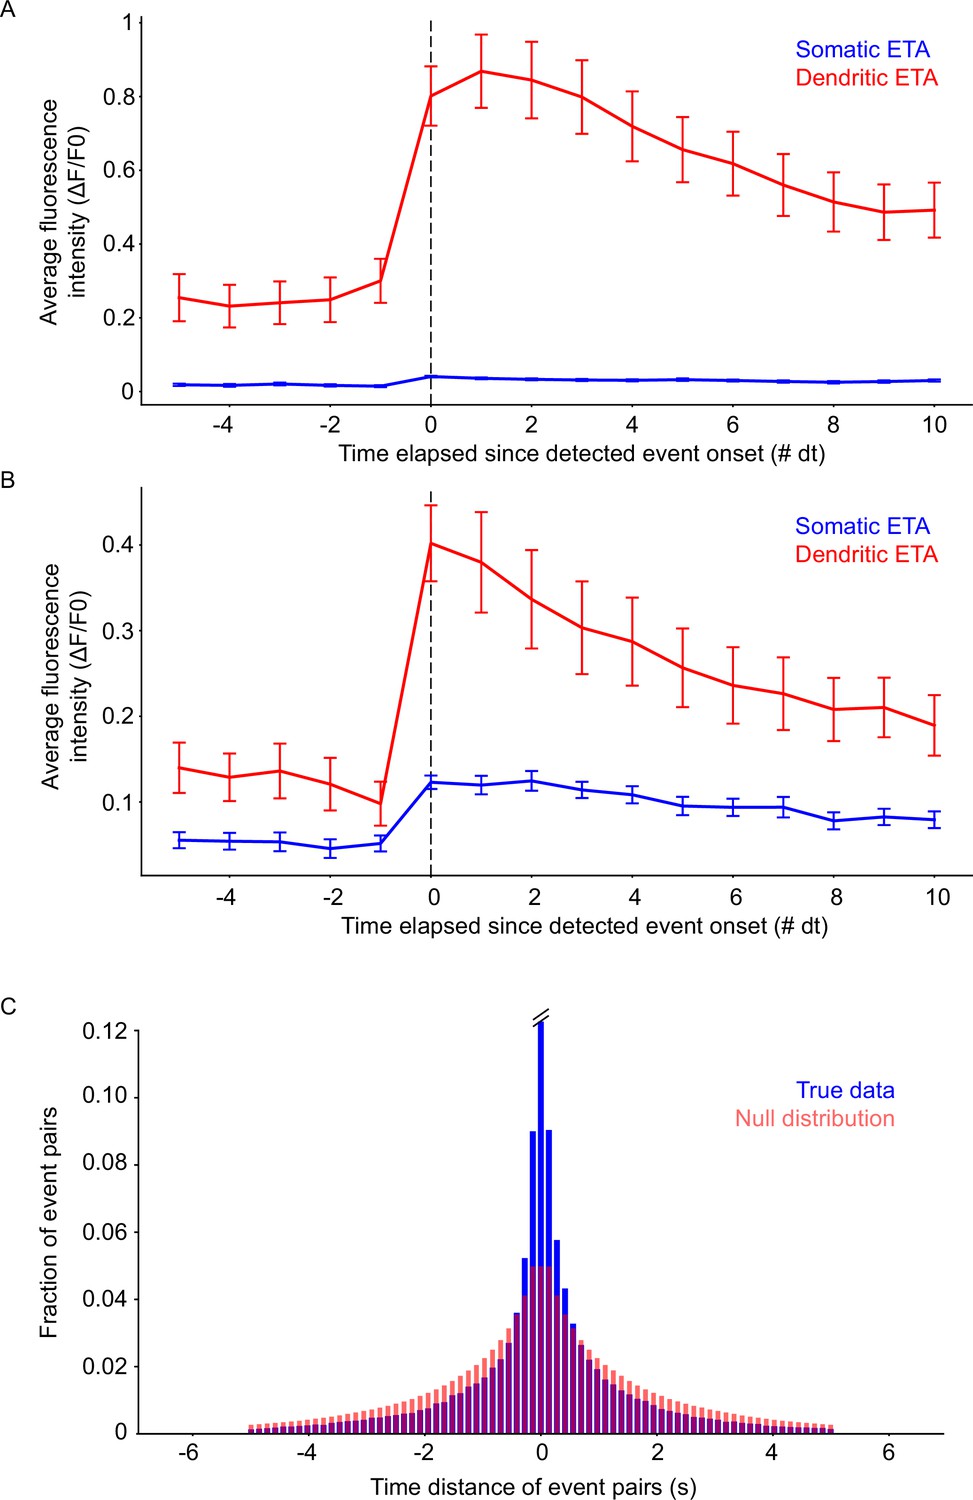
Event-triggered averages of detected events and statistical testing of event pairs.
(A) Event-triggered averages for somatic (blue) and basal dendrite (red) events in mouse 1. (B) Event-triggered averages for somatic (blue) and basal dendrite (red) events in mouse 2. Note the difference in fluorescence intensity compared to mouse 1. Error bars: Standard error of the mean. (C) Comparison of the true (two-photon) data distribution (blue) with the null distribution (light red). Distributions are different (K.S. two-sample test; test value ~0.105, p<<0.05). Note that the middle bar for the true data has been truncated (actual value 0.12267).
Figure 2—figure supplement 5
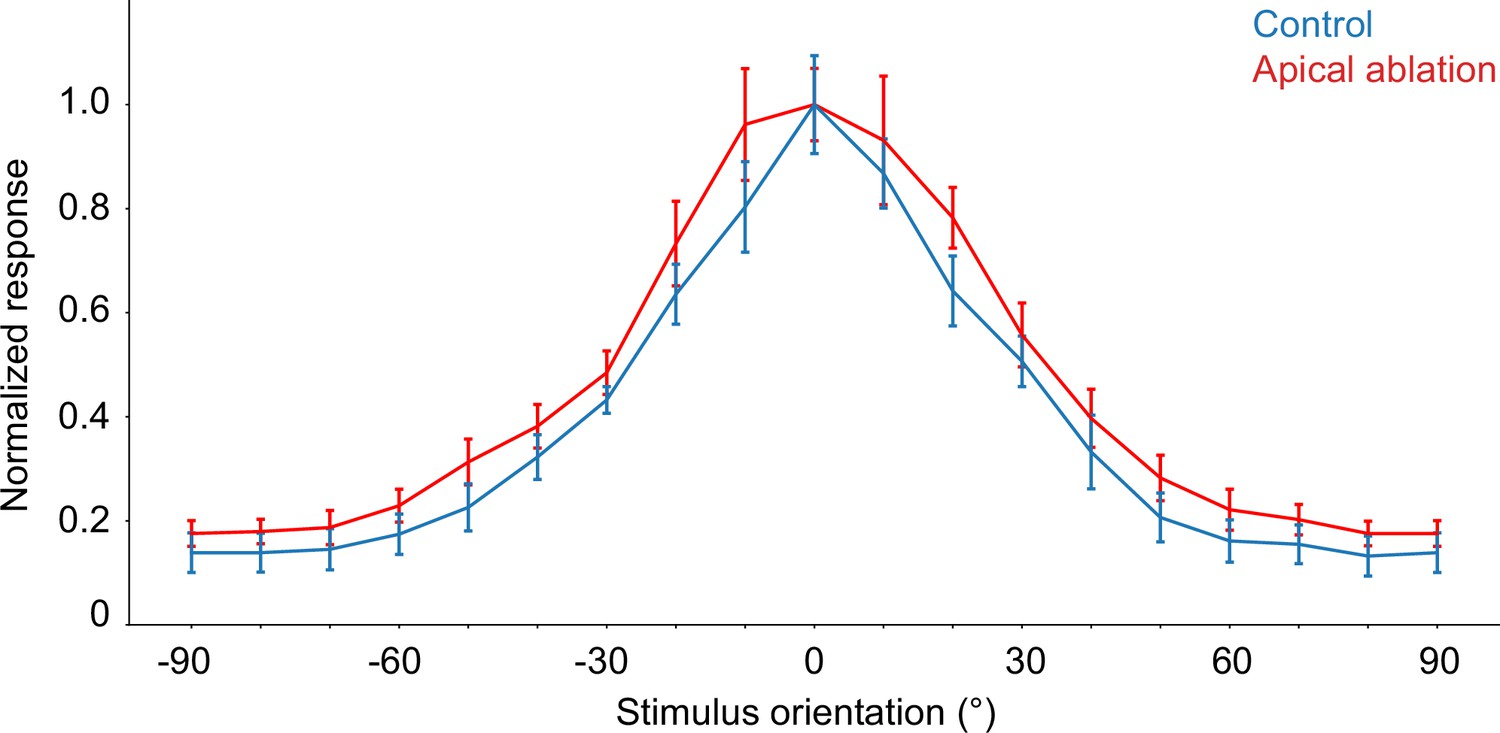
Comparison of orientation tuning behavior seen in the model under control (blue) and apical dendrite ablation (red) configurations.
Note that the y-axis shows the normalized response (firing rate values divided by their corresponding maximum). Error bars: standard error of the mean.
Figure 3 with 1 supplement
Neuronal output relies disproportionately on apical sodium conductance.
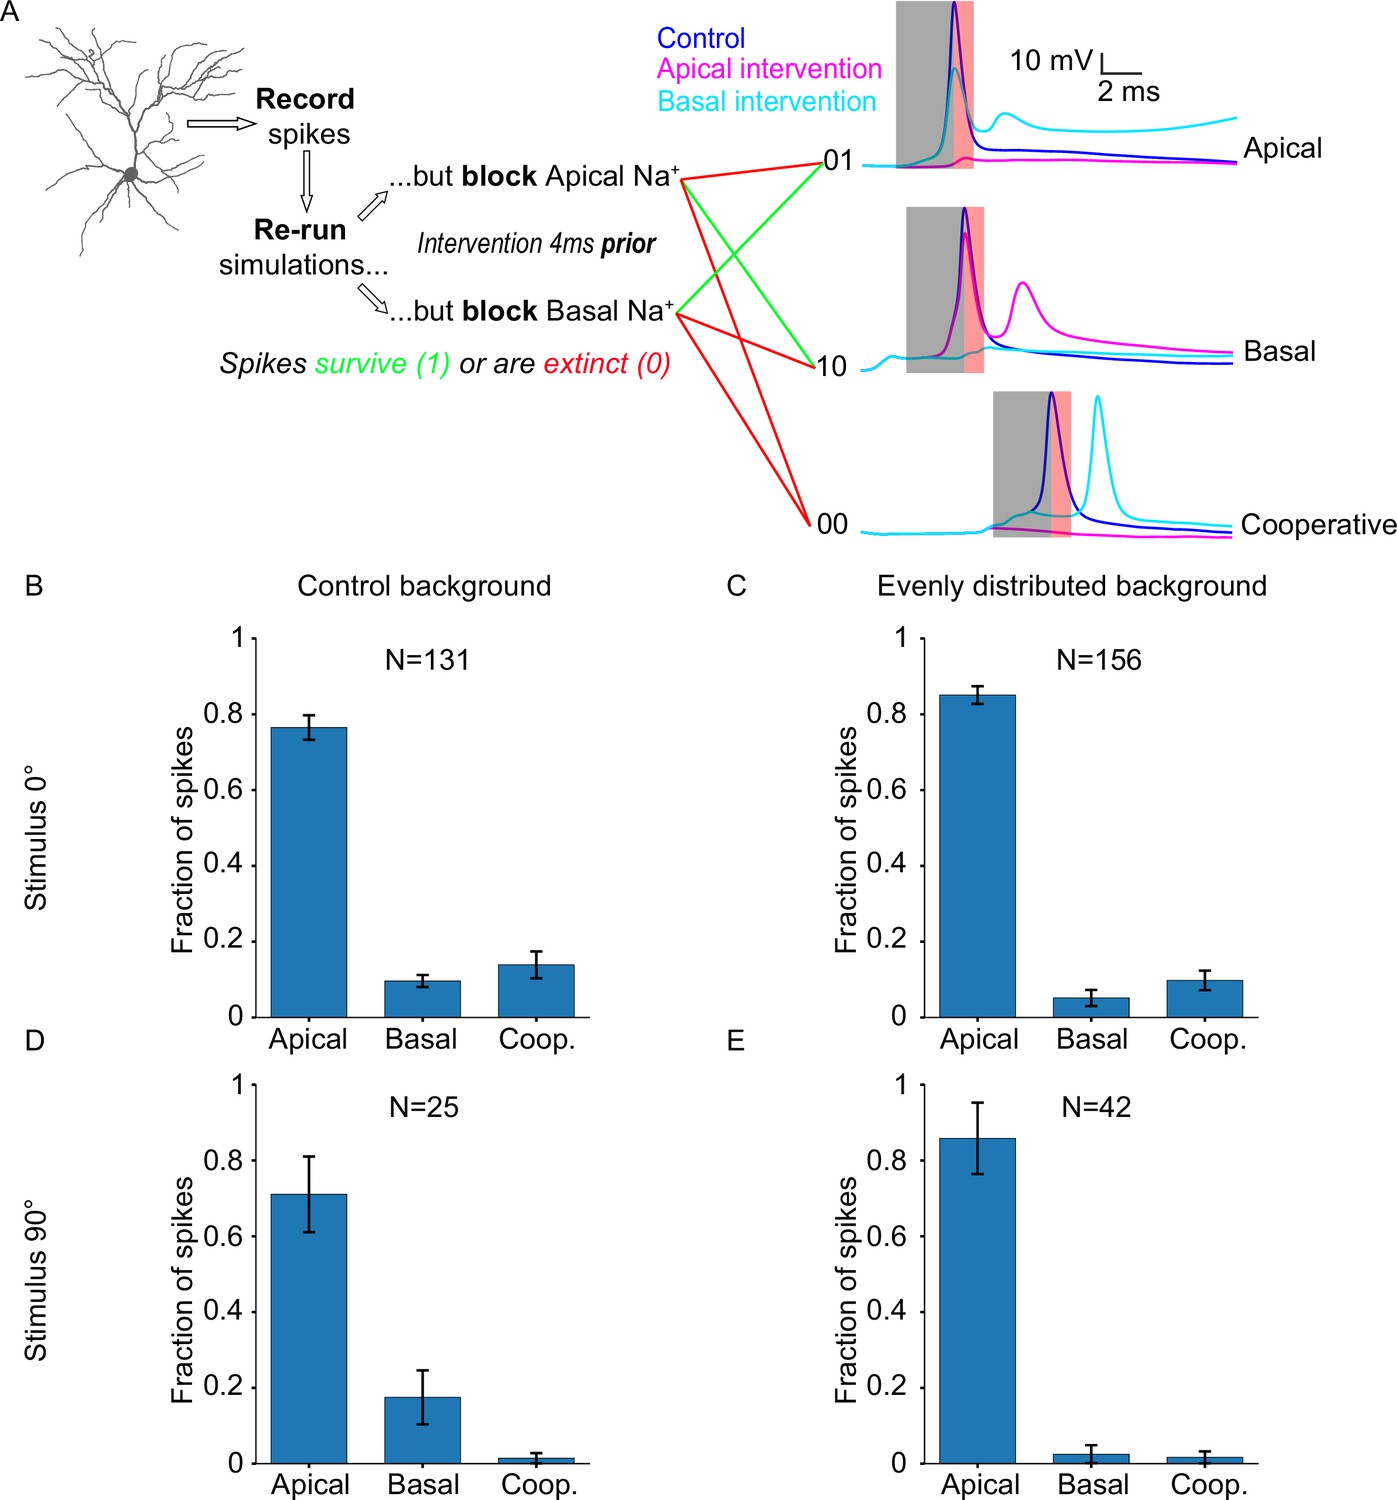
(A) Diagram describing the ionic intervention protocol, with example traces on the right. Shaded areas on the traces denote the pre-spike (grey) and post-spike (red) intervention time windows. (B) Somatic spike dependence on dendritic sodium conductance for the ‘biologically plausible’ model with a stimulus of 0° (preferred orientation). (C) Same as B, but background synapses are evenly distributed across the apical and basal dendritic trees, while stimulus-driven synapses follow the ‘biologically plausible’ (60% basal, 40% apical) model. (D) Somatic spike dependence on dendritic sodium conductance for the ‘biologically plausible’ model with a stimulus of 90° (orthogonal/non-preferred orientation). (E) Same as D, but background synapses follow the ‘even’ model (evenly distributed), while stimulus-driven synapses follow the ‘biologically plausible’ (60% basal, 40% apical) model. ‘N’ is the total number of spikes for each condition. Error bars: Standard error of the mean, for all panels.
Figure 3—figure supplement 1
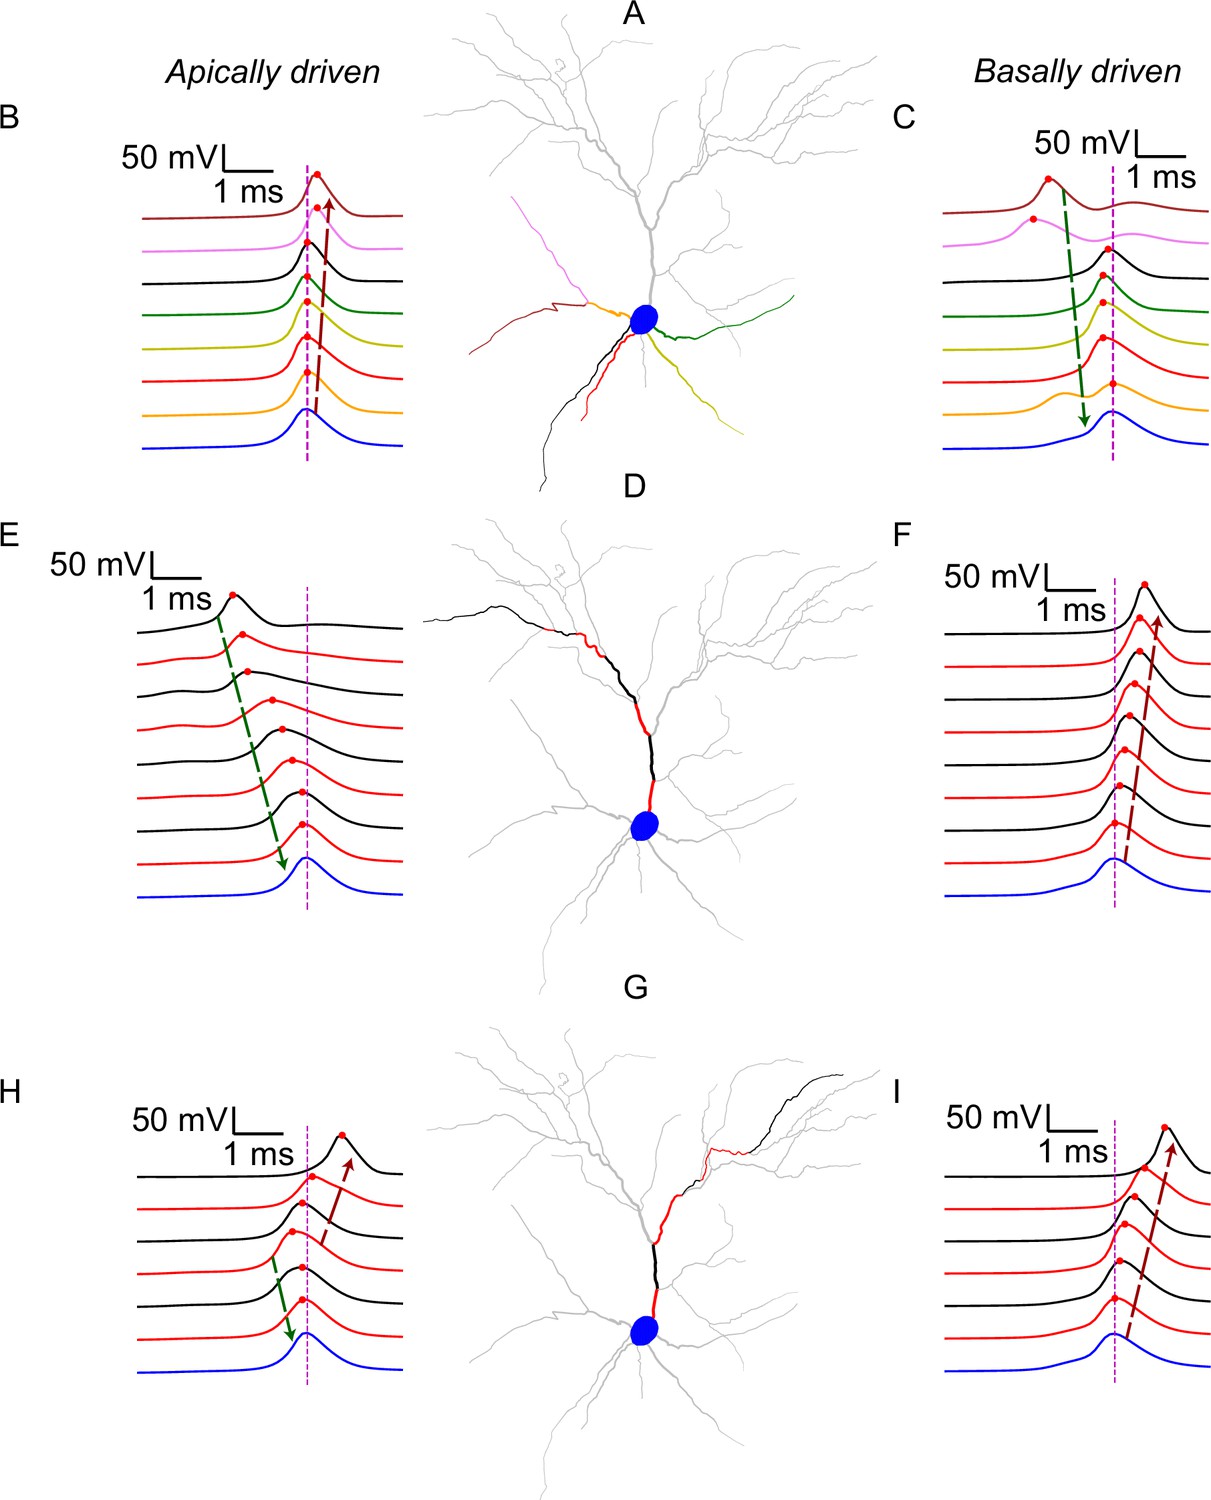
Example traces showing the spatiotemporal evolution of somatodendritic voltage before, during and after the generation of a dendritic-sodium-mediated somatic spike, across different dendritic paths.
(A) Visualization of basal dendrites. Colors correspond to traces in panels B and C. (B) Voltage traces from the basal dendrites and soma (blue) around the occurrence of an apically driven somatic spike. (C) Voltage traces from the basal dendrites and soma (blue) around the occurrence of a basally driven somatic spike. (D) Visualization of a specific apical path. Colors correspond, in the same sequence (proximal to distal), to the traces in panels E and F. (E) Voltage traces from the soma (blue) and the apical dendritic segments shown in D around the occurrence of an apically driven somatic spike. (F) Voltage traces from the soma (blue) and the apical dendritic segments shown in D around the occurrence of a basally driven somatic spike. (G) As in D, but for a different apical path. (H) As in E, but for a different apical path. (I) As in F, but for a different apical path. In all panels, traces are ordered by distance of the recording point from the soma (closest to farthest). Red dots denote the maximum voltage attained by the corresponding dendritic segment. Magenta dashed line indicates the timing of the somatic spike. The soma (and corresponding somatic trace) is always marked in blue. Dendritic segments colored grey are not inactive during these events, but their activity is not shown directly in these traces. Dashed arrows indicate propagation of potential towards (dark green) or away from (dark red) the soma.
Figure 4 with 1 supplement
Orientation tuning critically depends on apical sodium conductance and ampa/nmda activity.
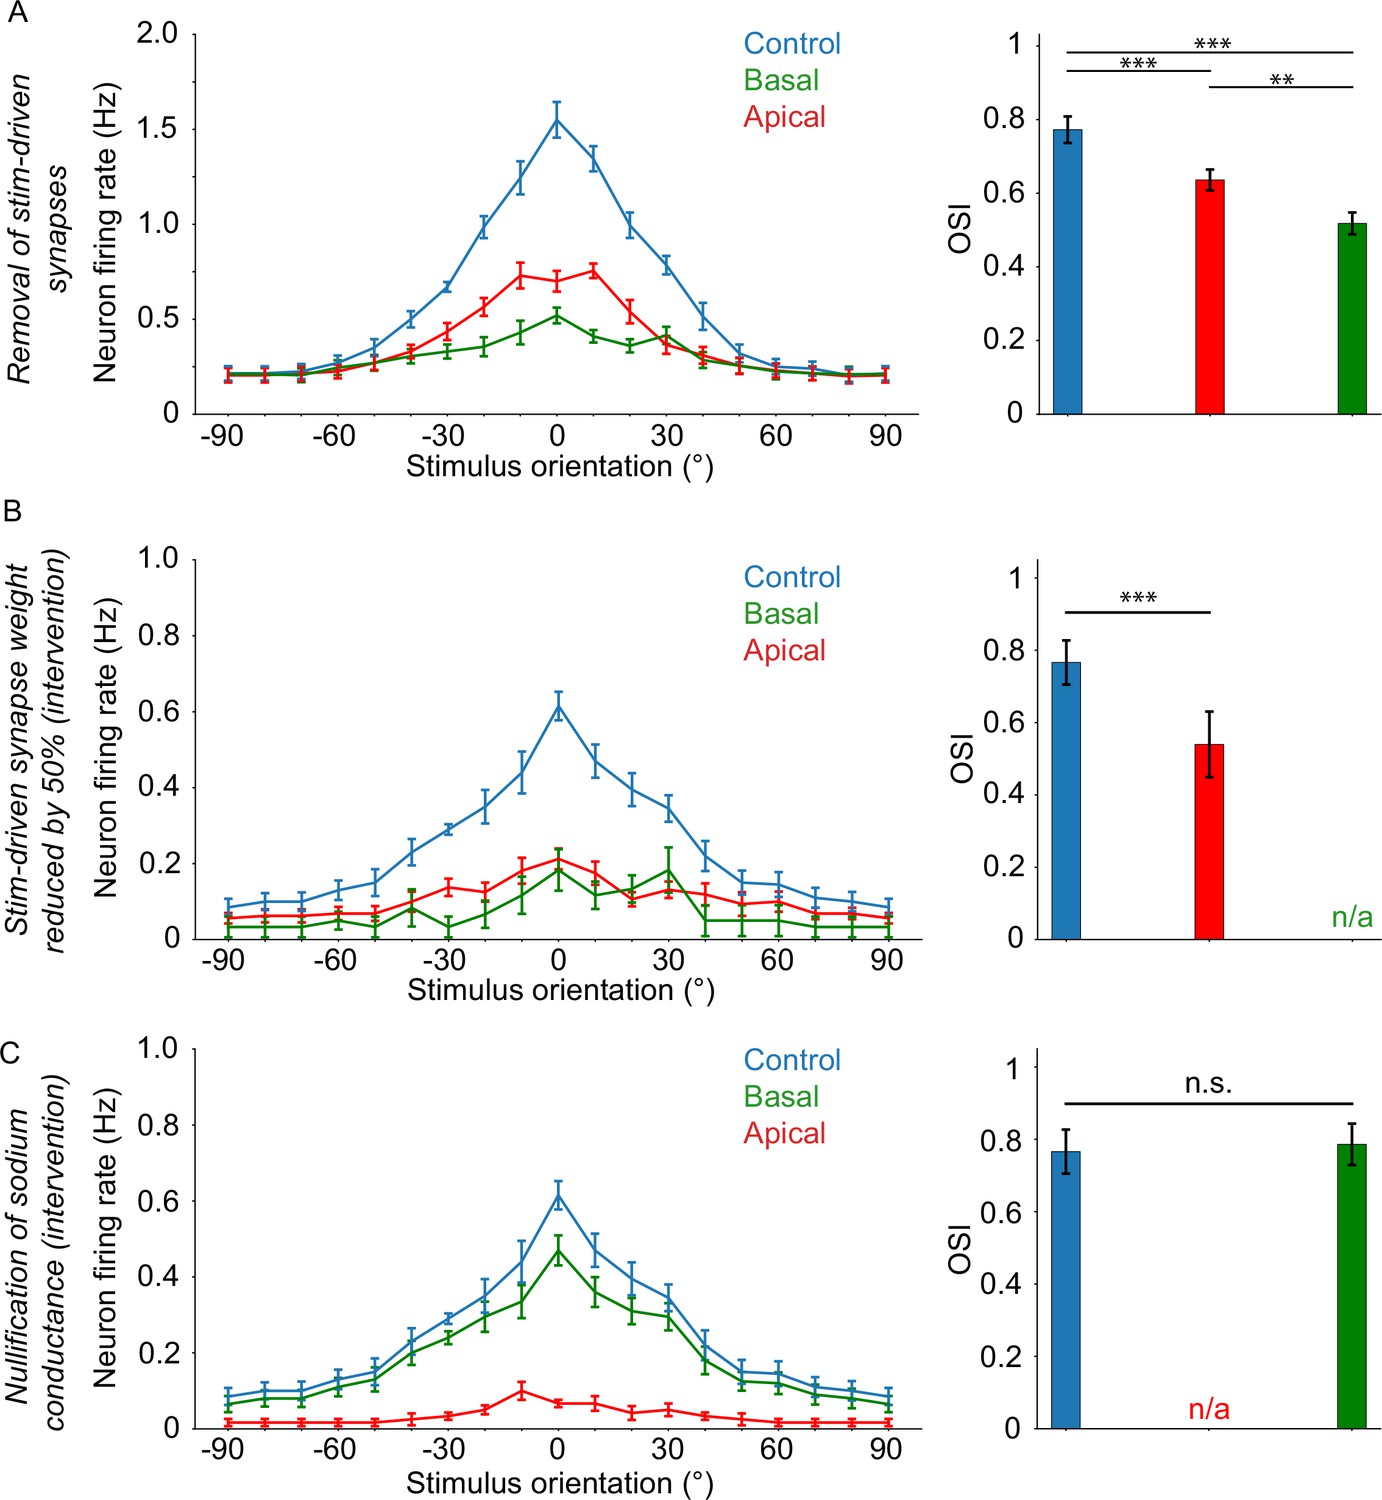
(A) Orientation tuning curves (left) and mean OSI values (right) for the experiment where stimulus-driven synapses are completely absent on either the apical (‘apical target’; red) or basal (‘basal target’; green) tree. (B) Selective reduction of stim-driven synaptic (AMPA/NMDA) weights by 50% 30ms prior to somatic spike occurrence (lasting up to 10ms after the pre-recorded somatic spike timing), on either the apical (apical target; red) or basal (basal target; green) tree. (C) Nullification of sodium conductances 3ms prior to somatic spike occurrence (lasting up to 1ms after the pre-recorded somatic spike timing), on either the apical (apical target; red) or basal (basal target; green) tree. Error bars: Standard error of the mean, for all panels. If present, ‘n/a’ denotes a lack of orientation tuning for that specific experimental setup. Stars denote statistical significance at a significance level (α) of 0.05 (*), 0.01 (**) or 0.001 (***), whereas ‘n.s.’ stands for ‘no statistically significant difference’, that is p-value ≥ α. Dependent two-sample t-tests were used in all cases.
Figure 4—figure supplement 1
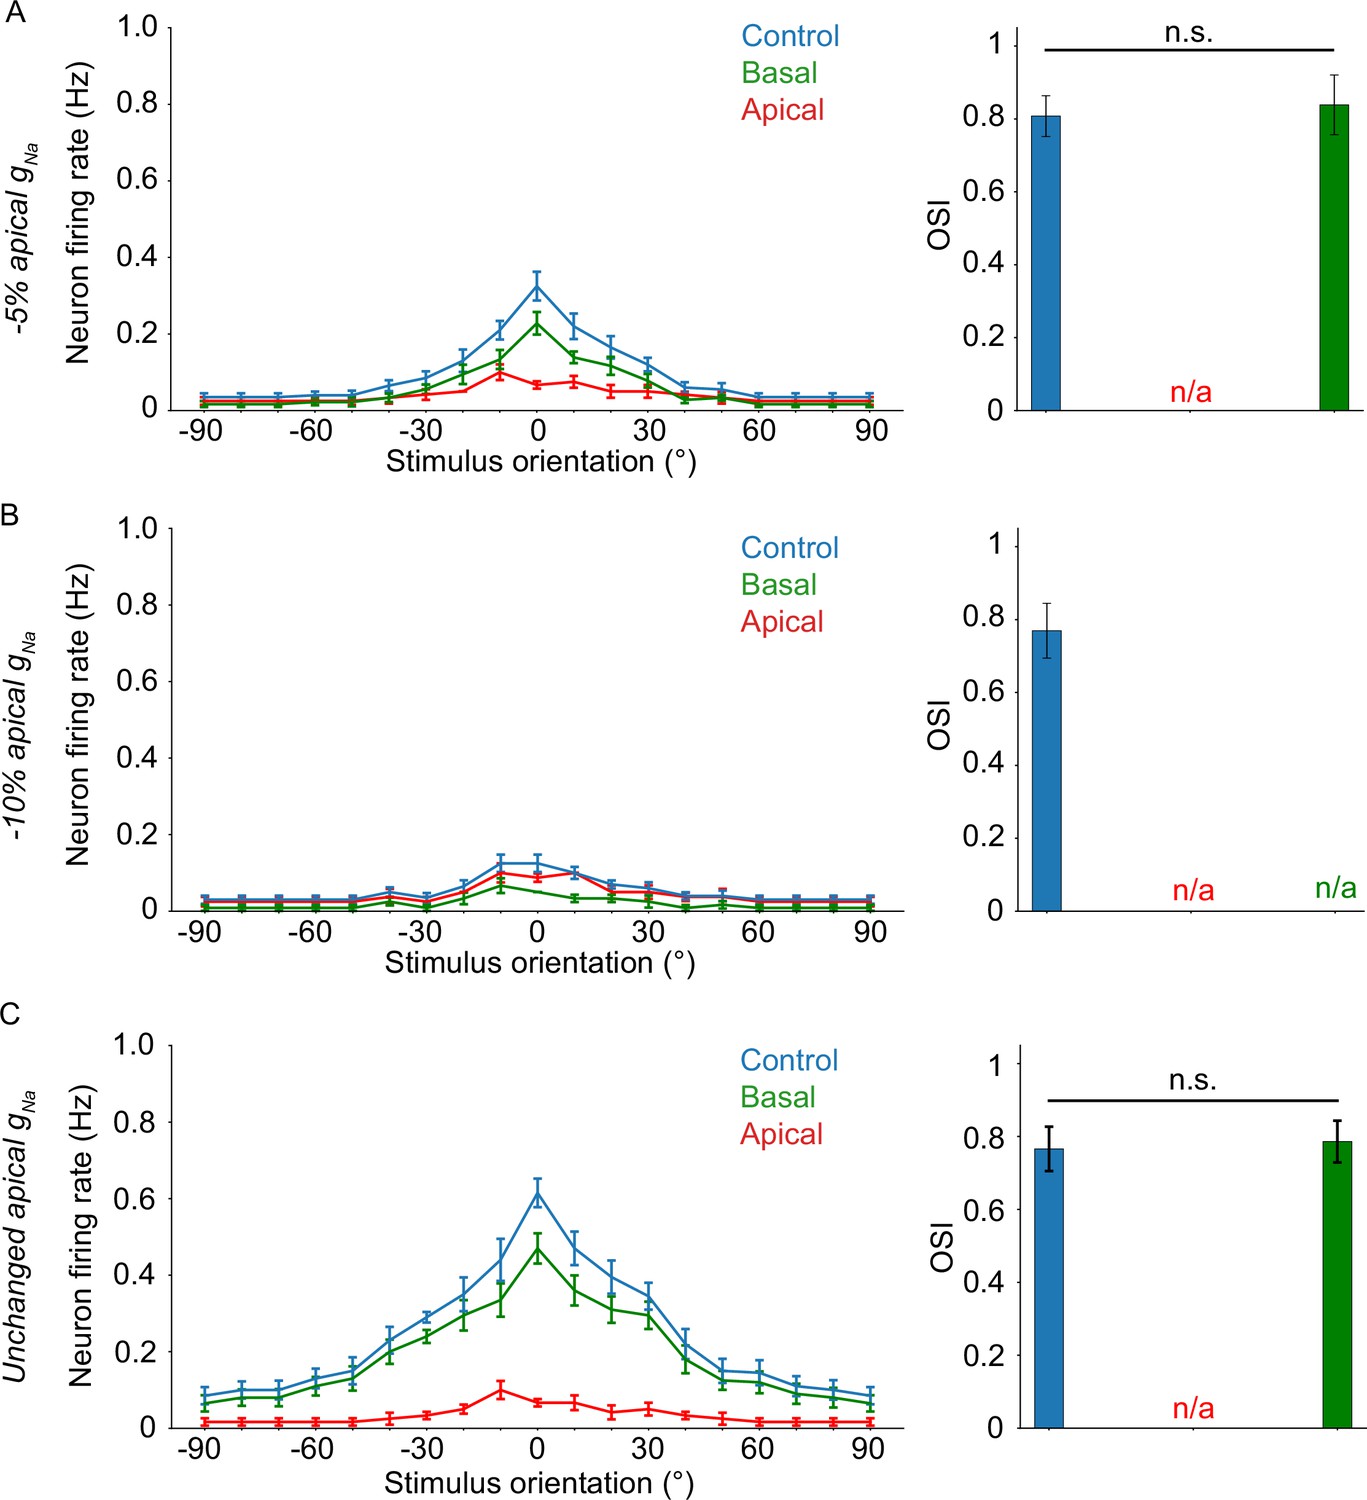
Results from experiments similar to Figure 4C, only with a reduction in apical sodium conductance.
(A) Apical gNa decreased by 5%. Elimination of the apical sodium component results in total loss of tuning. (B) Apical gNa decreased by 10%. Unlike A, elimination of the apical or basal sodium component results in total loss of tuning. (C) Apical gNa is unchanged (control condition, identical to Figure 4C). Similar to A, elimination of the apical sodium component results in total loss of tuning. If present, ‘n/a’ denotes a lack of orientation tuning for that specific experimental setup. Stars denote statistical significance at a significance level (α) of 0.05 (*), 0.01 (**) or 0.001 (***), whereas ‘n.s.’ stands for ‘no statistically significant difference’, that is p-value ≥ α. Dependent two-sample t-tests were used in all cases.
Figure 5 with 1 supplement
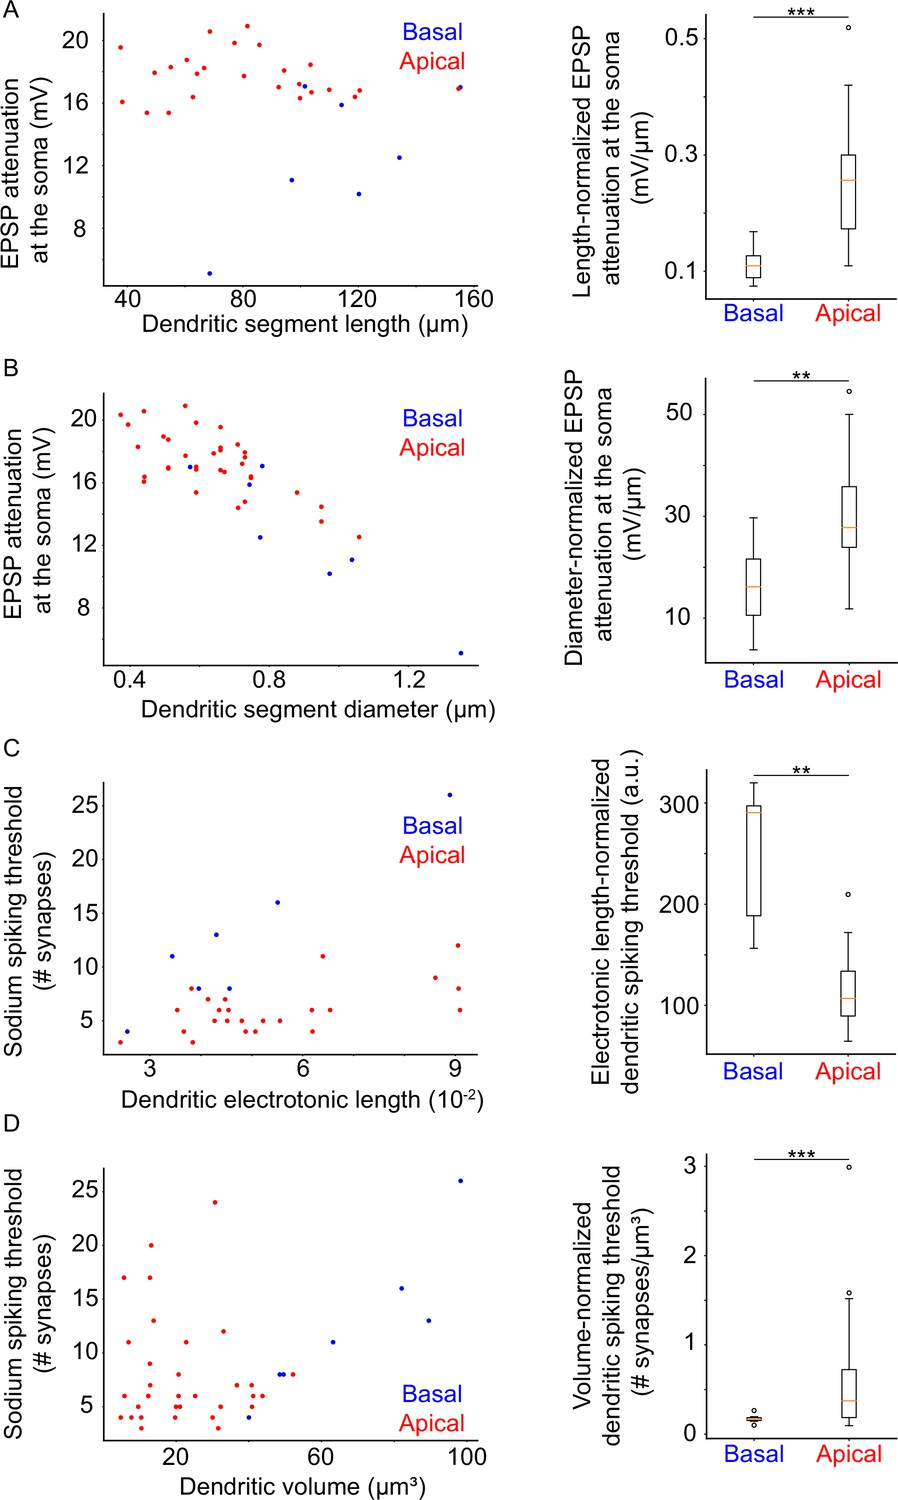
Dendritic morphological and electrophysiological properties affect both local and somatic behavior.
(A) Left: Attenuation of a 20 mV dendritic EPSP (measured at the soma) as a function of dendritic segment length. Right: Comparison of length-normalized EPSP attenuation at the soma between apical and basal dendritic segments. Apical dendritic segments feature greater attenuation. (B) Left: Attenuation of a 20 mV dendritic EPSP (measured at the soma) as a function of dendritic segment diameter. Right: Comparison of diameter-normalized EPSP attenuation at the soma between apical and basal dendritic segments. Apical dendritic segments feature greater attenuation. (C) Left: Dendritic sodium spiking thresholds as a function of dendritic electrotonic length. Right: Comparison of electrotonic length-normalized sodium spiking thresholds between apical and basal dendritic segments. Apical dendritic segments feature lower thresholds. (D) Left: Dendritic sodium spiking thresholds as a function of dendritic volume. Right: Comparison of volume-normalized sodium spiking thresholds between apical and basal dendritic segments. Apical dendritic segments feature greater thresholds, but also much greater variability of thresholds. Stars denote statistical significance at a significance level (α) of 0.05 (*), 0.01 (**) or 0.001 (***), whereas ‘n.s.’ stands for ‘no statistically significant difference’, i.e. p-value ≥ α.
Figure 5—figure supplement 1
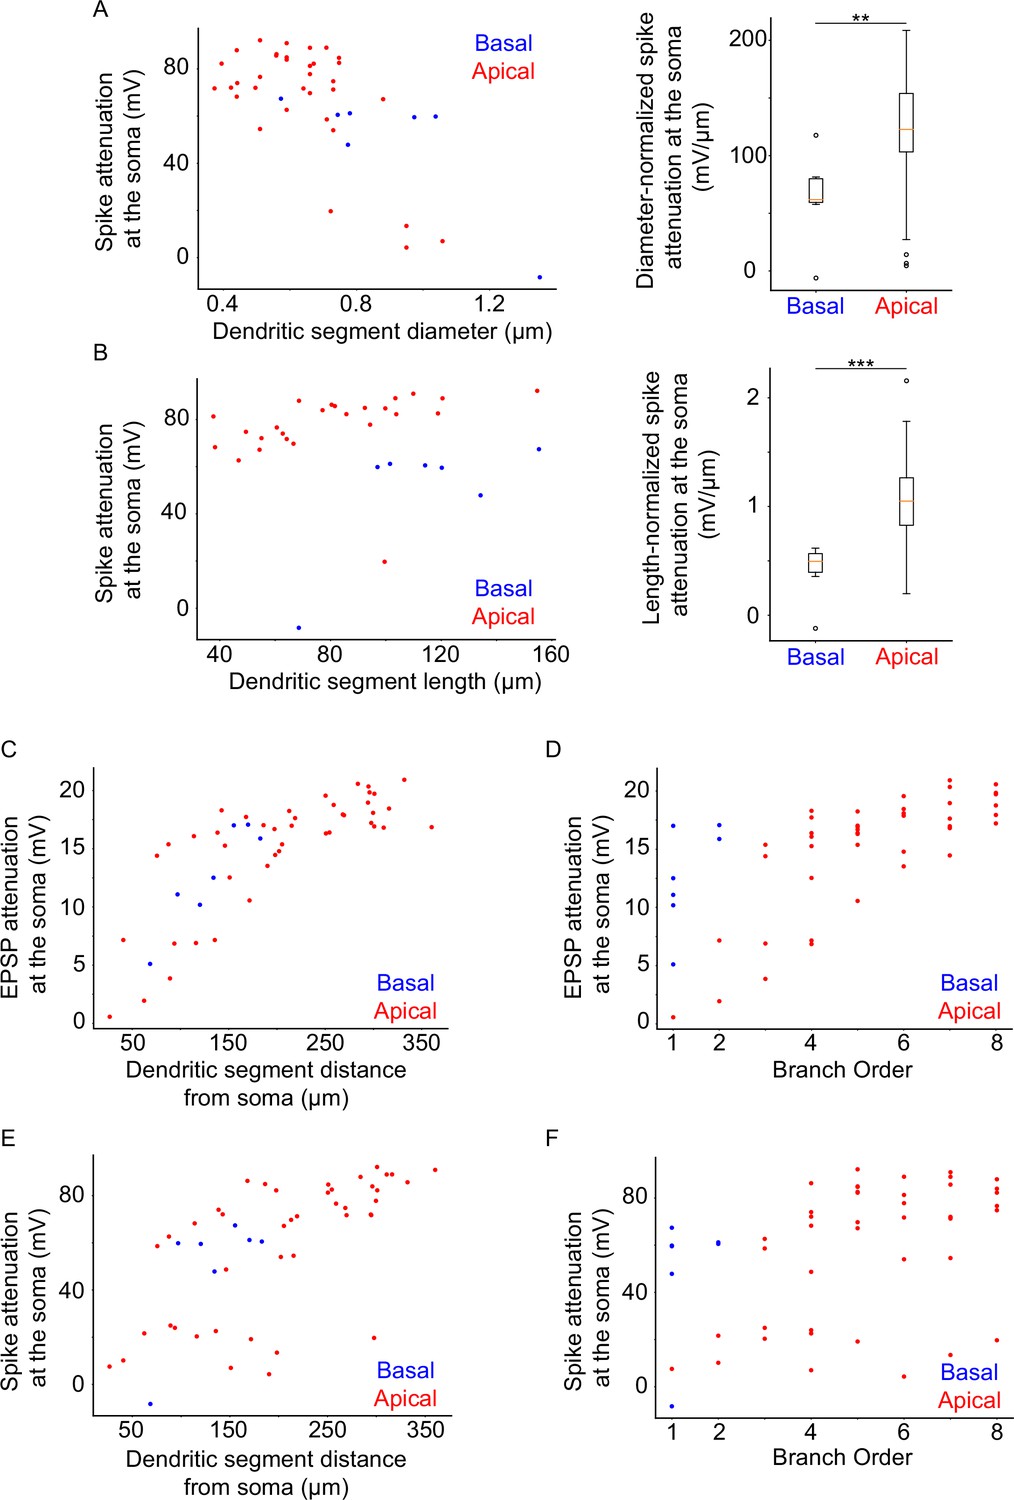
Results from analyses similar to Figure 5.
Dendritic segments were stimulated with a number of synapses sufficient to elicit dendritic sodium spiking, and the attenuation at the soma was measured. (A) Somatic sodium spike attenuation as a function of dendritic segment diameter (left panel). Differences between apical and basal dendrites can be evaluated by normalizing spike attenuation by the diameter of the dendritic segment (right panel), showing significantly greater attenuation per μm for apical over basal dendrites (p-value 0.006459). (B) Somatic sodium spike attenuation as a function of dendritic segment length (left panel). Differences between apical and basal dendrites can be evaluated by normalizing spike attenuation by the length of the dendritic segment (right panel), showing significantly greater attenuation per μm for apical over basal dendrites (p-value 0.000097). (C) 20 mV EPSP attenuation as a function of distance of the dendritic segment from the soma. (D) 20 mV EPSP attenuation as a function of the branch order of the dendritic segment. (E) As C, but for sodium spikes rather than 20 mV EPSPs. (F) As D, but for sodium spikes rather than 20 mV EPSPs. Stars denote statistical significance at a significance level (α) of 0.05 (*), 0.01 (**) or 0.001 (***), whereas ‘n.s.’ stands for ‘no statistically significant difference’, that is p-value ≥ α.
Figure 6
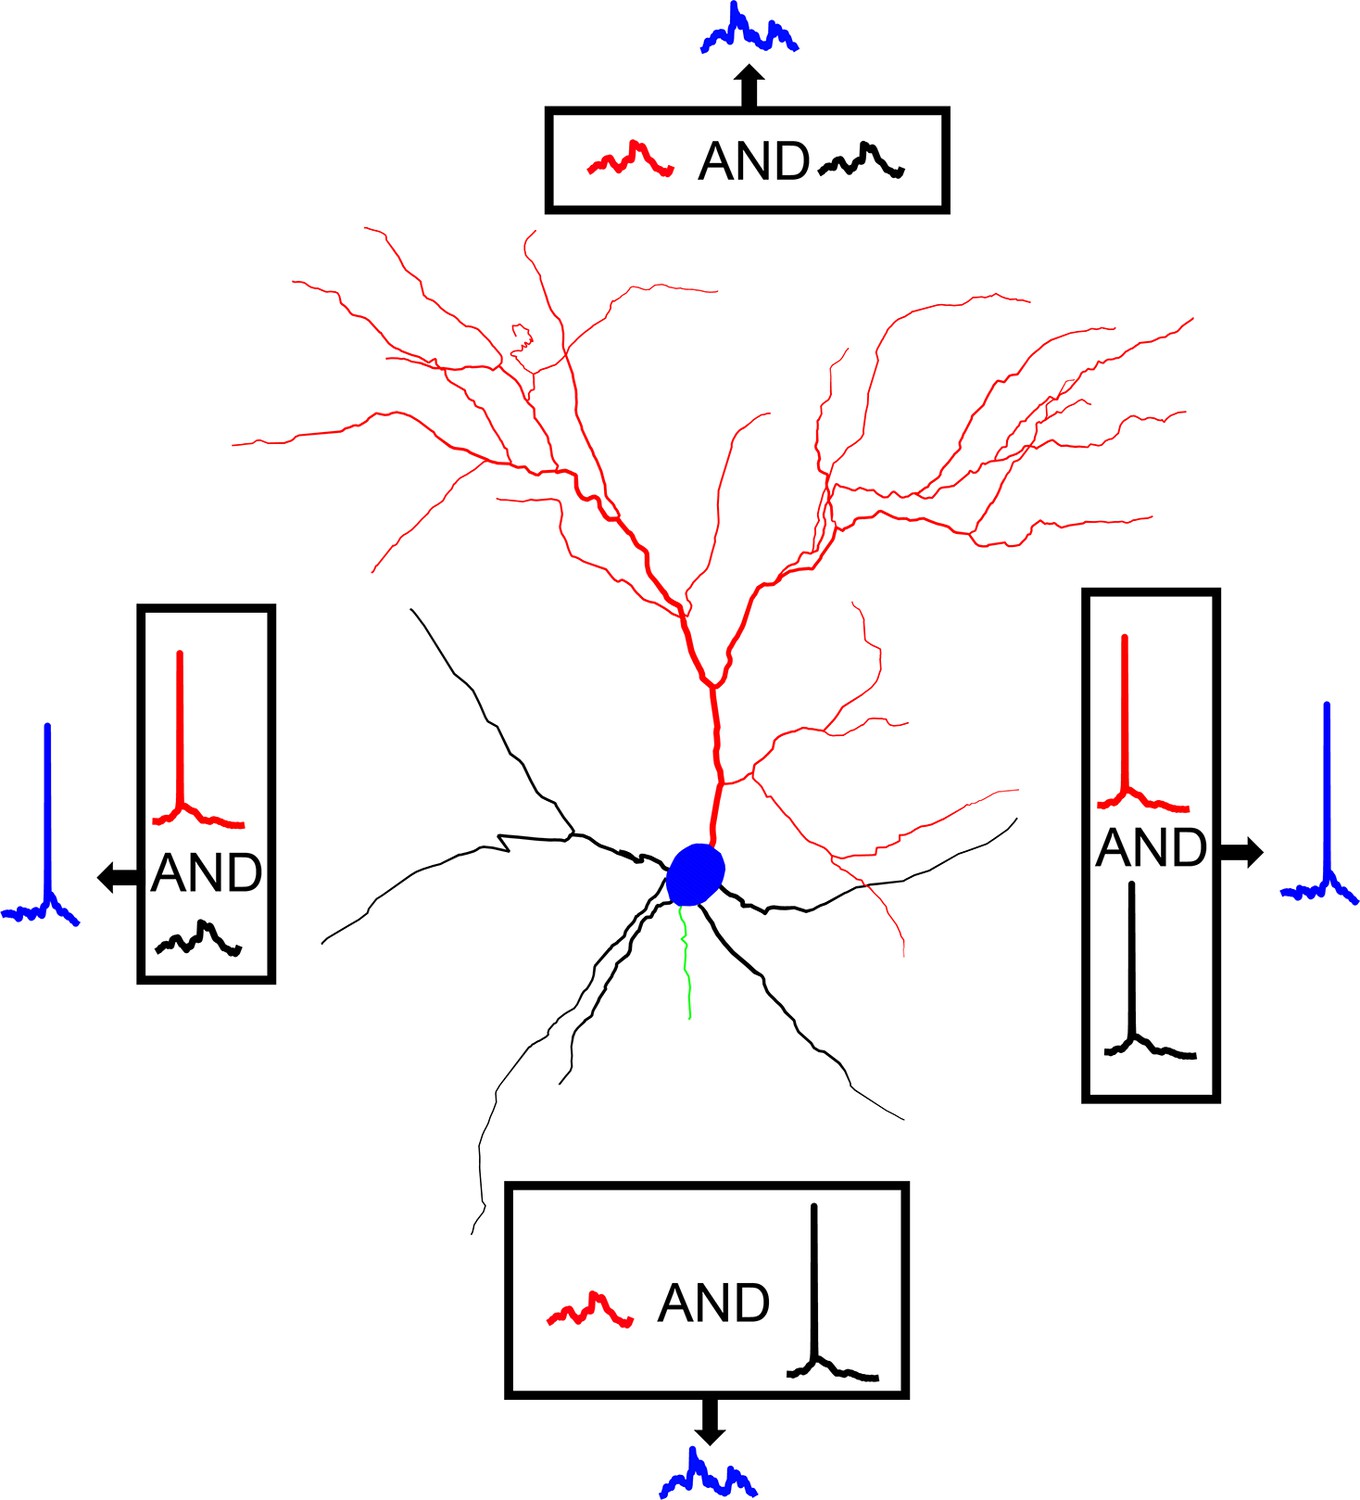
Graphical representation of AP generation via bimodal Input coincidence in a L2/3 V1 pyramidal neuron model.
Action potential generation requires the spatiotemporal coincidence of apical sodium spikes with either basal sodium spikes or significant basal depolarizations, allowing the neuron to respond to salient stimuli that may or may not be affected by attentional and/or predictive signals from higher-order areas.
Tables
Table 1
Outline of passive, active, and synaptic mechanisms present in the model neuron.
| Compartment type | Passive/active mechanisms | Synaptic mechanisms |
|---|---|---|
| Soma | Hodgkin/Huxley voltage-gated Na+ channels Hodgkin/Huxley voltage-gated K+ channels Muscarinic voltage-gated K+ channels A-Type voltage-gated K+ channels T-Type Ca++ channels High voltage activated (HVA) Ca++ channels Calcium-dependent K+ channels Active ATP Ca++ pumps | GABAA (background-driven) |
| Basal dendrites | AMPA (background-driven) NMDA (background-driven) GABAA (background-driven) AMPA (stimulus-driven) NMDA (stimulus-driven) GABAA (stimulus-driven) | |
| Apical dendrites |
Table 2
Outline of membrane mechanism conductances (not synaptic).
Reproduced from Park et al., 2019.
| Conductance (mS/cm2) | Soma | Apical | Basal |
|---|---|---|---|
| gNa | 0.505 | 0.303 | 0.303 |
| gKdr | 0.05 | 1.5*10–3 | 1.5*10–3 |
| gKm | 2.8*10–3 | 1.27*10–3 | 1.27*10–3 |
| gA | 5.4 | Diameter ≤0.8 μm: 108 Diameter >0.8 μm: 10.8 | Diameter ≤0.8 μm: 108 Diameter >0.8 μm: 10.8 |
| gT | 0.03 | x≤260 μm: 0.029*sin(0.009*x+0.88) x>260 μm: 0.012 | 0.03+6*10–5*x |
| gHVA | 0.05*10–3 | x≤260 μm: 0.049*10–3*sin(0.009*x+0.88) x>260 μm: 0.02*10–3 | 0.05*10–3+10–7*x |
| gKCa | 2.1*10–3 | 2.1*10–3 | 2.1*10–3 |
Table 3
Outline of model electrophysiological properties.
RMP: resting membrane potential, IR: Input Resistance measured at hyperpolarizing current (–0.04 nA), AP: action potential, AHP: after hyperpolarization measured at depolarizing current (0.16 nA), P-T peak-trough. Reproduced from Park et al., 2019.
| Model | Cho et al., 2010 | |
|---|---|---|
| RMP, mV | –79 | –78.56 ± 1.34 |
| IR, MΩ | 123.6 | 125.2 ± 8.2 |
| τ, ms | 17.3 | 16 ± 0.7 |
| AP amplitude, mV | 66.1 | 67.8 ± 1.8 |
| AP threshold, mV | –41.8 | –37.7 ± 1.3 |
| AHP, mV | 17.9 | 13.3 ± 0.5 |
| P-T time, ms | 38.6 | 55.3 ± 2.7 |
| AP adaptation | 1.16 | 1.18 ± 0.02 |
Table 4
Outline of synaptic mechanism conductances and time constants.
Reproduced from Park et al., 2019.
| Conductance (nS) | τ1, ms | τ2, ms | |
|---|---|---|---|
| NMDA | 1.15 | 2 | 30 |
| AMPA | 0.84 | 0.1 | 2.5 |
| GABAA | 1.25 | 0.2 | 1.4 |
Additional files
Download links
A two-part list of links to download the article, or parts of the article, in various formats.
Downloads (link to download the article as PDF)
Open citations (links to open the citations from this article in various online reference manager services)
Cite this article (links to download the citations from this article in formats compatible with various reference manager tools)
Modeling apical and basal tree contribution to orientation selectivity in a mouse primary visual cortex layer 2/3 pyramidal cell
eLife 12:e91627.
https://doi.org/10.7554/eLife.91627


