Scaling of an antibody validation procedure enables quantification of antibody performance in major research applications
- Department of Neurology and Neurosurgery, Structural Genomics Consortium, The Montreal Neurological Institute, McGill University, Canada
- Advanced BioImaging Facility (ABIF), McGill University, Canada
- NIHR Respiratory BRC, Department of Respiratory Sciences, University of Leicester, United Kingdom
- Department of Neuroscience, UC San Diego, United States
- The Neuro's Early Drug Discovery Unit (EDDU), Structural Genomics Consortium, McGill University, Canada
- Structural Genomics Consortium, University of Toronto, Canada
Figures
Figure 1 with 1 supplement
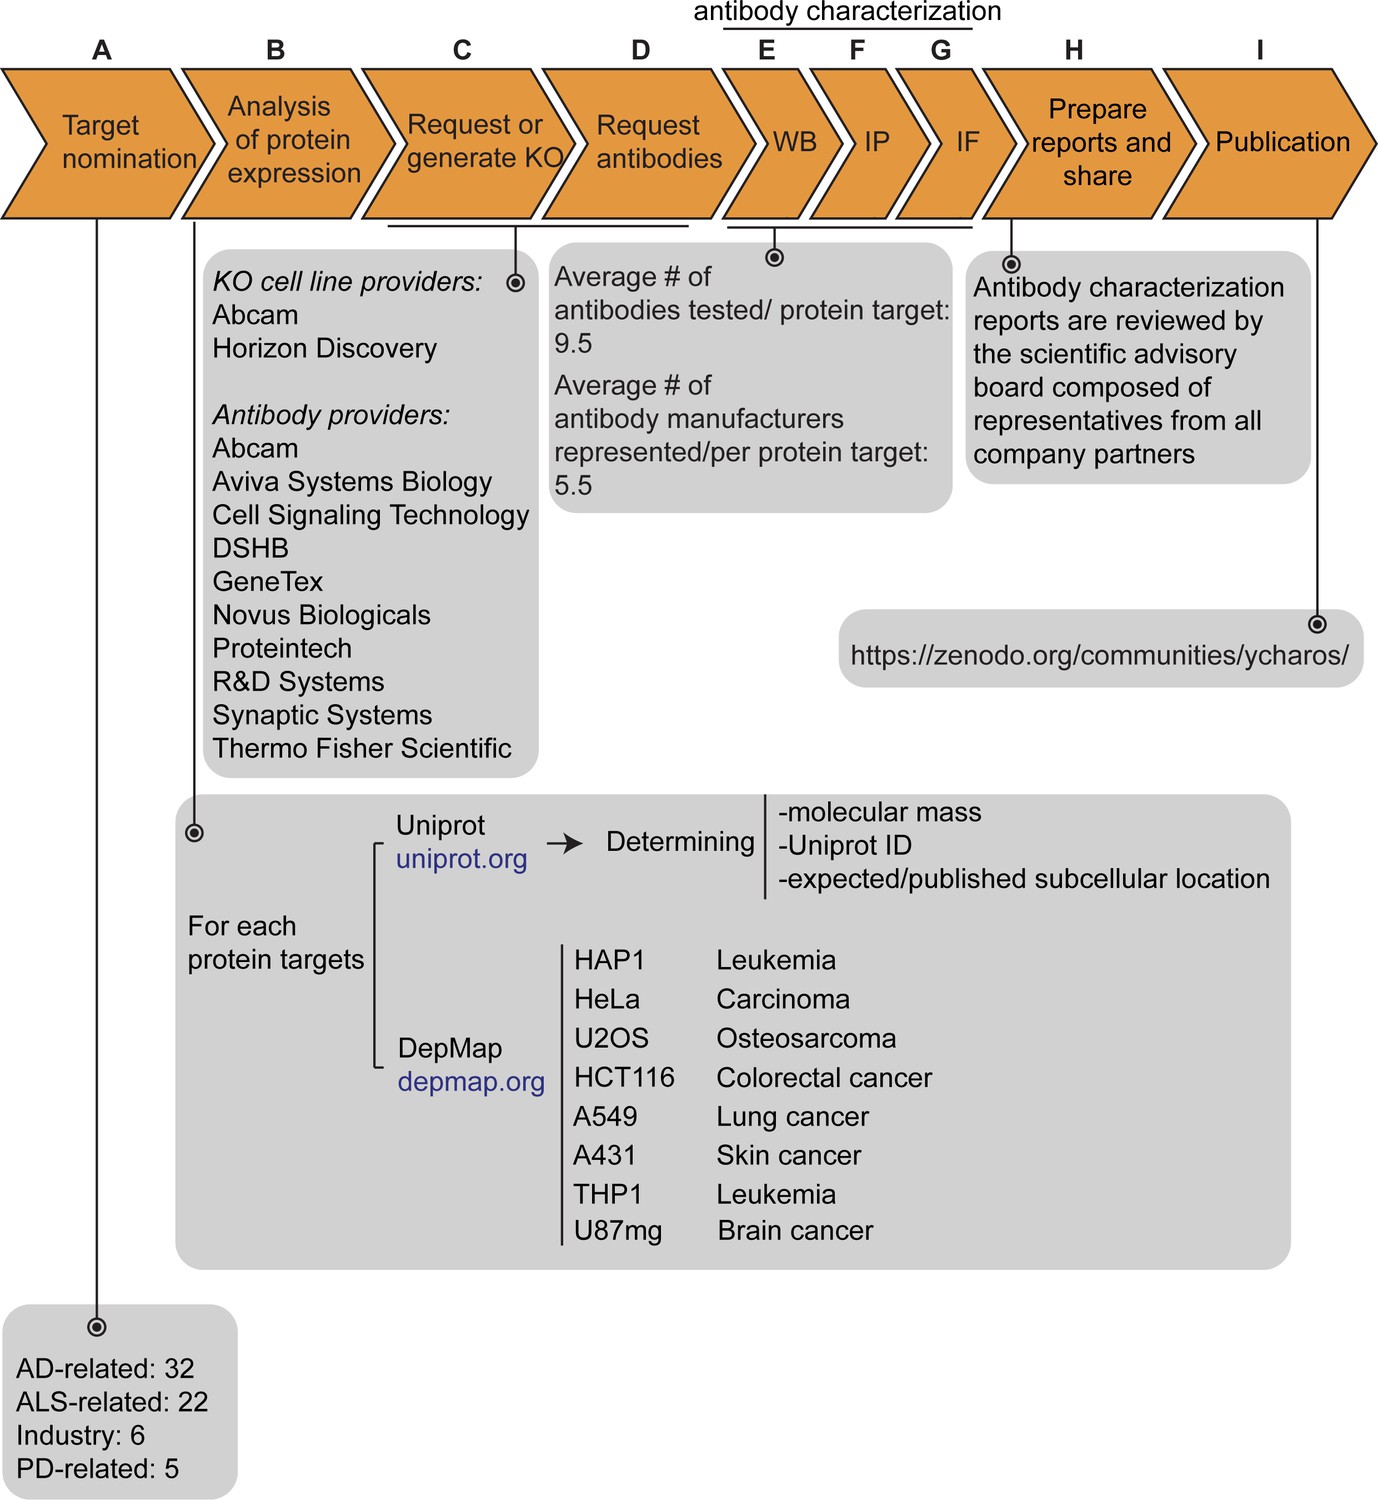
Antibody characterization platform.
(A) The funders of the targets analyzed in this study and the number of targets proposed by each are indicated. (B) Bioinformatic analyses of nominated proteins using Uniprot to determine their molecular mass, unique Uniprot ID and published/expected subcellular distribution. In parallel, analyses of the Cancer Dependency Map (‘DepMap’) portal provided RNA sequencing data for the designated target, which guided our selection of cell lines with adequate expression for the generation of custom KO cell lines. A subset of cell lines amenable for genome engineering were prioritized. (C) Receive relevant KO cell lines or generate custom KO lines and (D) receive antibodies from manufacturing partners. All contributed antibodies were tested in parallel by (E) WB using WT and KO cell lysates ran side-by-side, (F) IP followed by WB using a KO-validated antibody identified in (E) and by (G) IF using a mosaic strategy to avoid imaging and analysis biases. (H) Antibody characterization data for all tested antibodies were presented in a form of a protein target report. All reports were shared with participating companies for their review. (I) Reviewed reports were published on ZENODO, an open access repository. ALS-RAP=amyotrophic lateral sclerosis-reproducible antibody platform, AD = Alzheimer’s disease, MJFF = Michael J. Fox Foundation. KO = knockout cell line.
-
Figure 1—source data 1
Description of the 65 nominated target proteins.
List of all nominated proteins for which an antibody characterization report was generated. The list includes the corresponding protein name, gene name, Uniprot ID, expected subcellular distribution, number of articles referring to the protein itself, the total number of antibodies tested, the number of renewable antibodies tested, the number of companies that have provided antibodies, the cell line background used to generate a KO line, the RNA level – units are log2(TPM +1) and the DOI referring to the antibody characterization report uploaded on ZENODO or to another publication platform.
- https://cdn.elifesciences.org/articles/91645/elife-91645-fig1-data1-v2.xlsx
Figure 1—figure supplement 1
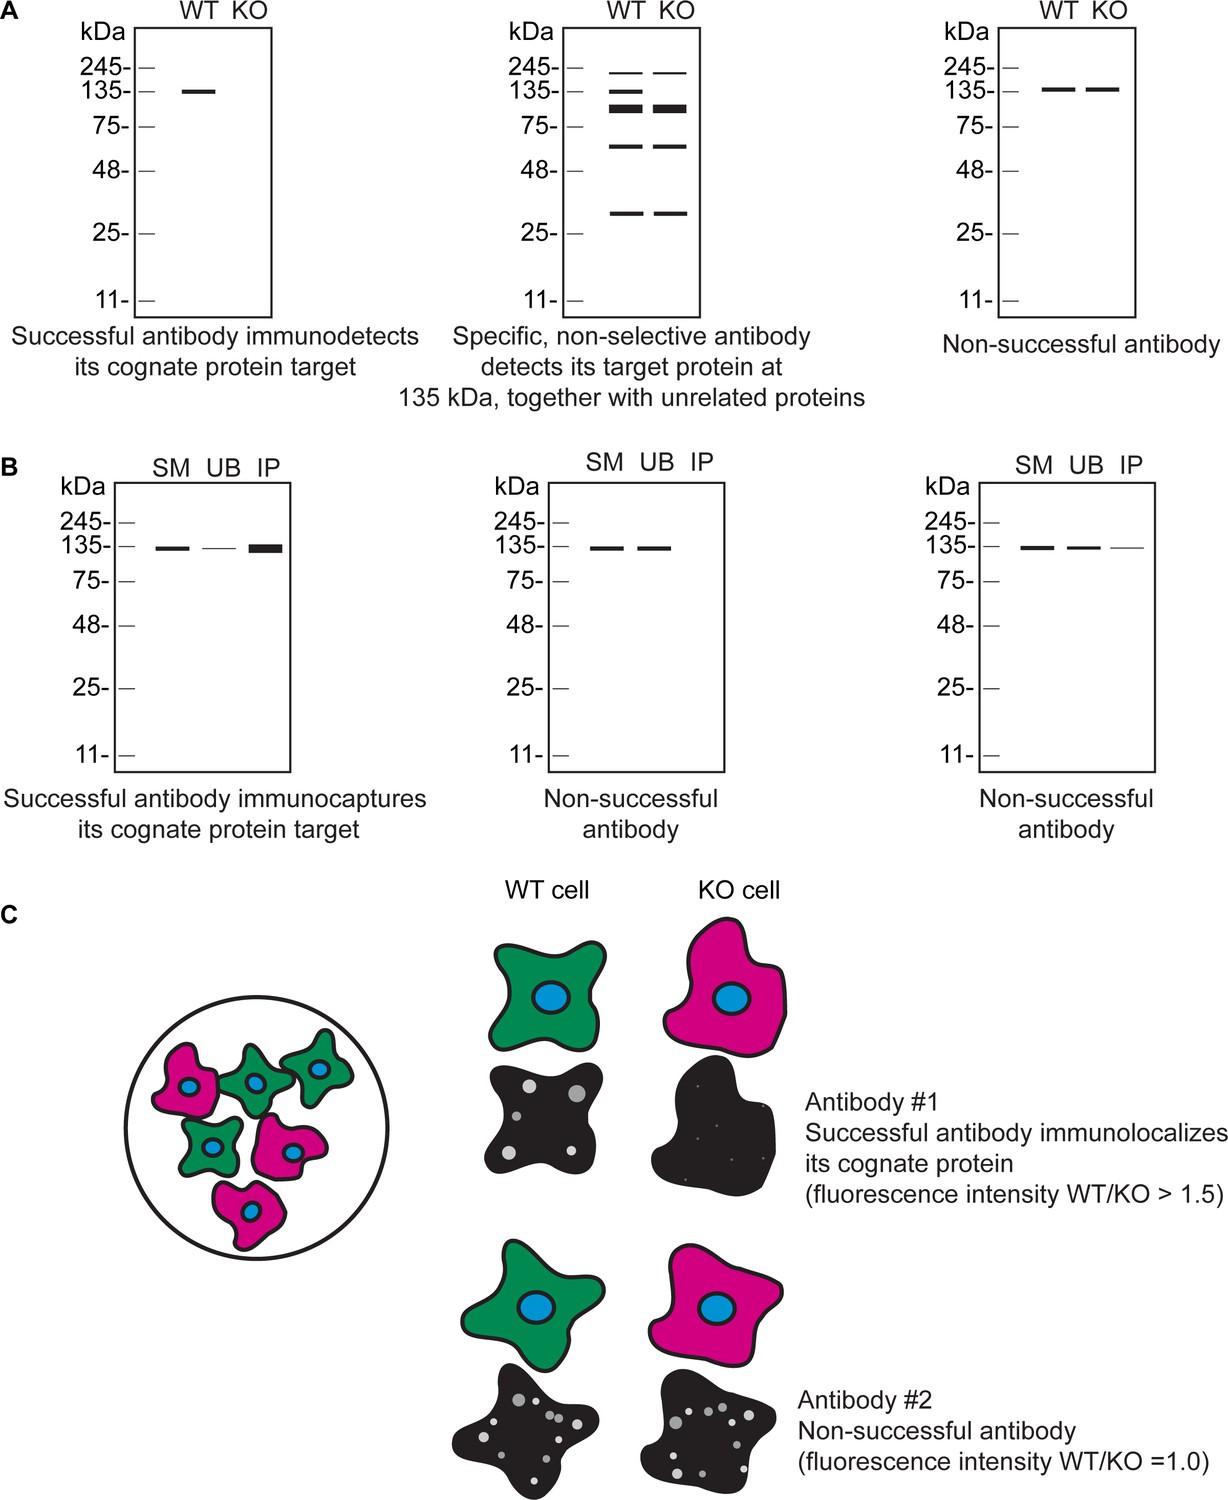
Schematic representations of antibody performance.
(A) Schematic representations of a successful antibody (left schematic), specific, non-selective antibody (middle schematic), and a non-successful antibody (right schematic) for WB. (B) Schematic representations of a successful antibody (left schematic) and non-successful antibodies (middle and right schematics) for IP. (C) Schematic representation of the mosaic strategy used (left schematic). WT cells are labelled with a fluorescent cell dye (green), and KO cells are labelled with a different fluorescent cell dye (magenta) plated together as a mosaic. Schematic representations of a successful antibody (antibody #1) and a non-successful antibody (antibody #2) for IF are shown.
Figure 2
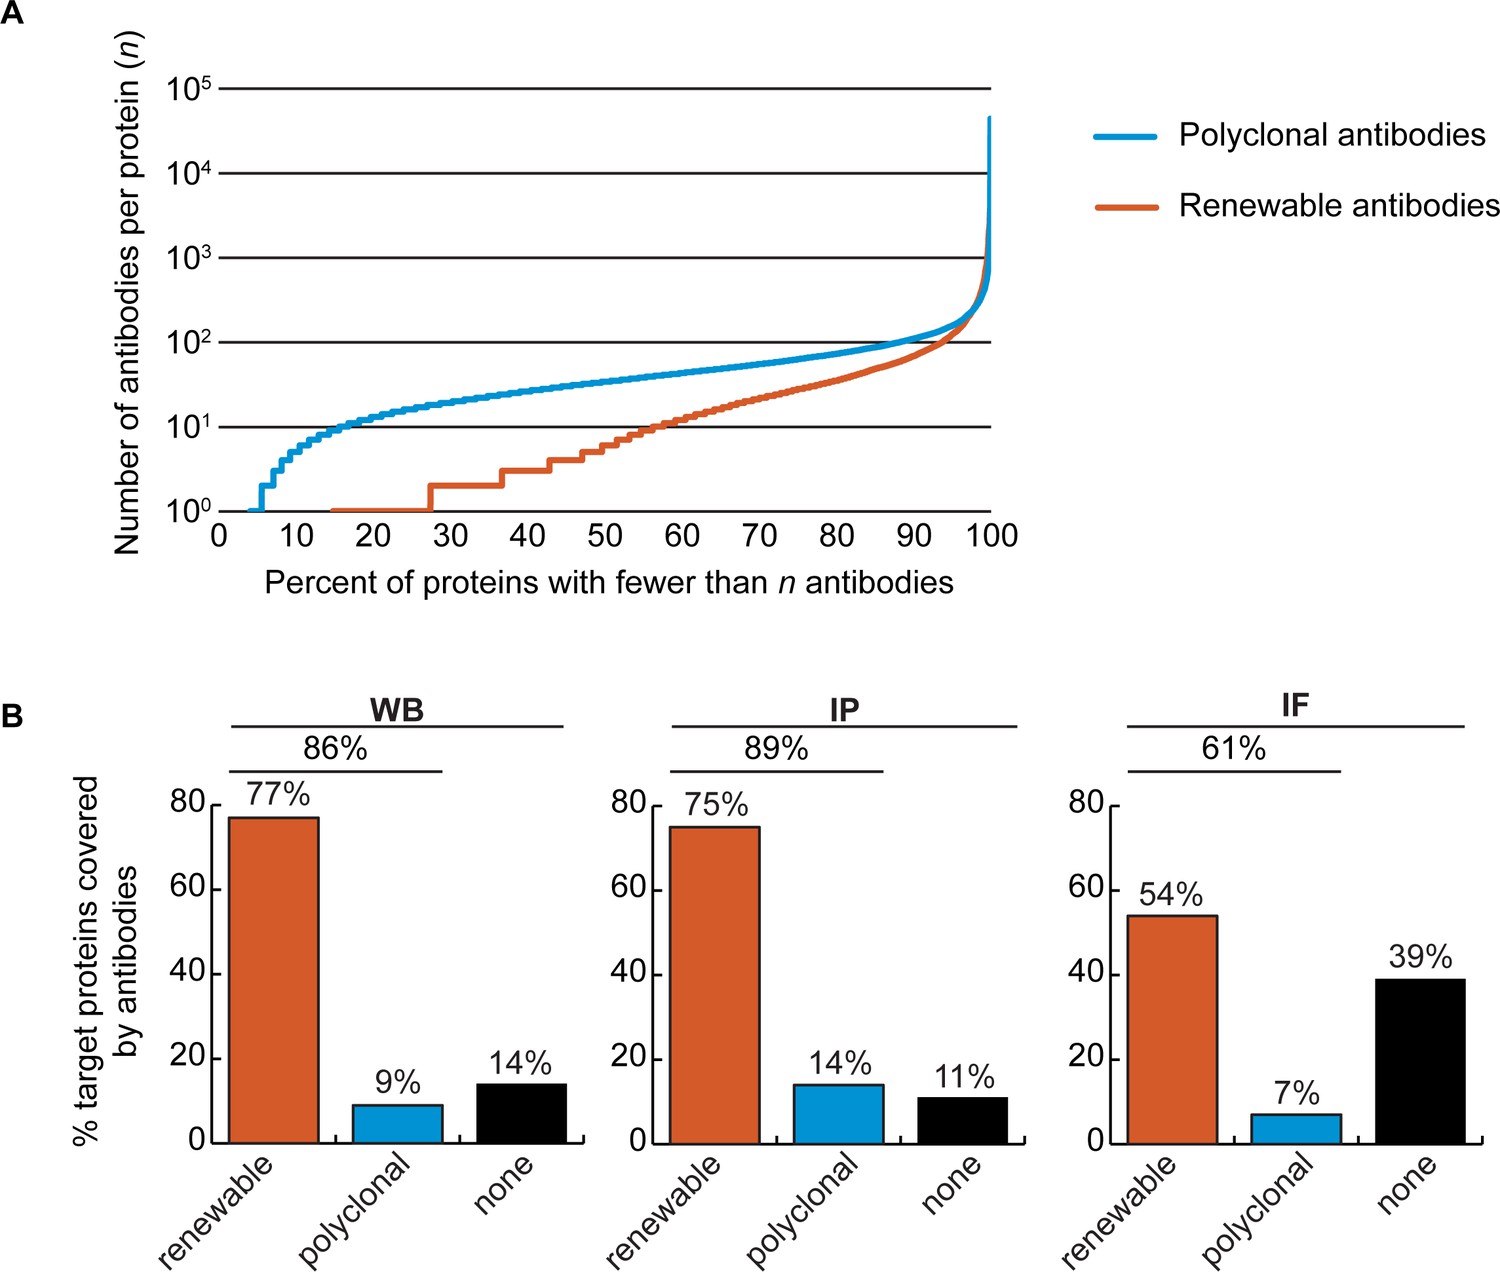
Analysis of human protein coverage by antibodies.
(A) Cumulative plot showing the percentage of the human proteome that is covered by polyclonal antibodies (blue line) and renewable antibodies (monoclonal +recombinant; orange line). The number of antibodies per protein was extracted from the Antibody Registry database. (B) Percentage of target proteins covered by minimally one renewable successful antibody (orange column) or covered by only successful polyclonal antibodies (blue column) is shown for each indicated applications using a bar graph. Lack of successful antibody (‘none’) is also shown (black column).
-
Figure 2—source data 1
Number of antibodies per human protein.
The Antibody Registry was queried with a set of Uniprot-derived protein names representing 16,262 human proteins. The number of polyclonal and monoclonal antibodies (representing recombinant and mouse monoclonal antibodies) that match the protein list is shown.
- https://cdn.elifesciences.org/articles/91645/elife-91645-fig2-data1-v2.xlsx
Figure 3 with 1 supplement
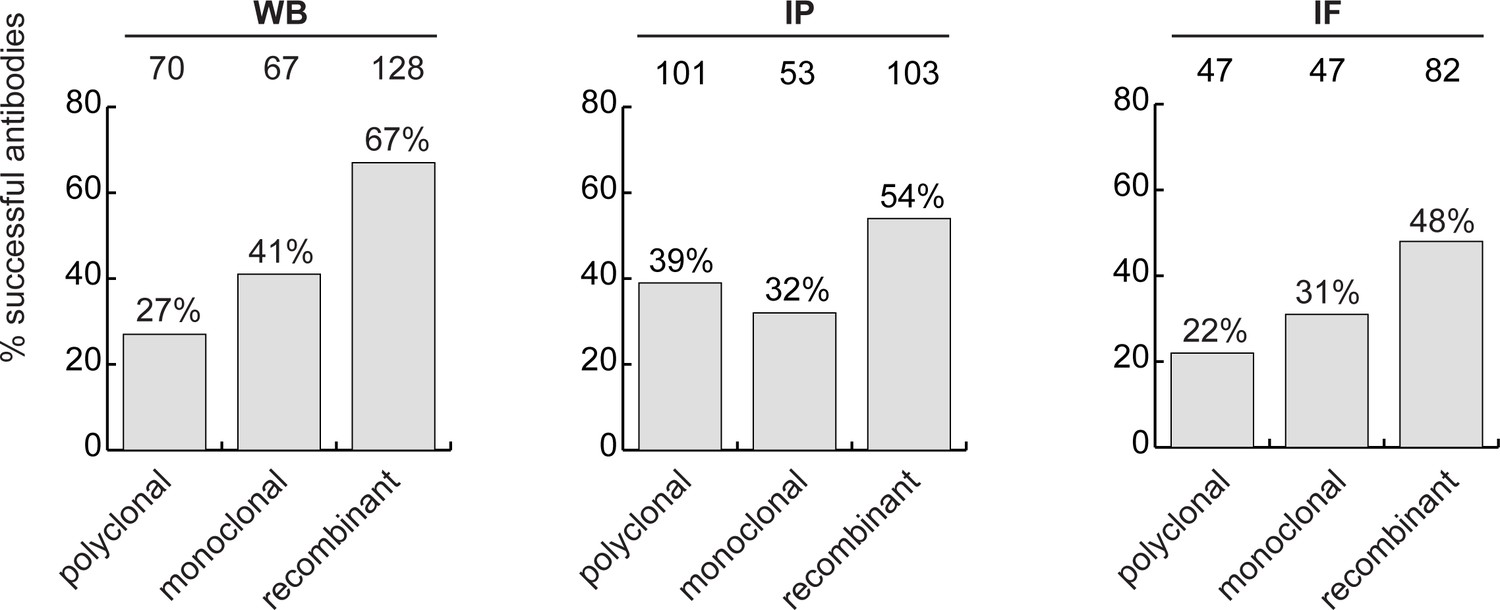
Analysis of antibody performance by antibody types.
The percentage of successful antibodies based on their clonality is shown using a bar graph, for each indicated application. The number of antibodies represented in each category is indicated above the corresponding bar.
Figure 3—figure supplement 1
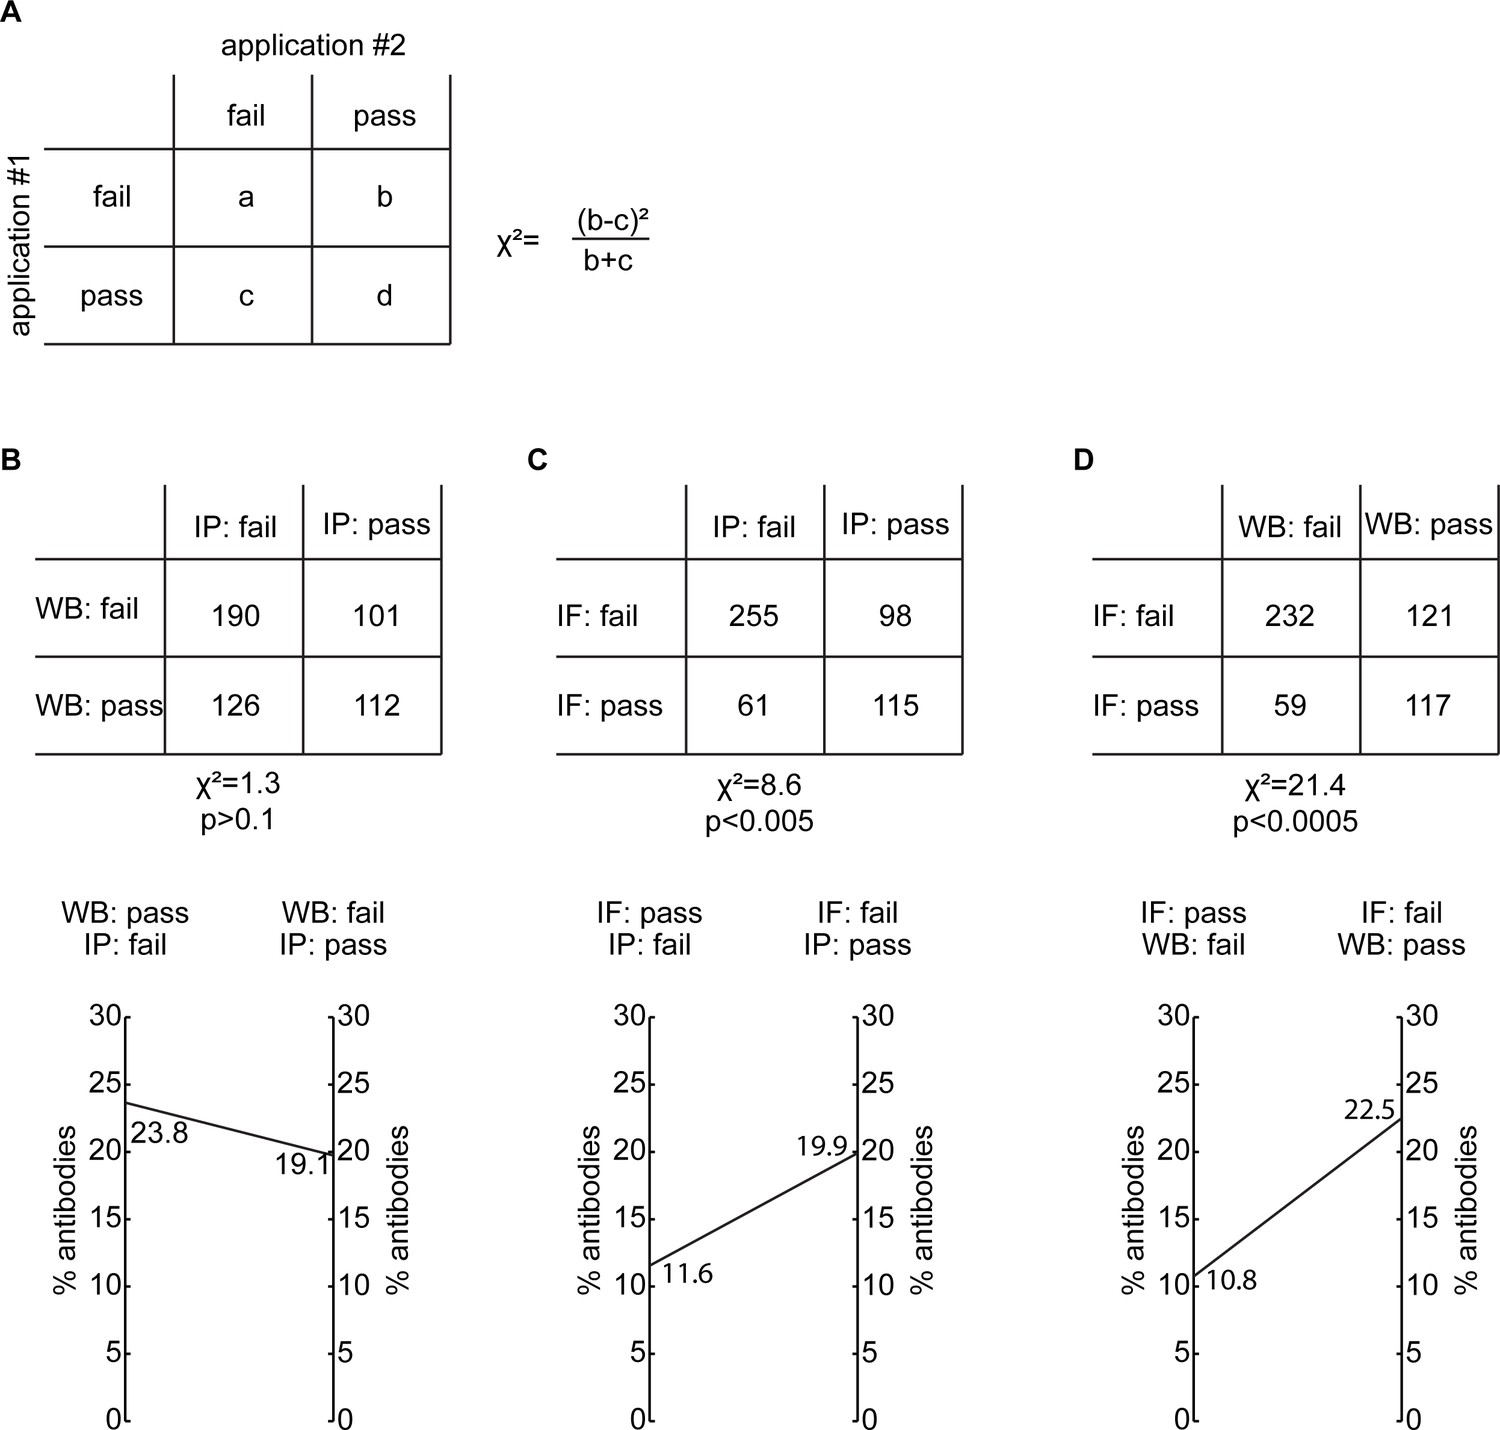
Correlation of antibody performance between applications.
(A) Representation of a 2x2 contingency table used to apply the McNemar Test as well as the equation of the chi-square (Χ2) statistic used. Analysis of antibody performance correlation represented as a contingency table and as a double y-axis graph between (B) WB and IP, (C) IF and IP and (D) IF and WB. n/s=non-significant.
Figure 4 with 2 supplements
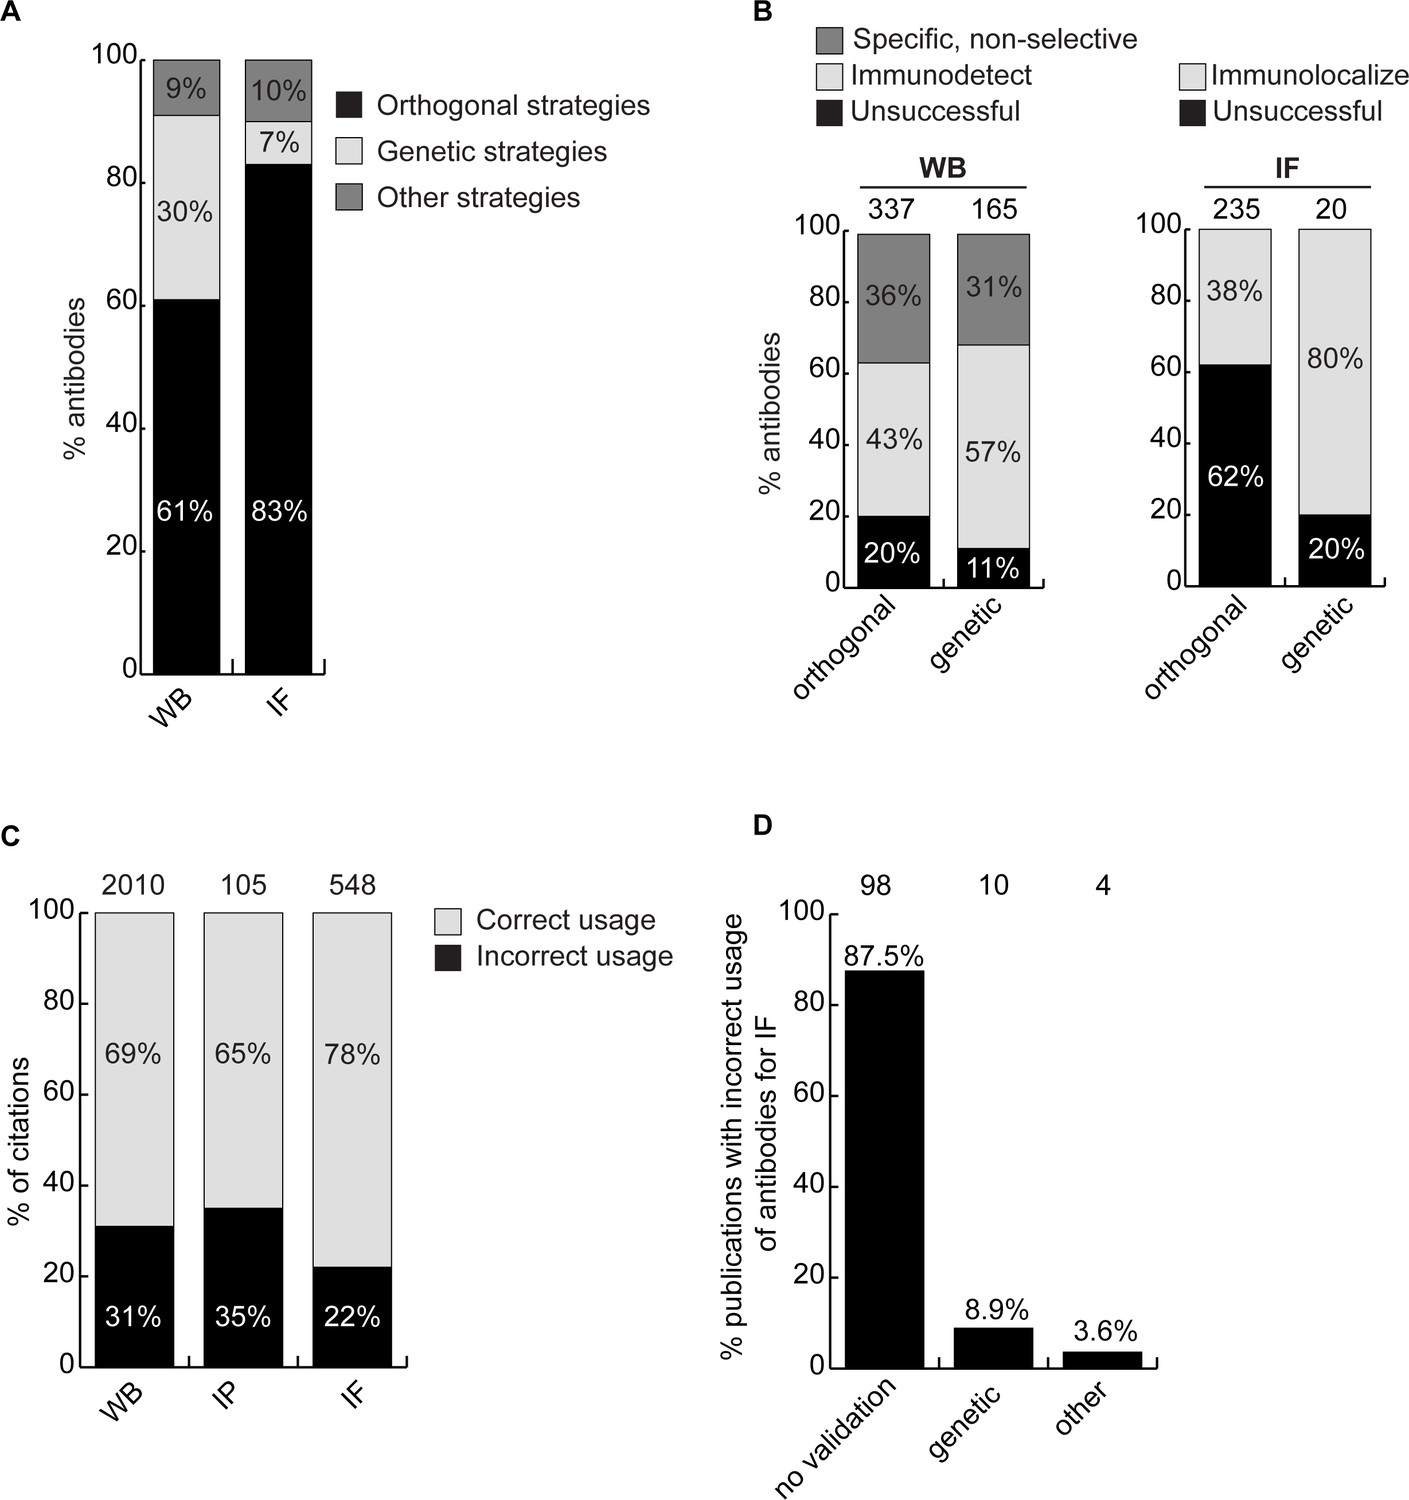
Scientific value of antibody characterization methods and research usage.
(A) Percentage of antibodies validated by suppliers using one of the indicated methods for WB or IF showed using a bar graph with stacked columns. The percentage corresponding to each section of the bar graph is shown directly in the bar graph. Orthogonal = orthogonal strategies, genetic = genetic strategies. (B) Percentage of successful (light gray), specific, non-selective (dark gray-only for WB) and unsuccessful (black) antibodies according to the validation method used by the manufacturer for WB and IF as compared to the KO strategy used in this study. Data are shown using a bar graph with stacked columns. The percentage corresponding to each section of the bar graph is shown directly in the bar graph. The number of antibodies analyzed corresponding to each condition is shown above each bar. (C) Percentage of publications that used antibodies that successfully passed validation (correct usage) or to antibodies that were unsuccessful in validation (incorrect usage) showed using a bar graph with stacked columns. The number of publications was found by searching CiteAb. The percentage corresponding to each section of the bar graph is shown in the bar graph and the number of publications represented in each category is shown above the corresponding bar. (D) Percentage of publications that used an unsuccessful antibody for IF from (C) that provided validation data for the corresponding antibodies. Data is shown as a bar graph. The number of publications represented in each category is shown above the corresponding bar.
Figure 4—figure supplement 1
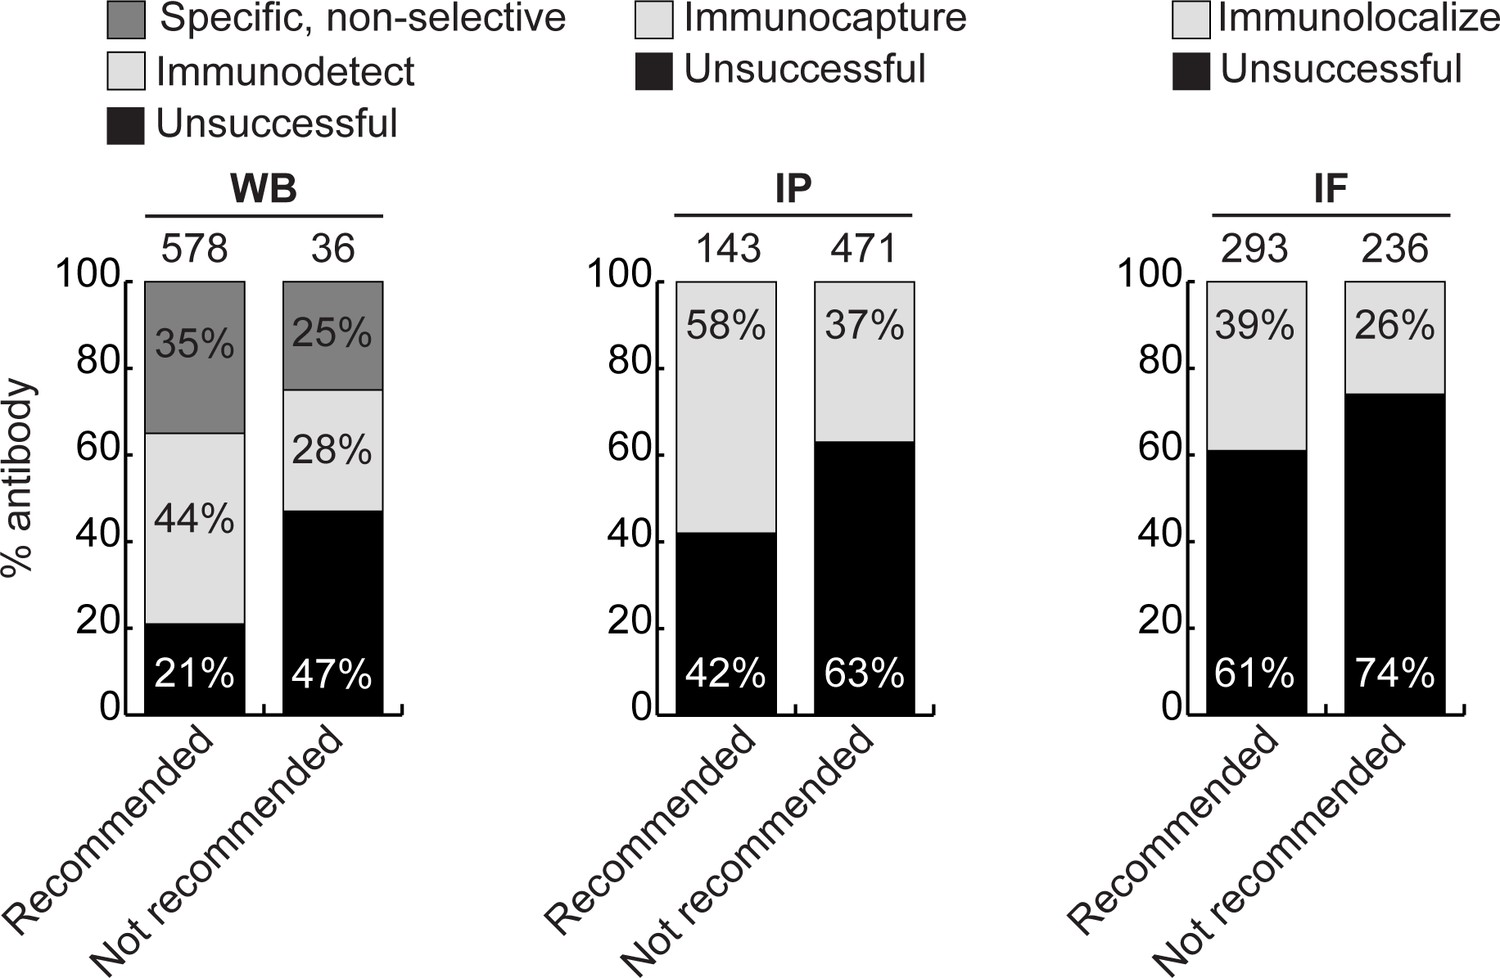
Analysis of antibody performance by manufacturer’s catalogue recommendation.
Percentage of successful or unsuccessful antibodies for the indicated applications are shown using a bar graph with stacked columns. Antibodies were divided according to whether they were recommended or not recommended by the manufacturers for the indicated applications. The percentage corresponding to each section of the bar graph is shown in the graph, and the total number of antibodies represented in each category is indicated above the corresponding bar.
Figure 4—figure supplement 2

Actions taken from participating companies.
The percentage of antibodies removed from the market, or for which catalogue recommendations were modified following assessment of our data by our antibody manufacturing partners. The number of antibodies represented in each category is indicated above the corresponding bar.
Figure 5
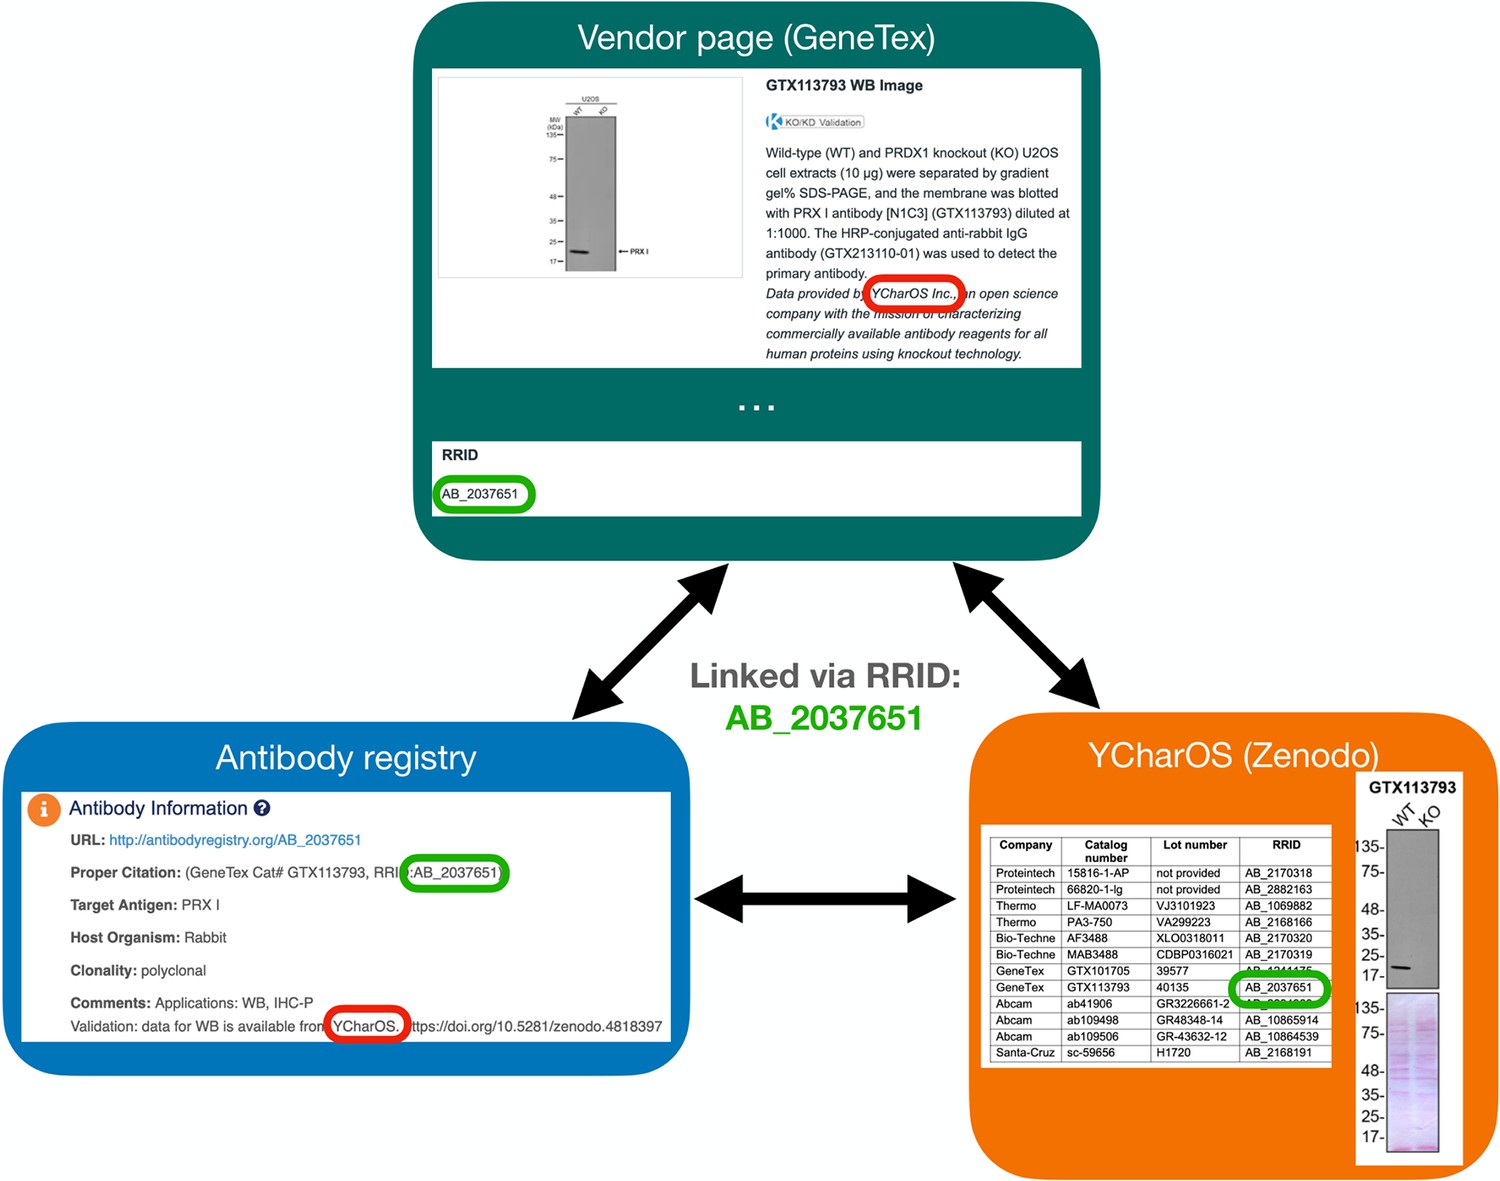
Accessing antibody characterization data using RRIDs.
An antibody RRID can be used to search characterization studies across various databases, such as the vendor page, the Antibody Registry and on the YCharOS community page on ZENODO. AB_2037651 is given as an example.
Tables
Table 1
Antibody performance criteria.
| Definition | |
|---|---|
| Successful antibody for western blot | A successful primary antibody immunodetects the target protein, and the signal observed in the WT lysate is lost in the KO lysates (Figure 1—figure supplement 1A). The antibody does not recognize other proteins under the conditions tested. |
| Specific, non-selective antibody for western blot | The primary antibody specifically recognizes the target protein, but also unrelated protein(s) (Figure 1—figure supplement 1A). |
| Successful antibody for immunoprecipitation | Under the conditions used, a successful primary antibody immunocaptures the target protein to at least 10% of the starting material (Figure 1—figure supplement 1B). |
| Successful antibody for immunofluorescence | A successful primary antibody immunolocalizes the target protein by generating a fluorescence signal in WT cells that is at least 1.5-fold higher than the signal in KO cells (Figure 1—figure supplement 1C). Signal provided by such antibody staining can be easily distinguished from unspecific background and noise. |
Additional files
Download links
A two-part list of links to download the article, or parts of the article, in various formats.
Downloads (link to download the article as PDF)
Open citations (links to open the citations from this article in various online reference manager services)
Cite this article (links to download the citations from this article in formats compatible with various reference manager tools)
Scaling of an antibody validation procedure enables quantification of antibody performance in major research applications
eLife 12:RP91645.
https://doi.org/10.7554/eLife.91645.2


