Recent evolutionary origin and localized diversity hotspots of mammalian coronaviruses
- Institut de Biologie de l'École Normale Supérieure (IBENS), École Normale Supérieure, CNRS, INSERM, Université PSL, France
- Departamento de Ecologia, Instituto de Biociências, Universidade Federal do Rio Grande do Sul, Brazil
- Institut de Systématique, Évolution, Biodiversité (ISYEB), Muséum national d’histoire naturelle, CNRS, Sorbonne Université, EPHE, UA, France
- Institut Pasteur, Université Paris Cité, Bioinformatics and Biostatistics Hub, France
Figures
Figure 1
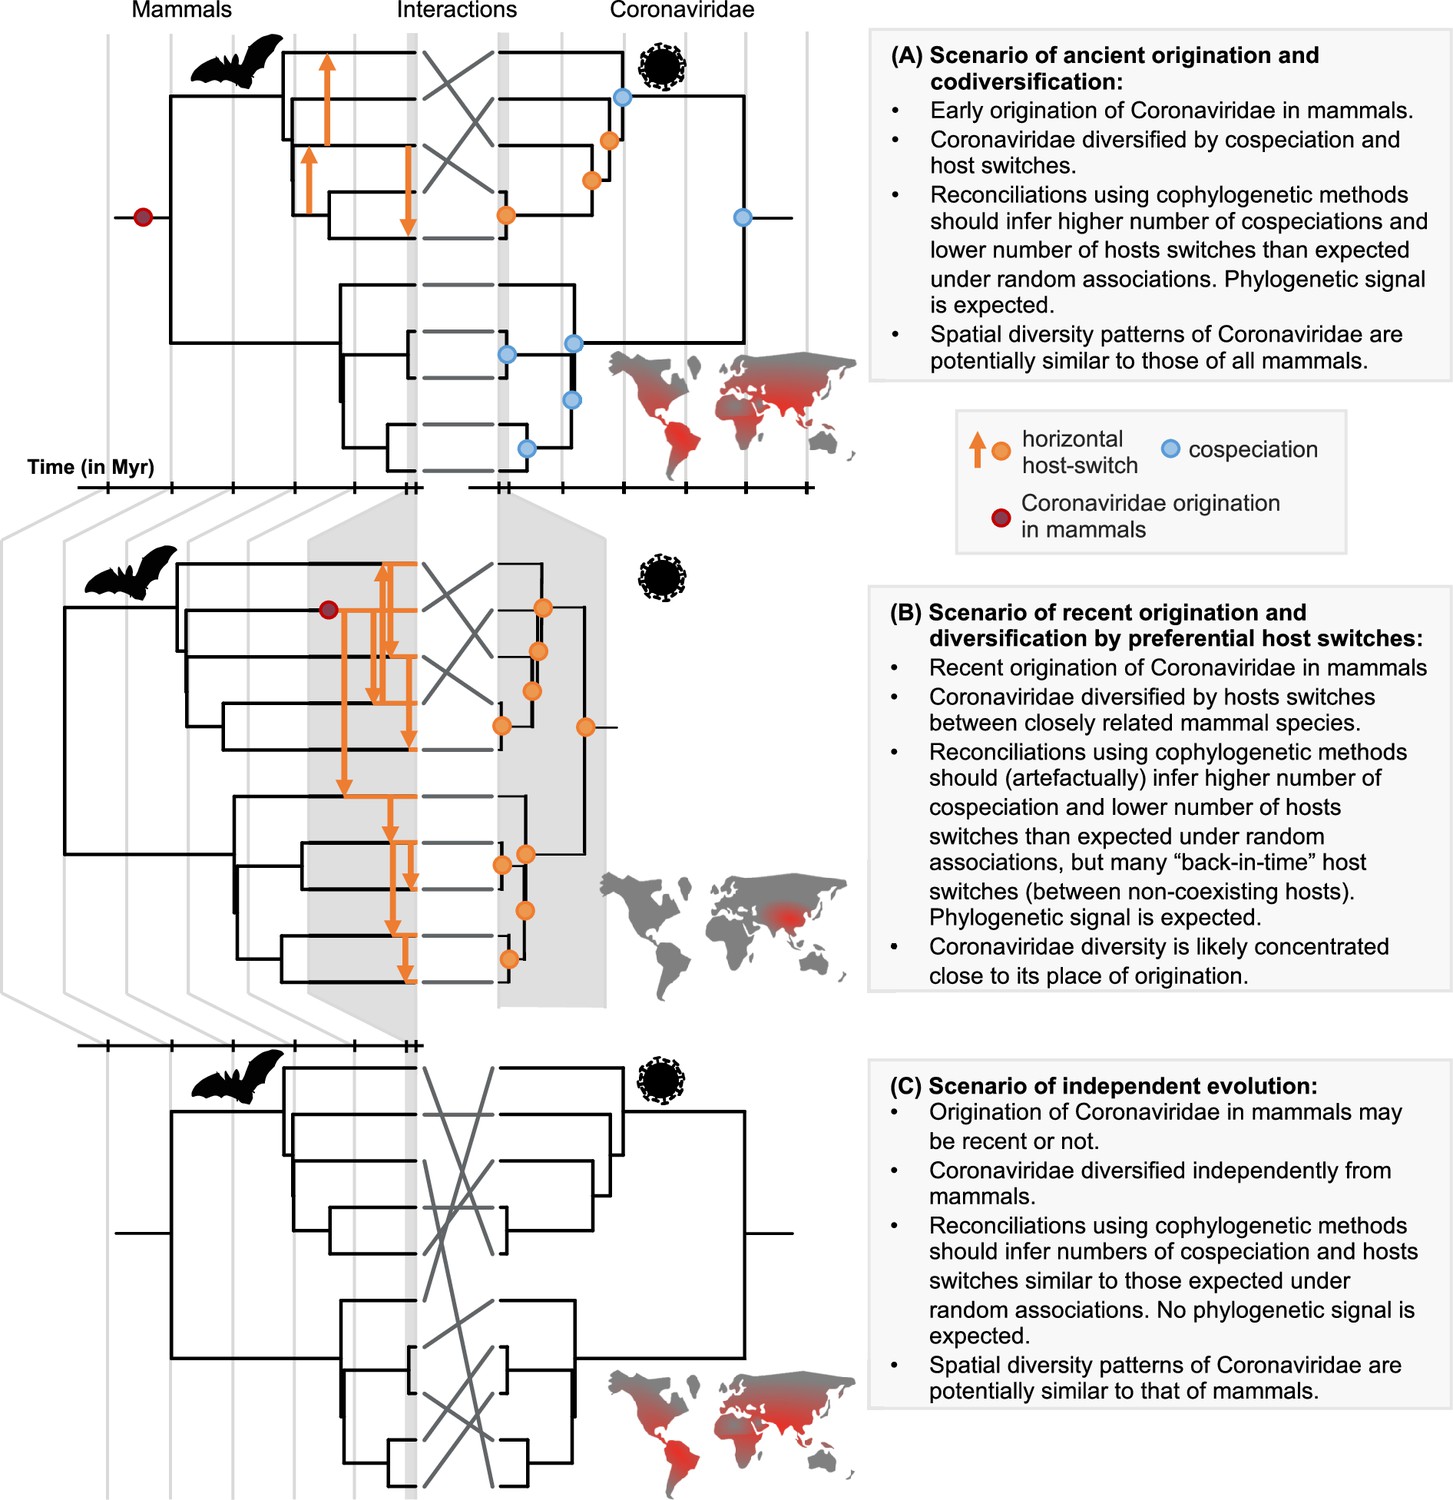
A framework for testing scenarios of virus-host evolution, illustrated with the example of Coronaviridae and their mammalian hosts.
In (A), a scenario of ancient origination and codiversification; in (B) a scenario of recent origination and diversification by preferential host switches; and in (C) a scenario of independent evolution. For each scenario, we indicate the associated predictions in the grey boxes. Contrary to scenario C, both scenarios A and B are expected to generate a cophylogenetic signal, i.e. closely-related coronaviruses tend to infect closely-related mammals, resulting in significant reconciliations when using topology-based probabilistic cophylogenetic methods, such as the undated version of ALE, Jane, or eMPRess. However, we expect scenario B to be distinguishable from scenario A in terms of the time consistency of host-switching events. Under scenario B, cophylogenetic methods wrongly estimate a combination of cospeciations and ‘back-in-time’ host switches (see Materials and methods and Results). We also expect different biogeographic patterns under the different scenarios, as illustrated by the maps, where the color gradient represents diversity levels (red: high diversity, grey: low diversity).
Figure 2 with 3 supplements
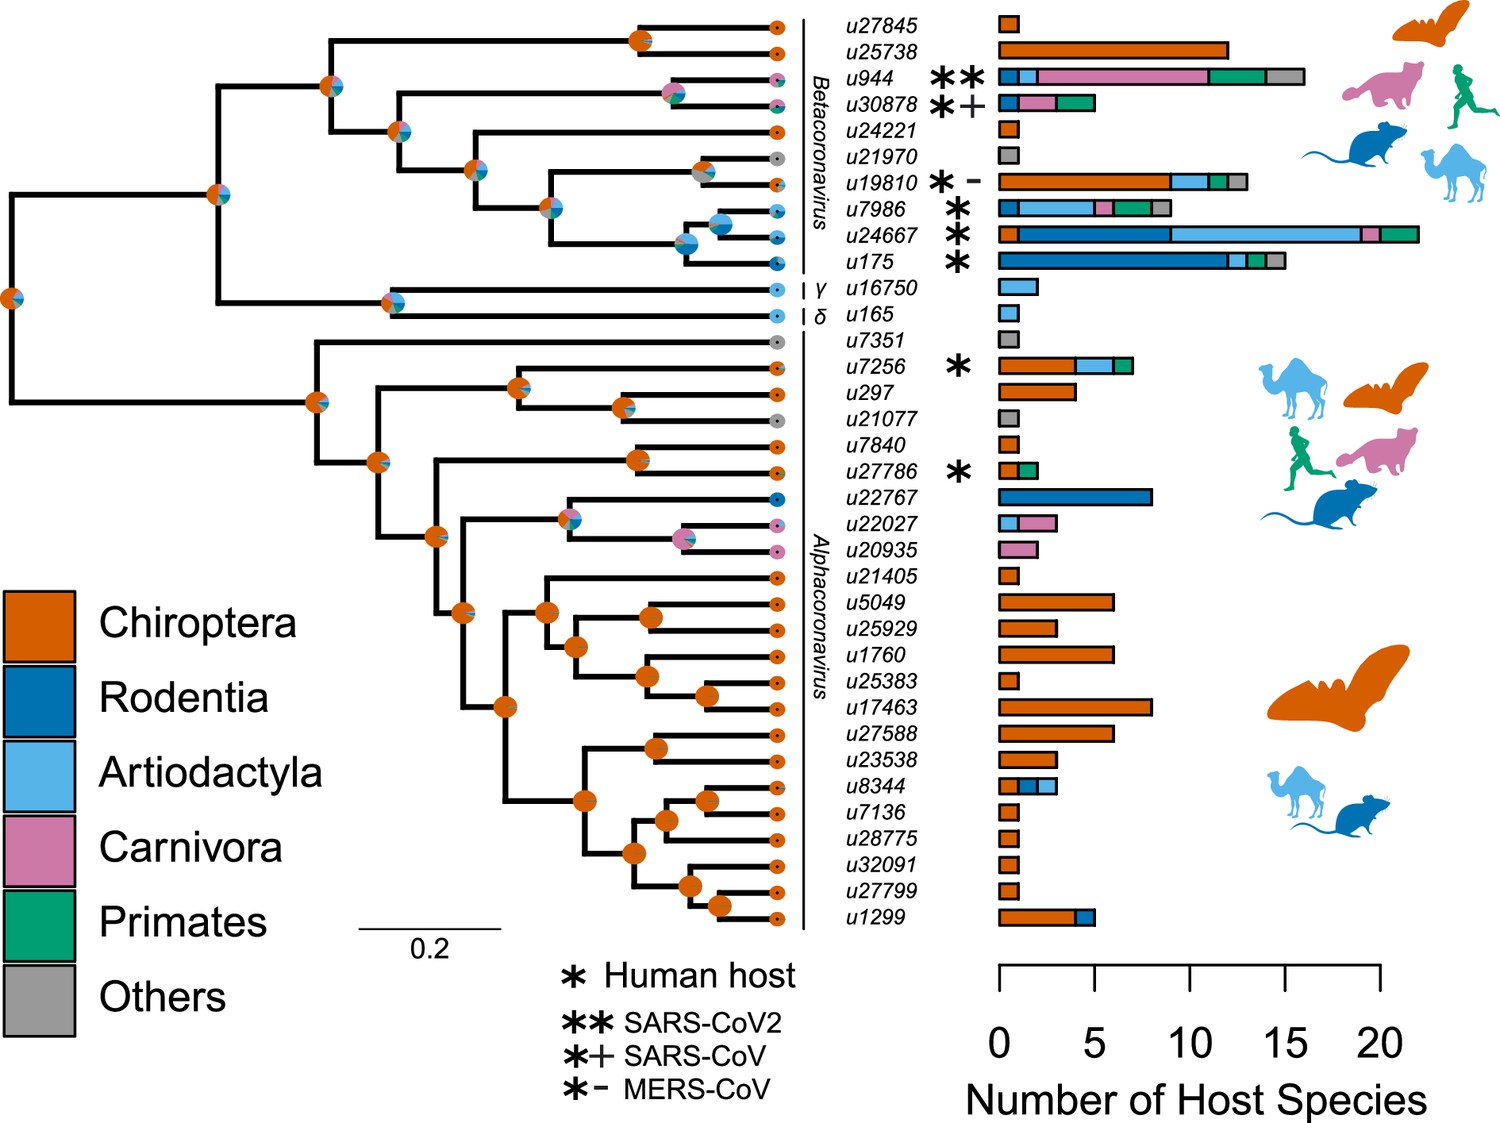
Species-level relationships among coronaviruses and their associated mammalian hosts.
The Maximum Clade Credibility phylogenetic tree of coronaviruses, reconstructed with BEAST2 based on 150-aa palmprint amino acid sequences of the RdRp gene, is shown on the left. sOTUs of Coronaviridae followed the definition of the Serratus project. The branching order of four genera of coronaviruses, Beta, Gamma, Delta, and Alphacoronaviruses, is shown. Bar scale is in units of aa substitution. On the right, a barplot gives the number of total mammalian host species and the number of host species by main mammalian order. Ancestral states on the left were obtained for illustrative purposes with the make.simmap function of the phytools R package (Revell, 2012). Mammal silhouettes taken from open-to-use sources in https://www.phylopic.org, detailed credits given in Supplementary file 1h.
Figure 2—figure supplement 1
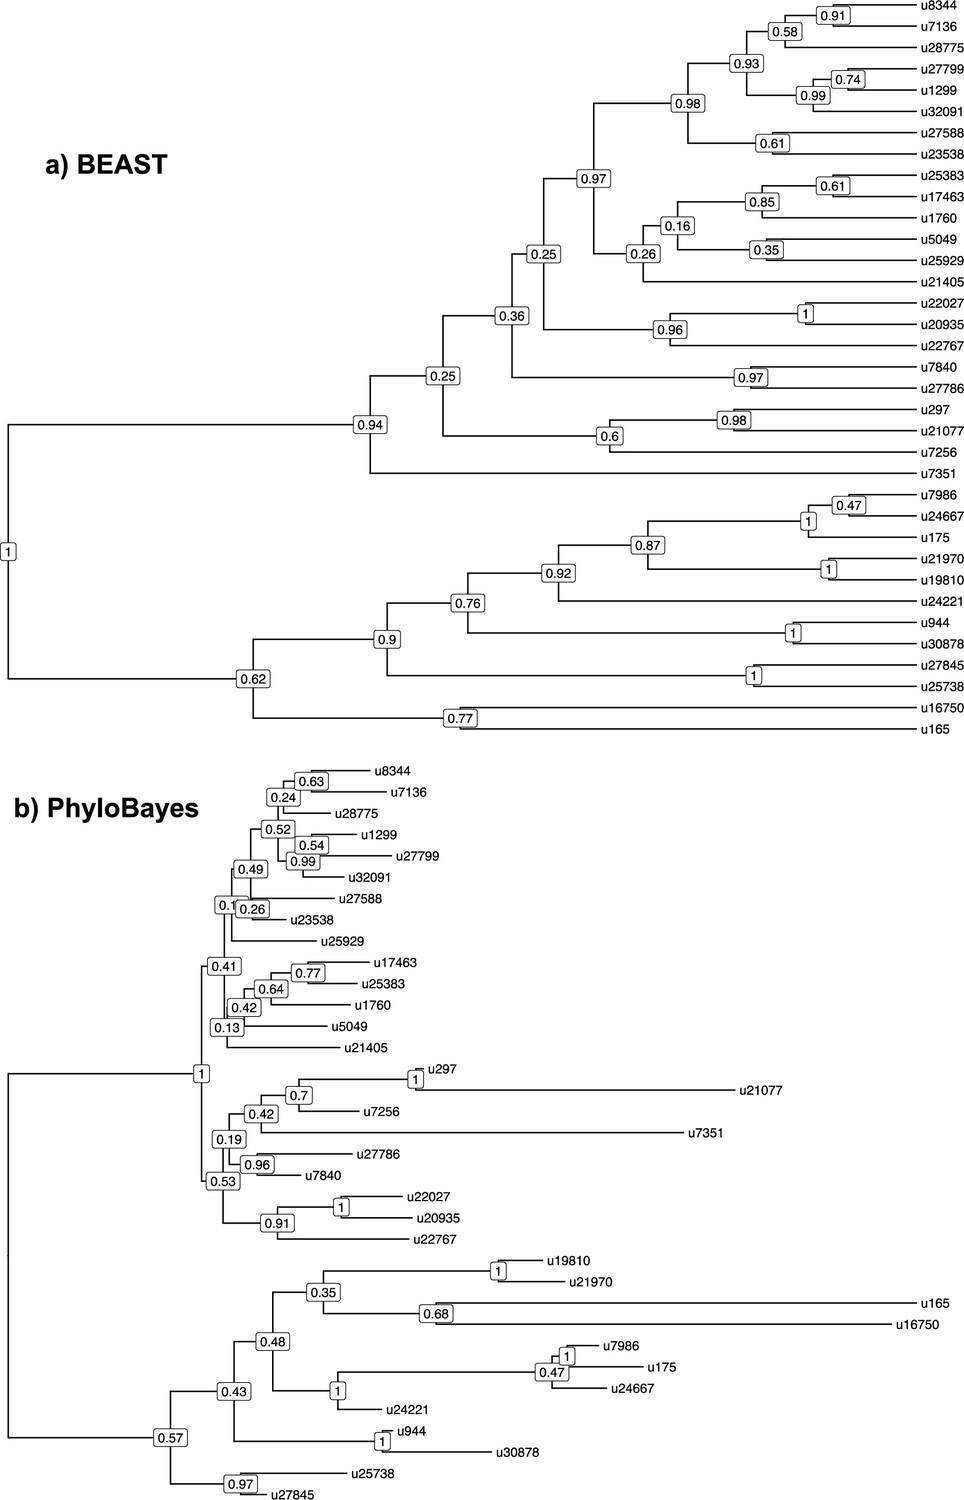
Phylogenetic relationships among coronaviruses sOTUs.
Consensus Coronaviridae tree constructed in (a) BEAST2 and (b) PhyloBayes using the palmprint amino acid sequence information of the 35 sOTUs of coronaviruses infecting mammals. We pruned out multiple sequences per sOTU in the PhyloBayes tree (that we included for reconciliation analyses) to represent a OTU-level tree comparable the one obtained with BEAST2. u16750 corresponds to gammacoronaviruses, and u165 to deltacoronaviruses; the top subtrees correspond to alphacoronaviruses while the bottom subtrees correspond to betacoronaviruses.
Figure 2—figure supplement 2
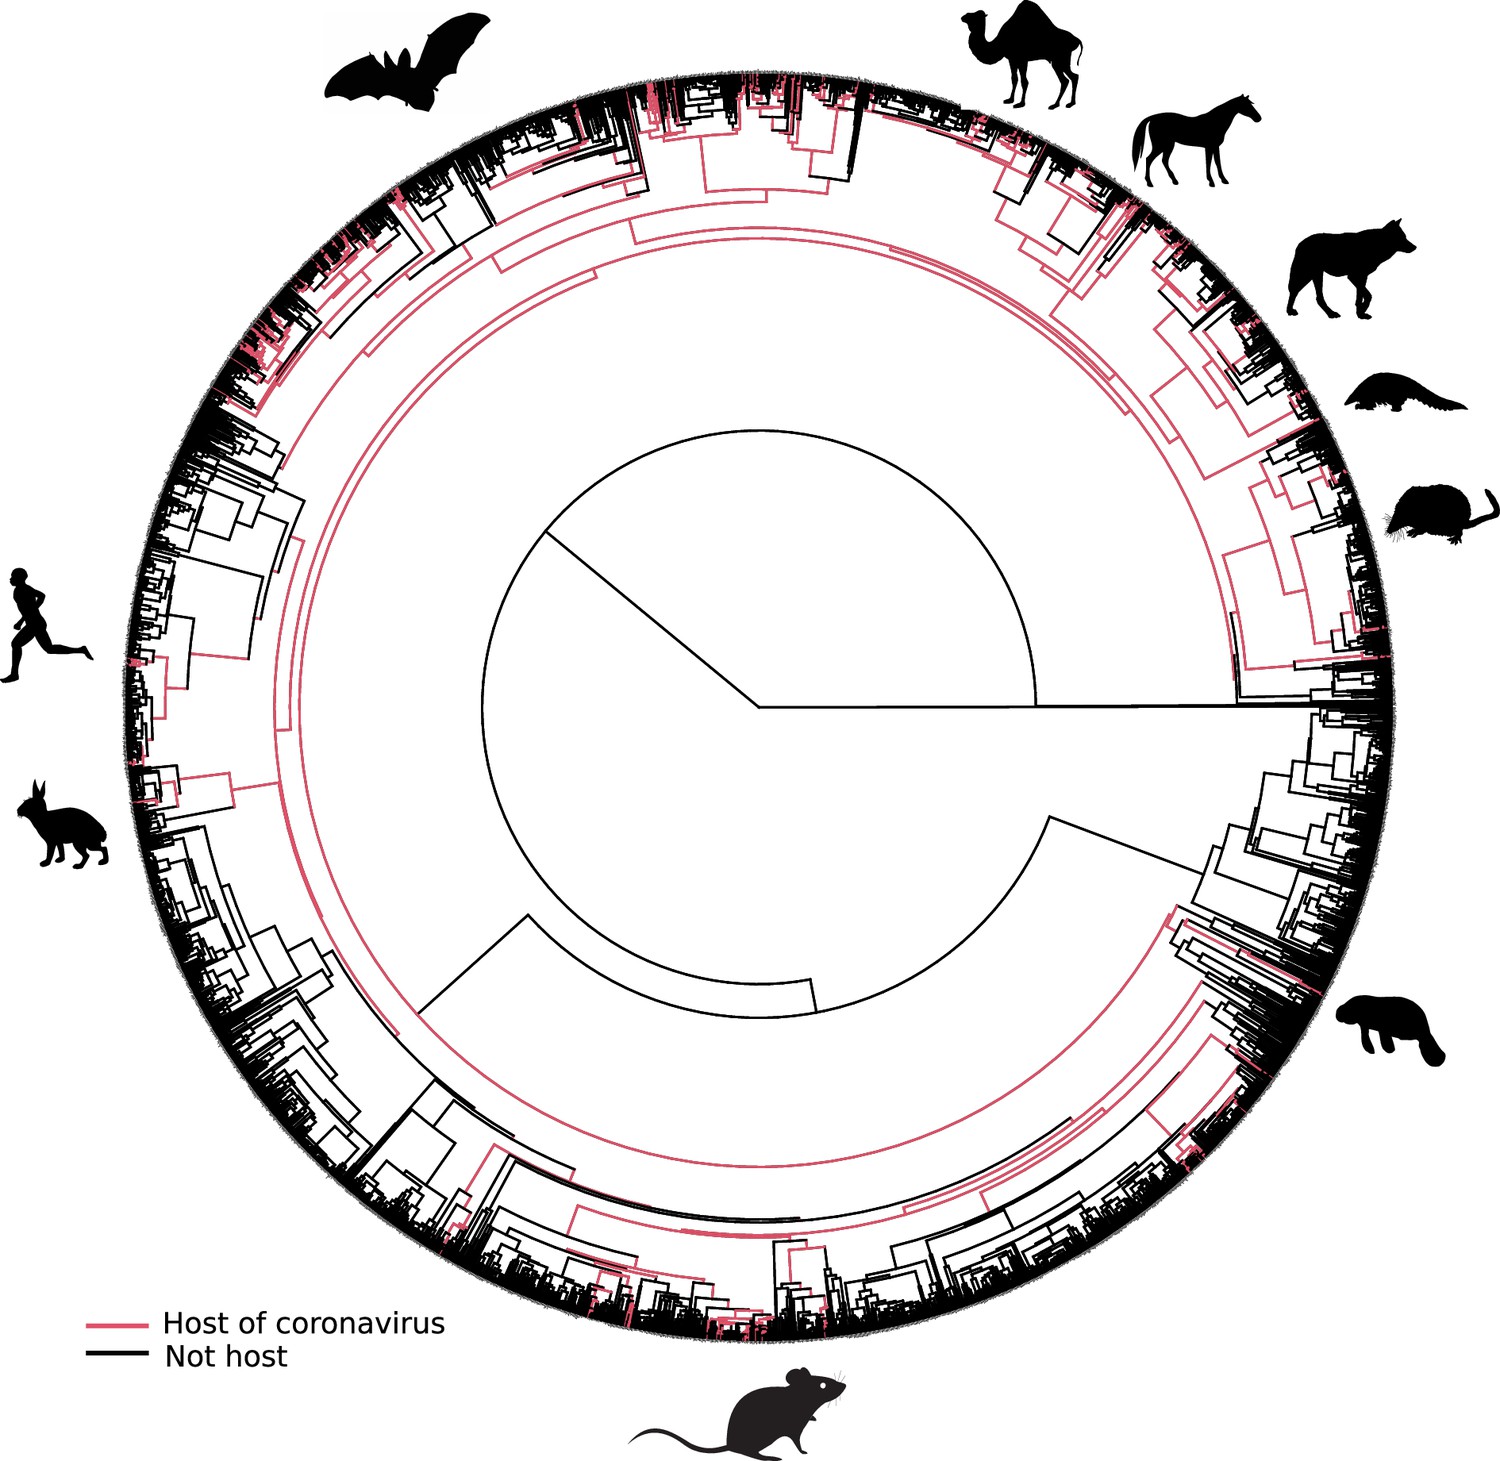
Mammalian hosts of coronaviruses are shown within the full mammalian tree.
Mammalian tree with tip branches painted in red according to the species that are hosts of coronaviruses. Ancestral branches directly linked to the path toward terminal hosts were painted as well. Mammal silhouettes taken from open-to-use sources in https://www.phylopic.org, detailed credits given in Supplementary file 1h.
Figure 2—figure supplement 3
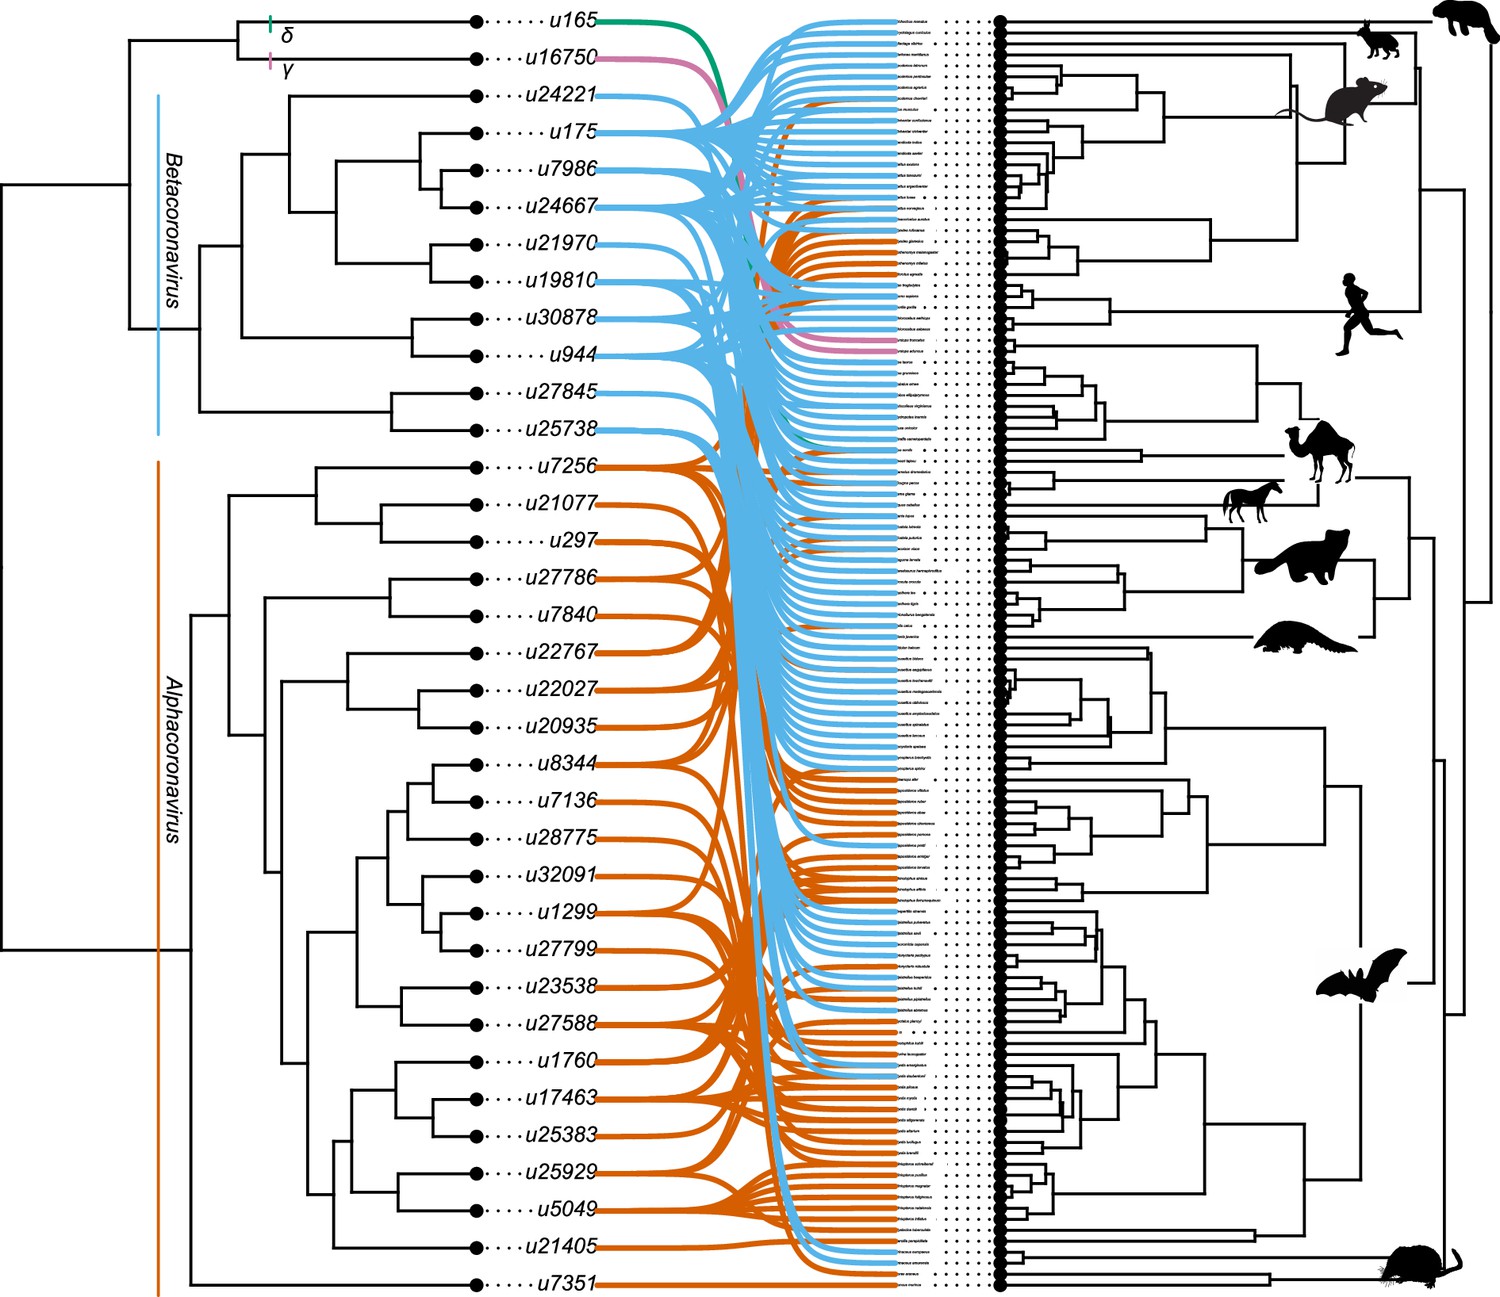
The association between coronaviruses and their mammalian hosts.
Coronaviruses tree on the left and mammalian tree on the right. The connections between coronaviruses and their hosts are shown with lines. Lines of different colors indicate different genera of coronaviruses (Betacoronaviruses in blue, Alphacoronaviruses in Orange). Mammal silhouettes taken from open-to-use sources in https://www.phylopic.org/, detailed credits given in Supplementary file 1h.
Figure 3 with 1 supplement

A network visualization of mammal-coronavirus interactions reveals the presence of phylogenetic signal, the isolation of bats, and the centrality of humans.
Species-level network representation of the interactions between mammal species and coronavirus sOTUs. Colored round nodes represent mammal species (colors indicate the mammalian order) and grey squared nodes correspond to coronavirus sOTUs. The position of the nodes reflects their similarity in interaction partners, i.e. the tendency of clustering of mammals belonging to the same order can be interpreted as the presence of phylogenetic signal in species interactions. Humans and SARS-Cov-2 are presented using bigger nodes. The plot was obtained using the Fruchterman-Reingold layout algorithm from the igraph R-package.
Figure 3—figure supplement 1
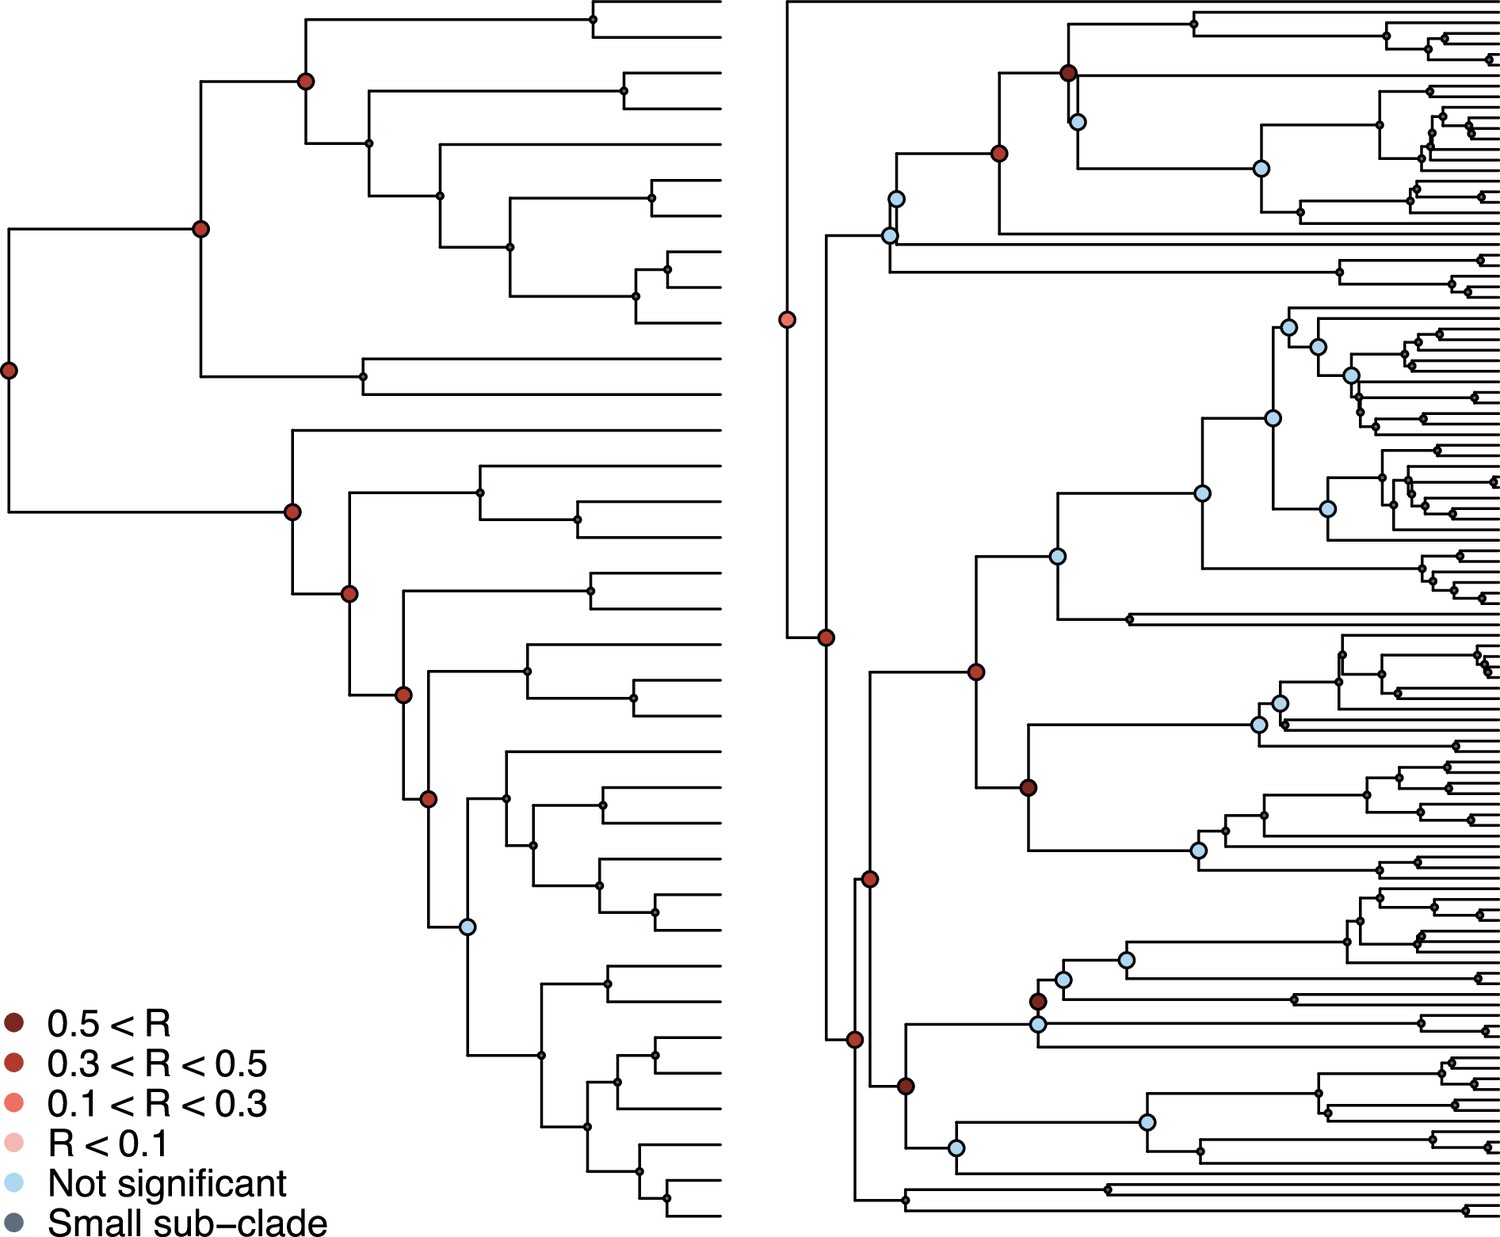
Phylogenetic signal in the association between coronaviruses and their mammalian hosts.
Coronaviruses tree on the left and mammalian tree on the right. Subclades tested for phylogenetic signal in the association matrix using Mantel tests are shown (see main text).
Figure 4 with 10 supplements
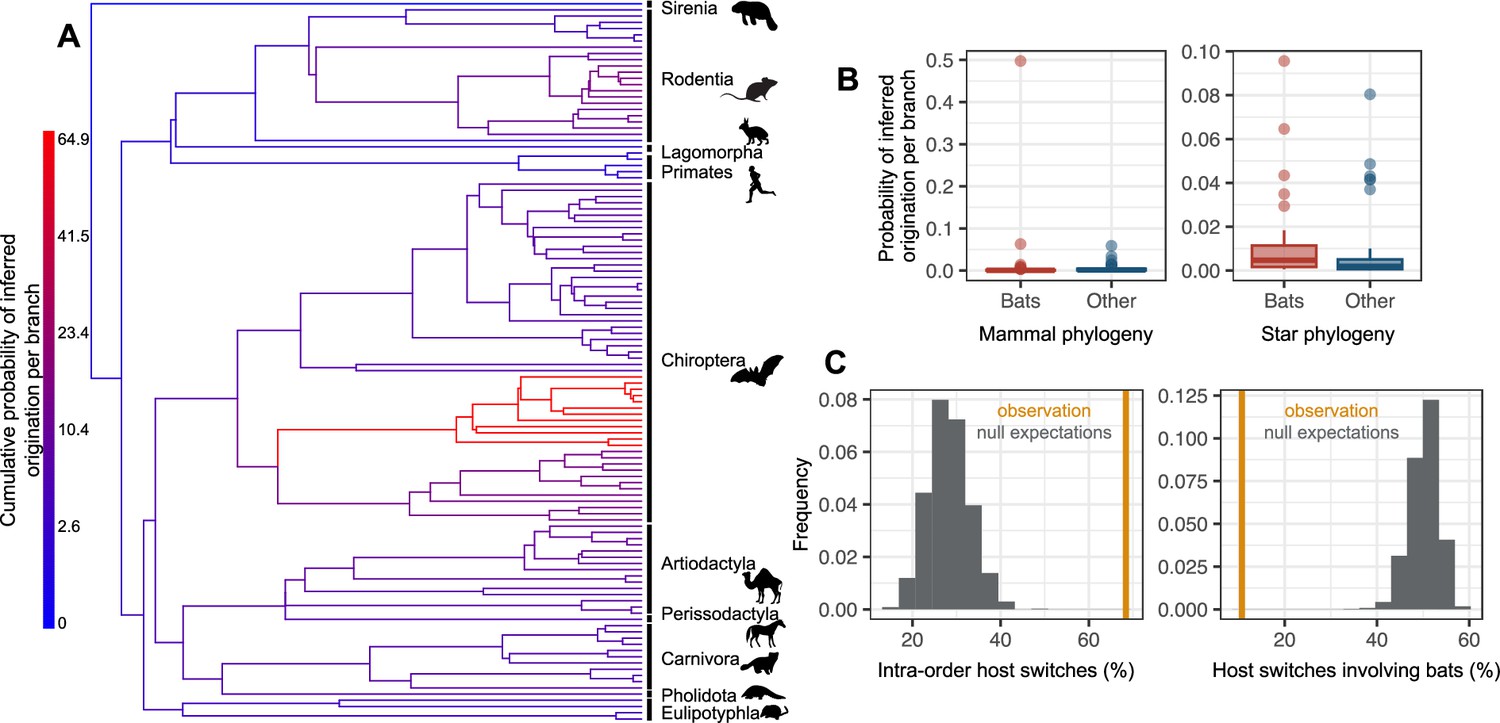
The origination of coronaviruses in mammals is estimated among bats, which tend to form a closed reservoir.
(A) Phylogenetic tree of the mammals with branches colored as the percentage of ALE reconciliations which inferred this branch or its ancestral lineages as the origination of coronaviruses in mammals. Red branches are likely originations, whereas blue branches are unlikely. (B) Boxplots recapitulating the probability of inferred origination per branch in bats versus other mammal orders, with ALE applied on the original mammal tree (left panel) or on the mammal tree transformed into a star phylogeny (right panel), therefore assuming an origination in extant species. (C) Distributions of the percentages of host switches occurring within mammalian orders (left panel) and between-orders involving bats (right panel). Observed values (in orange) are compared to null expectations if host switches were happening at random (in grey). Mammal silhouettes taken from open-to-use sources in https://www.phylopic.org/, detailed credits given in Supplementary file 1h.
Figure 4—figure supplement 1
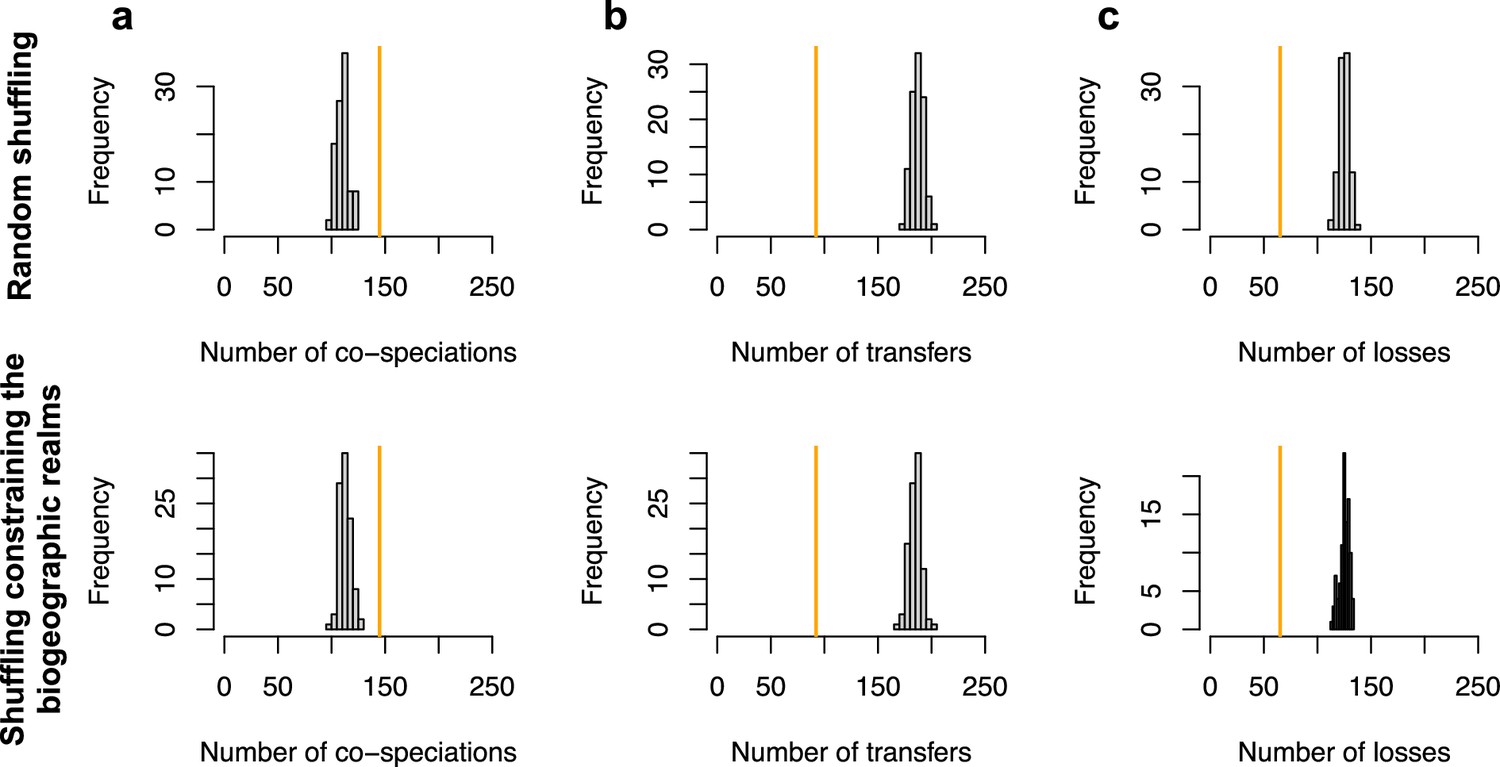
ALE inferred significant reconciliations.
The number of cospeciation events (a), number of host switches (b), or number of losses (c) estimated on the original dataset (in orange) are significantly different from the numbers of events inferred when randomly shuffling the dataset (grey histograms; top row) or when shuffling by conserving mammal biogeography (by only shuffling species belonging the same biogeographic realm; bottom row).
Figure 4—figure supplement 2
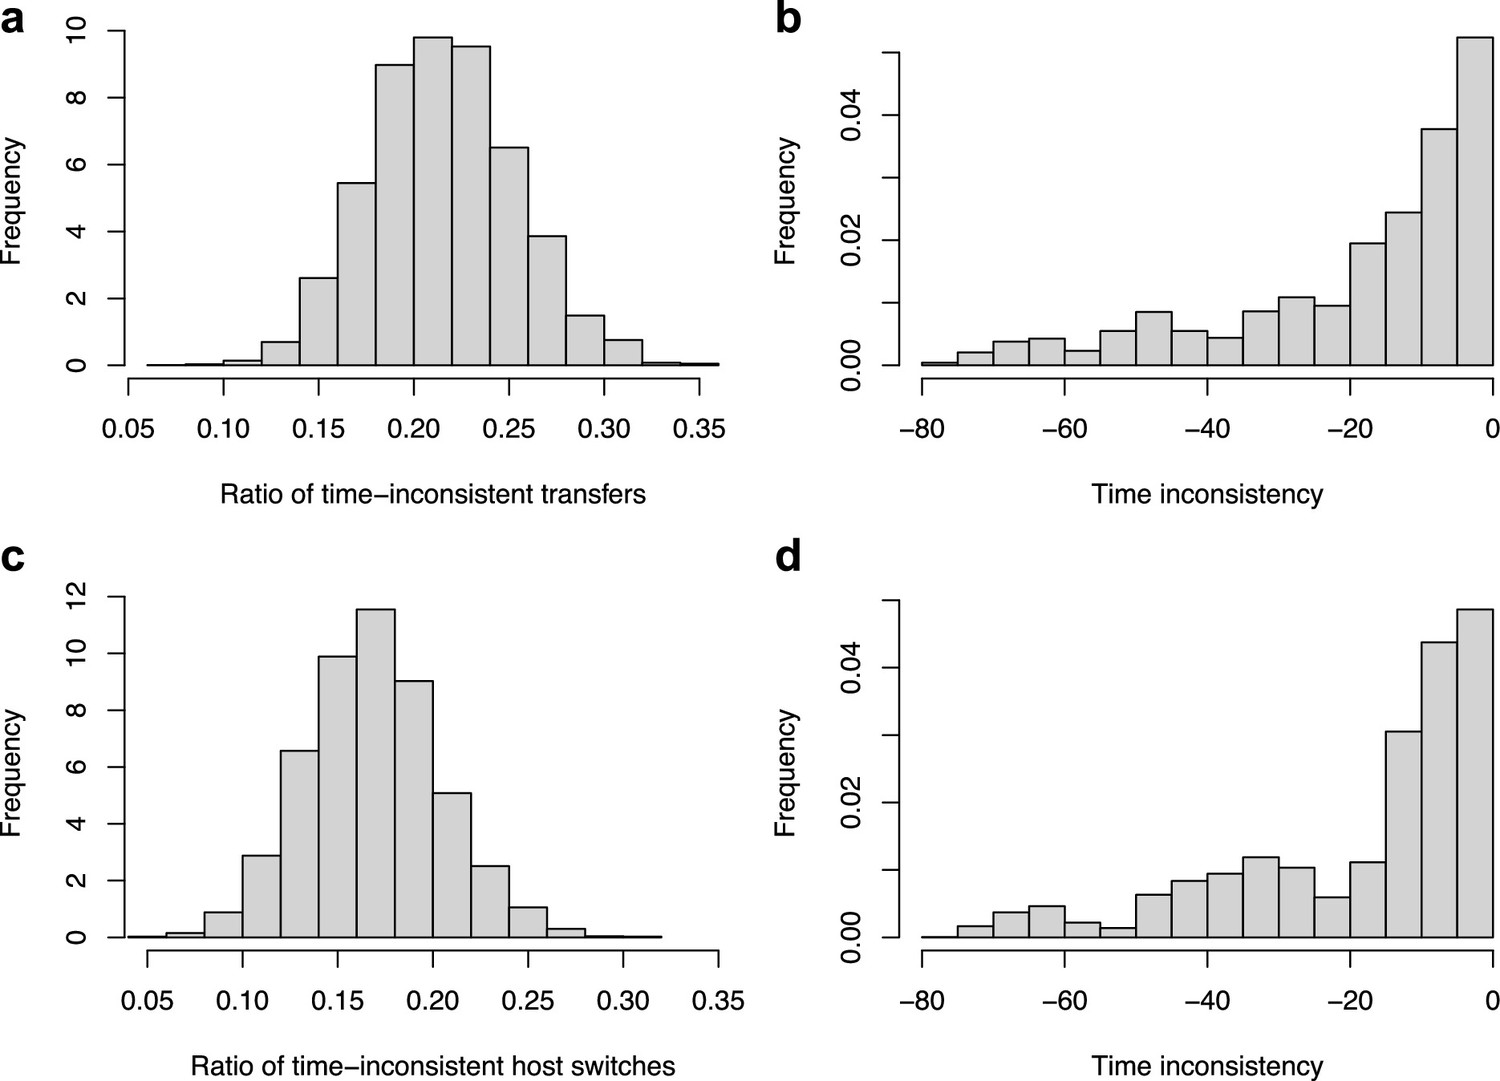
Time-inconsistent host-switches.
ALE inferred a large proportion of time-inconsistent host switches (a–b), which can be not be explained by the uncertainty in node age estimates (c–d). (a) Histogram of the percentage of time-inconsistent host switches in each reconciliation obtained with ALE on the original dataset with the consensus mammal phylogeny. (b) Histogram of the time inconsistency (in Myr) of the inconsistent host switches. (c) Histogram of the percentage of time-inconsistent host switches in each reconciliation obtained with ALE on the original dataset accounting for the 95% credible interval of the node age estimates. Although the mean number of time-inconsistent host switches decreased from 20% to 17% (meaning that 3% of the time-inconsistent host switches may be due to uncertainty in node age estimates), the reconciliations still contain frequent and large time-inconsistencies. (d) Histogram of the time inconsistency (in Myr) of the inconsistent host switches accounting for the 95% credible interval of the node age estimates.
Figure 4—figure supplement 3
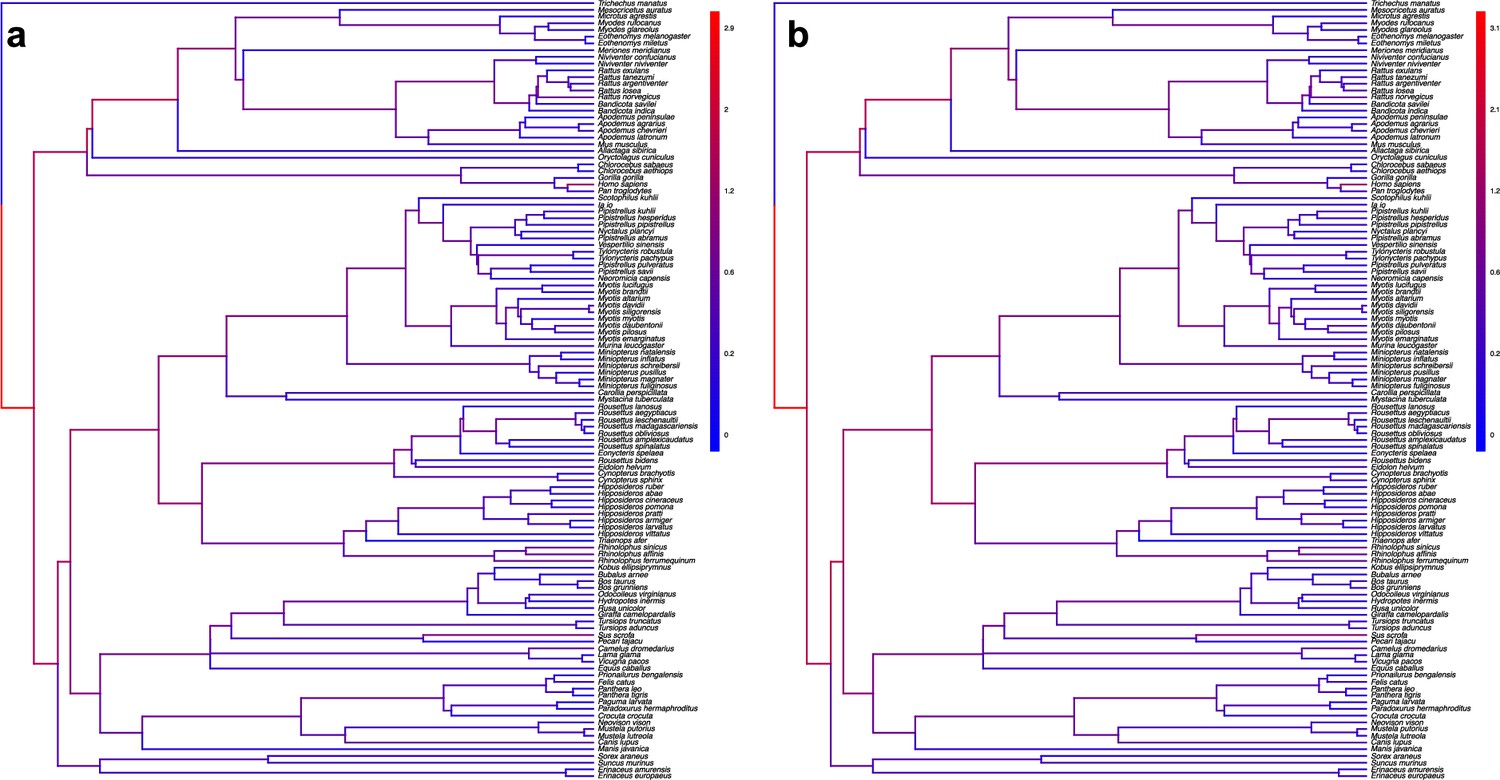
The origination of coronaviruses in mammals is not estimated among bats anymore when shuffling the dataset.
Phylogenetic trees of the mammals with branches colored as the percentages of ALE reconciliations which inferred this branch as the origination of coronaviruses in mammals when the dataset is randomly shuffled (a) or shuffled by conserving mammal biogeography by only shuffling species belonging to the same biogeographic realm; (b). Red branches are likely originations, whereas blue branches are unlikely.
Figure 4—figure supplement 4
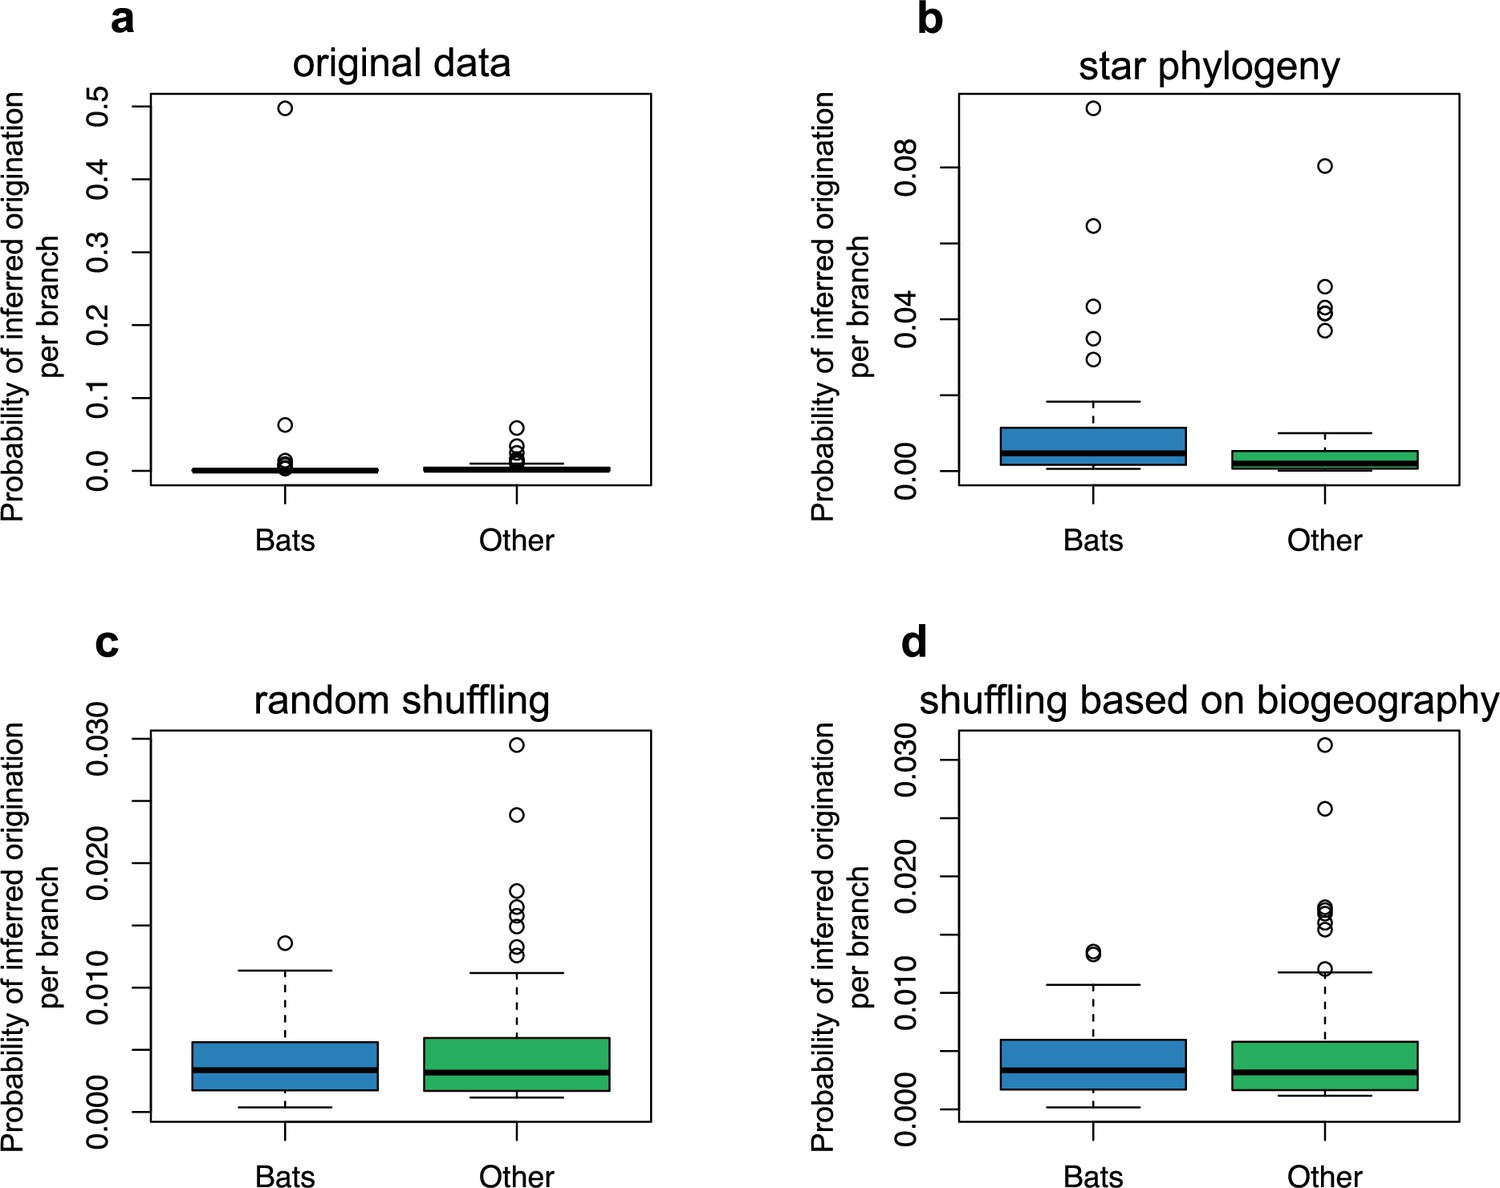
The origination of coronaviruses in mammals is estimated among bats.
The boxplots indicated the probability of inferred origination per branch based on ALE reconciliations for bats lineages or non-bat lineages. ALE was either run on: (a) the original dataset with the mammal phylogeny, (b) a star phylogeny instead of the mammal phylogeny, (c) on randomly-shuffled datasets, or (d) on datasets shuffled based on mammal biogeography (i.e. by only shuffling species belonging the same biogeographic realm).
Figure 4—figure supplement 5
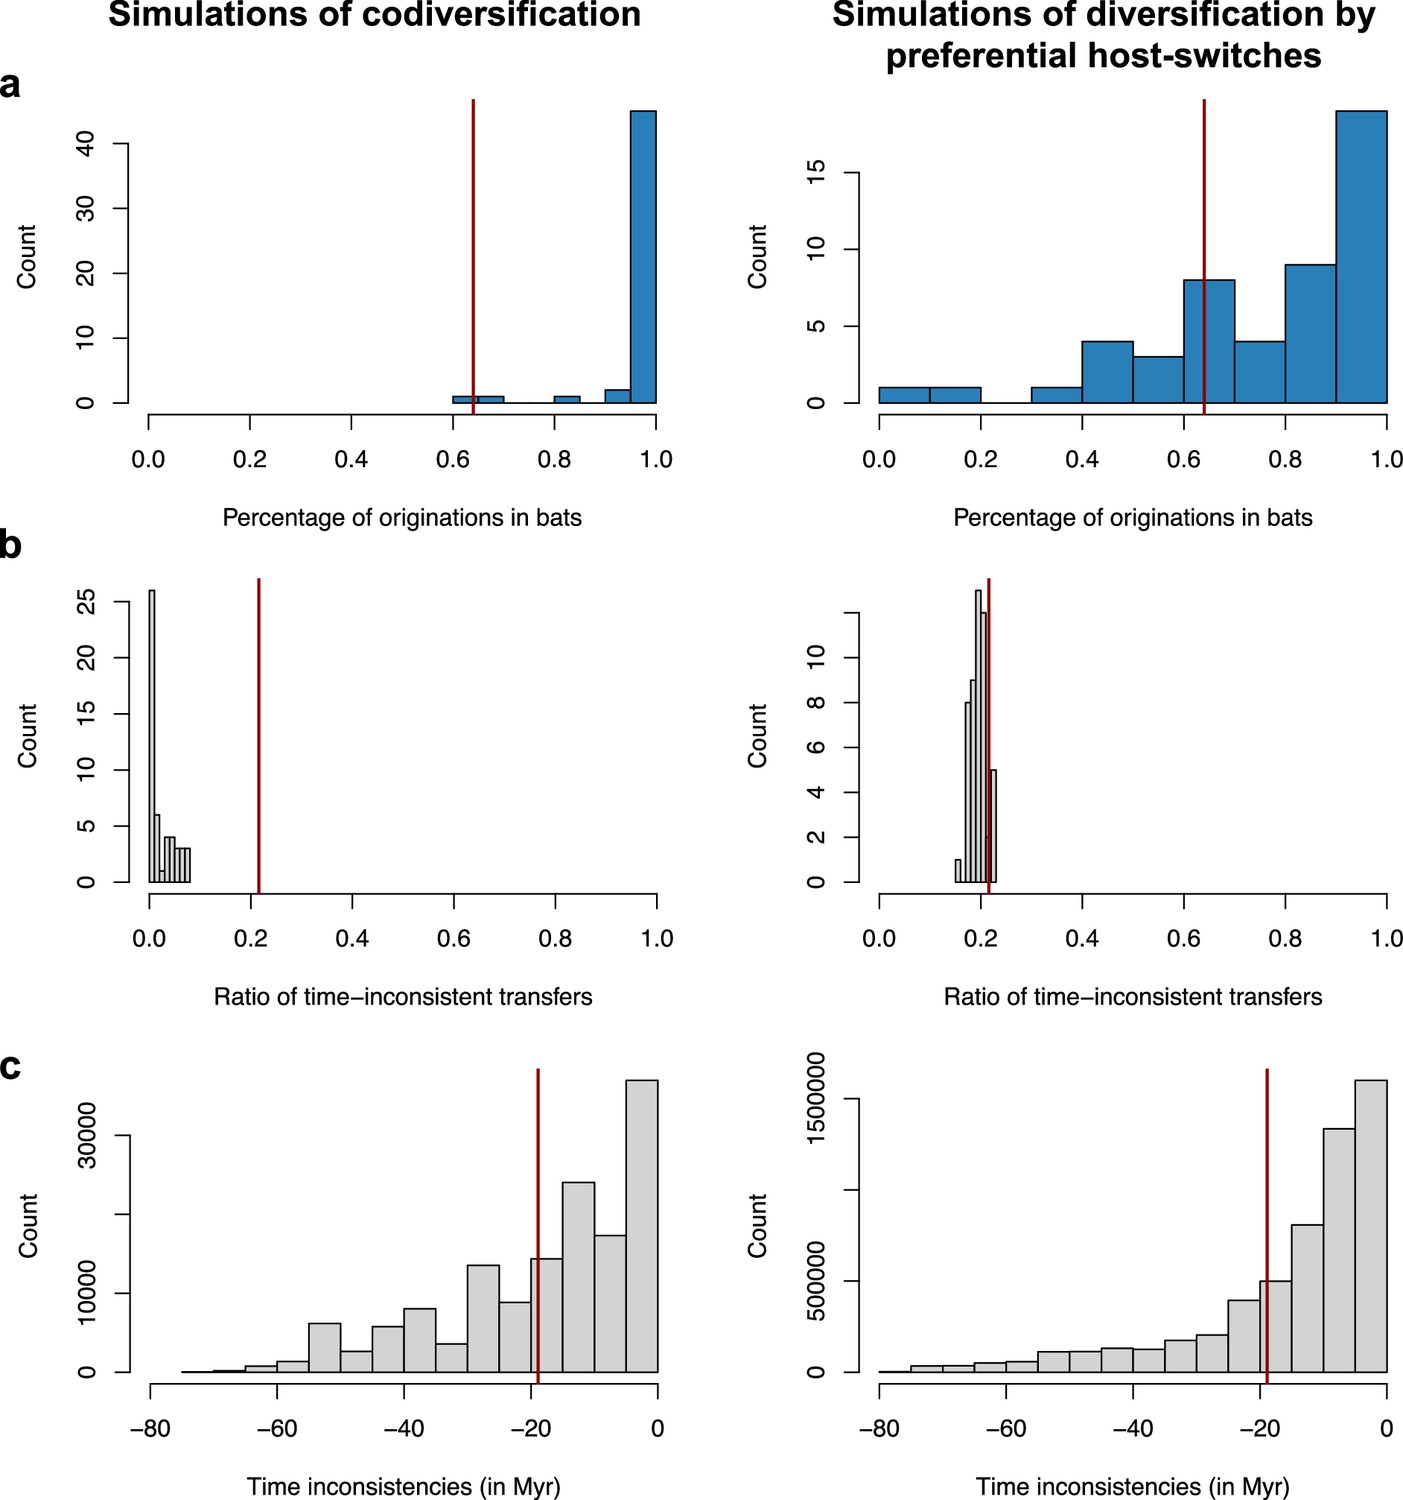
Validation of the interpretation of our results on the mammalian phylogeny using simulations of codiversification (left) or diversification by preferential host switches (right).
For each type of simulation – coronavirus-mammal codiversification (left) or coronavirus diversification by preferential host switches (right) –, we performed 50 independent simulations, ran ALE on the mammal phylogeny, and reported. (a) The percentage of reconciliations inferring an origination within bats. (b) The ratio of time-inconsistent host switches. (c) Time inconsistencies (in Myr). When simulating codiversification, ALE correctly infers an origination within bats, and few time-inconsistent host switches; when simulating preferential host switches, ALE correctly infers an origination within bats but with less certainty, and a significant fraction of time-inconsistent host switches. For each plot, the vertical red line corresponds to the results obtained on the original data (empirical mammal-coronaviruses associations) using ALE on the mammal phylogenetic tree. Results on the mammalian tree are consistent with a scenario of recent origination within bats and preferential host switches.
Figure 4—figure supplement 6

Validation of the interpretation of our results on the star phylogeny using simulations of diversification by preferential host switches.
For each type of simulation – coronavirus-mammal codiversification (left) or coronavirus diversification by preferential host switches (right) –, we performed 50 independent simulations, ran ALE on a star phylogeny, and reported. (a) The percentage of reconciliations happening within bats. (b) The percentages of within-order host switches. When simulating preferential host switches, ALE correctly infers a significant fraction of preferential host switches. For each plot, the vertical red line corresponds to the results obtained on the original data (empirical mammal-coronaviruses associations) using ALE on a star phylogeny.
Figure 4—figure supplement 7
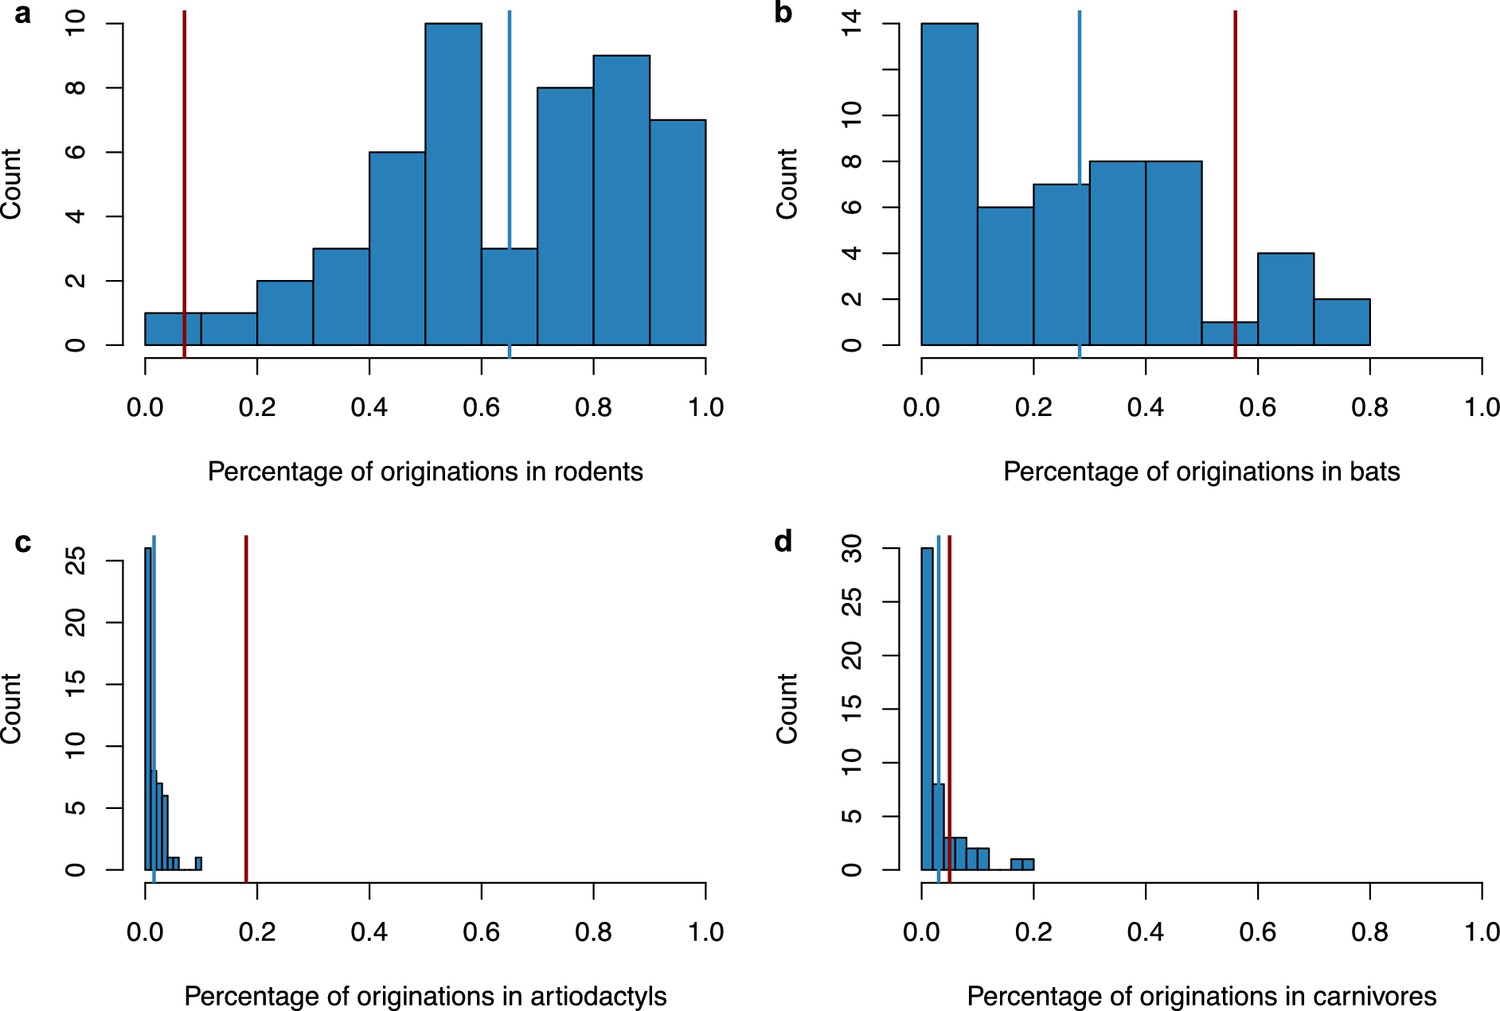
Simulating a scenario of origination in rodents followed by a diversification by preferential host switches with higher diversification of coronaviruses within bats did not generate a spurious origination in bats.
We performed 50 independent simulations, ran ALE on a star phylogeny, and reported the percentage of originations within the main mammalian orders: rodents (a), bats (b), artiodactyls (c), and carnivores (d). For each plot, the vertical red line corresponds to the results obtained on the original data (empirical mammal-coronaviruses associations) using ALE on a star phylogeny, while the vertical blue line corresponds to the mean of the simulations. Originations were correctly inferred in rodents in the majority of the simulations (average percentage: 65%+/-s.d. 22%), and only in a minority of cases within bats (average percentage: 28%+/-s.d. 21%), artiodactyls (average percentage: 2%+/-s.d. 2%), or carnivores (average percentage: 3%+/-s.d. 4%).
Figure 4—figure supplement 8
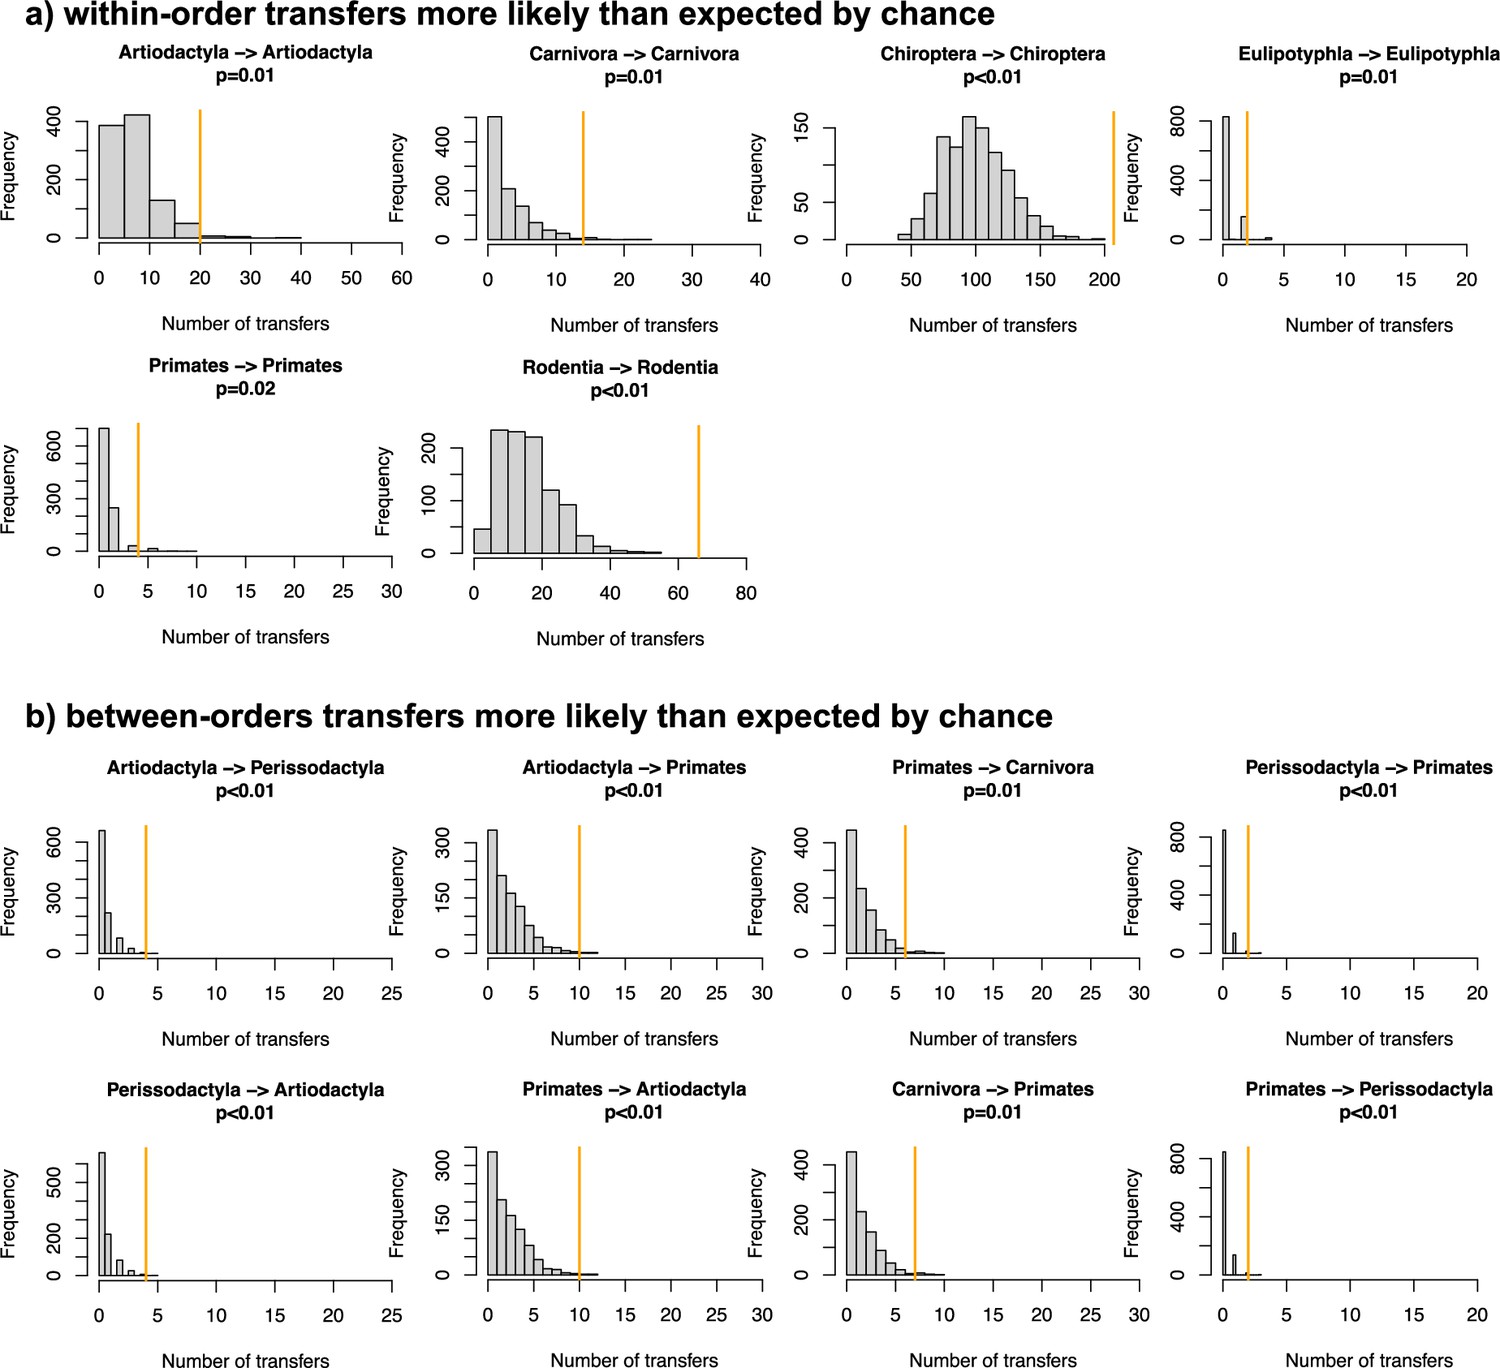
Evidence of preferential host switches in coronaviruses.
(a) Numbers of within-order host switches estimated by ALE on the star mammal phylogeny (in orange) compared with the null expectations if host switches happen at random (grey histogram; obtained when randomizing the mammal species). (b) For some clades, the numbers of between-order host switches estimated by ALE on the star mammal phylogeny (in orange) are higher than expected by chance.
Figure 4—figure supplement 9
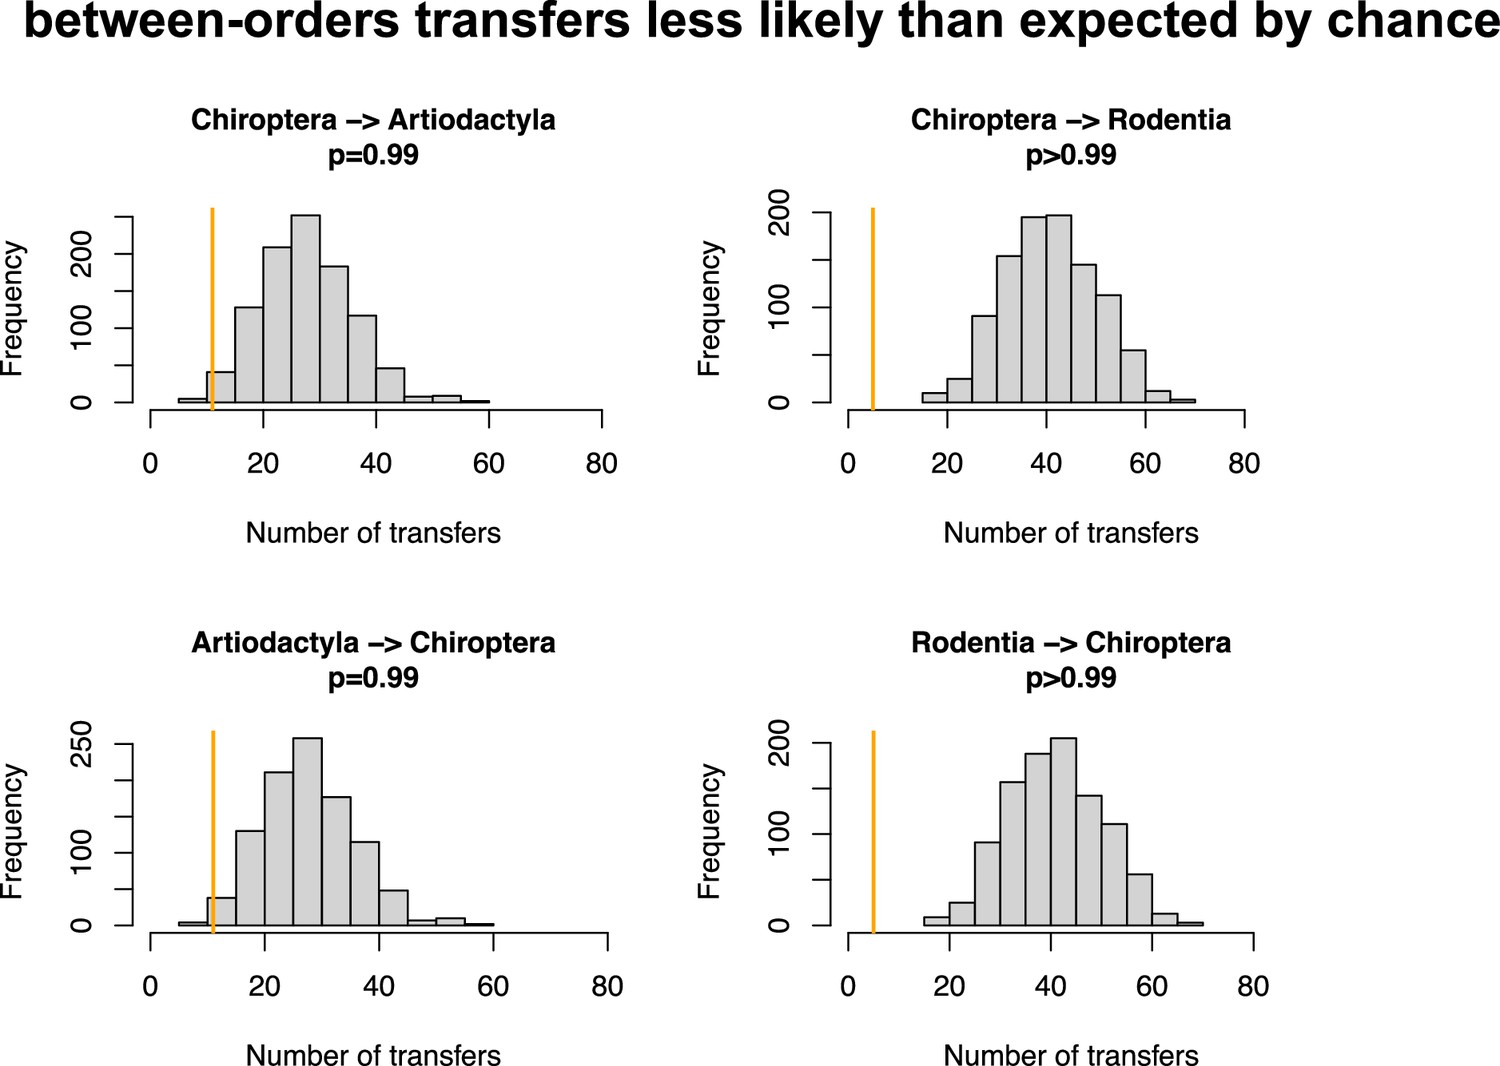
Host switches are less likely than expected by chance between bats (Chiroptera) and Artiodactyla or Rodentia.
Numbers of between-order host switches estimated by ALE on the star mammal phylogeny (in orange) compared with the null expectations if host switches happen at random (grey histogram; obtained when randomizing the mammal species).
Figure 4—figure supplement 10

The frequency of host switches seems to vary according to the coronavirus lineages.
On the top, we represented the phylogenetic tree of the coronavirus sOTUs reconstructed using BEAST2. For each extant sOTUs, we reported using boxplots, the total number of host switches that this OTU experienced since the coronavirus MRCA based on ALE reconciliations performed on a star phylogeny of mammals.
Figure 5 with 1 supplement
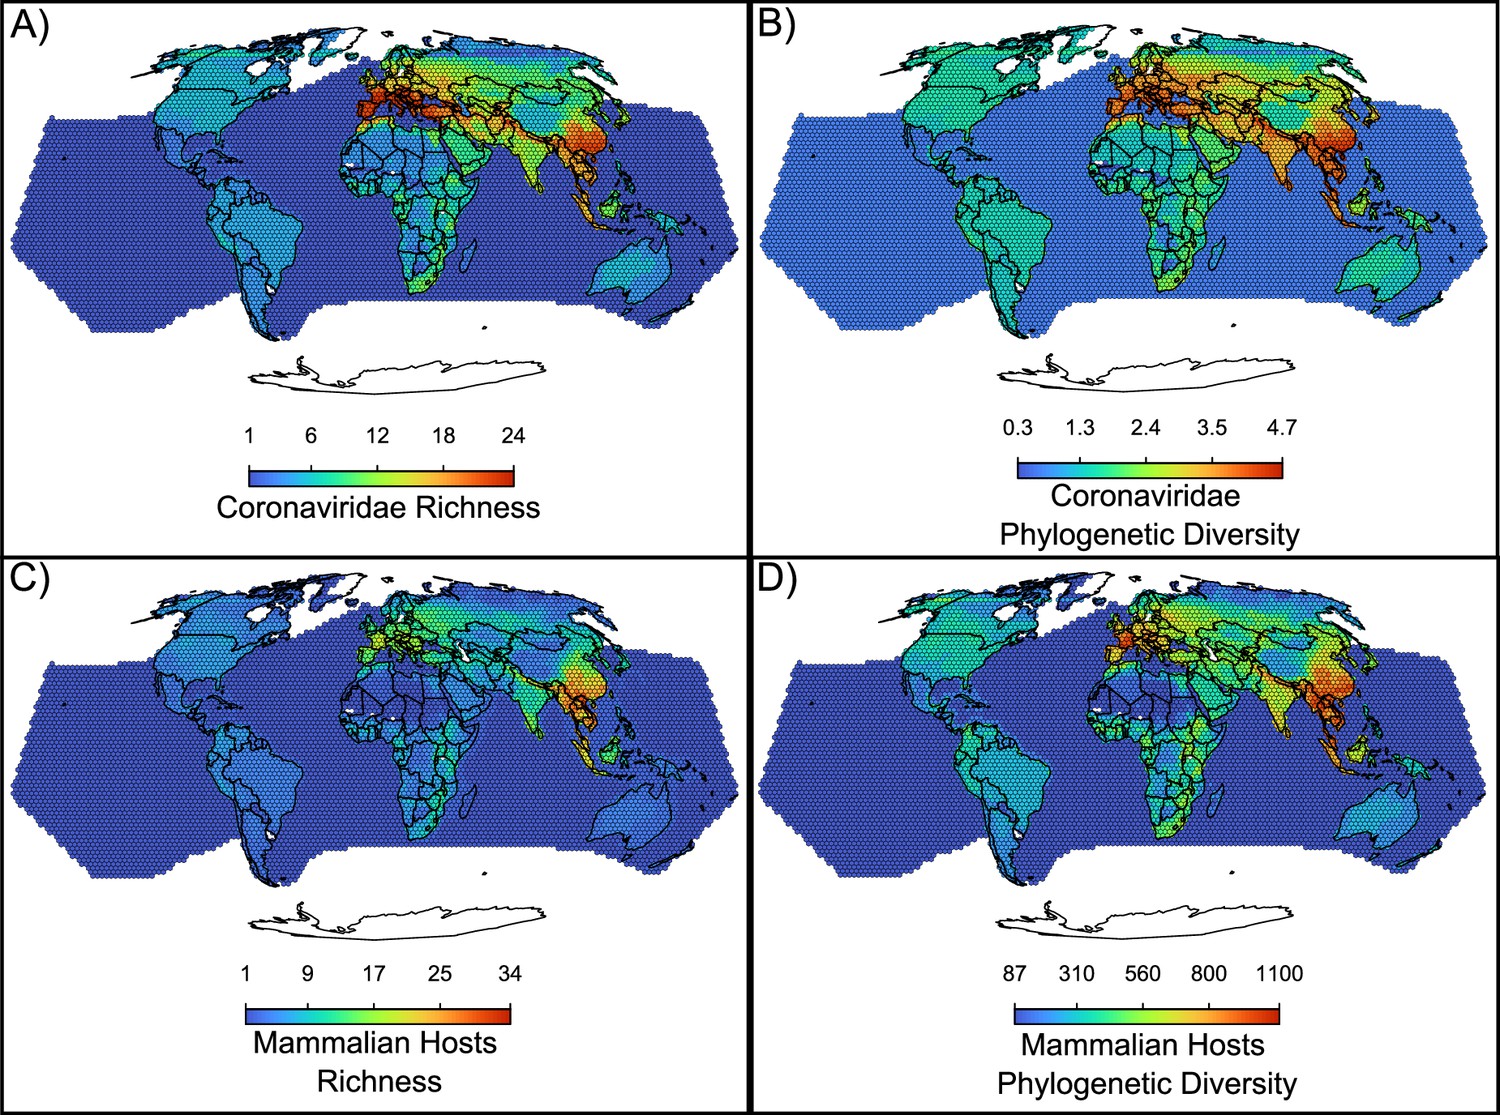
Maps of the diversity of coronaviruses and their mammal hosts.
In (A), the richness of species of coronaviruses; geographic range maps of coronaviruses were constructed after applying the host-filling method on the geographic range maps of mammalian hosts of coronaviruses. In (B), Faith, 1992 phylogenetic diversity of coronaviruses, calculated using the phylogenetic tree of coronaviruses (see main text). In (C) and (D), the richness and phylogenetic diversity of mammal hosts of coronaviruses, respectively. All maps are on the Mollweide projection.
Figure 5—figure supplement 1
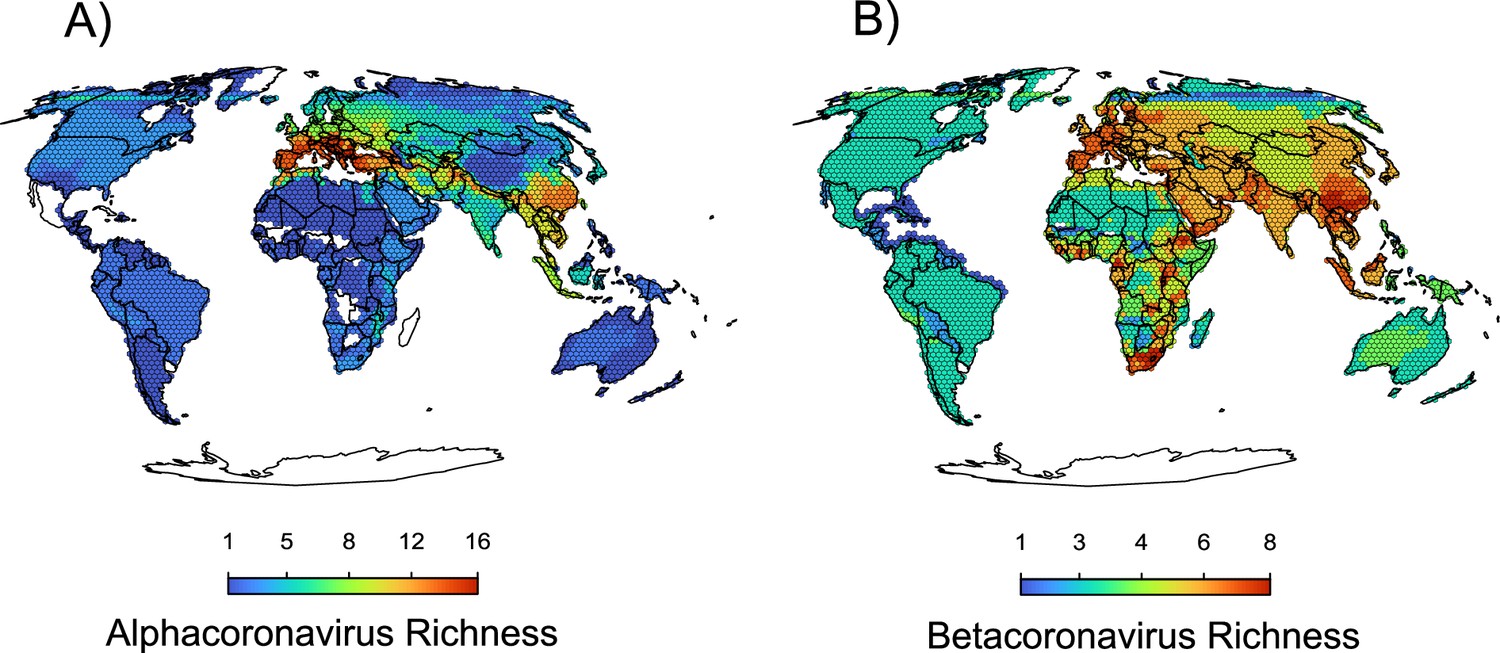
Maps of the diversity of alpha and betacoronaviruses.
In (a), the richness of sOTUs of alphacoronaviruses and in (b) the richness of sOTUs of betacoronaviruses; geographic range maps of coronaviruses were constructed after applying the host-filling method on the geographic range maps of mammalian hosts of coronaviruses.
Author response image 1

Additional files
-
Supplementary file 1
Supporting information.
(a) Box with definitions. Our terminology is as in Perez-Lamarque and Morlon, 2024. (b) Summary of the results obtained for the ALE reconciliations performed on “sliced mammalian phylogenetic trees”, i.e. trees where we only considered the X last Myr and merged nodes older than X Myr into polytomies in order to (i) test a scenario of more or less recent origination of coronaviruses and (ii) avoid back-in-time transfers toward nodes older than the origination time. All reconciliations are significant (when compared to randomizations shuffling host species labels). Reconciliations with an estimated number of cospeciation events larger than the estimated number of transfer events are in bold. (c) Host switches between bats and other mammal orders are less likely than expected by chance: For each type of host switches within or between orders, we reported the inferred number of host switches using ALE (on the star phylogeny) and the expected number of host switches if host switches are equally likely between species (obtained by randomly shuffling the host species names). Because we don’t have within-OTUs variations with the palmprint region, the directionality all the recent host switches is not identifiable (resulting in equal proportion in both directions at the mammalian order level). Host switches involving bats (Chiroptera) and other mammal orders are indicated in bold. (d) Frequency of host switches inferred from bats to other mammal species, including humans. For each mammal species, we computed the average number per reconciliation of host switches from bats to this mammal species. We only reported here the species presenting >10% of chance to experience at least one host switch from bats. (e) Frequency of host switches inferred from any mammal species towards humans.We computed the average number per reconciliation of host switches from each mammal species to humans. We only reported here the species presenting >10% of chance to experience at least one host switch. Host switches from bats are highlighted in bold. (f) Summary of the different strategies used to evaluate the robustness of our findings. (g) Results are qualitatively similar when running ALE on sub-parts on the palmprint region.We reported here results obtained when running ALE on the star phylogeny on (i) the whole palmprint region (positions 1-150), (ii) the first part of the palmprint region (positions 1-75) or (iii) the last part of the palmprint region (positions 76-150). (h) Mammal silhouettes taken from open-to-use sources in https://www.phylopic.org/, detailed credits for authors.
- https://cdn.elifesciences.org/articles/91745/elife-91745-supp1-v1.docx
-
MDAR checklist
- https://cdn.elifesciences.org/articles/91745/elife-91745-mdarchecklist1-v1.docx
-
Source data 1
Dataset containing the association matrix between coronaviruses and their mammalian hosts.
- https://cdn.elifesciences.org/articles/91745/elife-91745-data1-v1.txt
Download links
A two-part list of links to download the article, or parts of the article, in various formats.
Downloads (link to download the article as PDF)
Open citations (links to open the citations from this article in various online reference manager services)
Cite this article (links to download the citations from this article in formats compatible with various reference manager tools)
Recent evolutionary origin and localized diversity hotspots of mammalian coronaviruses
eLife 13:RP91745.
https://doi.org/10.7554/eLife.91745.3


