Circulating platelets modulate oligodendrocyte progenitor cell differentiation during remyelination
- Laboratory of Stem Cells and Neuroregeneration, Institute of Anatomy, Histology and Pathology, Faculty of Medicine, Universidad Austral de Chile, Chile
- Center for Interdisciplinary Studies on the Nervous System (CISNe), Universidad Austral de Chile, Chile
- Wellcome-MRC Cambridge Stem Cell Institute & Department of Clinical Neurosciences, University of Cambridge, United Kingdom
- Translational Regenerative Neurobiology Group (TReN), Molecular and Integrative Biosciences Research Programme (MIBS), Faculty of Biological and Environmental Sciences, University of Helsinki, Finland
- Escuela de Ciencias Agrícolas y Veterinarias, Universidad Viña del Mar, Chile
- Department of Haematology and NHS Blood and Transplant, University of Cambridge, United Kingdom
- Institute of Molecular Regenerative Medicine, Paracelsus Medical University, Austria
- Instituto de Bioquímica y Microbiología, Facultad de Ciencias, Universidad Austral de Chile, Chile
- Laboratory of Cellular Pathology, Institute of Anatomy, Histology & Pathology, Faculty of Medicine, Universidad Austral de Chile, Chile
- School of Life Sciences, University of Westminster, United Kingdom
Figures
Figure 1
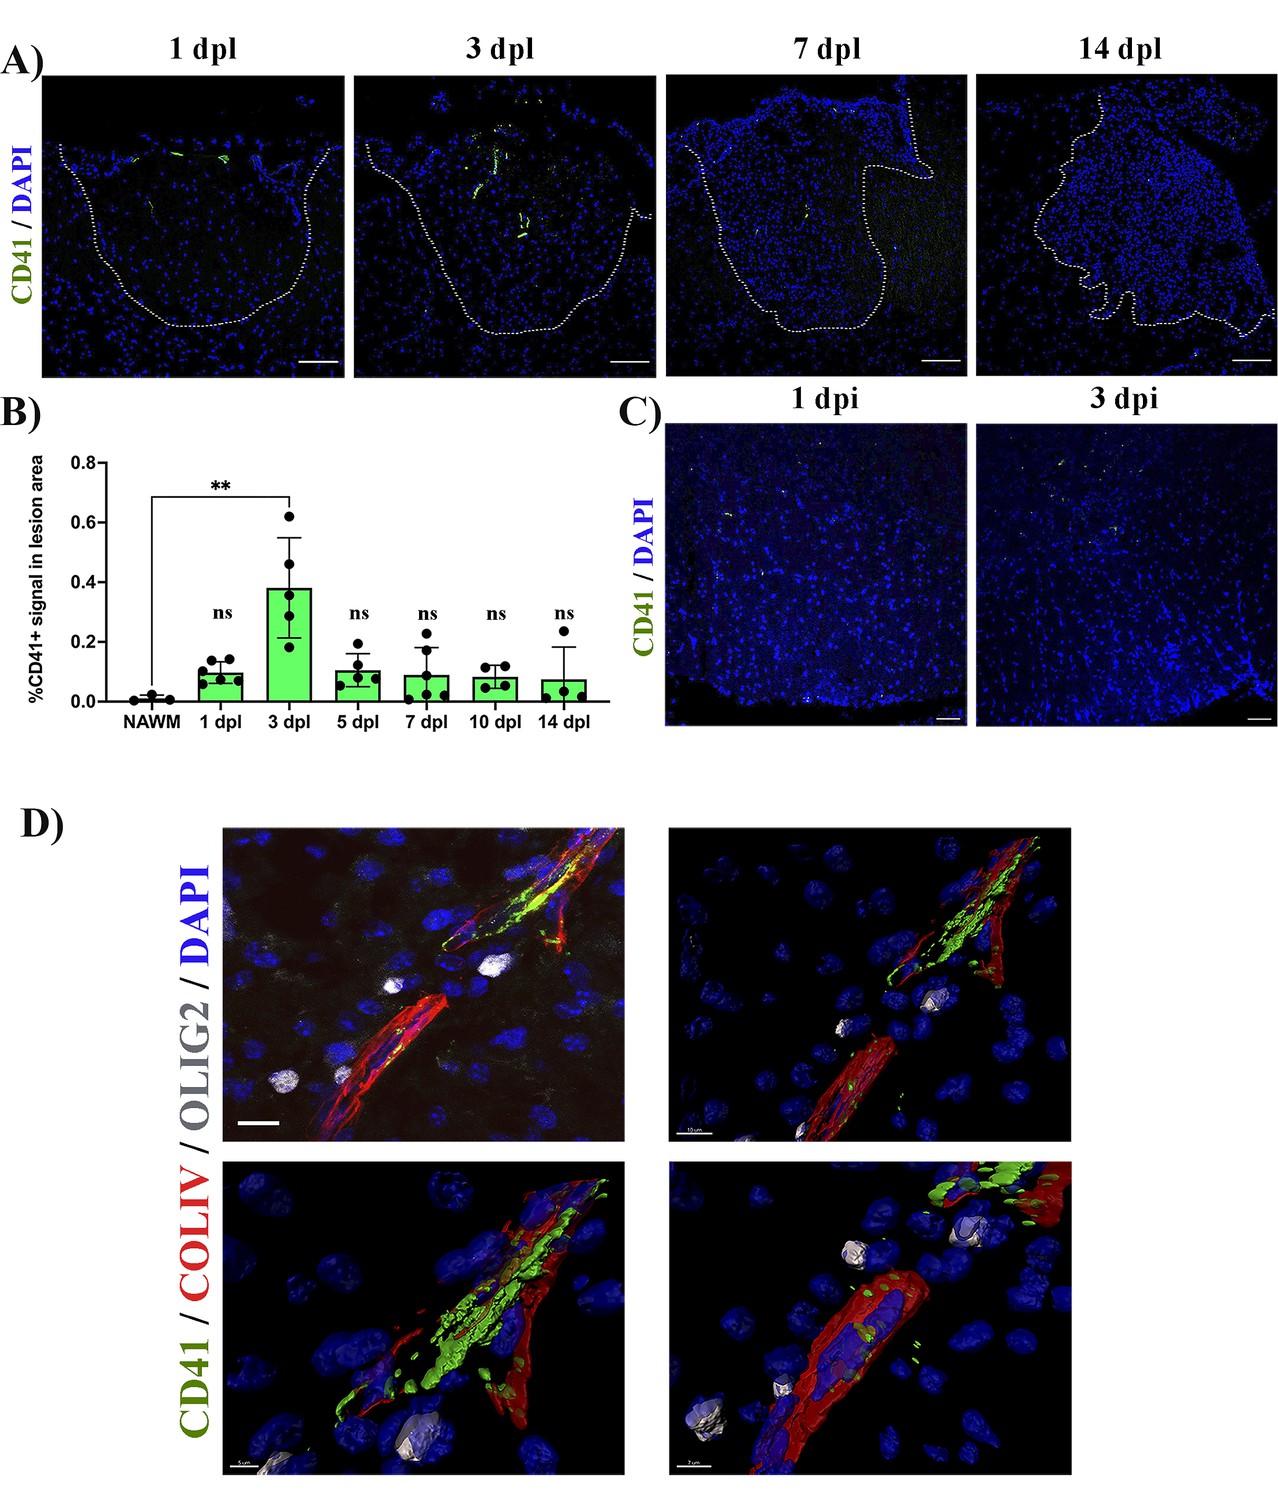
Platelets accumulate in response to demyelination.
(A) LPC induced demyelinating lesions in spinal cord white matter of WT mice at 1, 3, 7, and 14 dpl, stained for platelets (CD41+). Scale bar 100 μm. (B) Quantification of CD41+ signal within the demyelinated lesion at 1 (n=6), 3 (n=5), 5 (n=5), 7 (n=6), 10 (n=4), and 14 dpl (n=4), and in NAWM (n=3). (C) Platelet staining (CD41+) in spinal cord white matter injected with PBS/DAPI. Scale bar 50 μm. (D) Upper left panel: localization of platelets within blood vessels (ColIV+) and in close proximity with OPCs (Olig2+) at 5 dpl. Upper right panel: IMARIS 3D projection shows the spatial distribution of platelets. Scale bar 10 μm. Lower panels: magnification of the IMARIS projection showing platelet aggregation within the blood (left panel) and penetration into the parenchyma (right panel). Scale bars: 5 μm (left panel) and 7 μm (right panel). Data were analysed using a Kruskal Wallis test. Data represent the mean ± SD. ** p<0.01; ns (not significant), p>0.05.
Figure 2 with 2 supplements
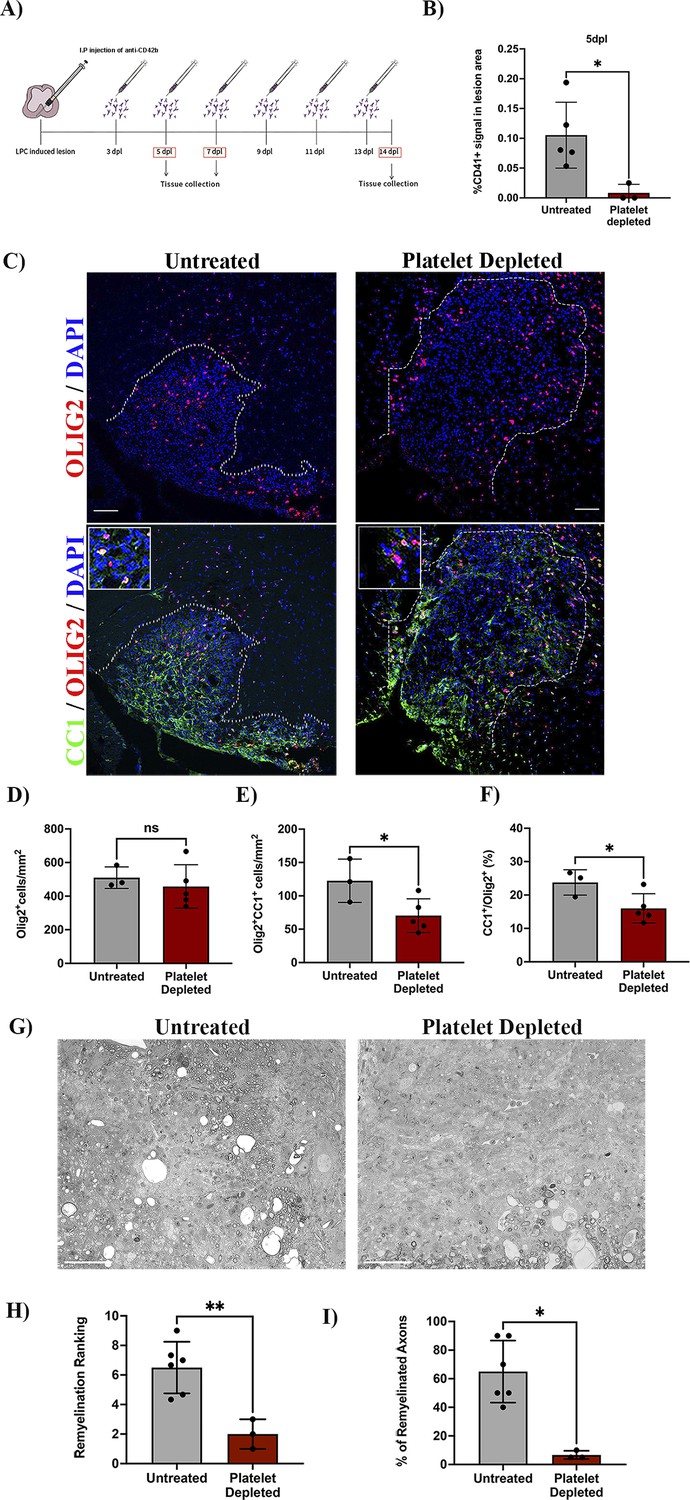
Platelet depletion impairs remyelination in vivo.
(A) Schematic representation of the LPC-induced demyelination model coupled with platelet depletion using anti-CD42b. (B) Quantitative analysis of CD41+ signal at 5 dpl in untreated (n=5) and platelet depleted mice (n=3). (C) Representative images of immunofluorescence staining of oligodendroglial lineage cells in untreated and platelet depleted mice at 7 dpl using Olig2+ (upper panels) and mature oligodendrocytes using Olig2+/CC1+ (lower panels). Boxed areas represent high magnification images. (D–F) Quantitative analysis of oligodendroglia at 7 dpl in untreated (n=3) and platelet depleted mice (n=5). (G) Representative images of toluidine blue staining of remyelination in untreated (n=6) and platelet depleted mice (n=3) at 14 dpl and (H–I) its quantification by relative ranking analysis. Data were analysed using an Unpaired Student’s t-test or Mann-Whitney U test. Data represent mean ± SD. * p<0.05; ** p<0.01; ns (not significant), p>0.05. Scale bars, 100 μm.
Figure 2—figure supplement 1
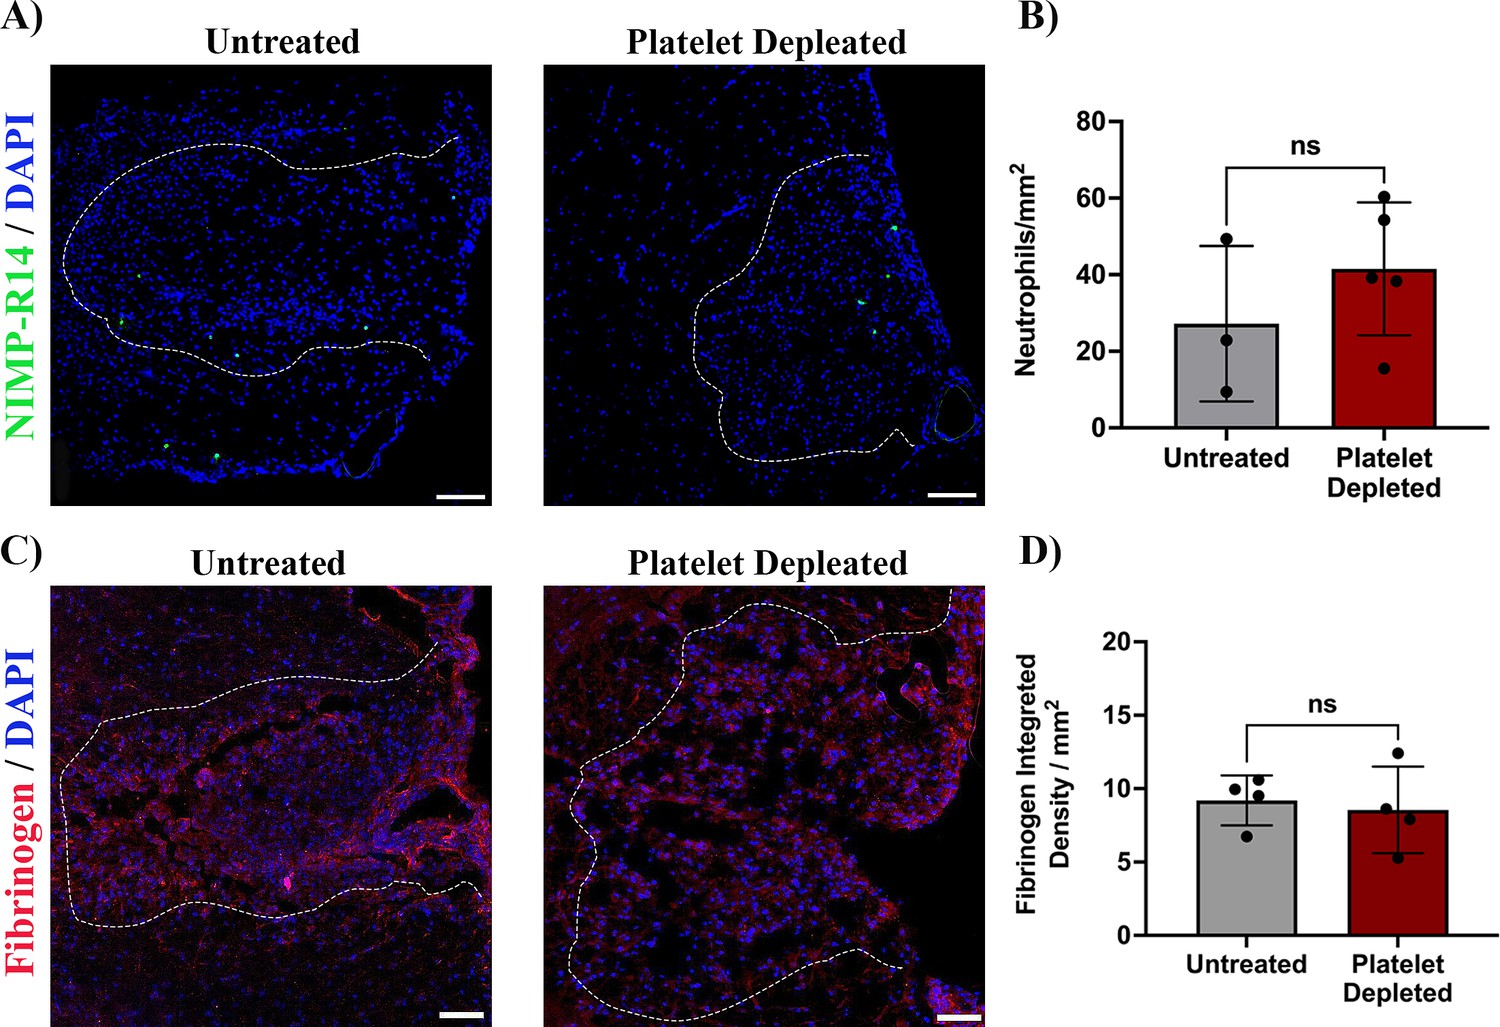
Platelet depletion does not alter BBB permeability.
(A) Representative immunofluorescence images of neutrophils (NIMP-R14+) and (B) number of neutrophils in LPC-induced white matter spinal cord lesion at 7 dpl in untreated (n=3) and platelet depleted mice (n=5). (C) Representative immunofluorescence images of Fibrinogen and (D) Quantification of Fibrinogen signal within the demyelinated lesion at 7 dpl in untreated and platelet depleted mice (n=4). Scale bar 50 μm. Data were analysed using an unpaired t-test. Data represent the mean ± SD. ns (not significant), p>0.05.
Figure 2—figure supplement 2
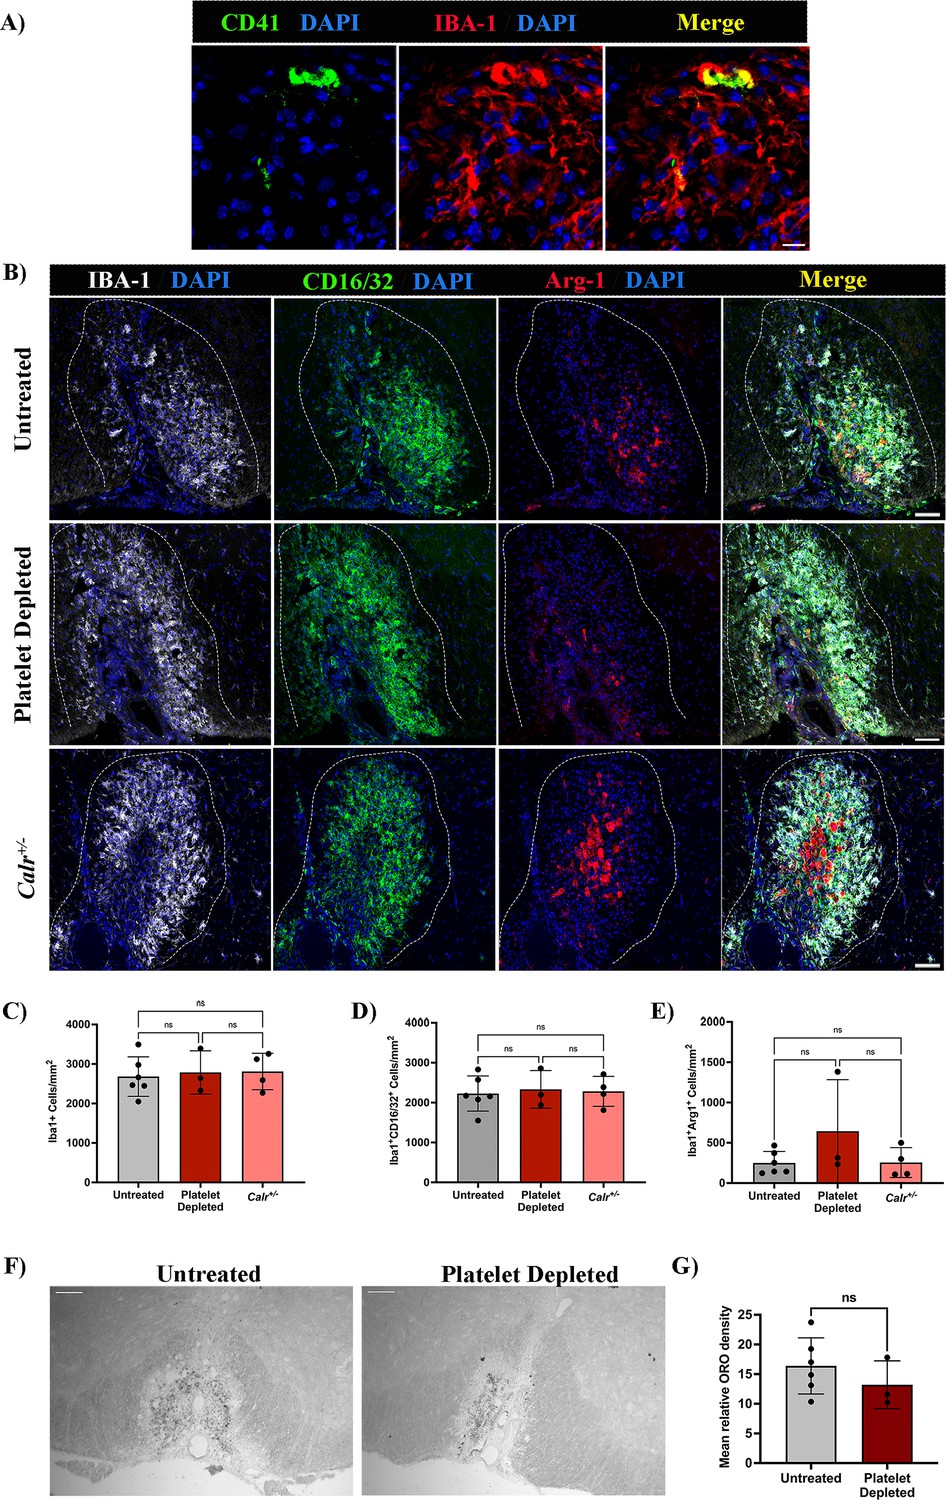
Changes in circulating platelet numbers does not alter the macrophage/microglia population during remyelination.
(A) Platelets (CD41+) are located in close proximity to the macrophage/microglia population (IBA-1+) at 5 dpl. Scale bar 10 μm. (B) Total macrophage/microglia population (IBA-1+), M1 (CD16/32+) and M2 (Arg-1+) cell subpopulations at 10 dpl. Scale bar 50 μm. (C–E) Quantitative analysis of total, M1 and M2 cell subpopulations in untreated (n=6), platelet depleted (n=3), and Calr+/- mice (n=4). (F) Representative Oil-Red O staining of myelin debris at 10 dpl. (G) Quantification of Oil-Red O (ORO) staining in untreated (n=6) and platelet depleted mice (n=3). Scale bar 100 μm. Data were analysed using an ordinary one-way ANOVA and or an unpaired t-test. Data represent the mean ± SD. ns (not significant), p>0.05.
Figure 3
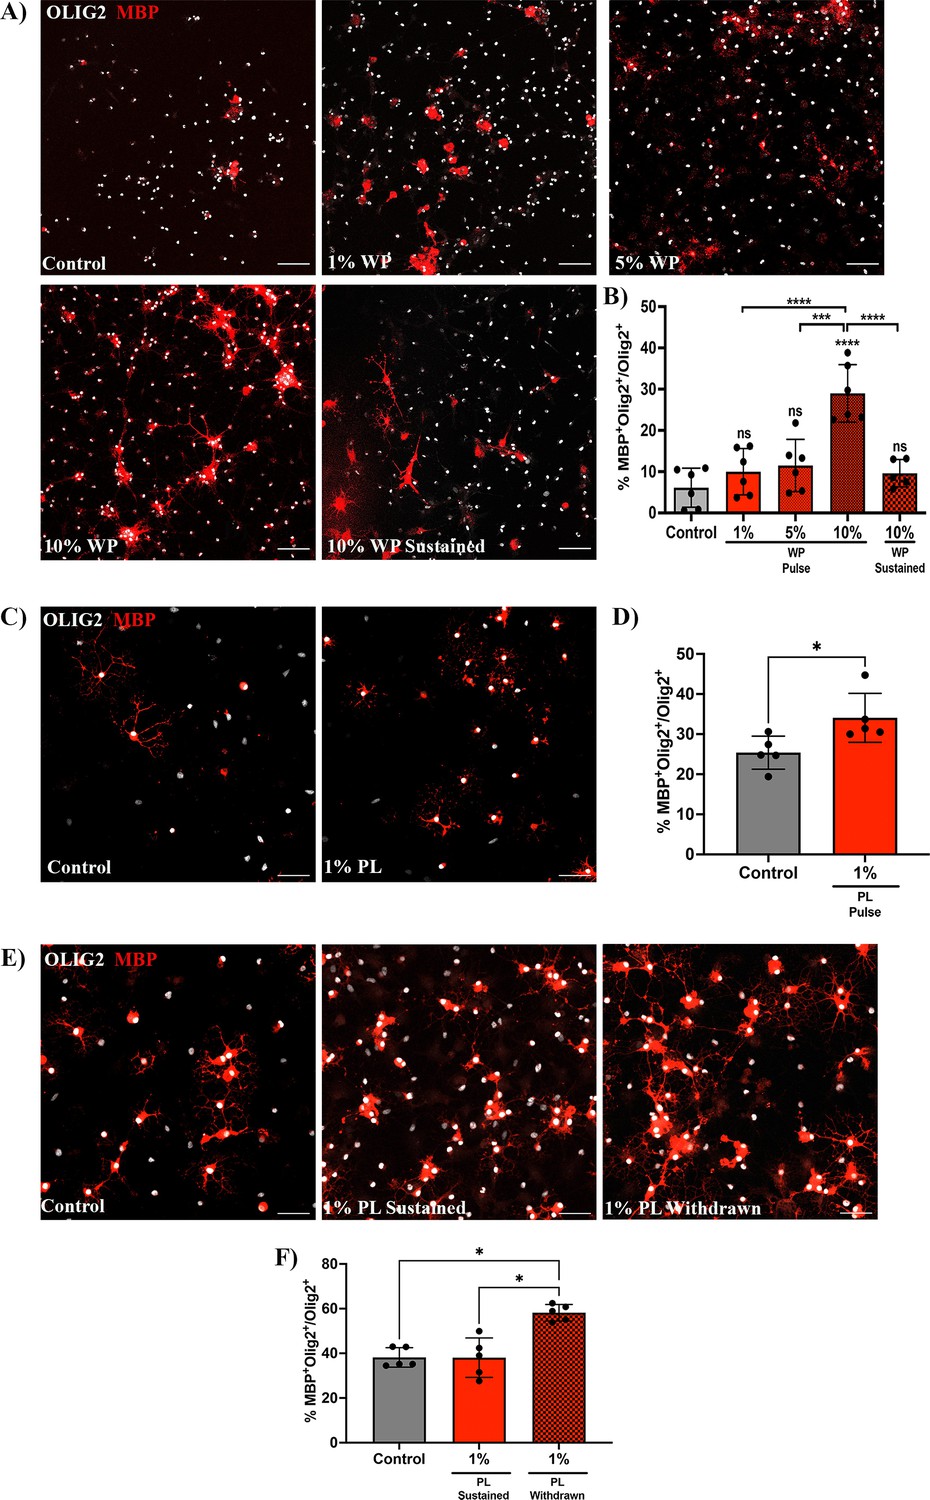
Prolonged exposure to platelets suppresses their ability to enhance OPC differentiation.
(A) Representative fluorescence images of OPCs co-cultured with 1 (n=6), 5 (n=6), and 10% (n=6) washed platelets (WP) for 3 days in vitro (DIV), followed by WP removal for an additional 3 DIV (Pulse). Additionally, OPCs were co-cultured in the presence of 10% WP for 6 DIV (n=5) (Sustained). Vehicle treated OPCs represents the control condition (n=6). (B) Graph represents the percentage of Olig2+MBP+ oligodendrocytes within the total Olig2 population (quantitative analysis of OPC differentiation). (C) Representative images of OPCs exposed to 1% platelet lysate (PL) (n=5) for 6 DIV. Vehicle treated OPCs represents the control condition (n=5). (D) Graph represents the quantitative analysis of OPC differentiation as in B. (E) Representative images of OPCs exposed to either PL for 9 DIV (Sustained) (n=5) or 6 DIV with PL followed by its removal for an additional 3 more DIV (Withdrawn) (n=5). Vehicle-treated OPCs represents the control condition (n=5). (F) Graph shows the quantitative analysis of OPC differentiation as in B and D. Data were analysed using one-way ANOVA followed by Tukey’s post-hoc test, a Mann-Whitney U test, or Kruskal-Wallis test. Data represent the mean ± SD. * p<0.05; *** p<0.001; **** p<0.0001; ns (not significant), p>0.05. Scale bars, 50 μm.
Figure 4
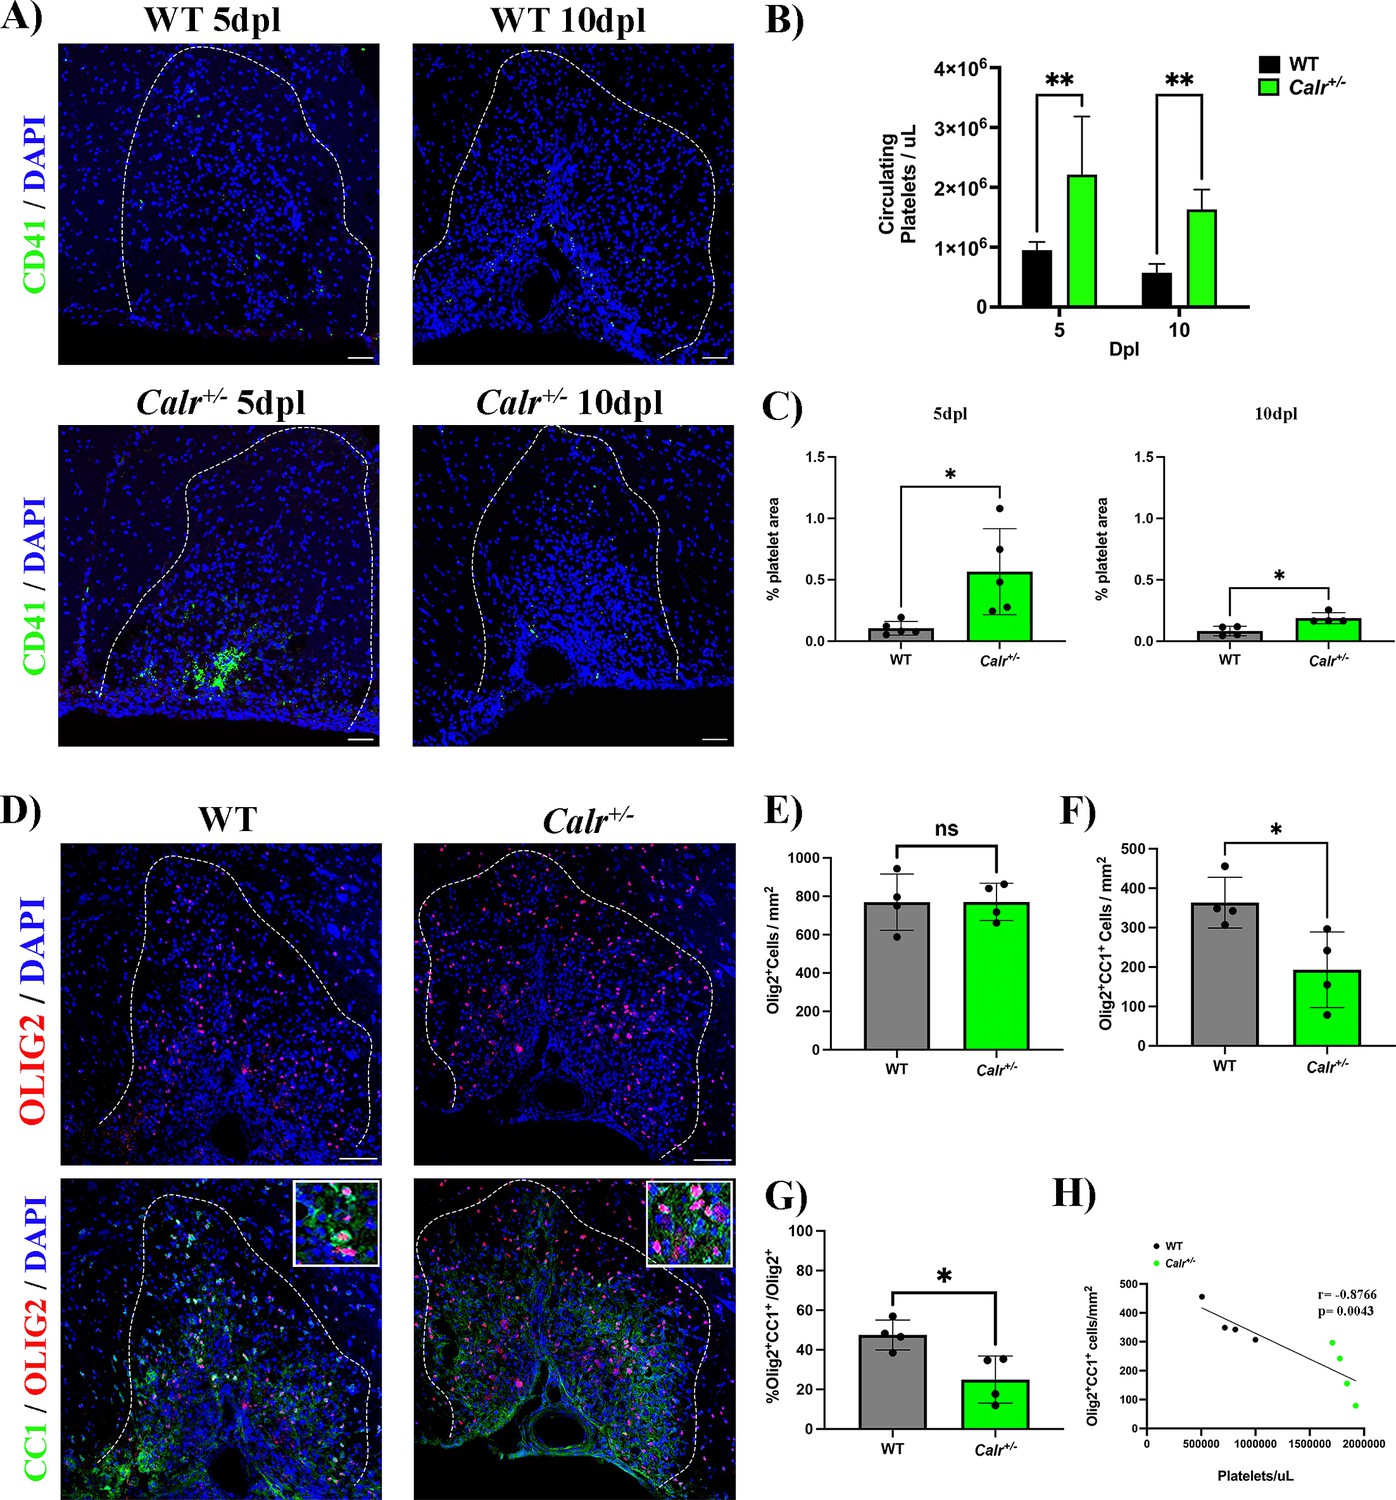
A sustained increase in circulating platelets impairs remyelination in-vivo.
(A) Representative fluorescence images of platelets (CD41+) in LPC induced demyelinating lesions of spinal cord white matter of WT and Calr +/-mice at 5 and 10 dpl. Scale bar 50 μm. (B) Quantification of circulating platelets in WT vs Calr +/-mice at 5 (n=4 and n=5, respectively) and 10 dpl (n=5 and n=6, respectively). (C) Quantification of CD41+ signal in demyelinated lesions of WT vs Calr +/-mice at 5 dpl (n=5 and n=5, respectively) and 10 dpl (n=4 and n=4, respectively). (D) Representative immunofluorescence staining of oligodendroglial lineage cells in untreated and platelet depleted mice at 10 dpl using Olig2+ (upper panels) and mature oligodendrocytes using Olig2+/CC1+ (lower panels) (n=4). Scale bar 100 μm. (E–G) Quantitative analysis of oligodendroglia at 10 dpl. (H) Correlation between the circulating platelet number with the number of Olig2+/CC1+ cells within the demyelinated lesion. Data were analysed using a two-way ANOVA followed by Bonferroni’s post-hoc test, an unpaired t-test, Welch’s t-test, a Mann-Whitney U test, or Pearson’s correlation coefficient analysis. Data represent the mean ± SD. * p<0.05; ** p<0.01; ns (not significant), p>0.05.
Tables
Key resources table
| Reagent type (species) or resource | Designation | Source or reference | Identifiers | Additional information |
|---|---|---|---|---|
| Antibody | CD41 rat monoclonal | Abcam | Cat# ab33661; RRID:AB_726487 | Working dilution (1:200) |
| Antibody | CD16/32 rat monoclonal | BD Biosciences | Cat # BD 553142 RRID:AB_394656 | Working dilution (1:200) |
| Antibody | Iba-1 rabbit polyclonal | WAKO | Cat# 019–19741; RRID:AB_839504 | Working dilution (1:500) |
| Antibody | Arg-1 goat polyclonal | Santa Cruz | Cat# sc-18351; RRID:AB_2258542 | Working dilution (1:200) |
| Antibody | NIMP-R14 rat monoclonal | Abcam | Cat# ab2557; RRID:AB_303154 | Working dilution (1:200) |
| Antibody | Olig2 rabbit monoclonal | Abcam | Cat# Ab109186; RRID:AB_10861310 | Working dilution (1:200 in vivo) (1:500 in vitro) |
| Antibody | CC1 mouse monoclonal | Millipore | Cat# OP80; RRID:AB_2057371 | Working dilution (1:1000) |
| Antibody | MBP rat monoclonal | Bio-rad | Cat# MCA409S; RRID:AB_325004 | Working dilution (1:500) |
| Antibody | Collagen IV (ColIV) goat polyclonal | Millipore | CAT# AB769; RRID:AB_92262 | Working dilution (1:100) |
| Antibody | Fibrinogen rabbit polyclonal | Abcam | Cat # ab34269 RRID:AB_732367 | Working dilution (1:200) |
| Chemical compound, drug | L-α-lysophosphatidylcholine | Sigma-Aldrich | Cat # L1381 | Demyelinating agent, Working concentration 1% |
| Chemical compound, drug | CD42b (mixture of rat monoclonal antibodies) | Emfret Analytics; Evans et al., 2021 | Cat #R300 RRID:AB_2721041 | Platelet depletion antibody, Working concentration 0.6 μg/g |
| Strain, strain background (Mus musculus) | Mouse: C7BL/6 | Charles River Laboratories | RRID:SCR_003792 | |
| Strain, strain background (Mus musculus) | Mouse: Calrfl/+:Vav1-Cre mice | Li et al., 2018 | ||
| Strain, strain background (Rattus norvegicus) | Rat: Sprague Dawley | Charles River Laboratories | RRID:SCR_003792 |
Additional files
Download links
A two-part list of links to download the article, or parts of the article, in various formats.
Downloads (link to download the article as PDF)
Open citations (links to open the citations from this article in various online reference manager services)
Cite this article (links to download the citations from this article in formats compatible with various reference manager tools)
Circulating platelets modulate oligodendrocyte progenitor cell differentiation during remyelination
eLife 12:RP91757.
https://doi.org/10.7554/eLife.91757.3


