Antigenic drift and subtype interference shape A(H3N2) epidemic dynamics in the United States
- Fogarty International Center, National Institutes of Health, United States
- Brotman Baty Institute for Precision Medicine, University of Washington, United States
- Vaccine and Infectious Disease Division, Fred Hutchinson Cancer Center, United States
- Virology Surveillance and Diagnosis Branch, Influenza Division, National Center for Immunization and Respiratory Diseases (NCIRD), Centers for Disease Control and Prevention (CDC), United States
- WHO Collaborating Centre for Reference and Research on Influenza, Crick Worldwide Influenza Centre, The Francis Crick Institute, United Kingdom
- Influenza Virus Research Center, National Institute of Infectious Diseases, Japan
- WHO Collaborating Centre for Reference and Research on Influenza, The Peter Doherty Institute for Infection and Immunity, Department of Microbiology and Immunology, The University of Melbourne, The Peter Doherty Institute for Infection and Immunity, Australia
- Center for Vaccine Research and Pandemic Preparedness (C-VaRPP), Icahn School of Medicine at Mount Sinai, United States
- Department of Pathology, Molecular and Cell-Based Medicine, Icahn School of Medicine at Mount Sinai, United States
- Department of Genome Sciences, University of Washington, United States
- Howard Hughes Medical Institute, United States
Figures
Figure 1 with 3 supplements
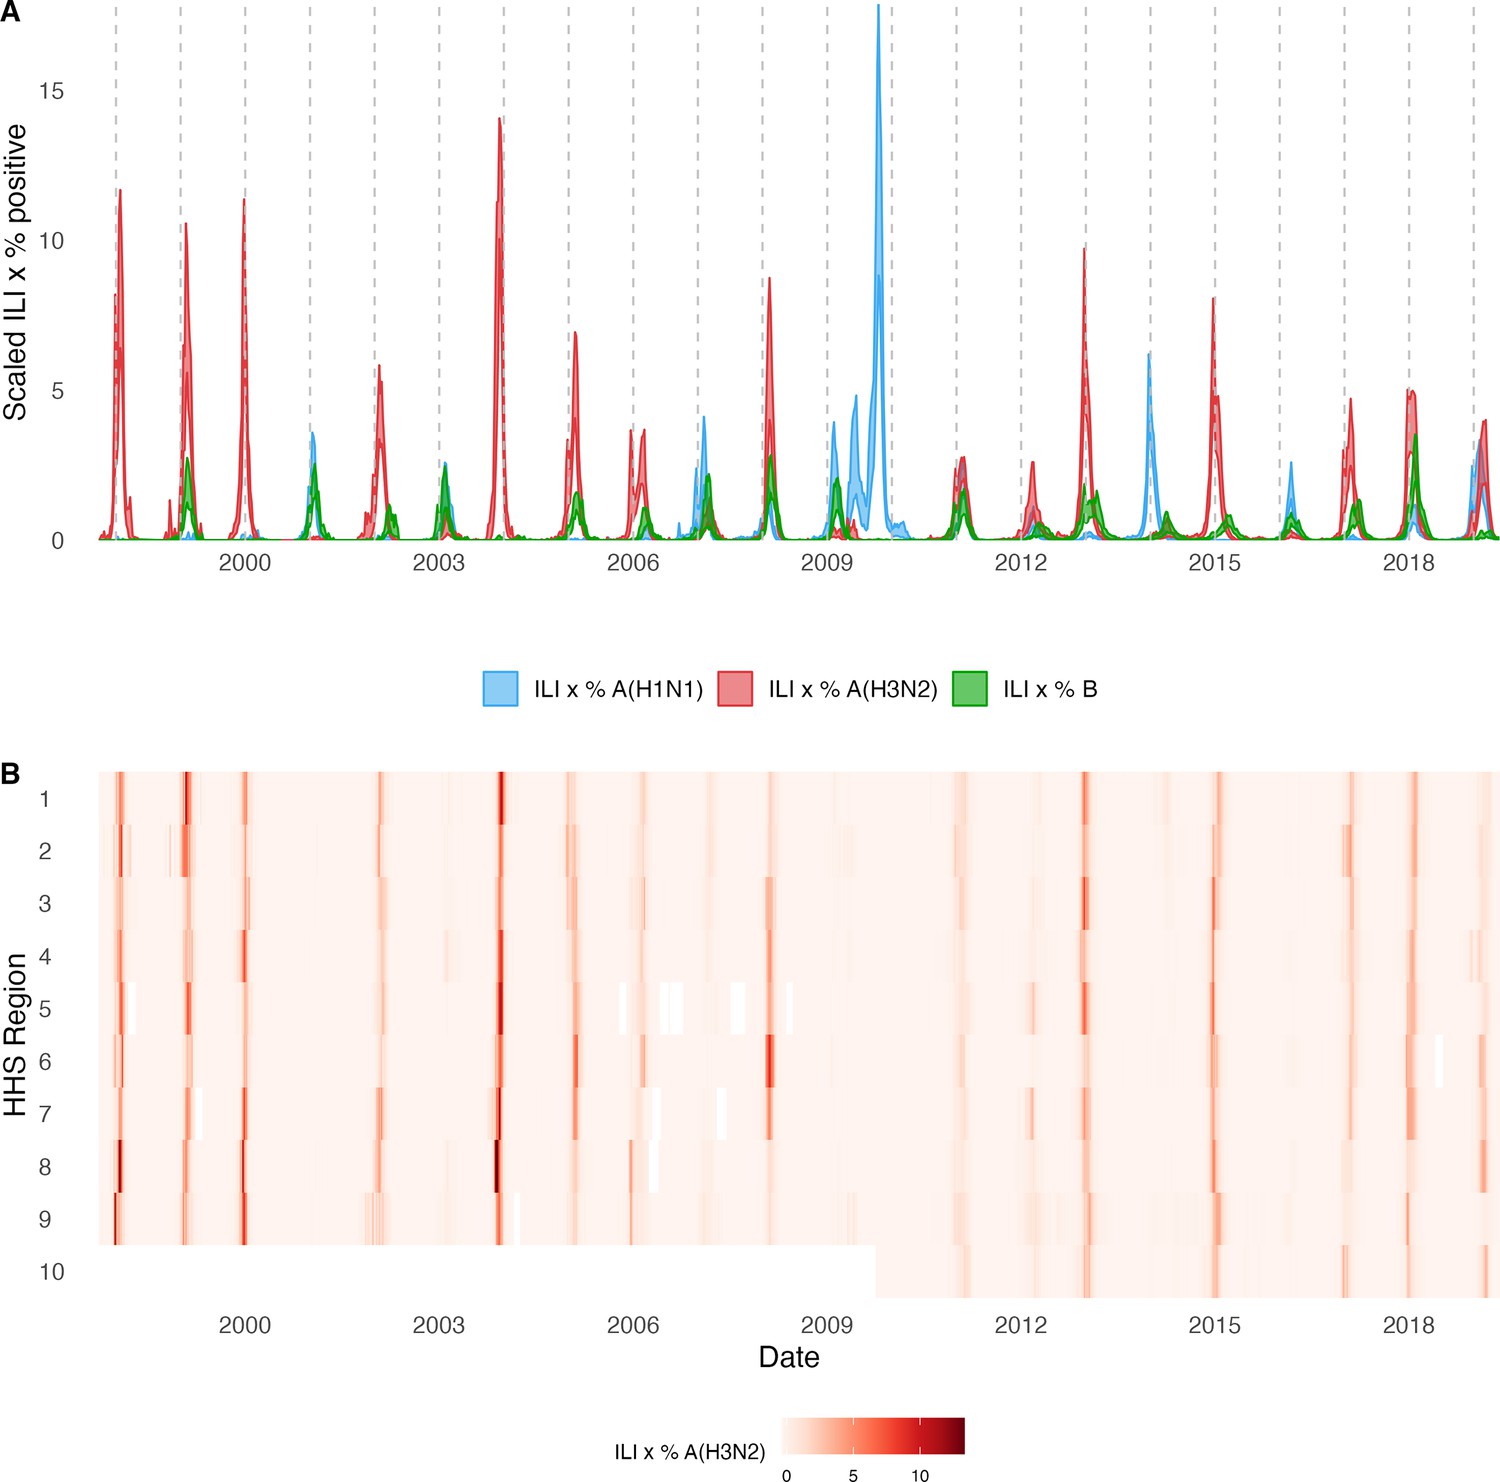
Annual influenza A(H3N2) epidemics in the United States, 1997 – 2019.
(A) Weekly incidence of influenza A(H1N1) (blue), A(H3N2) (red), and B (green) averaged across 10 HHS regions (Region 1: Boston; Region 2: New York City; Region 3: Washington, DC; Region 4: Atlanta; Region 5: Chicago; Region 6: Dallas, Region 7: Kansas City; Region 8: Denver; Region 9: San Francisco; Region 10: Seattle). Incidences are the proportion of influenza-like illness (ILI) visits among all outpatient visits, multiplied by the proportion of respiratory samples testing positive for each influenza type/subtype. Time series are 95% confidence intervals of regional incidence estimates. Vertical dashed lines indicate January 1 of each year. (B) Intensity of weekly influenza A(H3N2) incidence in 10 HHS regions. White tiles indicate weeks when influenza-like-illness data or virological data were not reported. Data for Region 10 are not available in seasons prior to 2009.
Figure 1—figure supplement 1
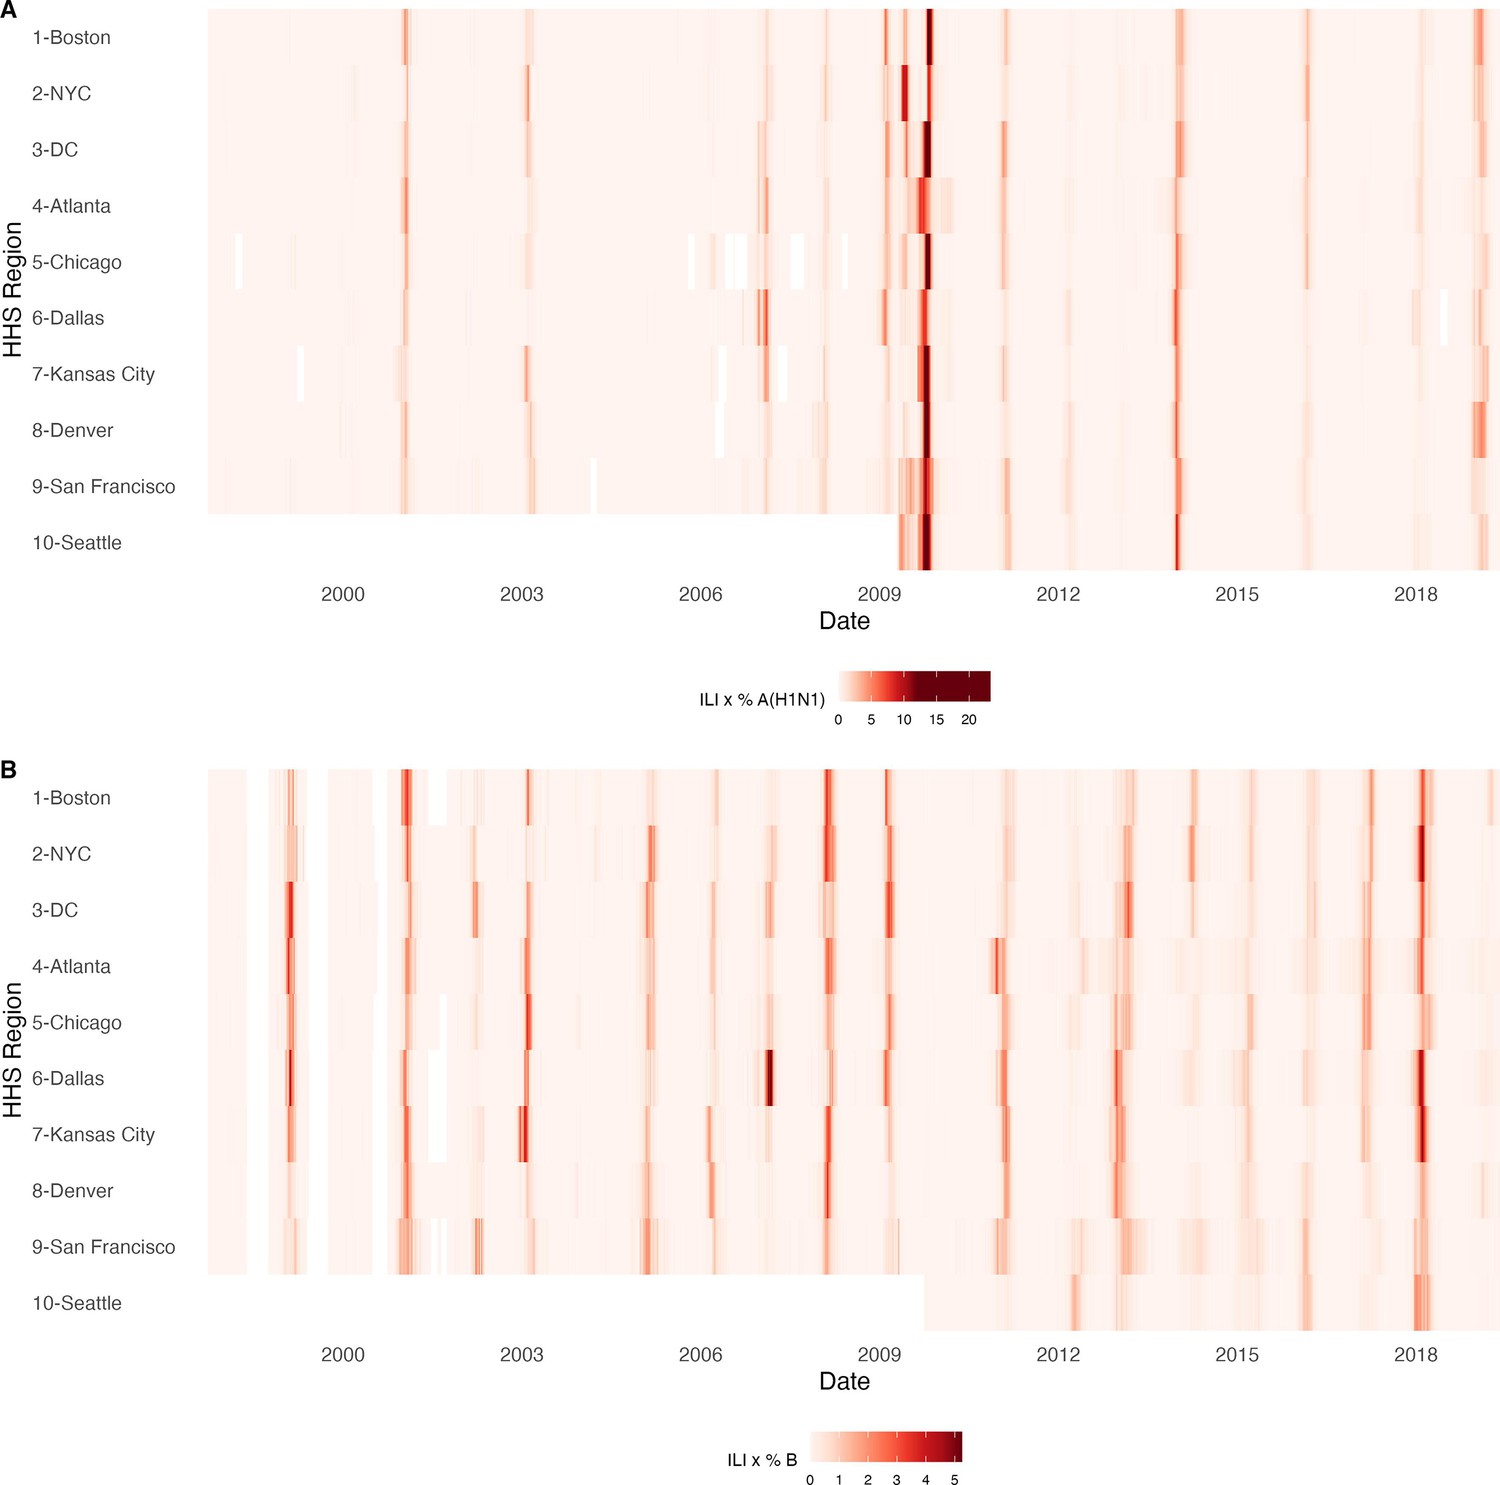
Annual influenza A(H1N1) and influenza B epidemics in the United States, 1997 - 2019.
Intensity of weekly (A) influenza A(H1N1) and (B) influenza B incidence in 10 HHS regions. Incidences are the proportion of influenza-like illness (ILI) visits among all outpatient visits, multiplied by the proportion of respiratory samples testing positive for each influenza type/subtype. Seasonal and pandemic A(H1N1) are combined as influenza A(H1N1), and the Victoria and Yamagata lineages of influenza B are combined as influenza B. White tiles indicate weeks when either influenza-like-illness cases or virological data were not reported. Data for Region 10 are not available in seasons prior to 2009.
Figure 1—figure supplement 2
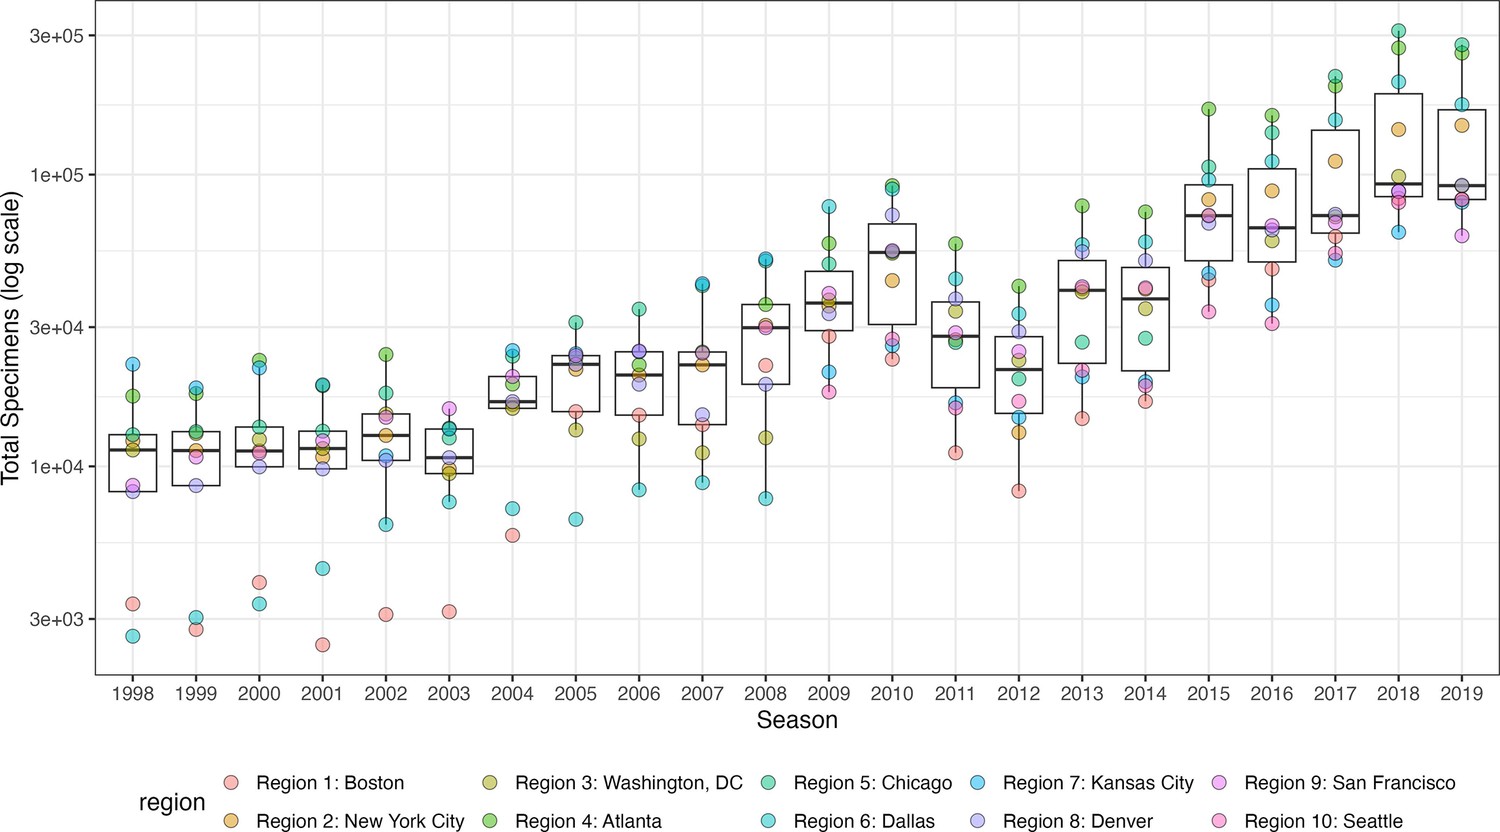
Influenza test volume systematically increases in all HHS regions after the 2009 A(H1N1) pandemic.
Each point represents the total number of influenza tests in each HHS region in each season, as reported by the U.S. CDC WHO Collaborating Center for Surveillance, Epidemiology and Control of Influenza. In each boxplot, the whiskers extend to the first and third quartiles of the distribution, and the centre bar represents the median number of specimens. Data for Region 10 are not available in seasons prior to 2009.
Figure 1—figure supplement 3
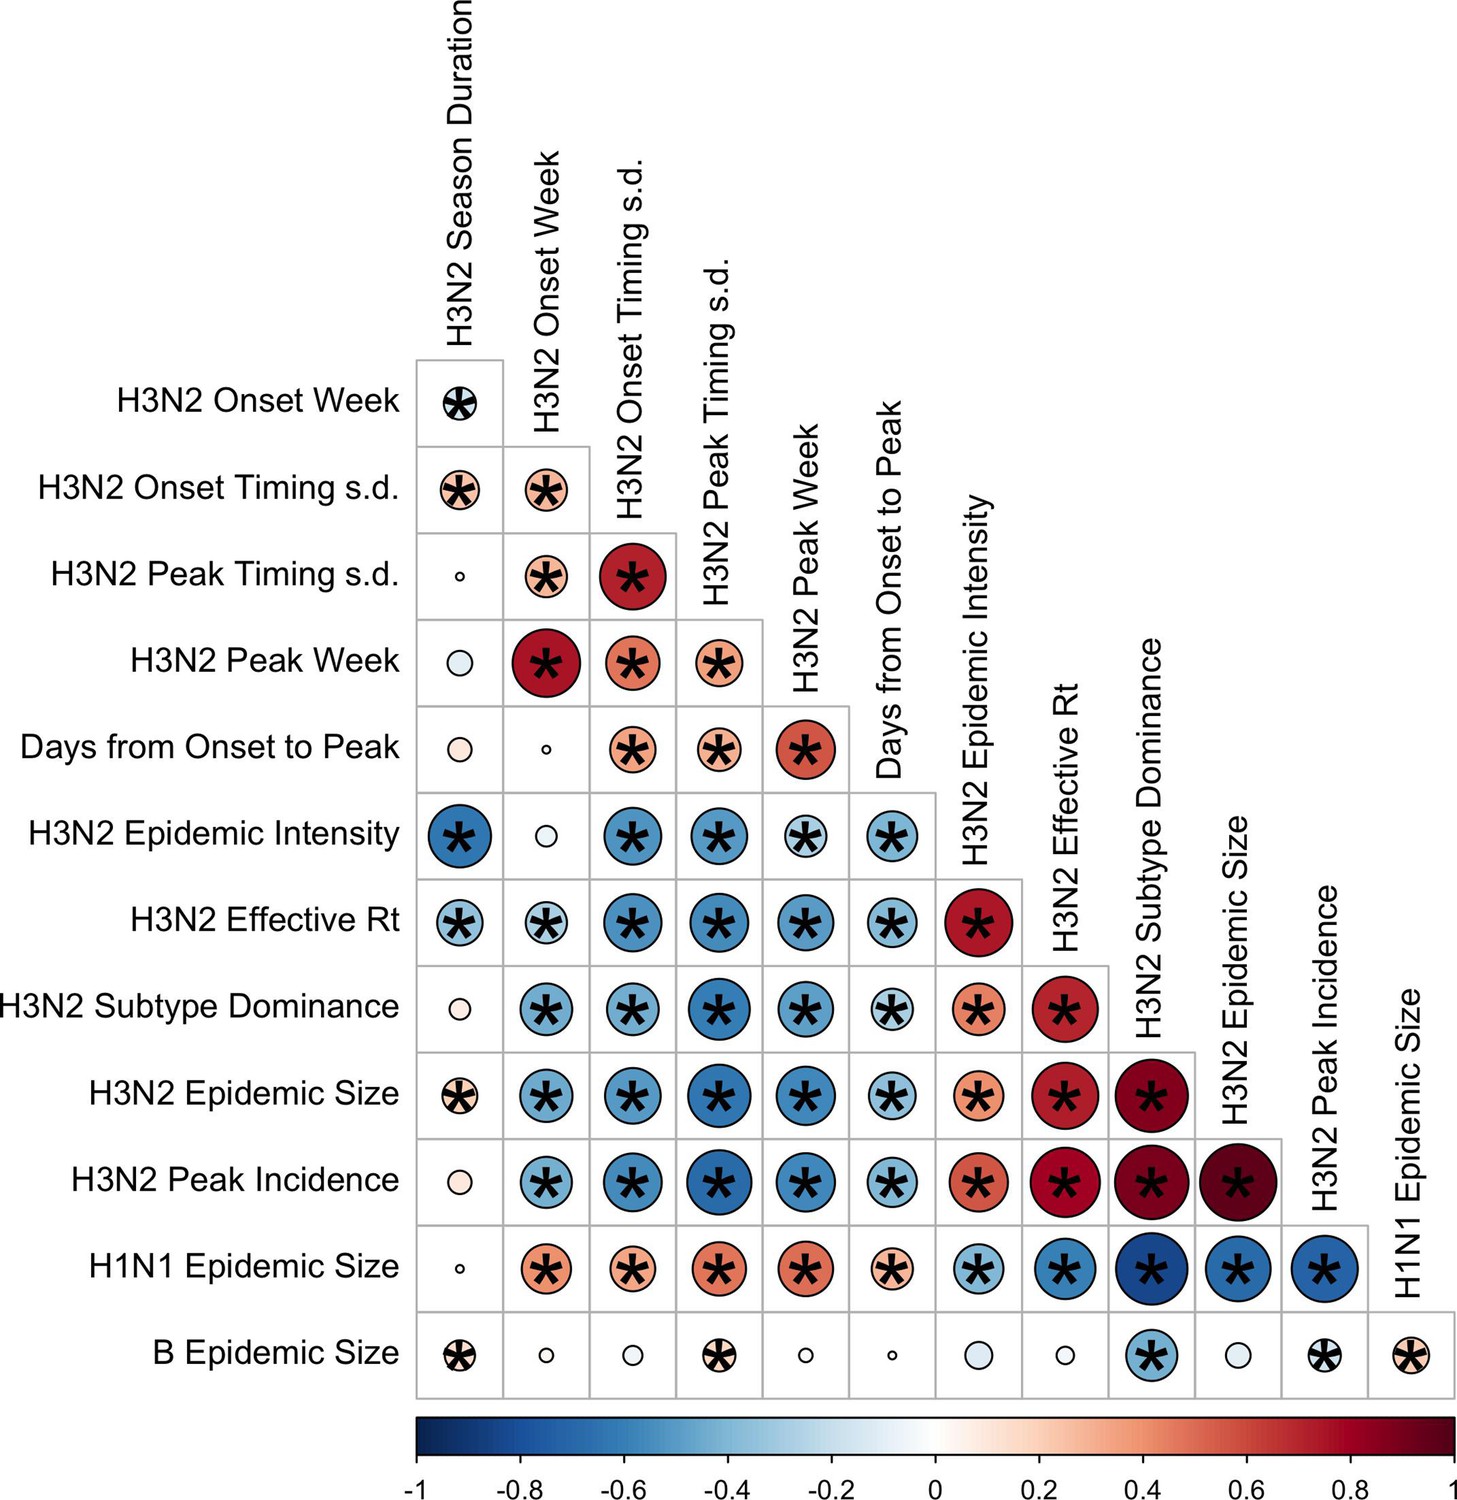
Pairwise correlations between seasonal influenza A(H3N2), A(H1N1), and B epidemic metrics.
Spearman’s rank correlations among indicators of A(H3N2) epidemic timing, including onset week, peak week, regional variation (s.d.) in onset and peak timing, the number of days from epidemic onset to peak incidence, and seasonal duration, indicators of A(H3N2) epidemic magnitude, including epidemic intensity (i.e. the ‘sharpness’ of the epidemic curve), transmissibility (maximum effective reproduction number, ), subtype dominance, epidemic size, and peak incidence. Correlations between the circulation of other influenza types/subtypes and A(H3N2) epidemic burden and timing are also included. The color of each circle indicates the strength and direction of the association, from dark red (strong positive correlation) to dark blue (strong negative correlation). Stars within circles indicate statistical significance (adjusted p<0.05). The Benjamini and Hochberg method was used to adjust p-values for multiple testing.
Figure 2 with 7 supplements
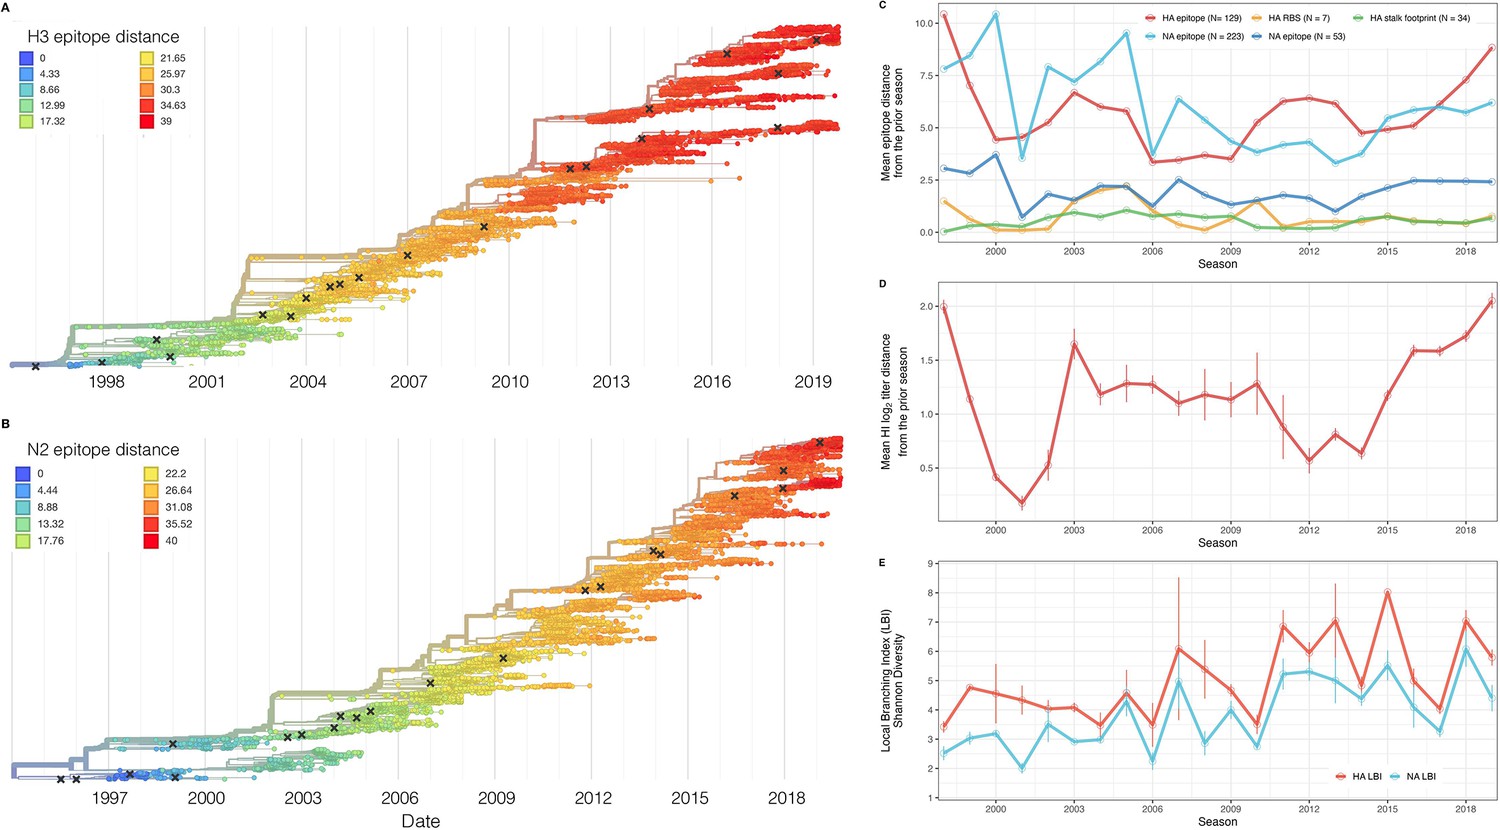
Antigenic and genetic evolution of seasonal influenza A(H3N2) viruses, 1997 – 2019.
(A–B) Temporal phylogenies of (A) hemagglutinin (H3) and (B) neuraminidase (N2) gene segments. Tip color denotes the Hamming distance from the root of the tree, based on the number of substitutions at epitope sites in H3 (N=129 sites) and N2 (N=223 sites). Black ‘X’ marks indicate the phylogenetic positions of U.S. recommended vaccine strains. (C–D) Seasonal genetic and antigenic distances are the mean distance between A(H3N2) viruses circulating in the current season and viruses circulating in the prior season ( – 1), measured by (C) five sequence-based metrics (HA epitope (N=129), HA receptor binding site (RBS) (N=7), HA stalk footprint (N=34), NA epitope (N=223 or N=53)) and (D) hemagglutination inhibition (HI) titer measurements. (E) The Shannon diversity of H3 and N2 local branching index (LBI) values in each season. Vertical bars in (C), (D), and (E) are 95% confidence intervals of seasonal estimates from five bootstrapped phylogenies.
-
Figure 2—source data 1
A/H3 sequence counts in five subsampled datasets.
We downloaded all H3 sequences and associated metadata from the GISAID EpiFlu database and focused our analysis on complete H3 sequences that were sampled between January 1, 1997, and October 1, 2019. To account for variation in sequence availability across global regions, we subsampled the selected sequences five times to representative sets of no more than 50 viruses per month, with preferential sampling for North America. Each month up to 25 viruses were selected from North America (when available) and up to 25 viruses were selected from nine other global regions (when available), with even sampling across the other global regions (China, Southeast Asia, West Asia, Japan and Korea, South Asia, Oceania, Europe, South America, and Africa).
- https://cdn.elifesciences.org/articles/91849/elife-91849-fig2-data1-v1.xlsx
-
Figure 2—source data 2
A/N2 sequence counts in five subsampled datasets.
We downloaded all N2 sequences and associated metadata from the GISAID EpiFlu database and focused our analysis on complete N2 sequences that were sampled between January 1, 1997, and October 1, 2019. To account for variation in sequence availability across global regions, we subsampled the selected sequences five times to representative sets of no more than 50 viruses per month, with preferential sampling for North America. Each month up to 25 viruses were selected from North America (when available) and up to 25 viruses were selected from nine other global regions (when available), with even sampling across the other global regions (China, Southeast Asia, West Asia, Japan and Korea, South Asia, Oceania, Europe, South America, and Africa).
- https://cdn.elifesciences.org/articles/91849/elife-91849-fig2-data2-v1.xlsx
Figure 2—figure supplement 1
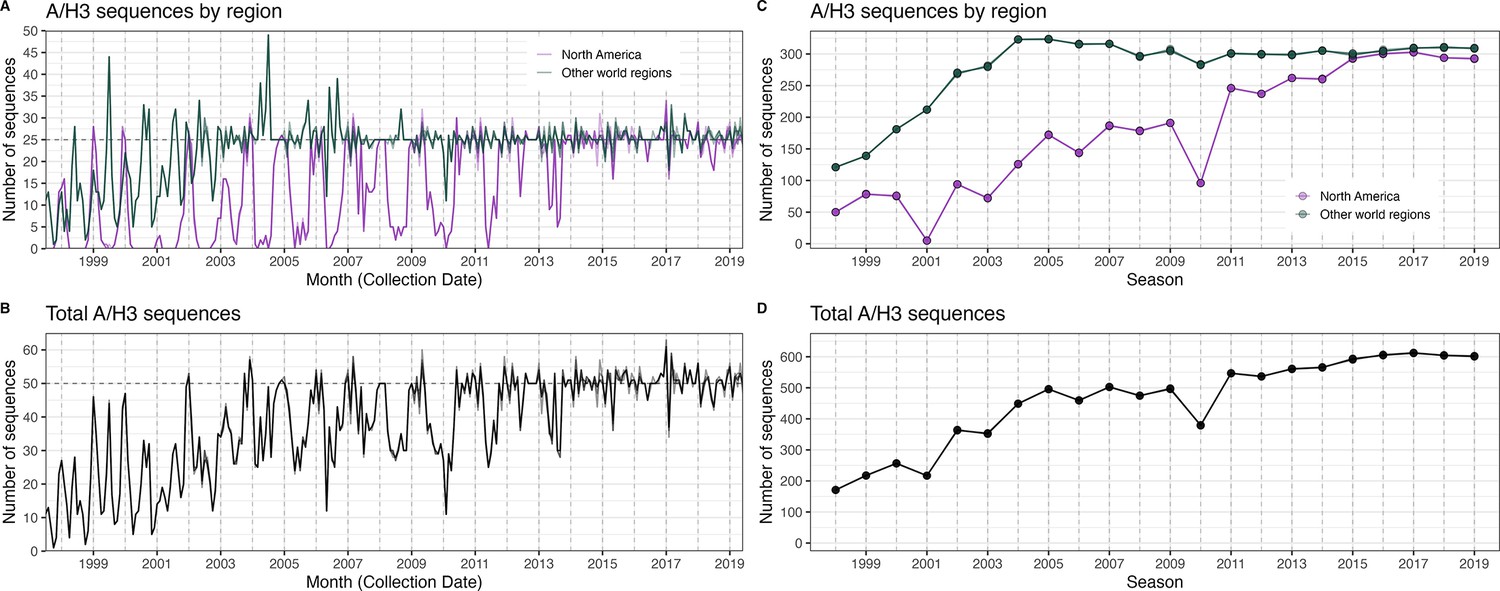
The number of A/H3 sequences in five subsampled datasets in each month and in each influenza season.
In each figure, the five subsampled datasets are plotted individually but individual time series are difficult to discern due to minor differences in sequence counts across the datasets. (A) The number of sequences in subsampled datasets in each month collected in North America (purple) versus nine other world regions combined (dark green). (B) The total number of sequences in subsampled datasets collected in each month in all world regions combined. (C) The number of sequences in subsampled datasets in each season collected in North America (purple) versus nine other world regions combined (dark green). (D) The total number of sequences in subsampled datasets collected in each season in all world regions combined.
Figure 2—figure supplement 2
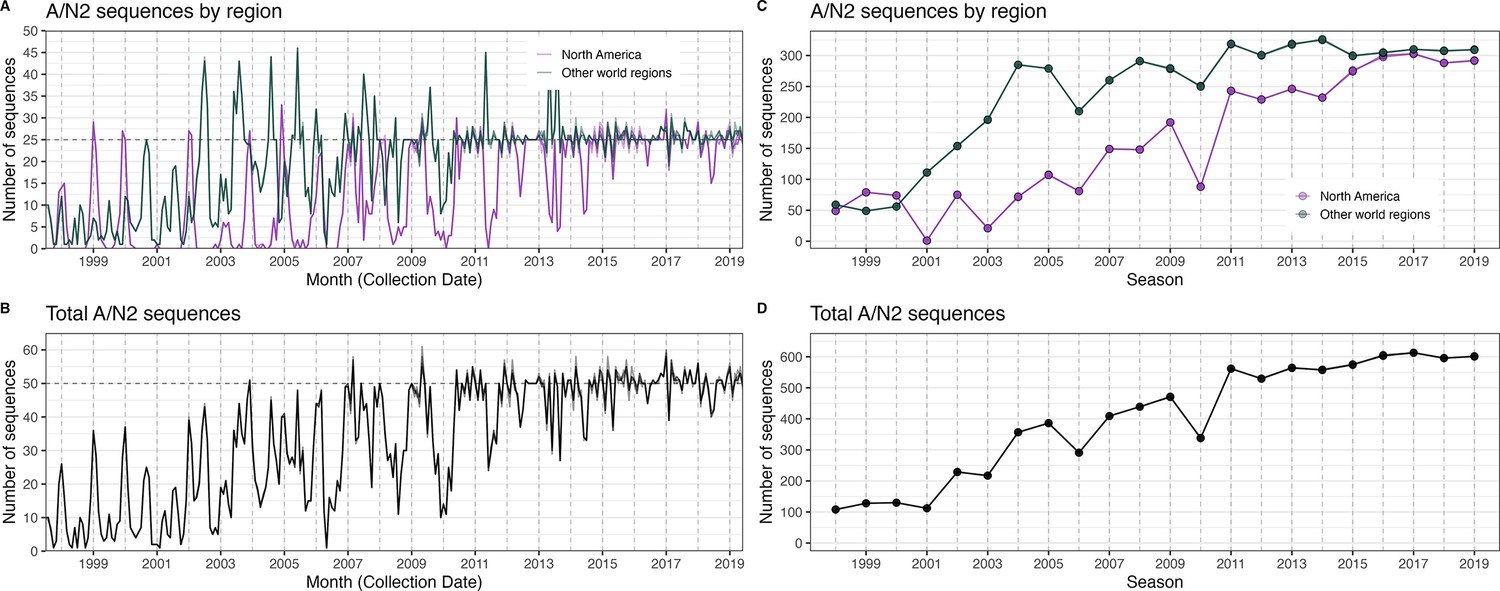
The number of A/N2 sequences in five subsampled datasets in each month and in each influenza season.
In each figure, the five subsampled datasets are plotted individually but individual time series are difficult to discern due to minor differences in sequence counts across the datasets. (A) The number of sequences in subsampled datasets in each month collected in North America (purple) versus nine other world regions combined (dark green). (B) The total number of sequences in subsampled datasets collected in each month in all world regions combined. (C) The number of sequences in subsampled datasets in each season collected in North America (purple) versus nine other world regions combined (dark green). (D) The total number of sequences in subsampled datasets in each season in all world regions combined.
Figure 2—figure supplement 3
Comparison of seasonal antigenic drift measured by substitutions at H3 epitope sites and HI log2 titer measurements, from seasons 1997–1998 to 2018–2019.
Spearman’s rank correlations between H3 epitope distance and HI log2 titer distance at (A) one-season lags and (B) two-season lags. Correlation coefficients and associated p-values are shown in the top right section of each plot. Seasonal antigenic distance is the mean distance between viruses circulating in the current season and viruses circulating in the prior season ( – 1 year, one-season lags) or two prior seasons ago ( – 2 years, two-season lags). Seasonal distances are scaled because H3 epitope distance and HI log2 titer distance use different units of measurement. Point labels indicate the current influenza season, and point color denotes the relative timing of influenza seasons, with earlier seasons shaded dark purple (e.g. 1997–1998) and later seasons shaded light yellow (e.g. 2018–2019). H3 epitope distance and HI log2 titer distance at two-season lags capture expected ‘jumps’ in antigenic drift during key seasons previously associated with major antigenic transitions (Smith et al., 2004), such as the SY97 cluster seasons (1997–1998, 1998–1999, 1999–2000), the FU02 cluster season (2003–2004), and the CA04 cluster season (2004–2005).
Figure 2—figure supplement 4
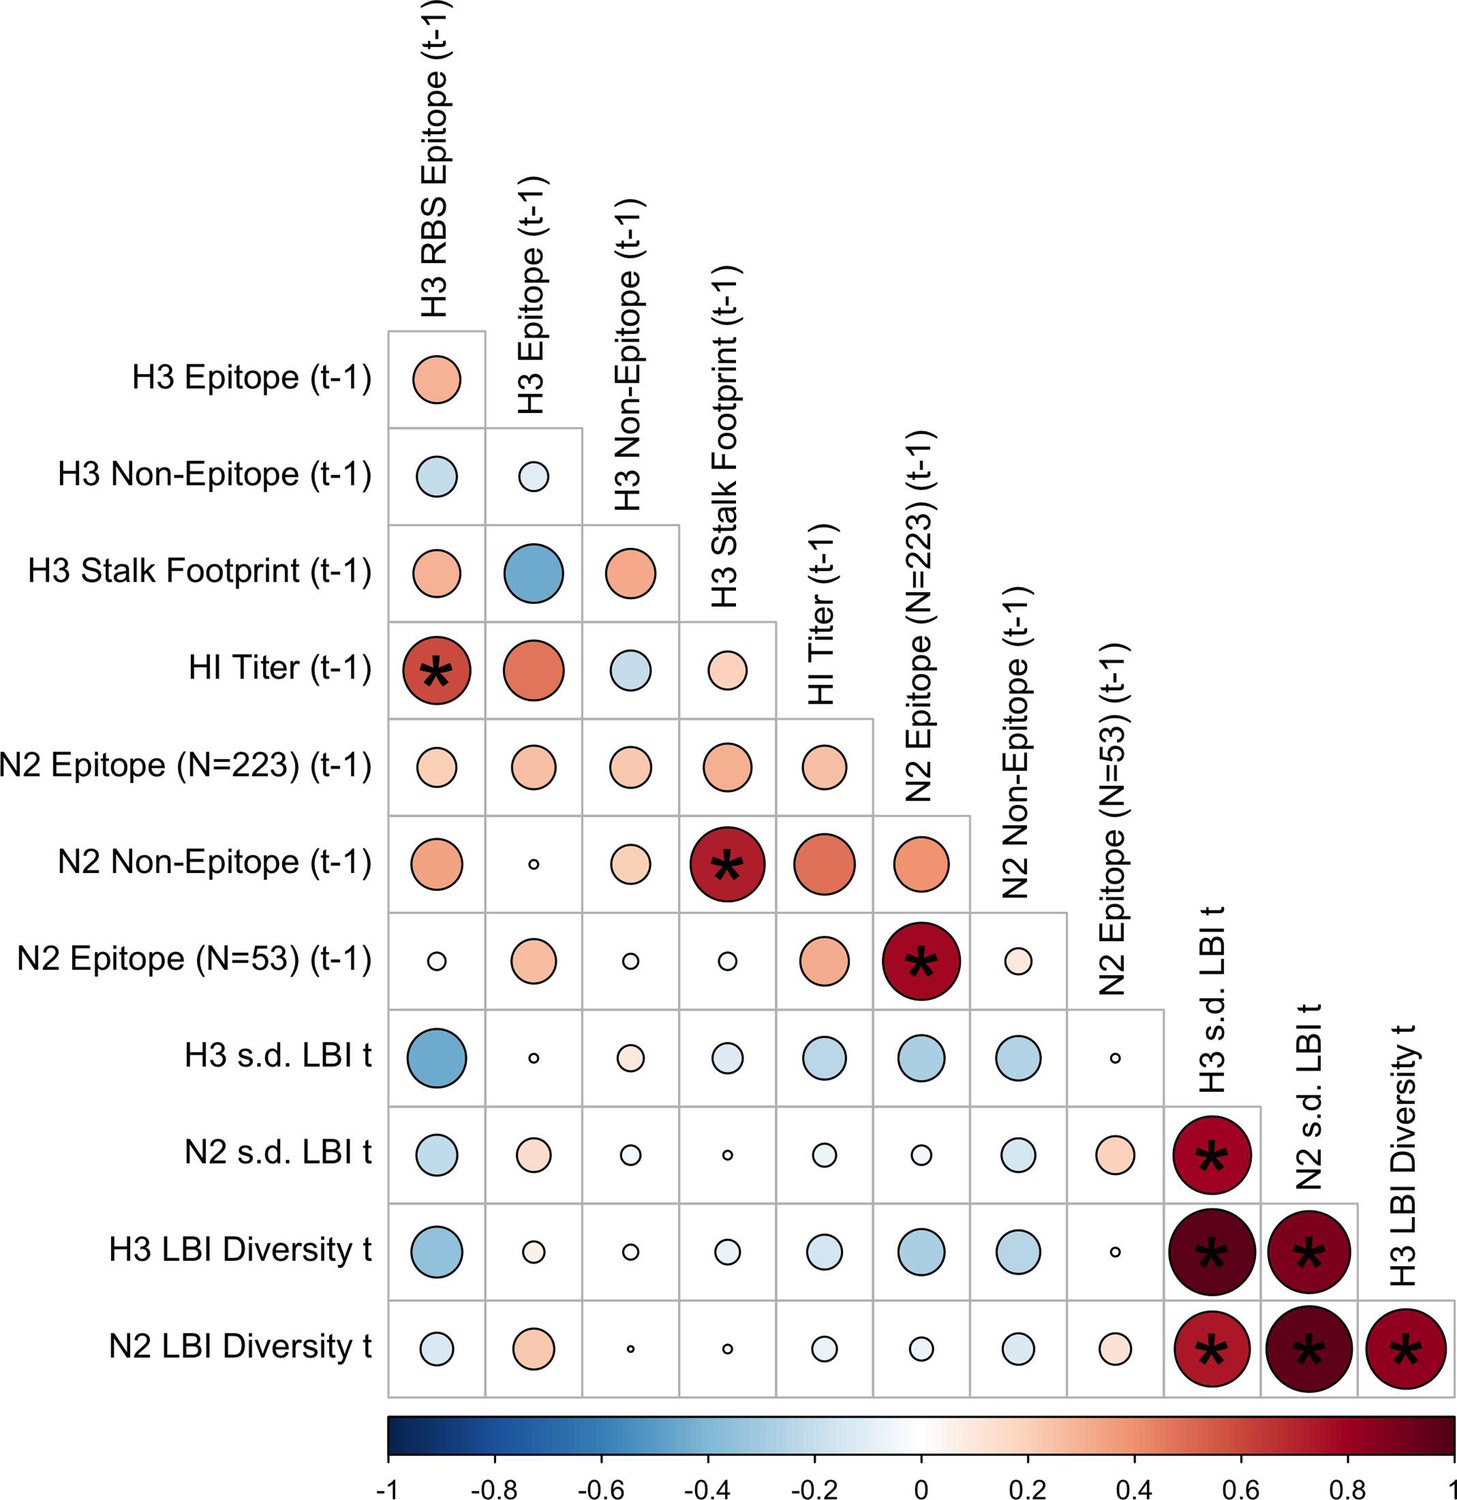
Pairwise correlations between H3 and N2 evolutionary indicators (one-season lags).
Spearman’s rank correlations between seasonal measures of H3 and N2 evolution, including H3 RBS distance, H3 epitope distance, H3 non-epitope distance, H3 stalk footprint distance, HI log2 titer distance, N2 epitope distance based on 223 or 53 epitope sites, N2 non-epitope distance, and the standard deviation (s.d.) and Shannon diversity of H3 and N2 local branching index (LBI) values in the current season . Seasonal distances were estimated as the mean distance between viruses circulating in the current season and viruses circulating in the prior season ( – 1). The color of each circle indicates the strength and direction of the association, from dark red (strong positive correlation) to dark blue (strong negative correlation). Stars within circles indicate statistical significance (adjusted p<0.05). The Benjamini and Hochberg method was used to adjust p-values for multiple testing.
Figure 2—figure supplement 5
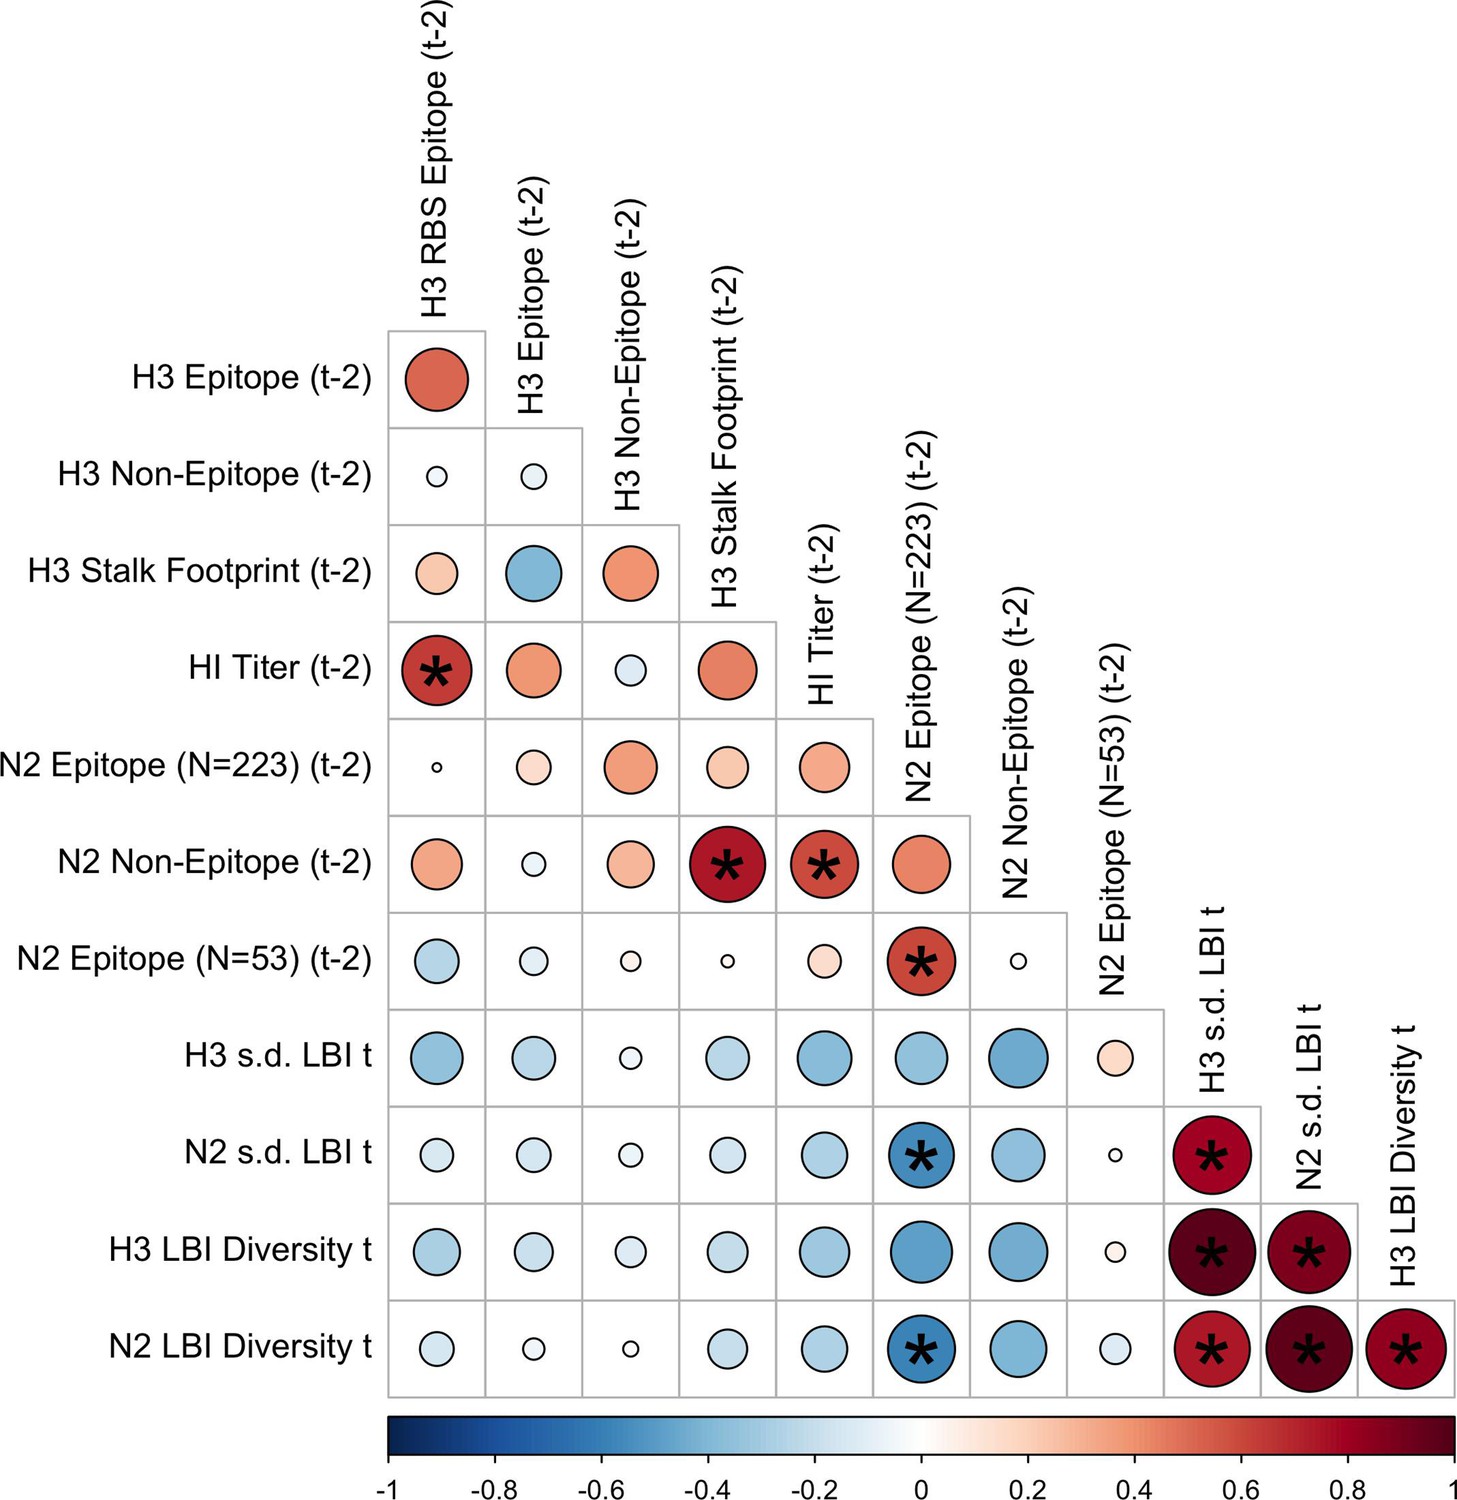
Pairwise correlations between H3 and N2 evolutionary indicators (two-season lags).
We measured Spearman’s rank correlations between seasonal measures of H3 and N2 evolution, including H3 RBS distance, H3 epitope distance, H3 non-epitope distance, H3 stalk footprint distance, HI log2 titer distance, N2 epitope distance based on 223 or 53 epitope sites, N2 non-epitope distance, and the standard deviation (s.d.) and Shannon diversity of H3 and N2 local branching index (LBI) values in the current season . Seasonal distances were estimated as the mean distance between viruses circulating in the current season and viruses circulating two prior seasons ago ( – 2). The color of each circle indicates the strength and direction of the association, from dark red (strong positive correlation) to dark blue (strong negative correlation). Stars within circles indicate statistical significance (adjusted p<0.05). The Benjamini and Hochberg method was used to adjust p-values for multiple testing.
Figure 2—figure supplement 6
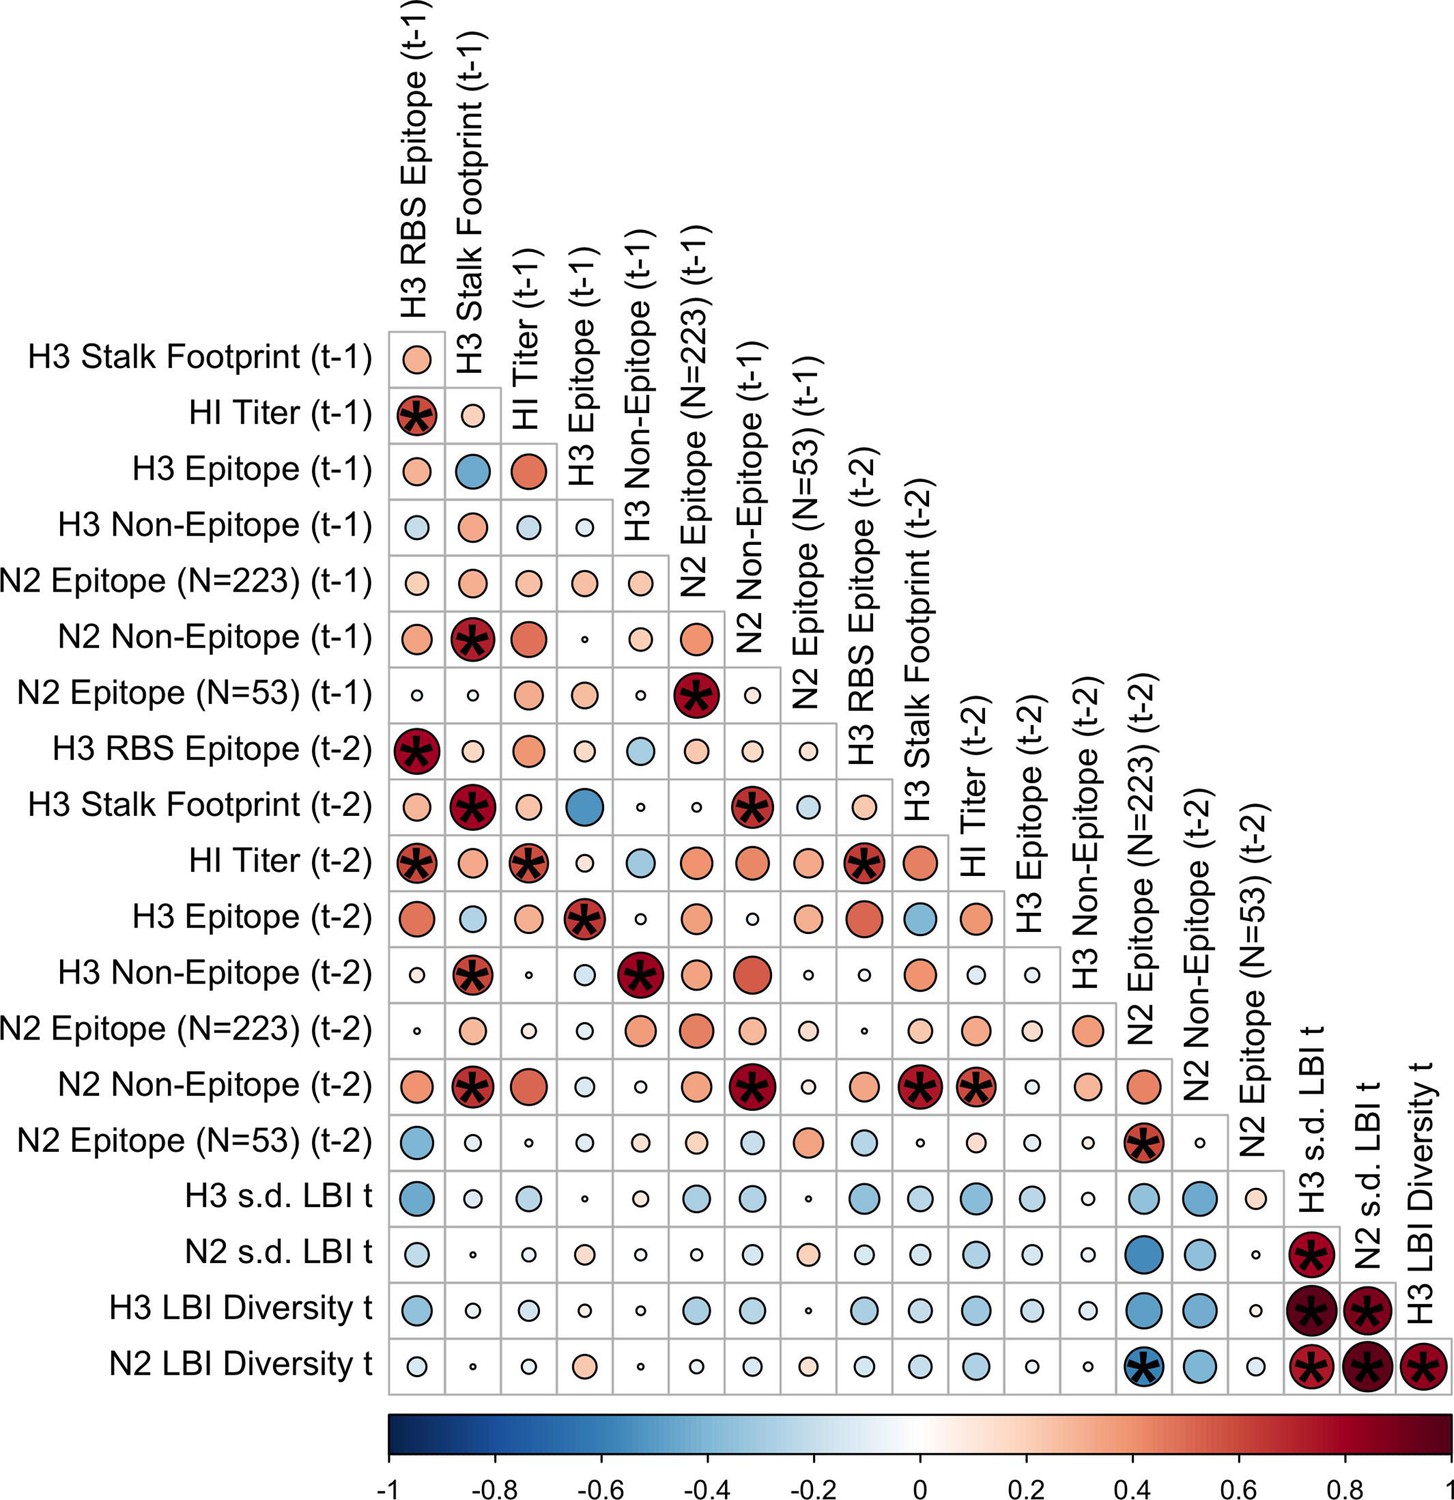
Pairwise correlations between H3 and N2 evolutionary indicators (one- and two-season lags).
We measured Spearman’s rank correlations between seasonal measures of H3 and N2 evolution, including H3 RBS distance, H3 epitope distance, H3 non-epitope distance, H3 stalk footprint distance, HI log2 titer distance, N2 epitope distance based on 223 or 53 epitope sites, N2 non-epitope distance, and the standard deviation (s.d.) and Shannon diversity of H3 and N2 local branching index (LBI) values in the current season . Seasonal distances were estimated as the mean distance between viruses circulating in the current season and viruses circulating in the prior season ( – 1) or two prior seasons ago ( – 2). The color of each circle indicates the strength and direction of the association, from dark red (strong positive correlation) to dark blue (strong negative correlation). Stars within circles indicate statistical significance (adjusted p<0.05). The Benjamini and Hochberg method was used to adjust p-values for multiple testing.
Figure 2—figure supplement 7
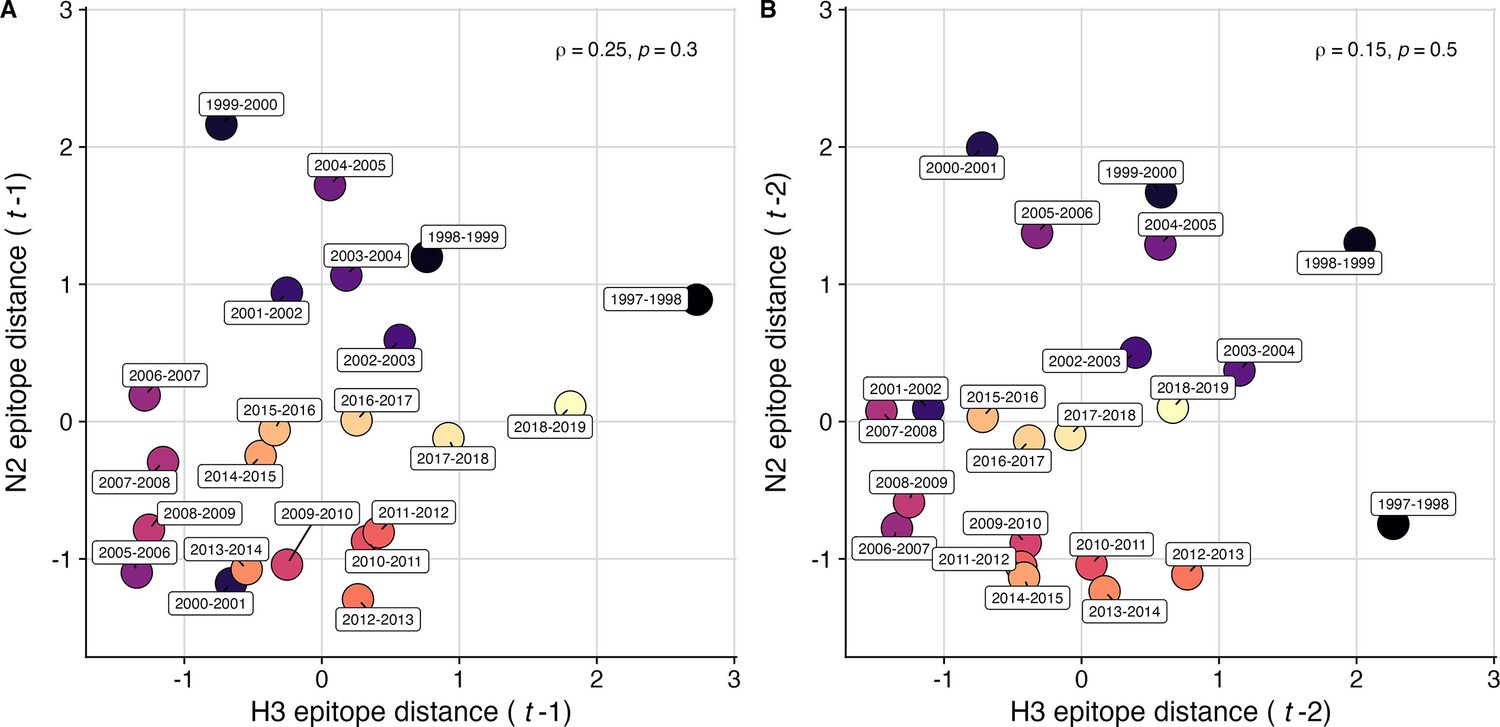
Comparison of seasonal antigenic drift measured by substitutions at H3 and N2 epitope sites, from seasons 1997–1998 to 2018–2019.
Spearman’s rank correlations between H3 epitope distance and N2 epitope distance at (A) one-season lags and (B) two-season lags. Correlation coefficients and associated p-values are shown in the top right section of each plot. Seasonal epitope distance is the mean distance between viruses circulating in the current season and viruses circulating in the prior season – 1 (one-season lag) or two prior seasons ago – 2 (two-season lag). Point labels indicate the current influenza season, and point color denotes the relative timing of influenza seasons, with earlier seasons shaded dark purple (e.g. 1997–1998) and later seasons shaded light yellow (e.g. 2018–2019). H3 epitope distance at two-season lags and N2 epitope distance at one-season lags capture expected ‘jumps’ in antigenic drift during key seasons previously associated with major antigenic transitions (Smith et al., 2004), such as the SY97 cluster seasons (1997–1998, 1998–1999, 1999–2000), the FU02 cluster season (2003–2004), and the CA04 cluster season (2004–2005).
Figure 3 with 4 supplements
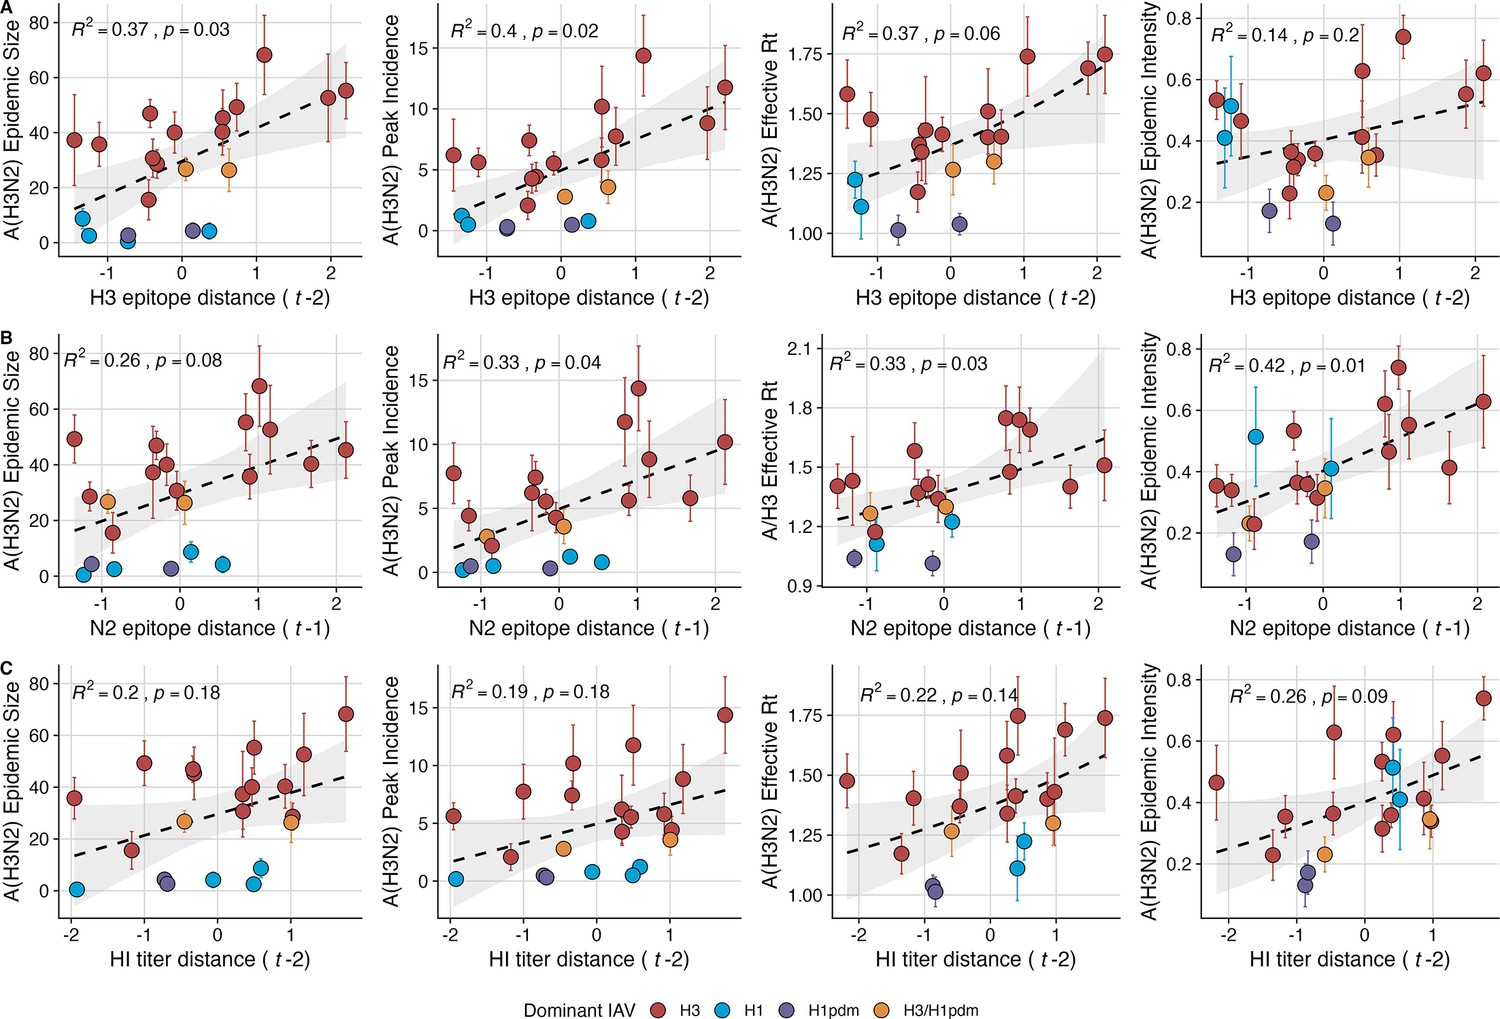
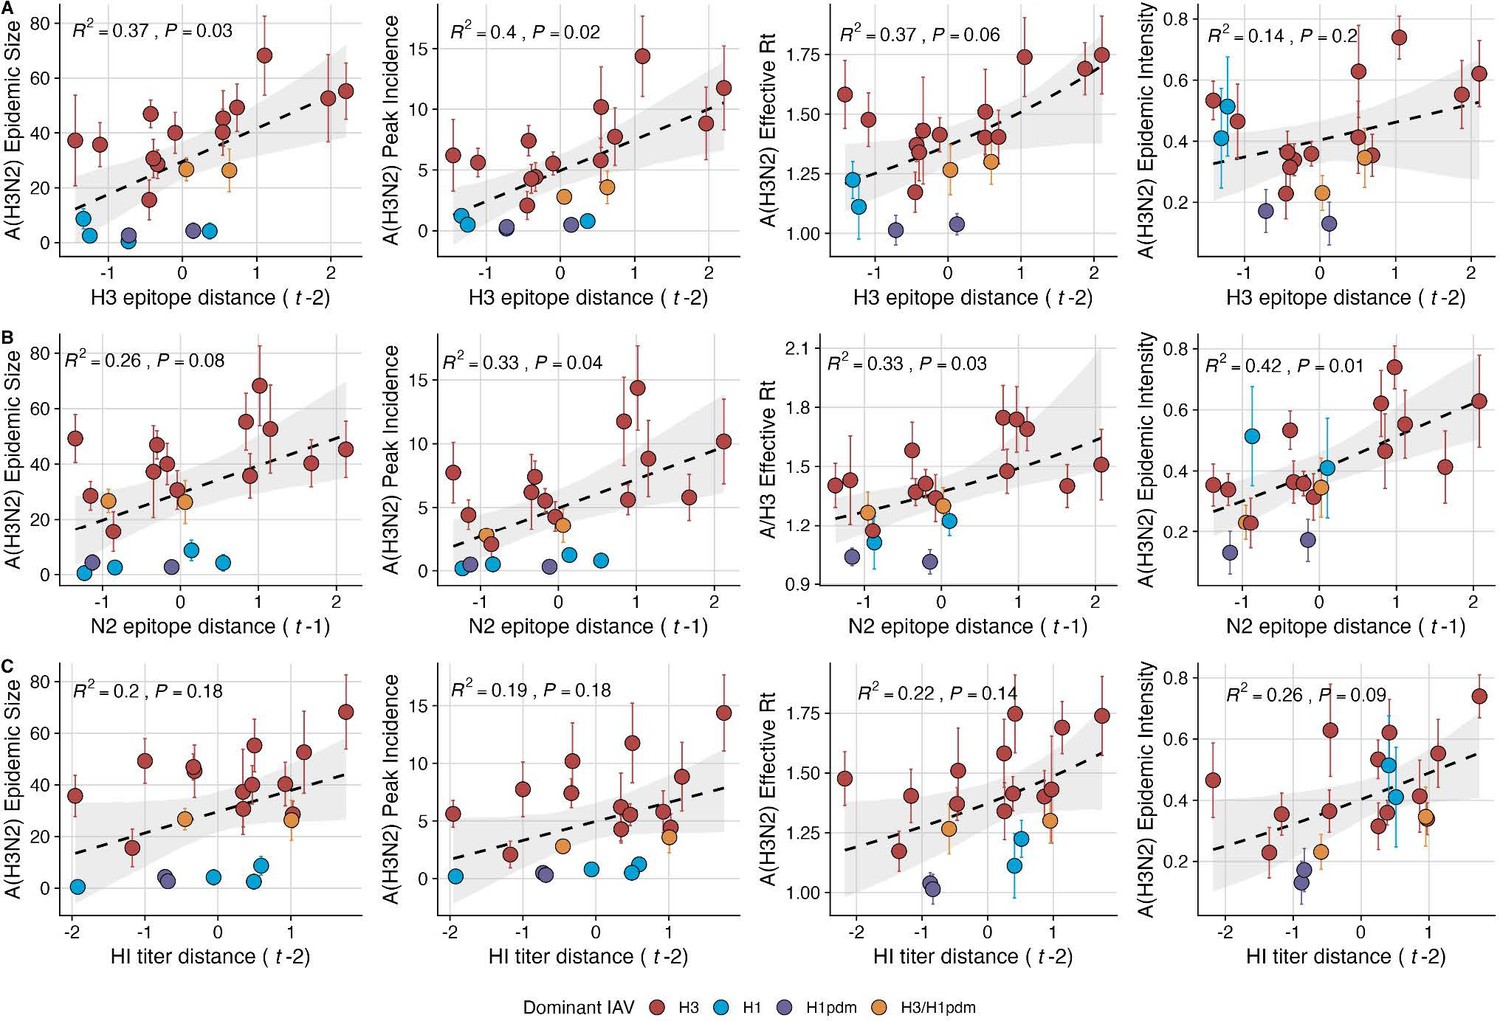
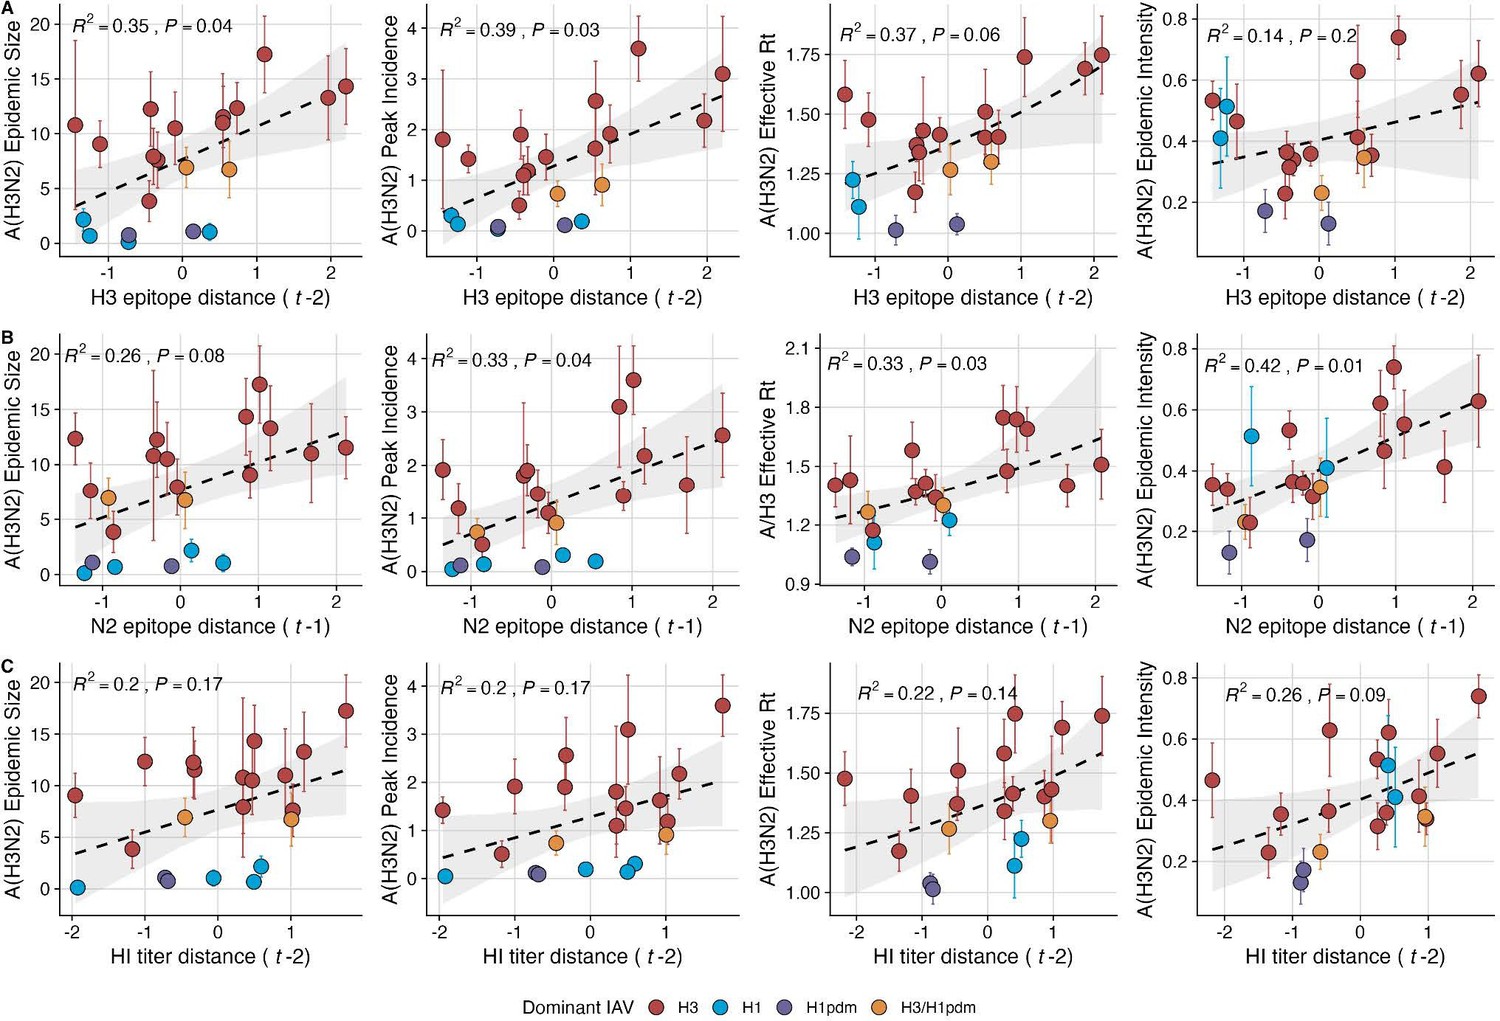
Influenza A(H3N2) antigenic drift correlates with larger, more intense annual epidemics.
A(H3N2) epidemic size, peak incidence, transmissibility (effective reproduction number, ), and epidemic intensity increase with antigenic drift, measured by (A) hemagglutinin (H3) epitope distance, (B) neuraminidase (N2) epitope distance, and (C) hemagglutination inhibition (HI) log2 titer distance. Seasonal antigenic drift is the mean titer distance or epitope distance between viruses circulating in the current season and viruses circulating in the prior season ( – 1) or two prior seasons ago ( – 2). Distances are scaled to aid in direct comparison of evolutionary indicators. Point color indicates the dominant influenza A virus (IAV) subtype based on CDC influenza season summary reports (red: A(H3N2), blue: A(H1N1), purple: A(H1N1)pdm09, orange: A(H3N2)/A(H1N1)pdm09 co-dominant), and vertical bars are 95% confidence intervals of regional estimates (pre-2009 seasons: 9 regions; post-2009 seasons: 10 regions). Seasonal mean A(H3N2) epidemic metric values were fit as a function of antigenic or genetic distance using LMs (epidemic size, peak incidence), Gaussian GLMs (effective : inverse link), or Beta GLMs (epidemic intensity: logit link) with 1000 bootstrap resamples. In each plot, the black dashed line represents the mean regression fit, and the gray shaded band shows the 95% confidence interval, based on 1000 bootstrap resamples. The R2 and associated p-value from the mean regression fit are in the top left section of each plot.
Figure 3—figure supplement 1
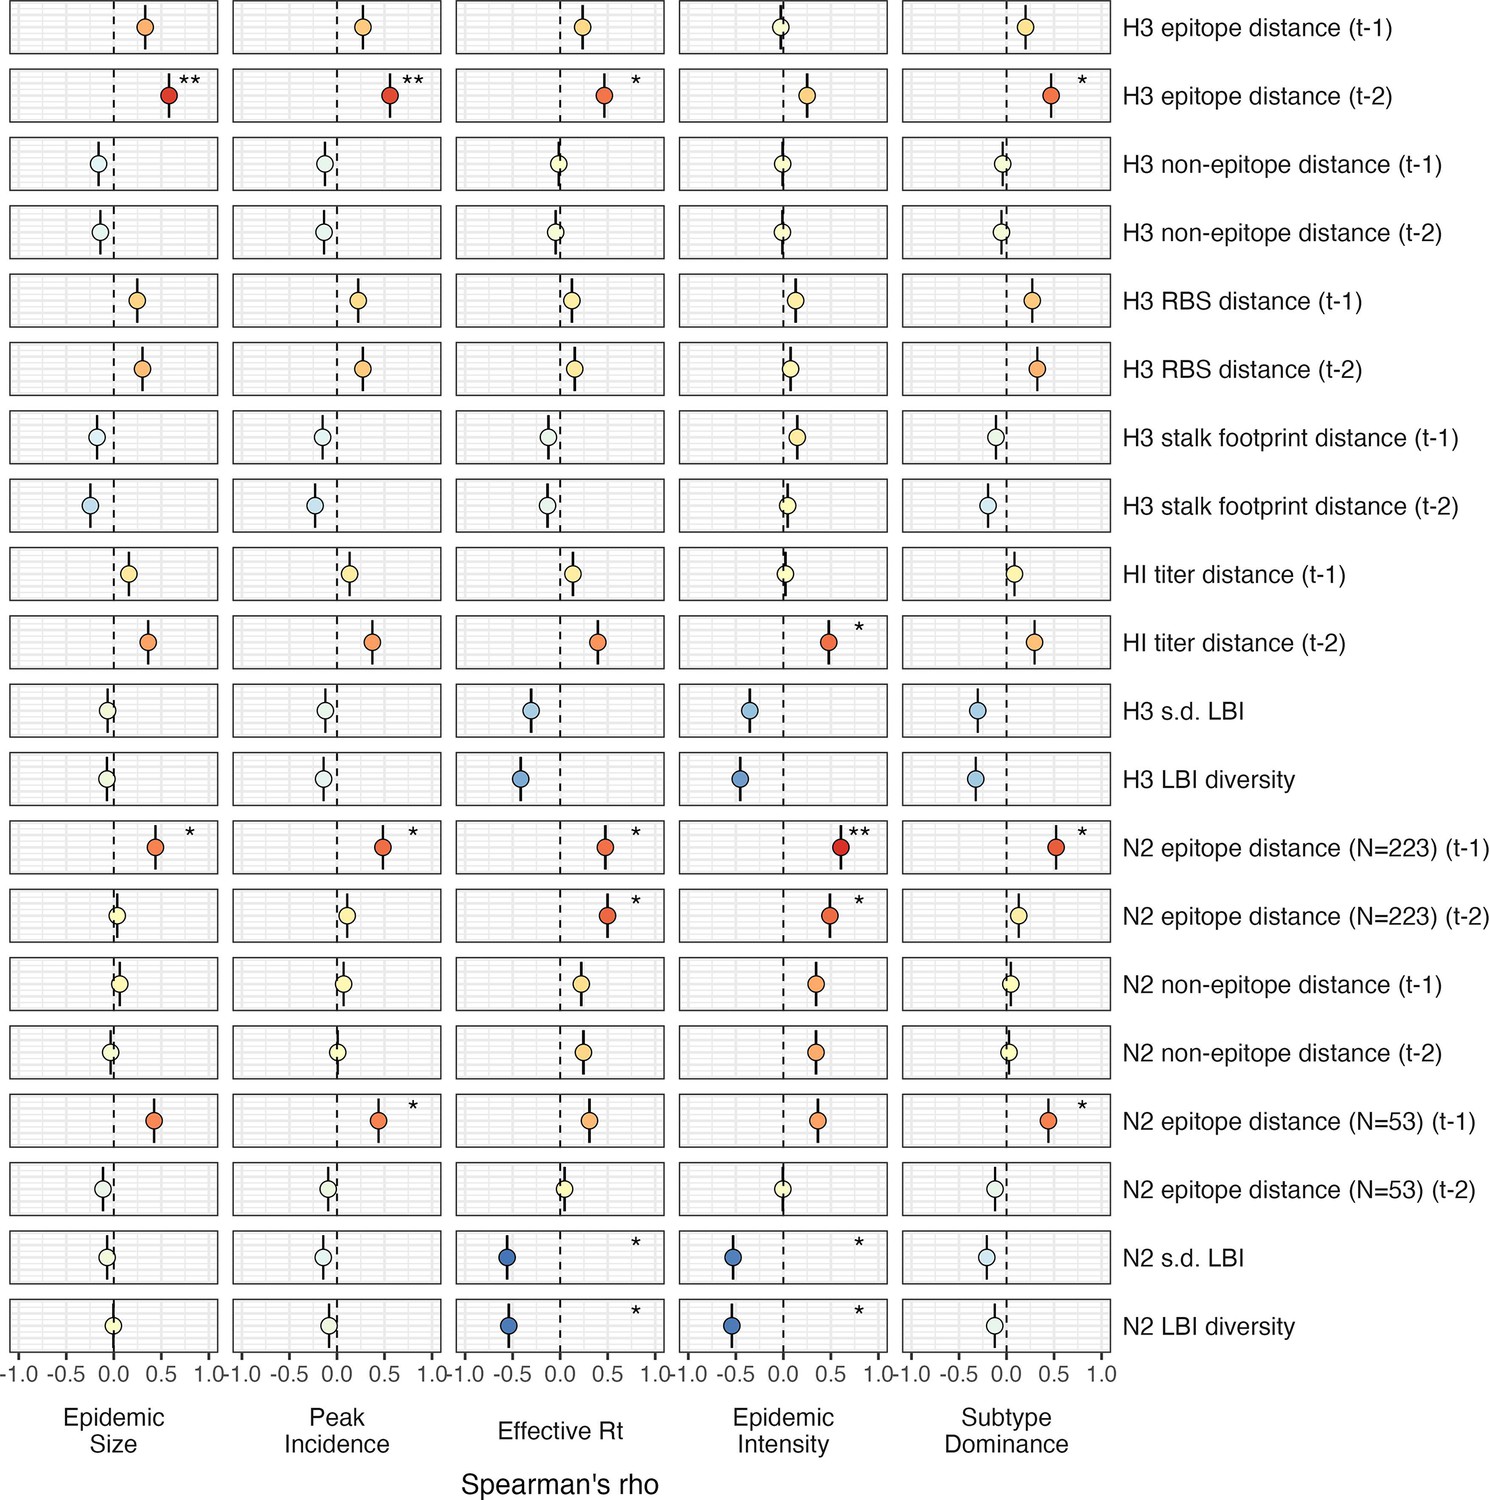
Univariate correlations between influenza A(H3N2) evolutionary indictors and epidemic impact.
Mean Spearman’s rank correlation coefficients, 95% confidence intervals of correlation coefficients, and corresponding p-values of bootstrapped (N=1000) evolutionary indicators (rows) and epidemic metrics (columns). Point color indicates the strength and direction of the association, from dark red (strong positive correlation) to dark blue (strong negative correlation), and stars indicate statistical significance (* p<0.05, ** p<0.01, *** p<0.001). Abbreviations: – 1, one-season lag; – 2, two-season lag; RBS, receptor binding site; HI, hemagglutination inhibition; s.d., standard deviation; LBI, local branching index.
Figure 3—figure supplement 2
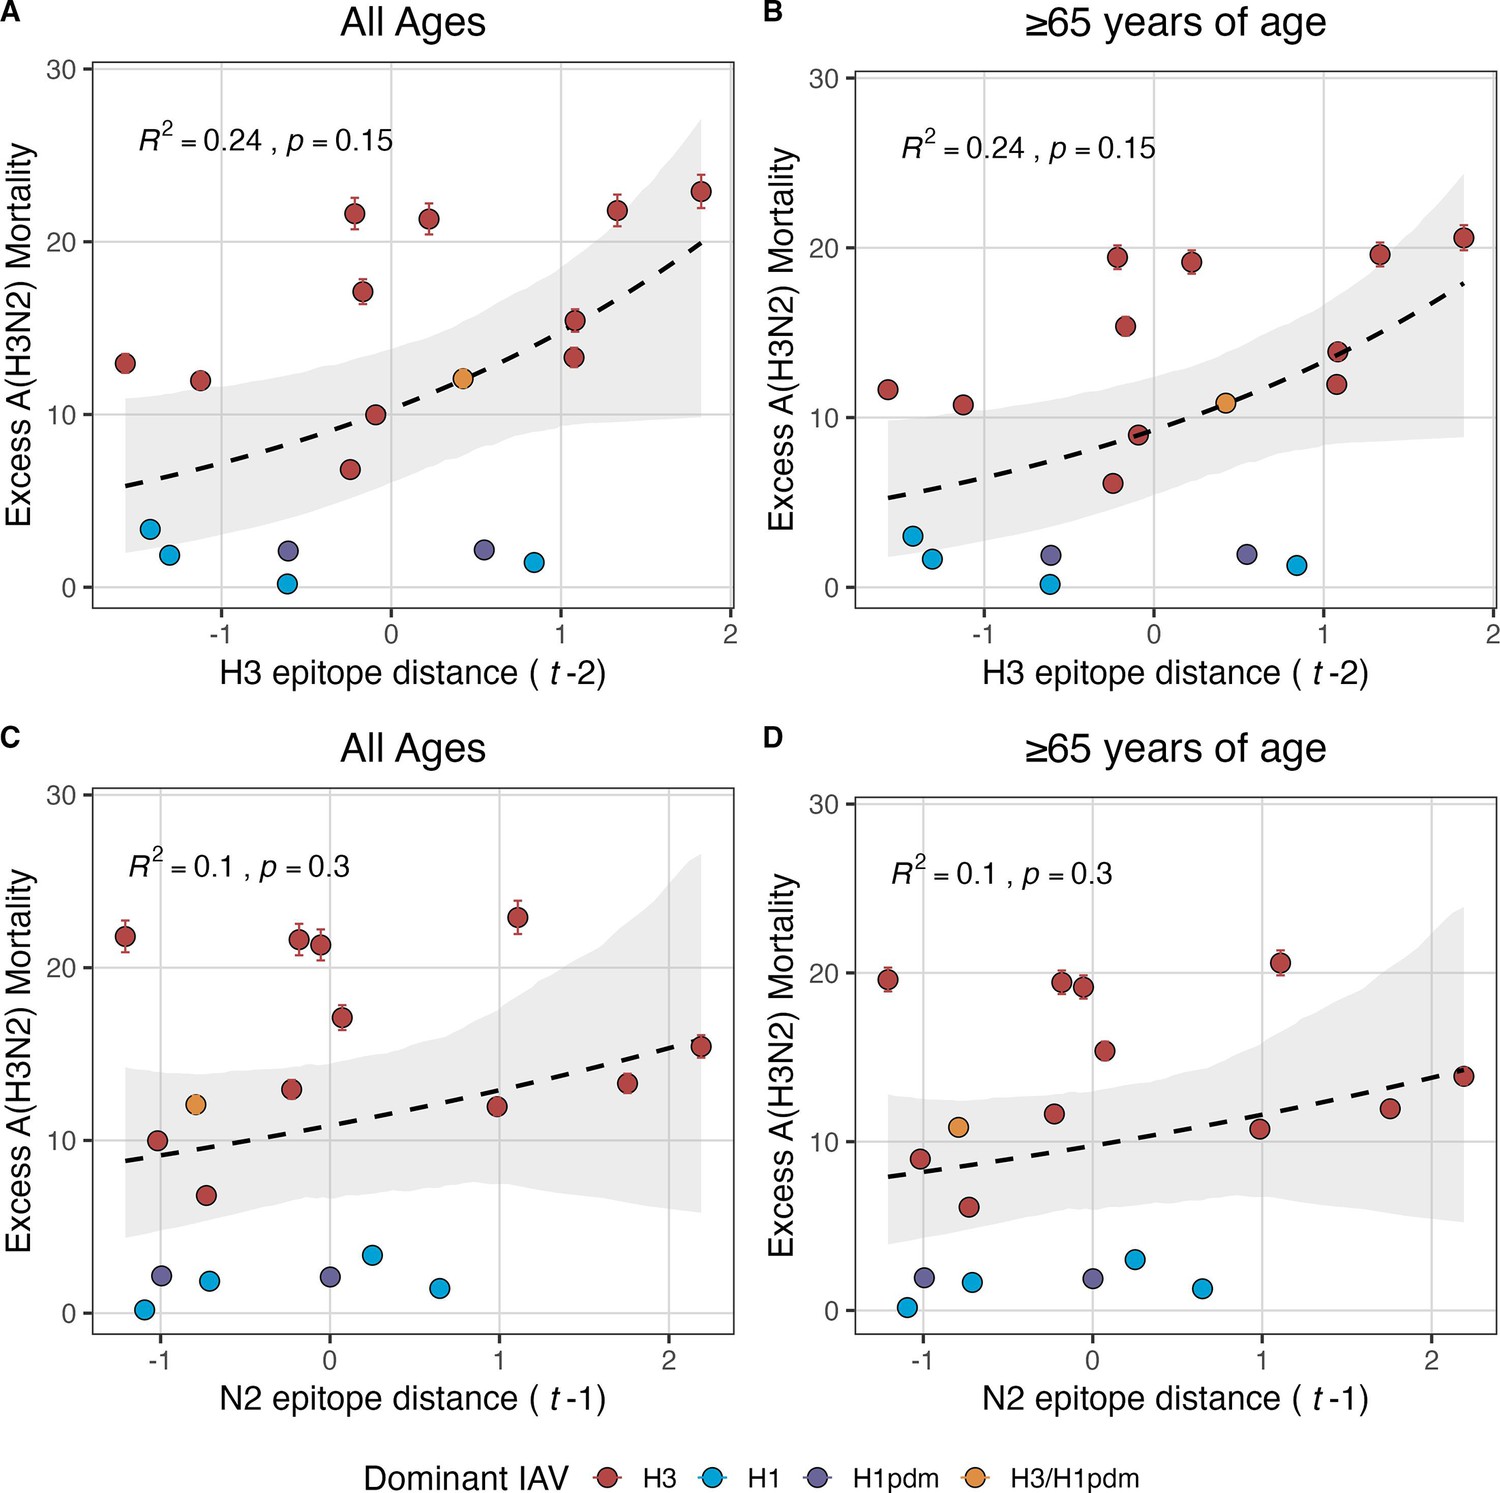
Excess influenza A(H3N2) mortality increases with H3 and N2 epitope distance, but correlations are not statistically significant.
Relationships between seasonal excess influenza A(H3N2) mortality and epitope distance are organized by gene segment and age group: (A) H3 epitope distance and all age groups, (B) H3 epitope distance and individuals aged ≥65 years, (C) N2 epitope distance and all age groups, and (D) N2 epitope distance and individuals aged ≥65 years. The number of excess influenza deaths attributable to A(H3N2) (per 100,000 people) were estimated from a seasonal regression model fit to weekly pneumonia and influenza-coded deaths in the United States (Hansen et al., 2022). Seasonal epitope distance is the mean distance between viruses circulating in the current season and viruses circulating in the prior season ( – 1) or two prior seasons ago ( – 2). Distances are scaled to aid in direct comparison of evolutionary indicators. Point color indicates the dominant influenza A subtype based on CDC influenza season summary reports (red: A(H3N2), blue: A(H1N1), purple: A(H1N1)pdm09, orange: A(H3N2)/A(H1N1)pdm09 co-dominant), and vertical bars are 95% confidence intervals of excess mortality model estimates. Seasonal national excess mortality estimates were fit as a function of H3 or N2 epitope distance using Gaussian GLMs (log link) with 1000 bootstrap resamples. In each plot, the black dashed line represents the mean regression fit, and the gray shaded band shows the 95% confidence interval, based on 1000 bootstrap resamples. The R2 and associated p-value from the mean regression fit are in the top left section of each plot.
Figure 3—figure supplement 3
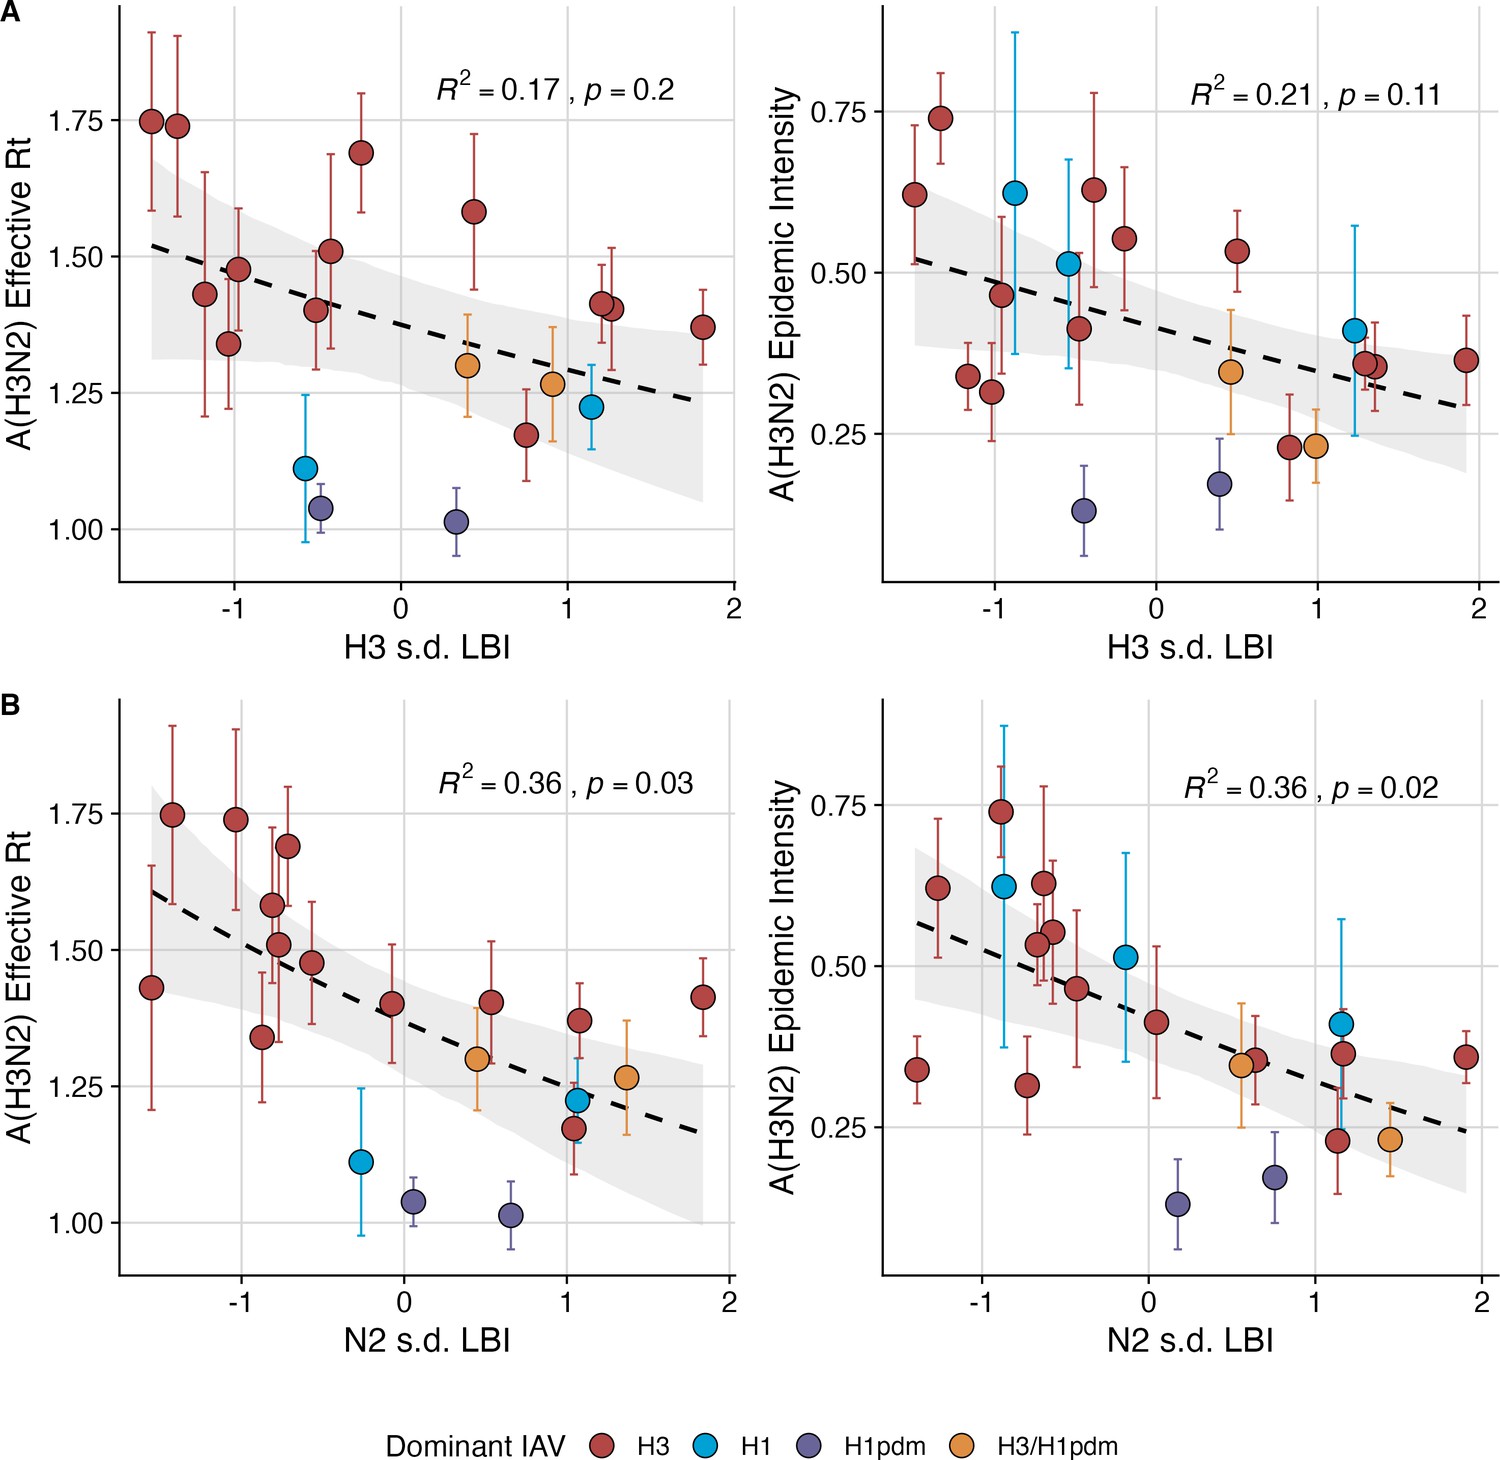
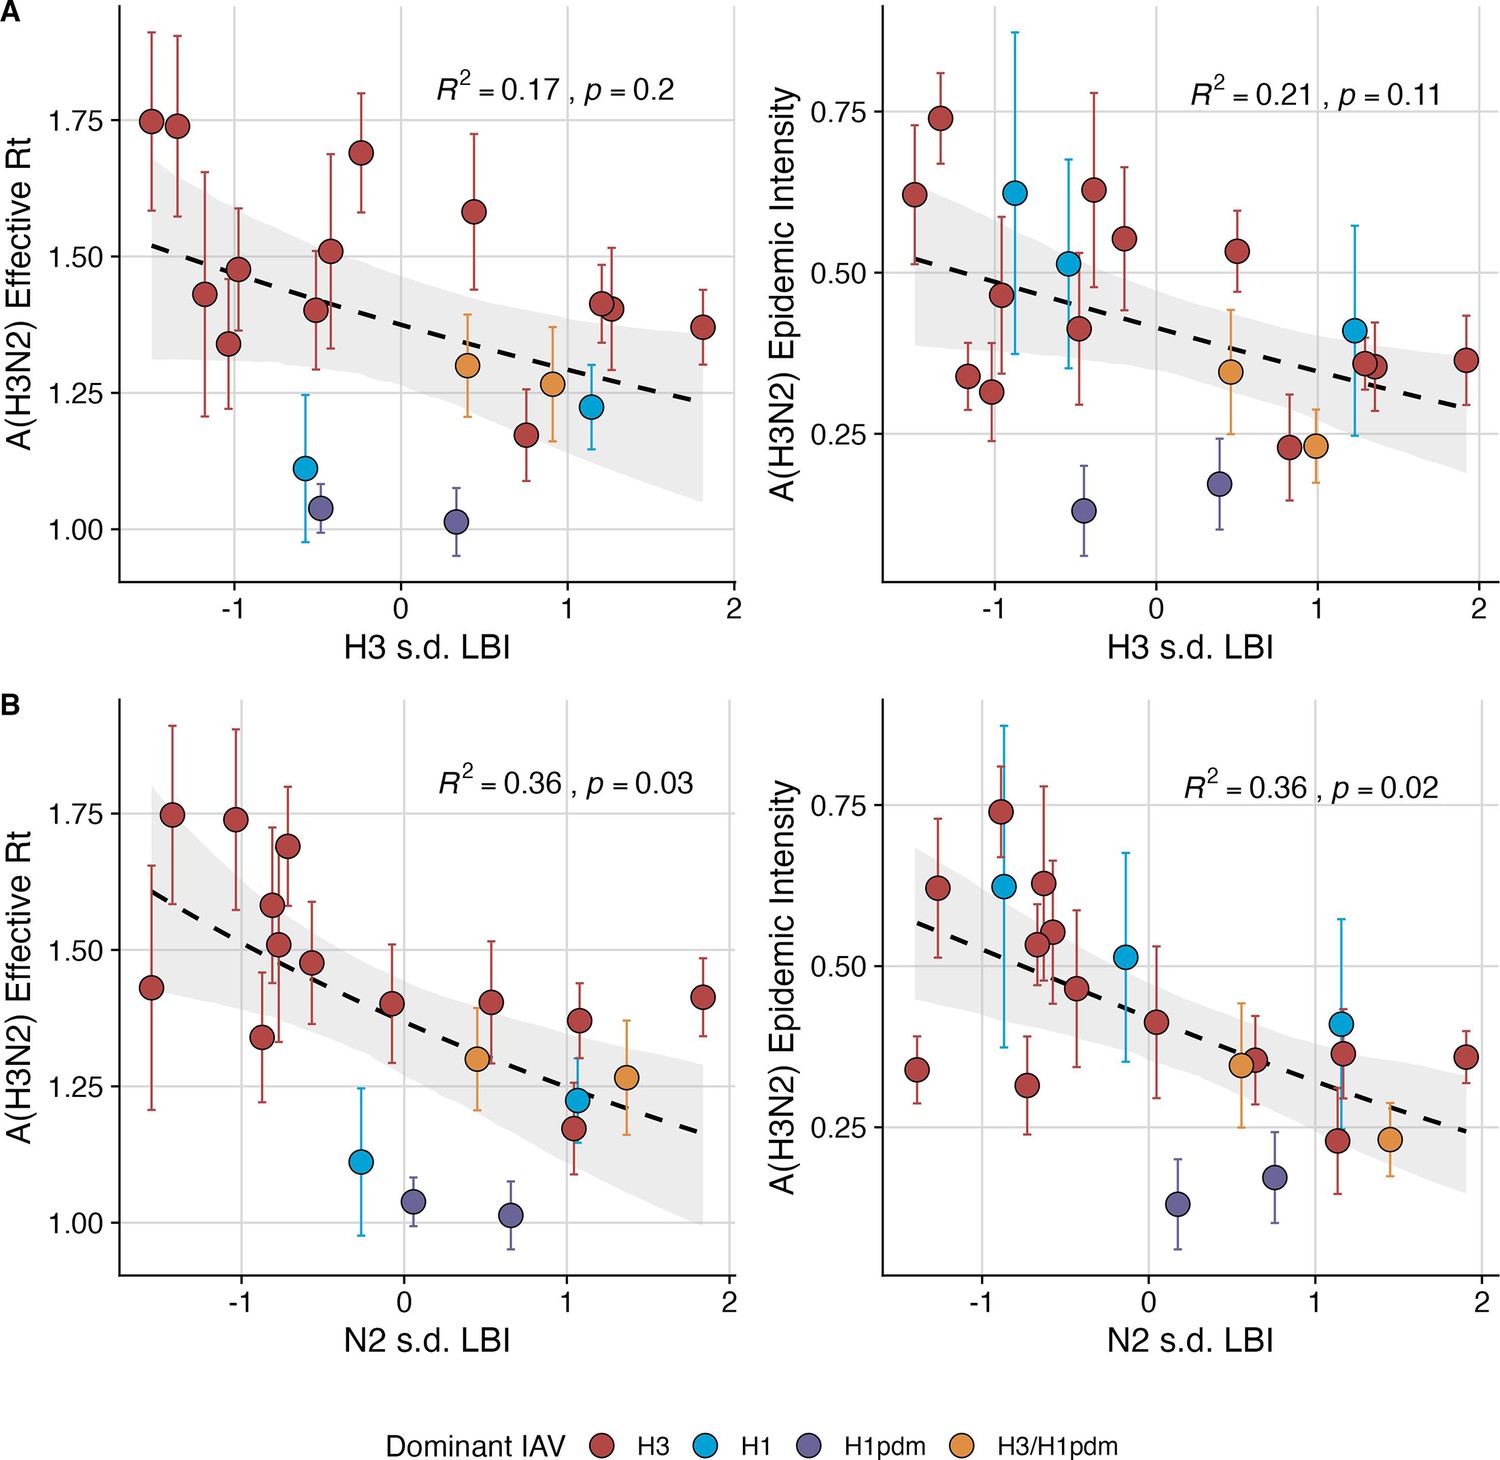
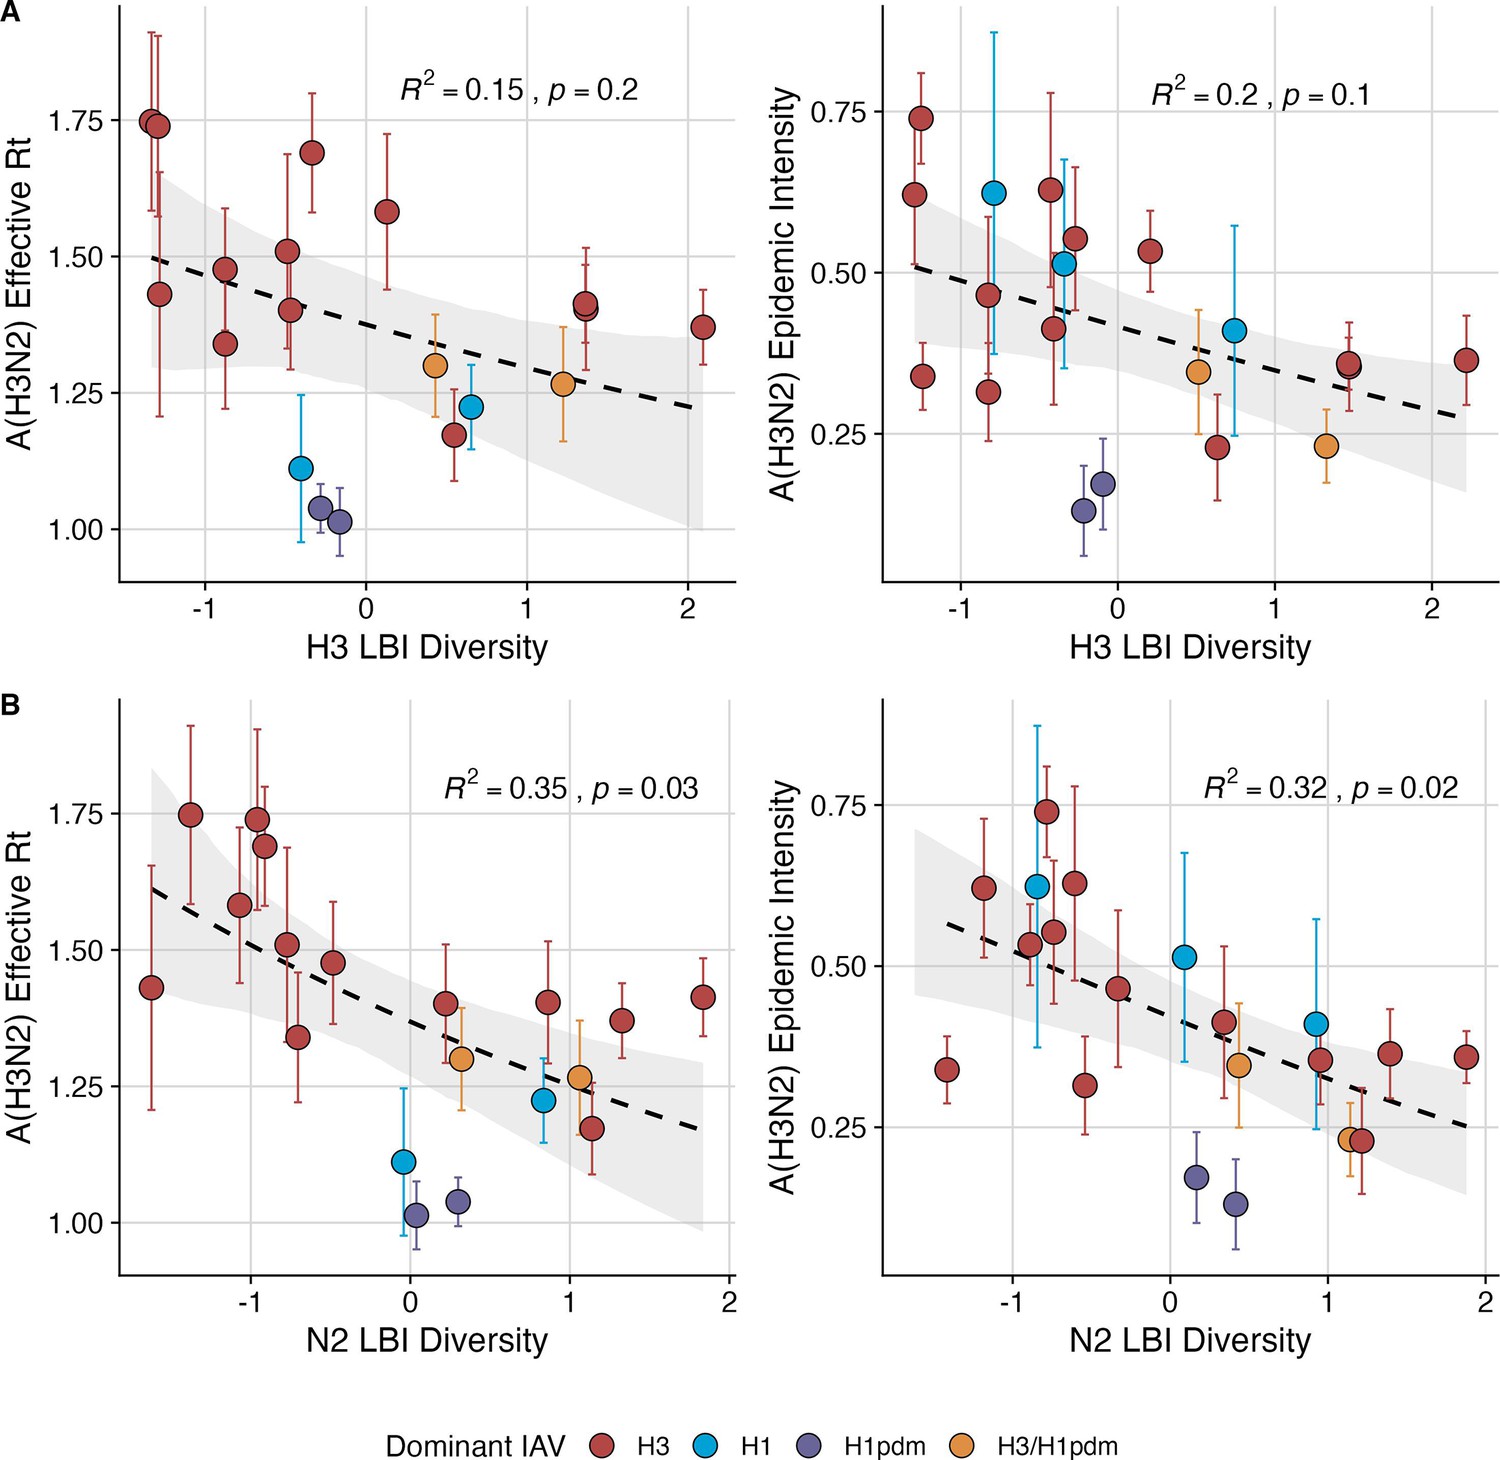
Low seasonal diversity in the clade growth rates of circulating A(H3N2) viruses, as measured by the standard deviation of local branching index values, correlates with higher transmissibility and greater epidemic intensity.
A(H3N2) effective and epidemic intensity negatively correlate with the seasonal diversity of local branching index (LBI) values among circulating A(H3N2) lineages in the current season, measured by the standard deviation (s.d.) of (A) H3 LBI values, and (B) N2 LBI values. LBI values are scaled to aid in direct comparisons of H3 and N2 s.d. LBI values. Point color indicates the dominant influenza A subtype based on CDC influenza season summary reports (red: A(H3N2), blue: A(H1N1), purple: A(H1N1)pdm09, orange: A(H3N2)/A(H1N1)pdm09 co-dominant), and vertical bars are 95% confidence intervals of regional estimates (pre-2009 seasons: 9 regions; post-2009 seasons: 10 regions). Seasonal mean A(H3N2) epidemic metric values were fit as a function of H3 or N2 LBI diversity using Gaussian GLMs (effective : inverse link) or Beta GLMs (epidemic intensity: logit link) with 1000 bootstrap resamples. In each plot, the black dashed line represents the mean regression fit, and the gray shaded band shows the 95% confidence interval, based on 1000 bootstrap resamples. The R2 and associated p-value from the mean regression fit are in the top right section of each plot.
Figure 3—figure supplement 4
Low seasonal diversity in the clade growth rates of circulating A(H3N2) viruses, as measured by the Shannon diversity of local branching index values, correlates with higher transmissibility and greater epidemic intensity.
A(H3N2) effective and epidemic intensity negatively correlate with the seasonal diversity of local branching index (LBI) values among circulating A(H3N2) lineages in the current season, measured by the Shannon diversity of (A) H3 LBI values, and (B) N2 LBI values. LBI values are scaled to aid in direct comparisons of H3 and N2 LBI diversity values. Point color indicates the dominant influenza A subtype based on CDC influenza season summary reports (red: A(H3N2), blue: A(H1N1), purple: A(H1N1)pdm09, orange: A(H3N2)/A(H1N1)pdm09 co-dominant), and vertical bars are 95% confidence intervals of regional estimates (pre-2009 seasons: 9 regions; post-2009 seasons: 10 regions). Seasonal mean A(H3N2) epidemic metric values were fit as a function of H3 or N2 LBI diversity using Gaussian GLMs (effective : inverse link) or Beta GLMs (epidemic intensity: logit link) with 1000 bootstrap resamples. In each plot, the black dashed line represents the mean regression fit, and the gray shaded band shows the 95% confidence interval, based on 1000 bootstrap resamples. The R2 and associated p-value from the mean regression fit are in the top right section of each plot.
Figure 4 with 1 supplement
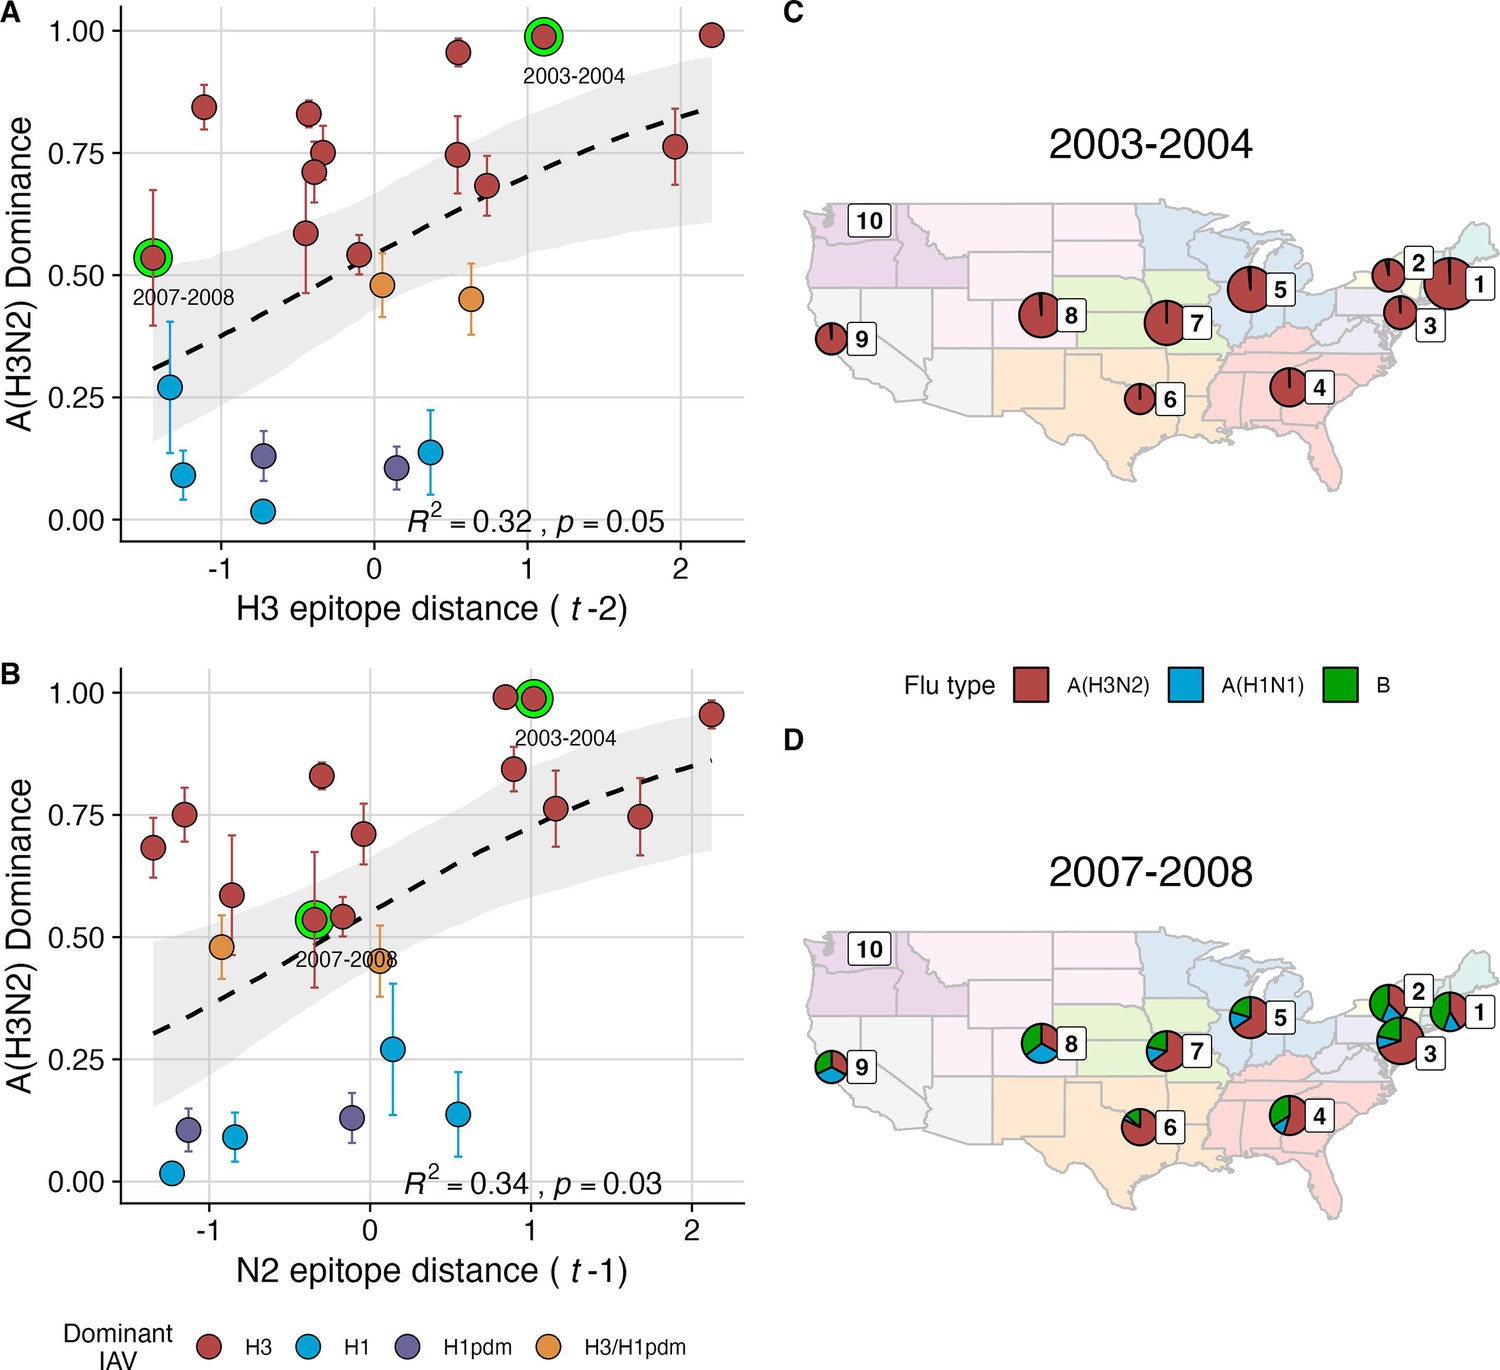
The proportion of influenza positive samples typed as A(H3N2) increases with antigenic drift.
(A-B) Seasonal A(H3N2) subtype dominance increases with (A) hemagglutinin (H3) and (B) neuraminidase (N2) epitope distance. Seasonal epitope distance is the mean epitope distance between viruses circulating in the current season and viruses circulating in the prior season ( - 1) or two prior seasons ago ( - 2). Distances were scaled to aid in direct comparison of evolutionary indicators. Point color indicates the dominant influenza A virus (IAV) subtype based on CDC influenza season summary reports (red: A(H3N2), blue: A(H1N1), purple: A(H1N1)pdm09, orange: A(H3N2)/A(H1N1)pdm09 co-dominant), and vertical bars are 95% confidence intervals of regional estimates (pre-2009 seasons: 9 regions; post-2009 seasons: 10 regions). Seasonal mean A(H3N2) dominance was fit as a function of H3 or N2 epitope distance using Beta GLMs with 1000 bootstrap resamples. In (A) and (B), the dashed black line represents the mean regression fit, and the gray shaded band shows the 95% confidence interval, based on 1000 bootstrap resamples. The R2 and associated p-value from the mean regression fit are in the bottom right section of each plot. (C–D) Regional patterns of influenza type and subtype incidence during two seasons when A(H3N2) was nationally dominant. Pie charts represent the proportion of influenza positive samples typed as A(H3N2) (red), A(H1N1) (blue), or B (green) in each HHS region. The sizes of regional pie charts are proportional to the total number of influenza positive samples. Data for Region 10 (purple) are not available for seasons prior to 2009. (C) Widespread A(H3N2) dominance during 2003–2004 after the emergence of a novel antigenic cluster, FU02 (A/Fujian/411/2002-like strains). (D) Spatial heterogeneity in subtype circulation during 2007–2008, a season with low A(H3N2) antigenic novelty relative to the prior season.
Figure 4—figure supplement 1
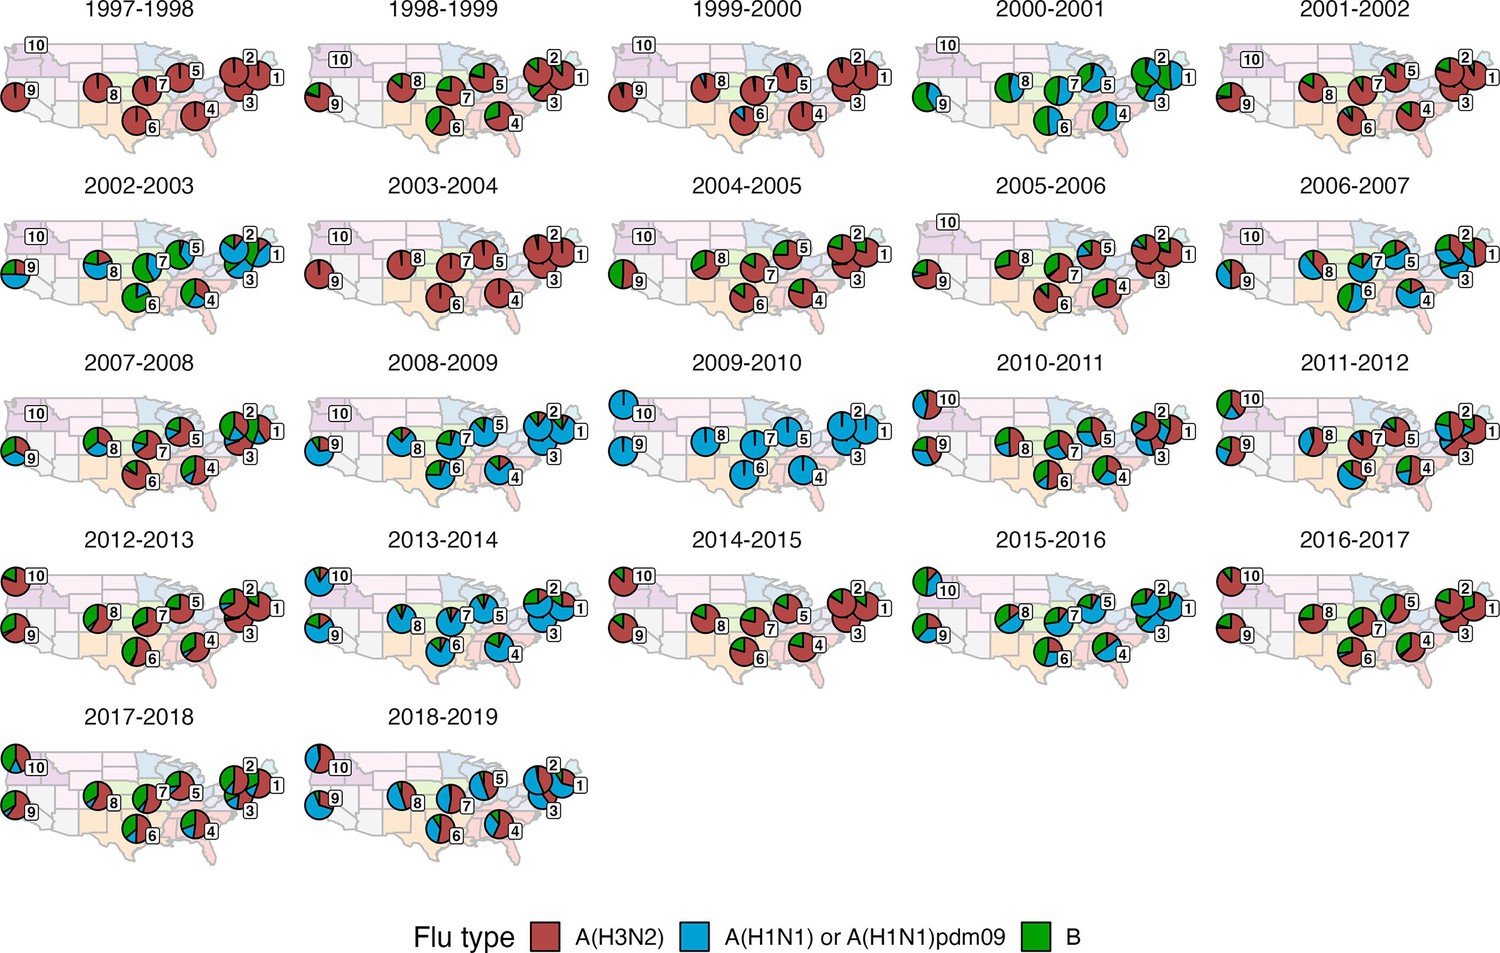
Regional patterns of influenza type and subtype circulation during seasons 1997–1998 to 2018–2019.
Pie charts represent the proportion of influenza positive samples that were typed as A(H3N2), A(H1N1) or A(H1N1)pdm09, and B in each HHS region. Data for Region 10 (purple) are not available for seasons prior to 2009.
Figure 5 with 3 supplements
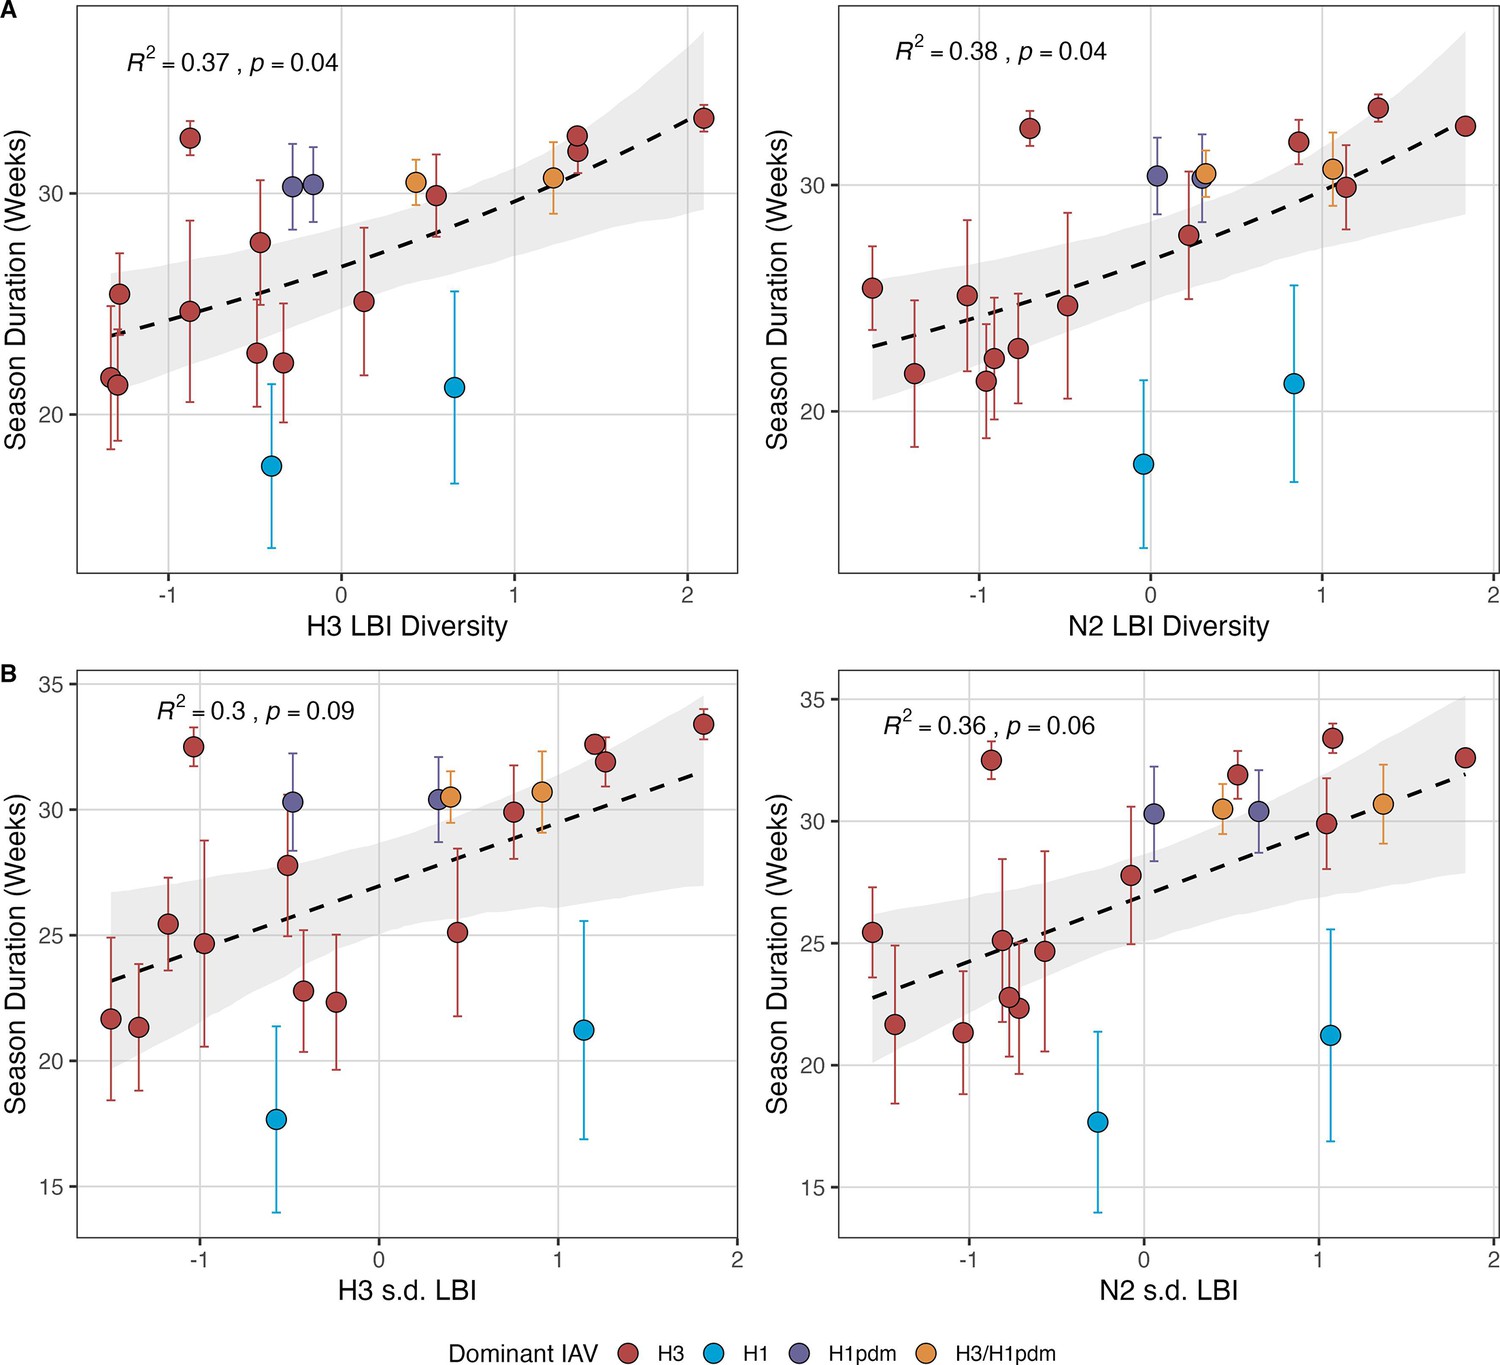
Influenza A(H3N2) seasonal duration increases with the diversity of hemagglutinin (H3) and neuraminidase (N2) clade growth rates in each season.
Seasonal diversity of clade growth rates is measured as the (A) Shannon diversity or (B) standard deviation (s.d.) of H3 and N2 local branching index (LBI) values of viruses circulating in each season. LBI values are scaled to aid in direct comparisons of different LBI diversity metrics. Point color indicates the dominant influenza A subtype based on CDC influenza season summary reports (red: A(H3N2), blue: A(H1N1), purple: A(H1N1)pdm09, orange: A(H3N2)/A(H1N1)pdm09 co-dominant), and vertical bars are 95% confidence intervals of regional estimates (pre-2009 seasons: 9 regions; post-2009 seasons: 10 regions). Mean seasonal duration was fit as a function of H3 or N2 LBI diversity using Gaussian GLMs (inverse link) with 1000 bootstrap resamples. In each plot, the black dashed line represents the mean regression fit, and the gray shaded band shows the 95% confidence interval, based on 1000 bootstrap resamples. The R2 and associated p-value from the mean regression fit are in the top left section of each plot.
Figure 5—figure supplement 1
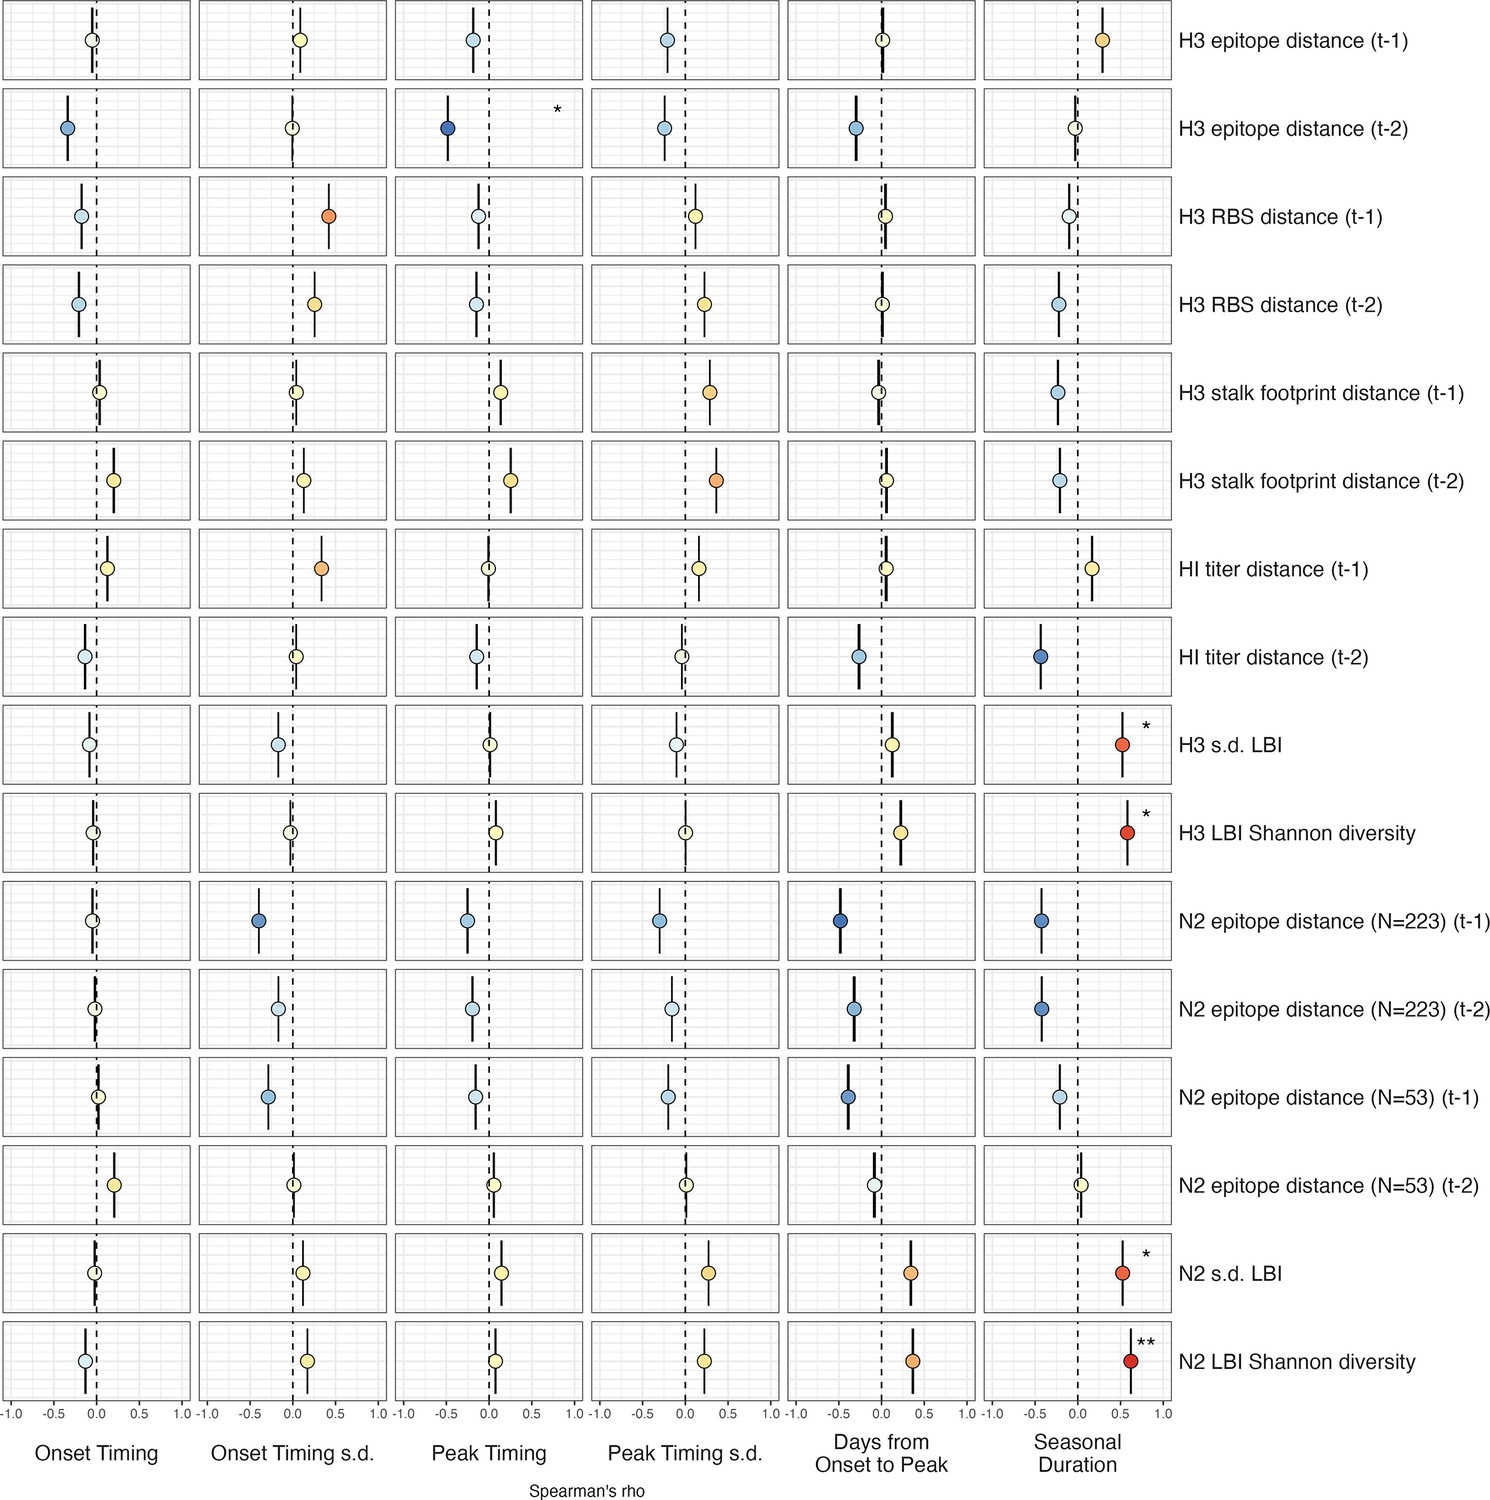
Univariate correlations between influenza A(H3N2) evolutionary indicators and epidemic timing.
Mean Spearman’s rank correlation coefficients, 95% confidence intervals of correlation coefficients, and corresponding p-values of bootstrapped (N=1000) evolutionary indicators (columns) and epidemic timing metrics (rows). Epidemic timing metrics are the week of epidemic onset, regional variation (s.d.) in onset timing, the week of epidemic peak, regional variation (s.d.) in peak timing, the number of days between epidemic onset and peak, and seasonal duration. Color indicates the strength and direction of the association, from dark red (strong positive correlation) to dark blue (strong negative correlation), and stars indicate statistical significance (* p<0.05, ** p<0.01, *** p<0.001). Abbreviations: – 1, one-season lag; – 2, two-season lag; RBS, receptor binding site; HI, hemagglutination inhibition; s.d., standard deviation; LBI, local branching index.
Figure 5—figure supplement 2
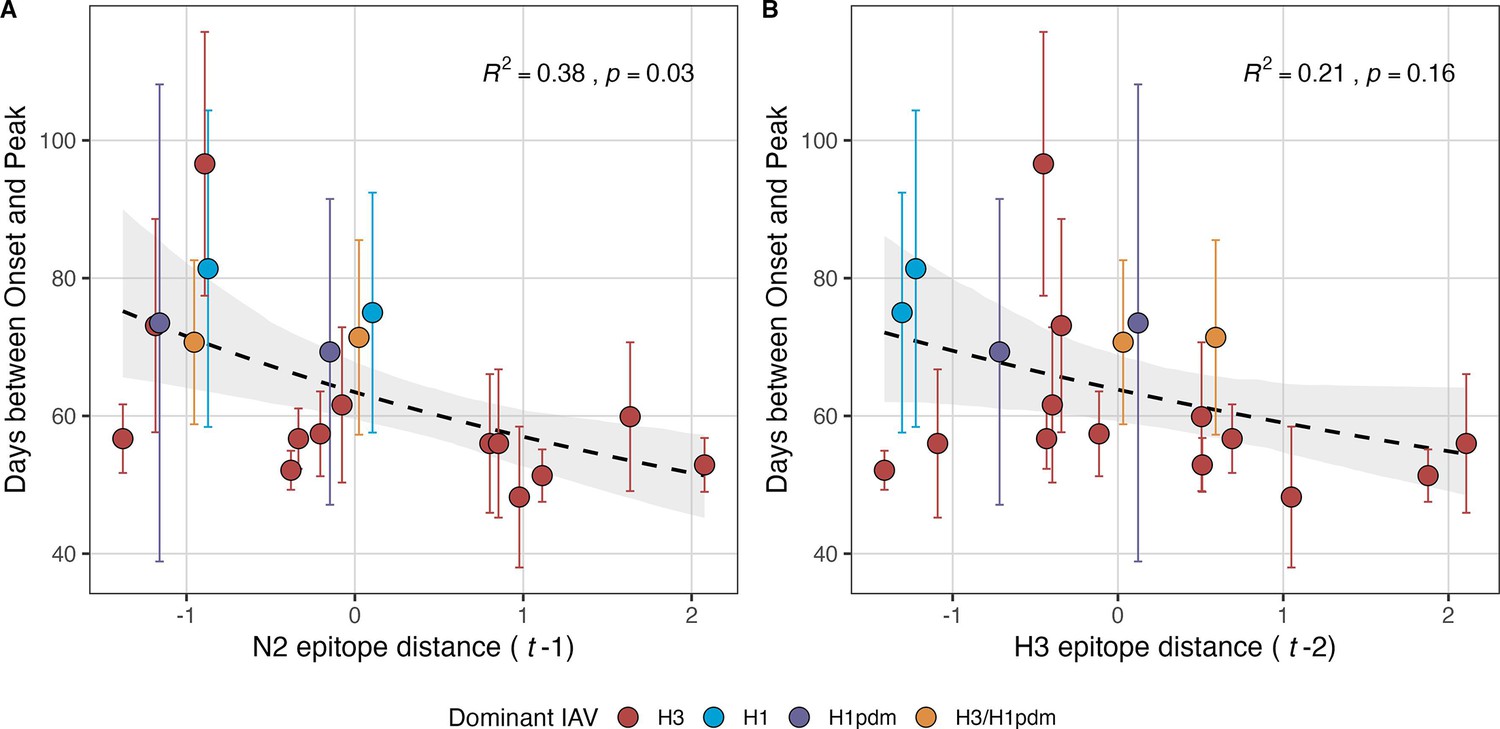
Epidemic speed increases with N2 antigenic drift.
N2 epitope distance significantly correlates with fewer days from epidemic onset to peak (A), while the relationship between H3 epitope distance and epidemic speed is weaker (B). Seasonal epitope distance is the mean distance between viruses circulating in the current season and viruses circulating in the prior season ( – 1) or two prior seasons ago ( – 2). Distances are scaled to aid in direct comparison of evolutionary indicators. Point color indicates the dominant influenza A subtype based on CDC influenza season summary reports (red: A(H3N2), blue: A(H1N1), purple: A(H1N1)pdm09, orange: A(H3N2)/A(H1N1)pdm09 co-dominant), and vertical bars are 95% confidence intervals of regional estimates (pre-2009 seasons: 9 regions; post-2009 seasons: 10 regions). The seasonal mean number of days from onset to peak was fit as a function of H3 or N2 epitope distance using Gamma GLMs (inverse link) with 1000 bootstrap resamples. In each plot, the black dashed line represents the mean regression fit, and the gray shaded band shows the 95% confidence interval, based on 1000 bootstrap resamples. The R2 and associated p-value from the mean regression fit are in the top right section of each plot.
Figure 5—figure supplement 3
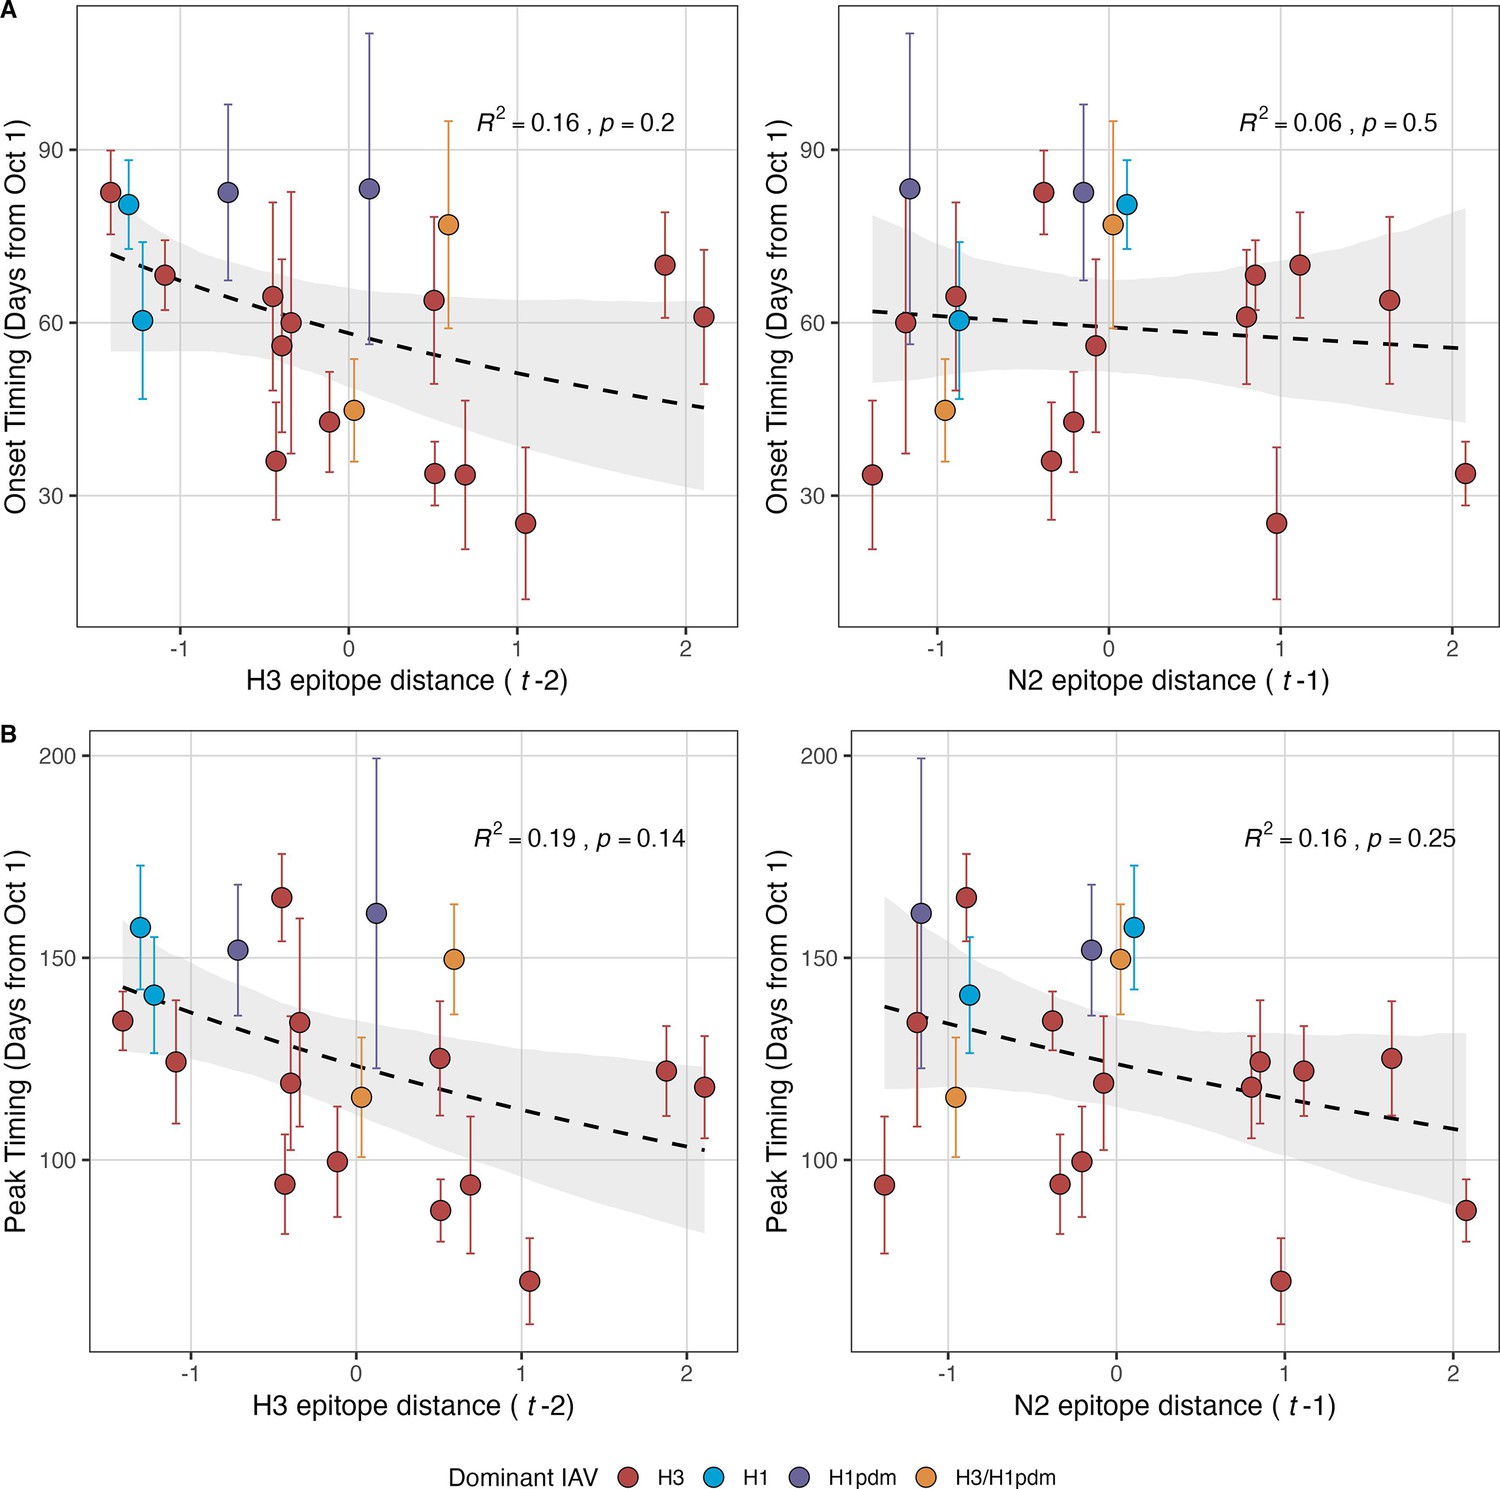
Influenza A(H3N2) epidemic onsets and peaks are earlier in seasons with high antigenic novelty, but correlations are not statistically significant.
(A) Epidemic onsets are earlier in seasons with increased H3 epitope distance ( – 2), but the correlation is not statistically significant. (B) Epidemic peaks are earlier in seasons with increased H3 epitope distance ( – 2) and N2 epitope distance ( – 1), but correlations are not statistically significant. Seasonal epitope distance is the mean distance between viruses circulating in the current season and viruses circulating in the prior season ( – 1) or two prior seasons ago ( – 2). Distances are scaled to aid in direct comparison of evolutionary indicators. Point color indicates the dominant influenza A subtype based on CDC influenza season summary reports (red: A(H3N2), blue: A(H1N1), purple: A(H1N1)pdm09, orange: A(H3N2)/A(H1N1)pdm09 co-dominant), and vertical bars are 95% confidence intervals of regional estimates (pre-2009 seasons: 9 regions; post-2009 seasons: 10 regions). Seasonal mean epidemic onsets and peaks were fit as a function of H3 or N2 epitope distance using Gaussian GLMs (inverse link) with 1000 bootstrap resamples. In each plot, the black dashed line represents the mean regression fit, and the gray shaded band shows the 95% confidence interval, based on 1000 bootstrap resamples. The R2 and associated p-value from the mean regression fit are in the top left section of each plot.
Figure 6 with 1 supplement
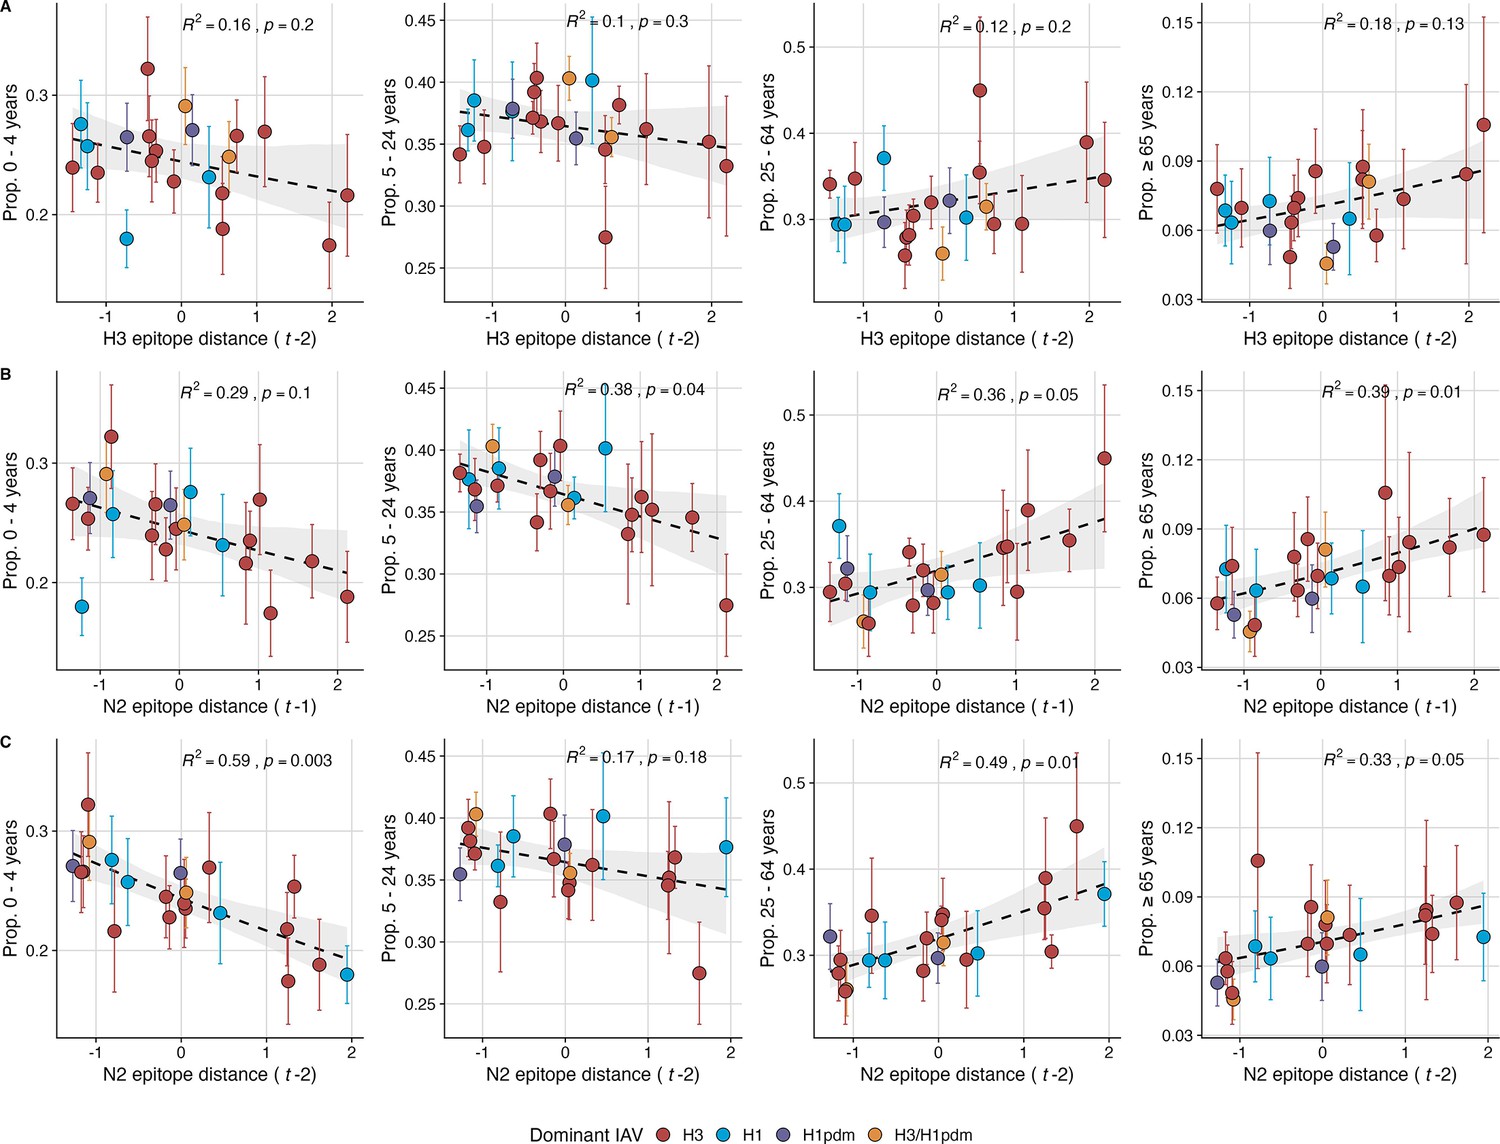
The proportion of outpatient influenza-like illness (ILI) cases in adults increases with neuraminidase (N2) antigenic novelty.
N2 epitope distance, but not H3 epitope distance, significantly correlates with the age distribution of outpatient ILI cases. Seasonal epitope distance is the mean distance between viruses circulating in current season and viruses circulating in the prior season ( – 1) or two prior seasons ago ( – 2). Distances are scaled to aid in direct comparison of evolutionary indicators. Point color indicates the dominant influenza A subtype based on CDC influenza season summary reports (red: A(H3N2), blue: A(H1N1), purple: A(H1N1)pdm09, orange: A(H3N2)/A(H1N1)pdm09 co-dominant), and vertical bars are 95% confidence intervals of regional age distribution estimates (pre-2009 seasons: 9 regions; post-2009 seasons: 10 regions). The seasonal mean fraction of cases in each age group were fit as a function of H3 or N2 epitope distance using Beta GLMs (logit link) with 1000 bootstrap resamples. In each plot, the black dashed line represents the mean regression fit, and the gray shaded band shows the 95% confidence interval, based on 1000 bootstrap resamples. The R2 and associated p-value from the mean regression fit are in the top right section of each plot.
Figure 6—figure supplement 1
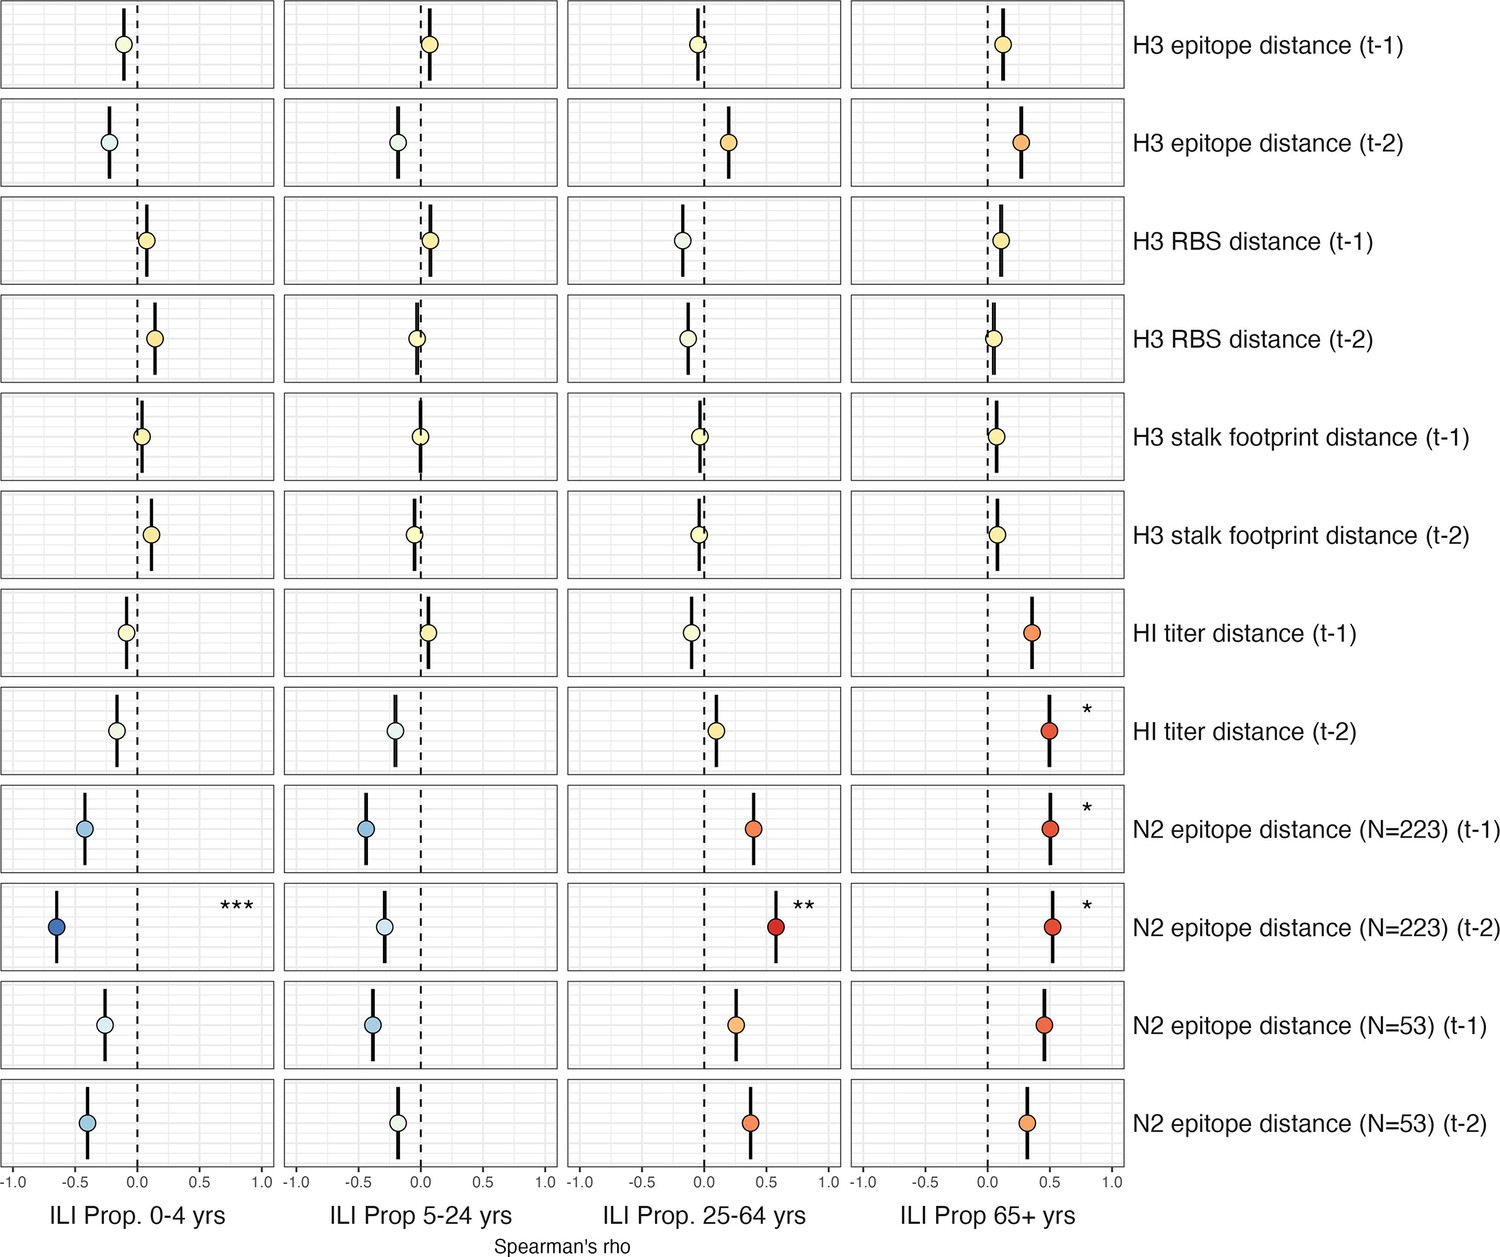
Univariate correlations between A(H3N2) antigenic change and the age distribution of outpatient influenza-like illness (ILI) cases.
Mean Spearman’s rank correlation coefficients, 95% confidence intervals of correlation coefficients, and corresponding p-values of bootstrapped (N=1000) evolutionary indicators (rows) and the proportion of ILI cases in individuals aged <5 years, 5–24 years, 25–64 years, and ≥65 years (columns). Color indicates the strength and direction of the association, from dark red (strong positive correlation) to dark blue (strong negative correlation), and stars indicate statistical significance (* p<0.05, ** p<0.01, *** p<0.001). Abbreviations: – 1, one-season lag; – 2, two-season lag; RBS, receptor binding site; HI, hemagglutination inhibition.
Figure 7 with 3 supplements
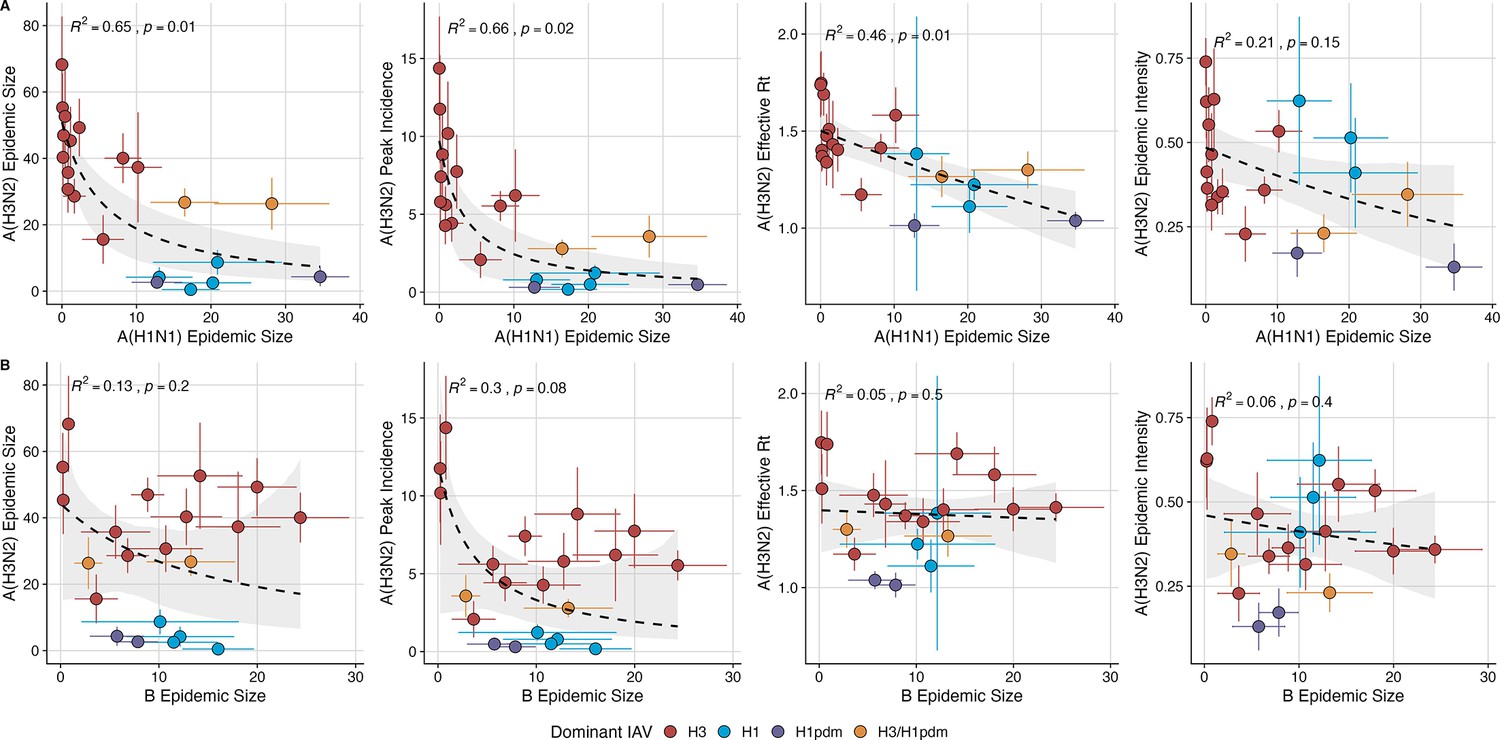
The effects of influenza A(H1N1) and B epidemic size on A(H3N2) epidemic burden.
(A) Influenza A(H1N1) epidemic size negatively correlates with A(H3N2) epidemic size, peak incidence, transmissibility (effective reproduction number, ), and epidemic intensity. (B) Influenza B epidemic size does not significantly correlate with A(H3N2) epidemic metrics. Point color indicates the dominant influenza A virus (IAV) subtype based on CDC influenza season summary reports (red: A(H3N2), blue: A(H1N1), purple: A(H1N1)pdm09, orange: A(H3N2)/A(H1N1)pdm09 co-dominant), and vertical and horizontal bars are 95% confidence intervals of regional estimates (pre-2009 seasons: 9 regions; post-2009 seasons: 10 regions). Seasonal mean A(H3N2) epidemic metrics were fit as a function of mean A(H1N1) or B epidemic size using Gaussian GLMs (epidemic size and peak incidence: inverse link; effective : log link) or Beta GLMs (epidemic intensity: logit link) with 1000 bootstrap resamples. In each plot, the black dashed line represents the mean regression fit, and the gray shaded band shows the 95% confidence interval, based on 1000 bootstrap resamples. The R2 and associated p-value from the mean regression fit are in the top left section of each plot.
Figure 7—figure supplement 1
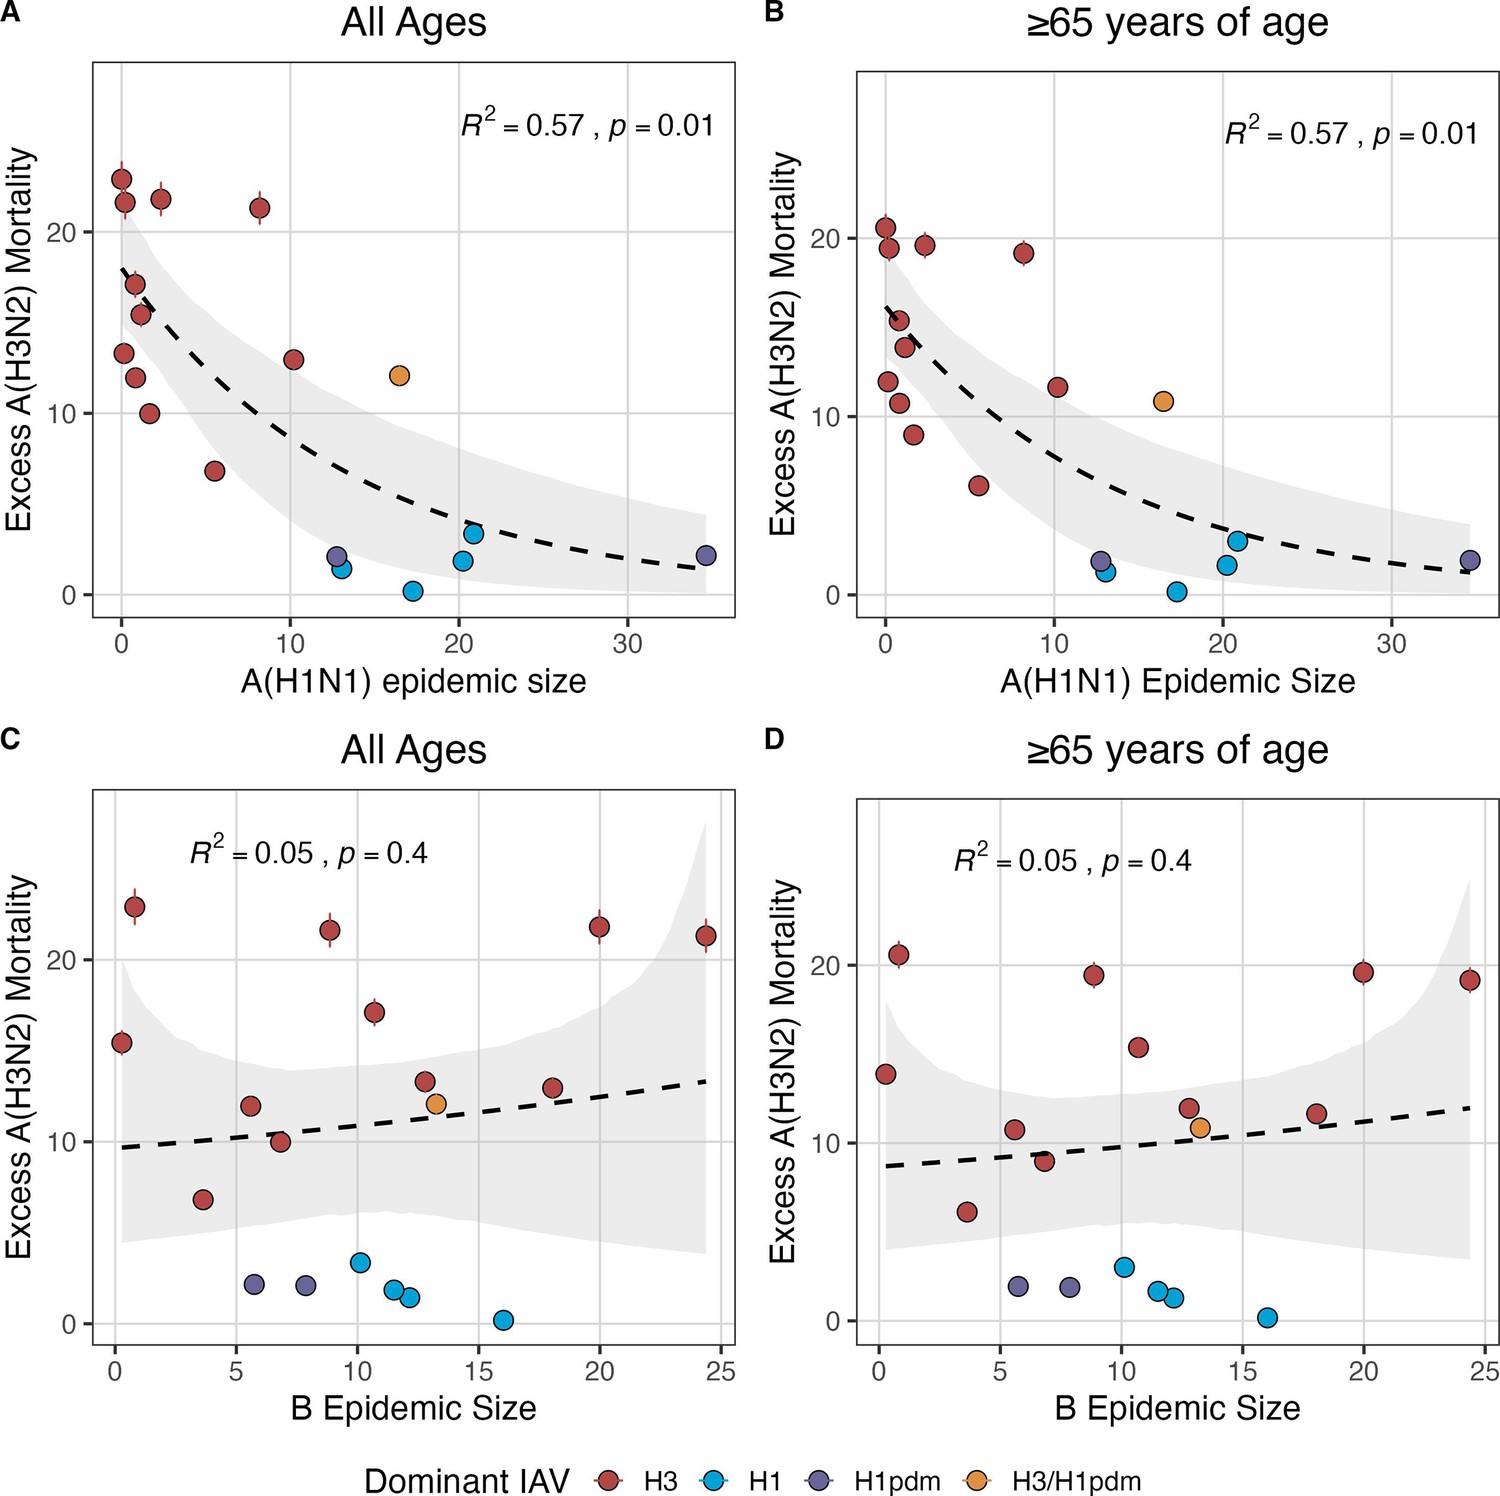
National excess influenza A(H3N2) mortality decreases with A(H1N1) epidemic size but not B epidemic size.
Relationships between seasonal excess influenza A(H3N2) mortality and the circulation of A(H1N1) or B viruses are organized by influenza type/subtype and age group: (A) A(H1N1) epidemic size and all age groups, (B) A(H1N1) epidemic size and individuals aged ≥65 years, (C) B epidemic size and all age groups, and (D) B epidemic size and individuals aged ≥65 years. Excess influenza deaths attributable to A(H3N2) (per 100,000 people) were estimated from a seasonal regression model fit to weekly pneumonia and influenza-coded deaths. Point color indicates the dominant influenza A subtype based on CDC influenza season summary reports (red: A(H3N2), blue: A(H1N1), purple: A(H1N1)pdm09, orange: A(H3N2)/A(H1N1)pdm09 co-dominant), and vertical bars are 95% confidence intervals of excess mortality model estimates. Seasonal national excess mortality estimates were fit as a function of A(H1N1) or B epidemic size using Gaussian GLMs (log link) with 1000 bootstrap resamples. In each plot, the black dashed line represents the mean regression fit, and the gray shaded band shows the 95% confidence interval, based on 1000 bootstrap resamples. The R2 and associated p-value from the mean regression fit are in the top section of each plot.
Figure 7—figure supplement 2
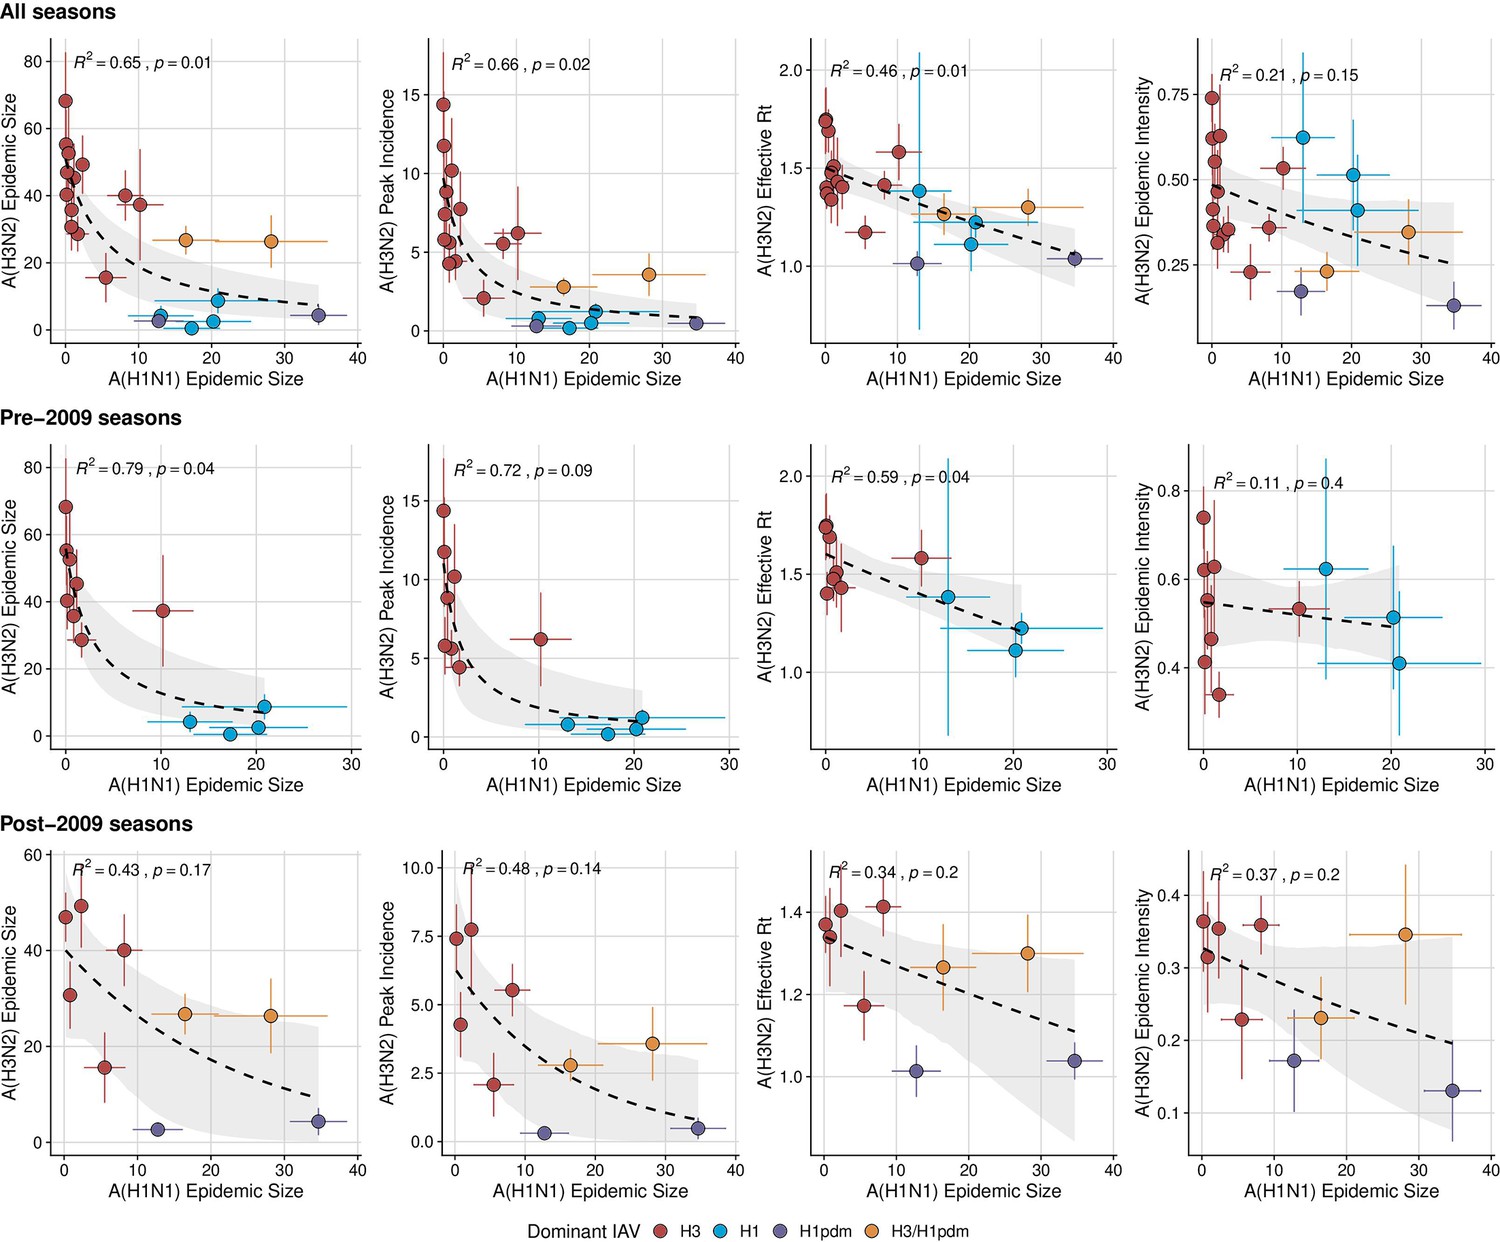
The effect of influenza A(H1N1) epidemic size on A(H3N2) epidemic burden during the entire study period, pre-2009 seasons, and post-2009 seasons.
Influenza A(H1N1) epidemic size negatively correlates with A(H3N2) epidemic size, peak incidence, transmissibility (maximum effective reproduction number, ), and epidemic intensity during (A) the entire study period (1997 – 2019), (B) pre-2009 seasons, and (C) post-2009 seasons. Point color indicates the dominant influenza A virus (IAV) subtype based on CDC influenza season summary reports (red: A(H3N2), blue: A(H1N1), purple: A(H1N1)pdm09, orange: A(H3N2)/A(H1N1)pdm09 co-dominant), and vertical and horizontal bars are 95% confidence intervals of regional estimates (pre-2009 seasons: 9 regions; post-2009 seasons: 10 regions). Seasonal mean A(H3N2) epidemic metrics were fit as a function of A(H1N1) epidemic size using Gaussian GLMs (epidemic size, peak incidence: inverse link; effective : log link) or Beta GLMs (epidemic intensity: logit link) with 1000 bootstrap resamples. In each plot, the black dashed line represents the mean regression fit, and the gray shaded band shows the 95% confidence interval, based on 1000 bootstrap resamples. The R2 and associated p-value from the mean regression fit are in the top left section of each plot.
Figure 7—figure supplement 3
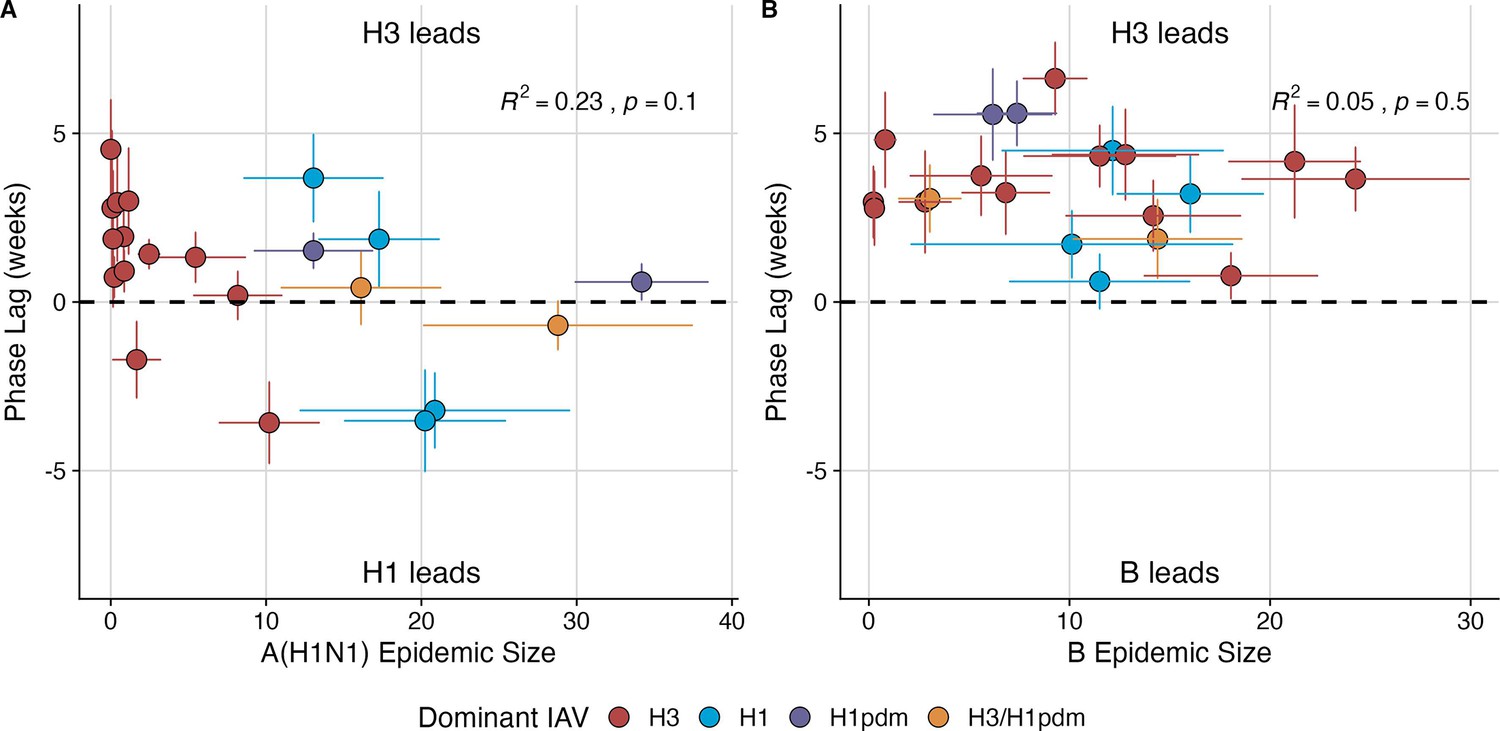
Wavelet analysis of influenza A(H3N2), A(H1N1), and B epidemic timing.
(A) A(H3N2) incidence precedes A(H1N1) incidence in most seasons. Although A(H1N1) incidence sometimes leads or is in phase with A(H3N2) incidence (negative or zero phase lags), the direction of seasonal phase lags is not clearly associated with A(H1N1) epidemic size. (B) A(H3N2) incidence leads B incidence (positive phase lag) during every season, irrespective of B epidemic size. Point color indicates the dominant influenza A subtype based on CDC influenza season summary reports (red: A(H3N2), blue: A(H1N1), purple: A(H1N1)pdm09, orange: A(H3N2)/A(H1N1)pdm09 co-dominant), vertical bars are 95% confidence intervals (CIs) of regional phase lag estimates, and horizontal bars are 95% CIs of regional epidemic size estimates (pre-2009 seasons: 9 regions; post-2009 seasons: 10 regions). To estimate the relative timing of influenza subtype incidences, phase angle differences were calculated as phase in A(H3N2) minus phase in A(H1N1) (or B), with a positive value indicating that A(H1N1) (or B) incidence lags A(H3N2) incidence. To calculate seasonal phase lags, we averaged pairwise phase angle differences from epidemic week 40 to epidemic week 20. Seasonal phase lags were fit as a function of A(H1N1) or B epidemic size using LMs with 1000 bootstrap resamples. In each plot, the R2 and associated p-value from the mean regression fit are in the top right section, and the black dashed line shows (the two time series are in phase).
Figure 8 with 1 supplement
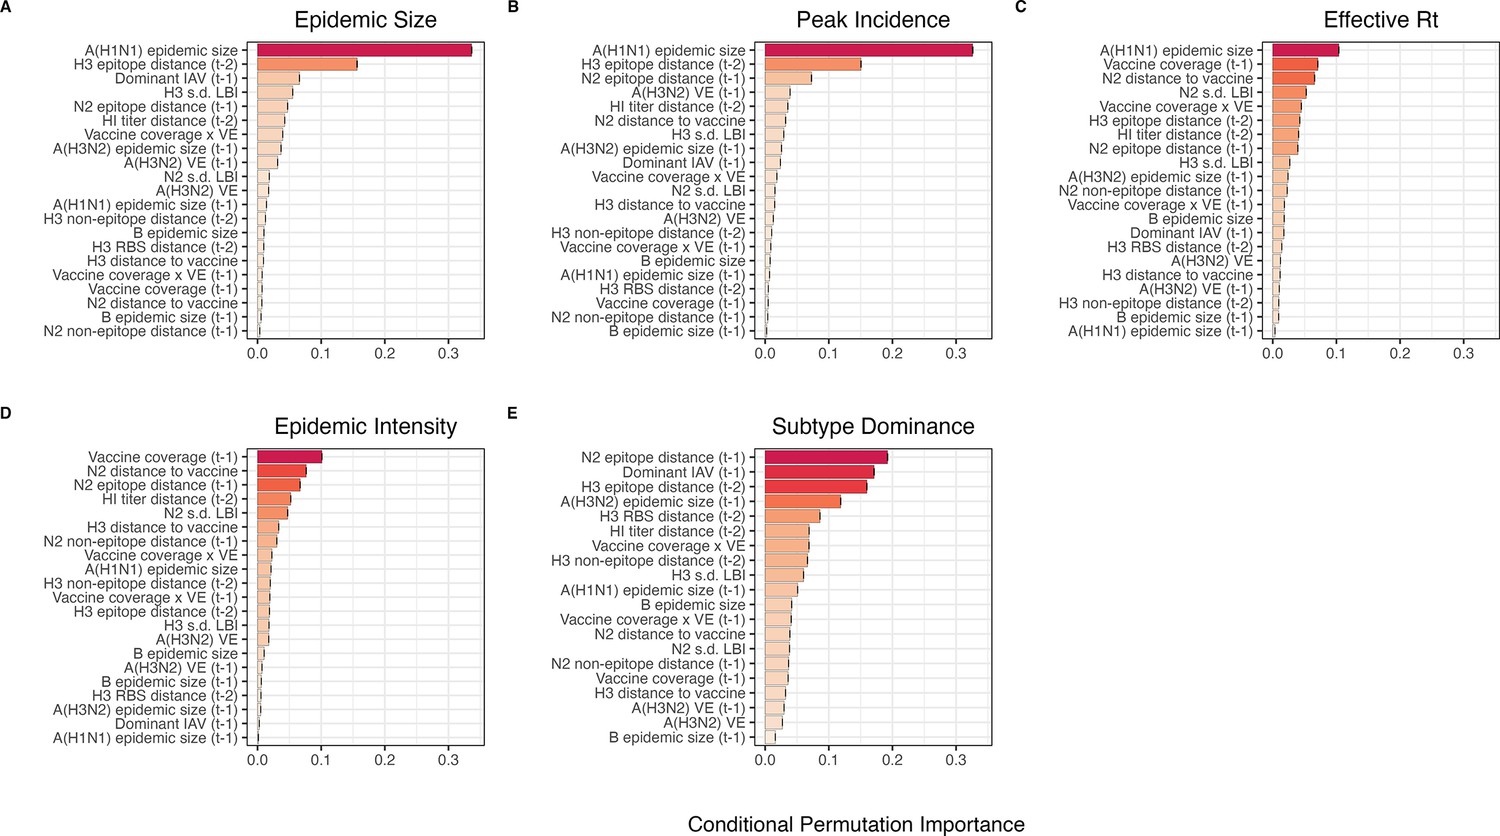
Variable importance rankings from conditional inference random forest models predicting seasonal region-specific influenza A(H3N2) epidemic dynamics.
Ranking of variables in predicting regional A(H3N2) (A) epidemic size, (B) peak incidence, (C) transmissibility (maximum effective reproduction number, ), (D) epidemic intensity, and (E) subtype dominance. Each forest was created by generating 3000 regression trees from a repeated leave-one-season-out cross-validated sample of the data. Variables are ranked by their conditional permutation importance, with differences in prediction accuracy scaled by the total (null model) error. Black error bars are 95% confidence intervals of conditional permutation scores (N=50 permutations). Abbreviations: – 1, one-season lag; – 2, two-season lag; IAV, influenza A virus subtype; s.d., standard deviation; HI, hemagglutination inhibition; LBI, local branching index; distance to vaccine, epitope distance between currently circulating viruses and the recommended vaccine strain; VE, vaccine effectiveness.
Figure 8—figure supplement 1
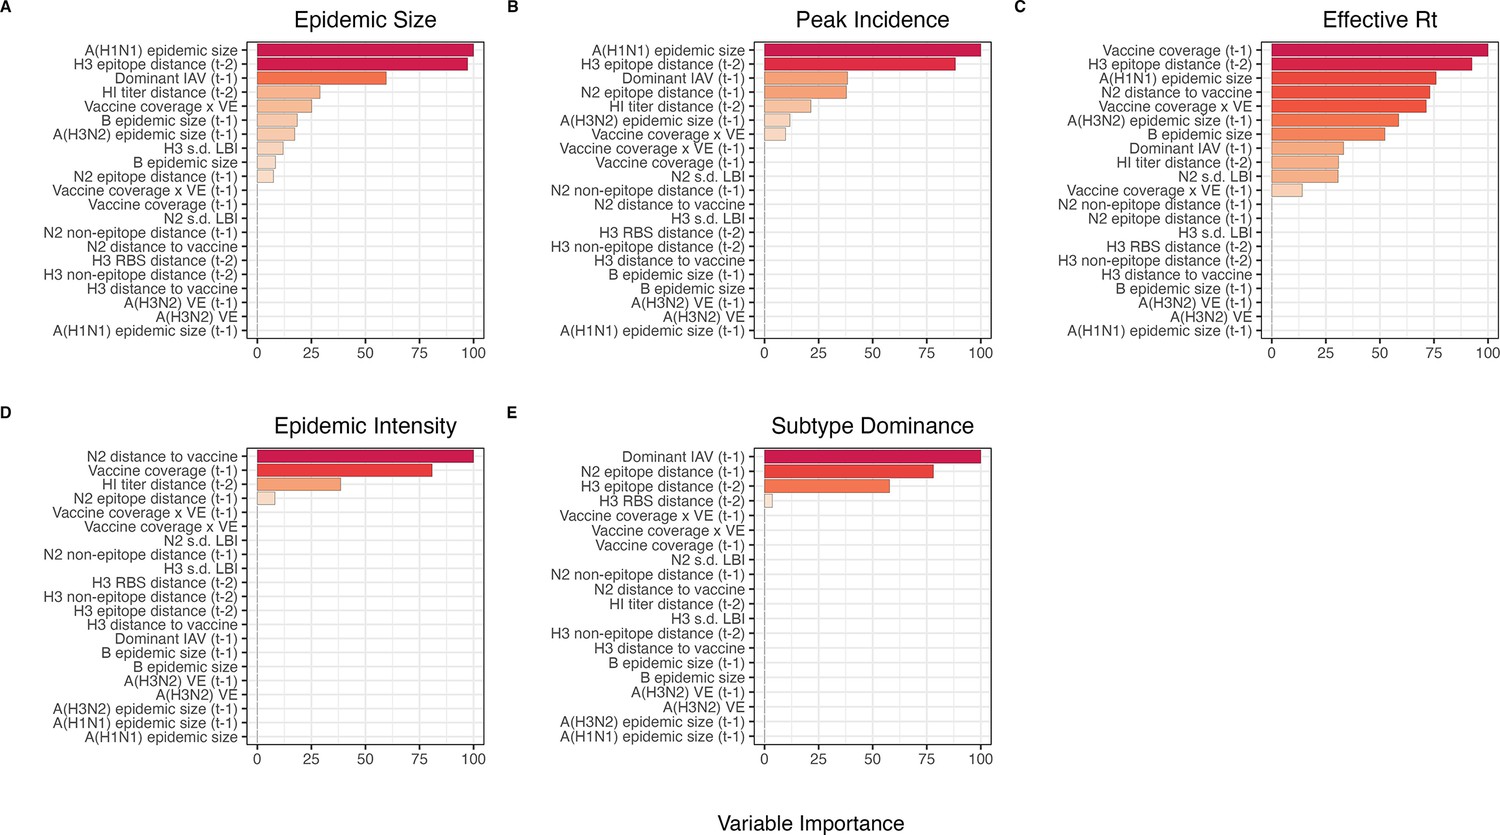
Variable importance rankings from LASSO regression models predicting seasonal region-specific influenza A(H3N2) epidemic dynamics.
Ranking of variables in predicting regional A(H3N2) (A) epidemic size, (B) peak incidence, (C) transmissibility (maximum effective reproduction number, ), (D) epidemic intensity, and (E) subtype dominance. Models were tuned using a repeated leave-one-season-out cross-validated sample of the data. Variables are ranked by their coefficient estimates, with differences in prediction accuracy scaled by the total (null model) error. Abbreviations: – 1, one-season lag; – 2, two-season lag; IAV, influenza A virus subtype; s.d., standard deviation; HI, hemagglutination inhibition; LBI, local branching index; distance to vaccine, epitope distance between currently circulating viruses and the recommended vaccine strain; VE, vaccine effectiveness.
Figure 9 with 2 supplements
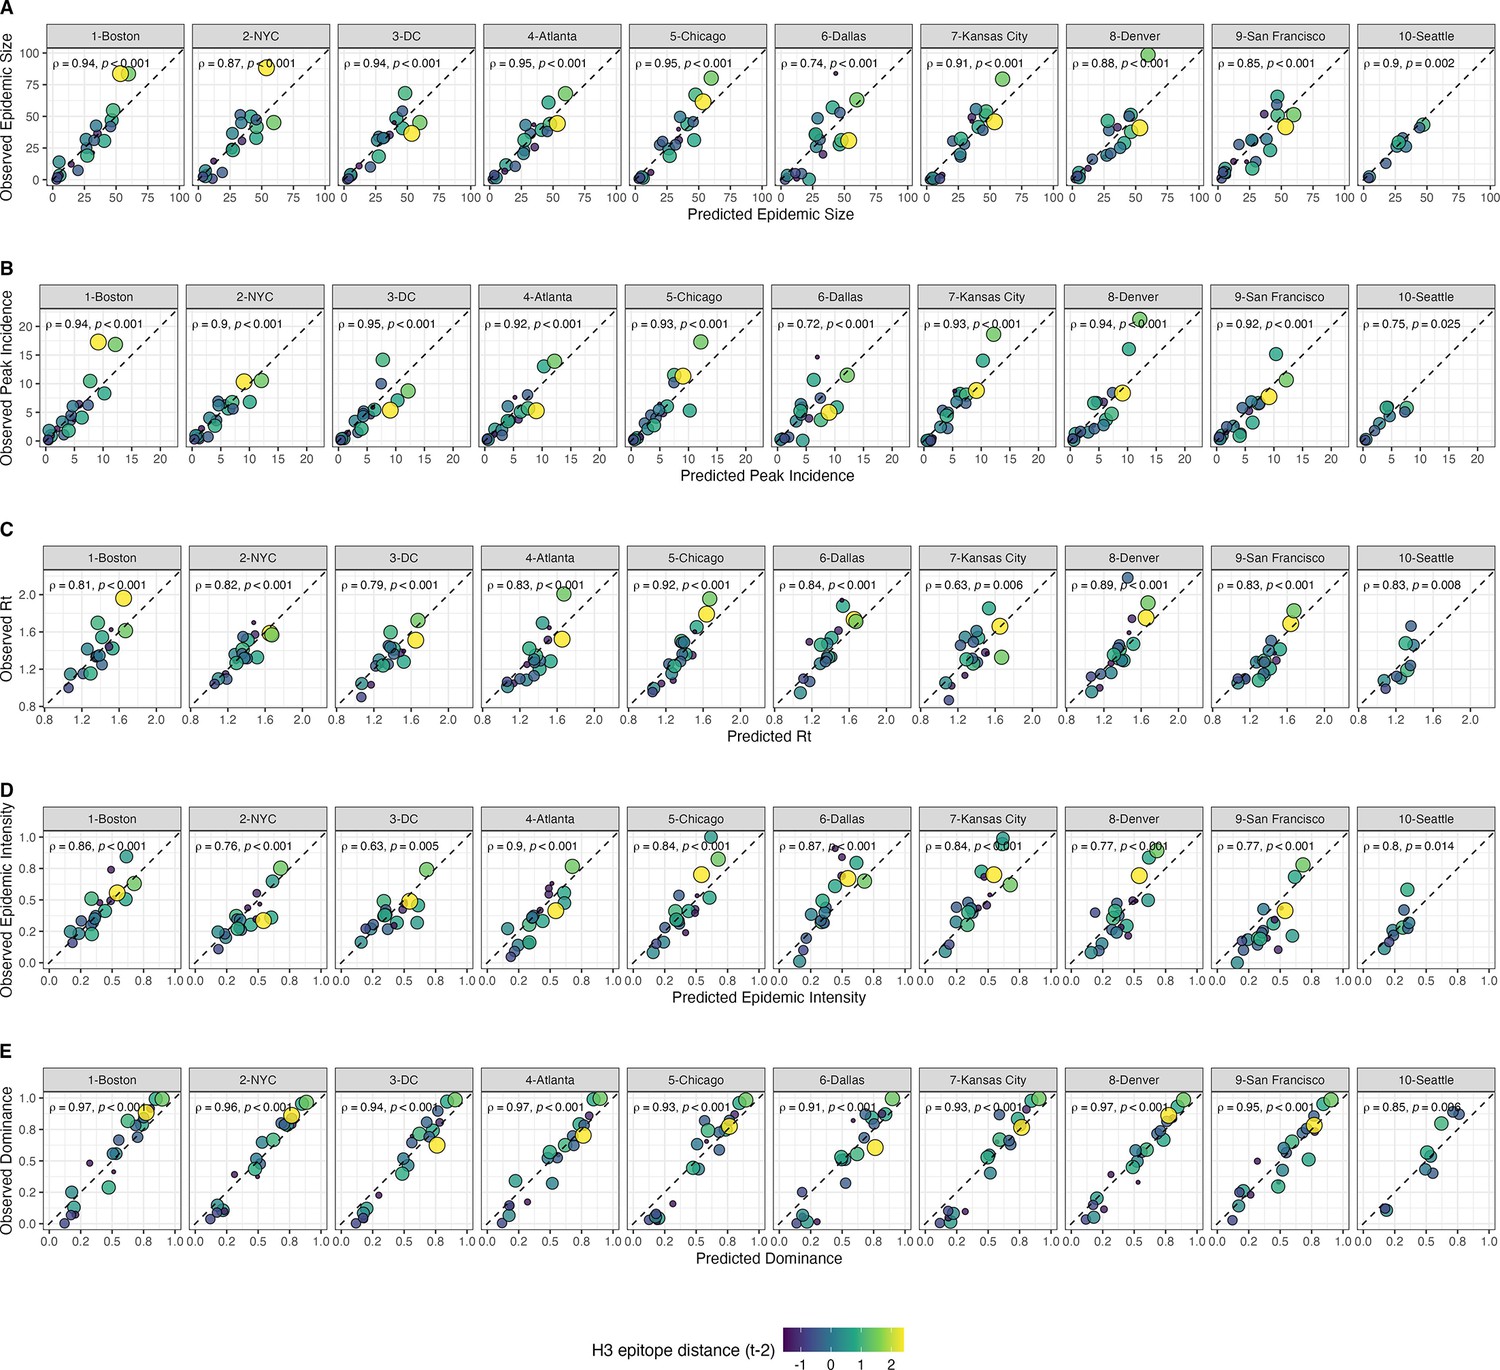
Observed versus predicted values of seasonal region-specific influenza A(H3N2) epidemic metrics from conditional inference random forest models.
(A) Epidemic size, (B) peak incidence, (C) transmissibility (maximum effective reproduction number, ), (D) epidemic intensity, and (E) subtype dominance. Results are facetted by HHS region and epidemic metric. Point color and size corresponds to the mean H3 epitope distance between viruses circulating in the current season and viruses circulating two prior seasons ago ( – 2). Large, yellow points indicate seasons with high antigenic novelty, and small blue points indicate seasons with low antigenic novelty. In each facet, the Spearman’s rank correlation coefficient and associated p-value are in the top left section, and the black dashed line shows .
Figure 9—figure supplement 1
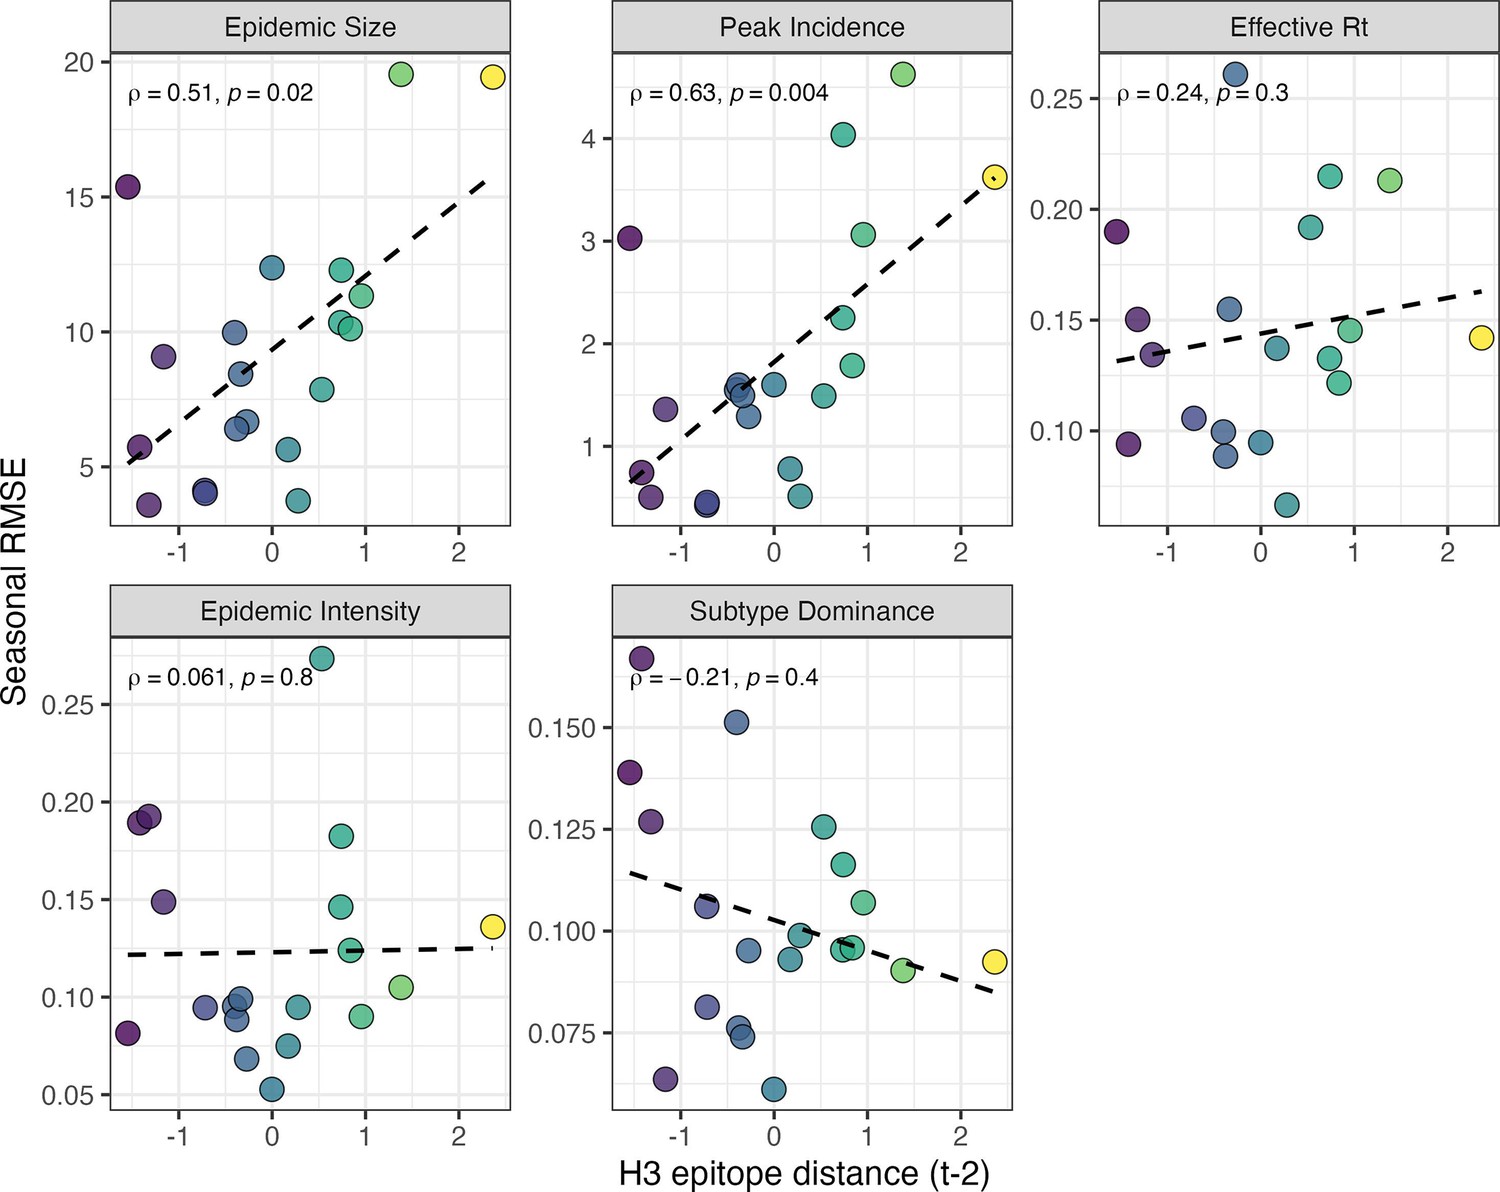
Relationships between the predictive accuracy of random forest models and seasonal H3 epitope distance.
Root mean squared errors between observed and model-predicted values were averaged across regions for each season, and results are facetted according to epidemic metric. Point color corresponds to the mean H3 epitope distance between viruses circulating in the current season and viruses circulating two prior seasons ago ( – 2), with bright yellow points indicating seasons with greater antigenic novelty. In each facet, the Spearman’s rank correlation coefficient and associated p-value are in the top left section, and the black dashed line represents the linear regression fit.
Figure 9—figure supplement 2
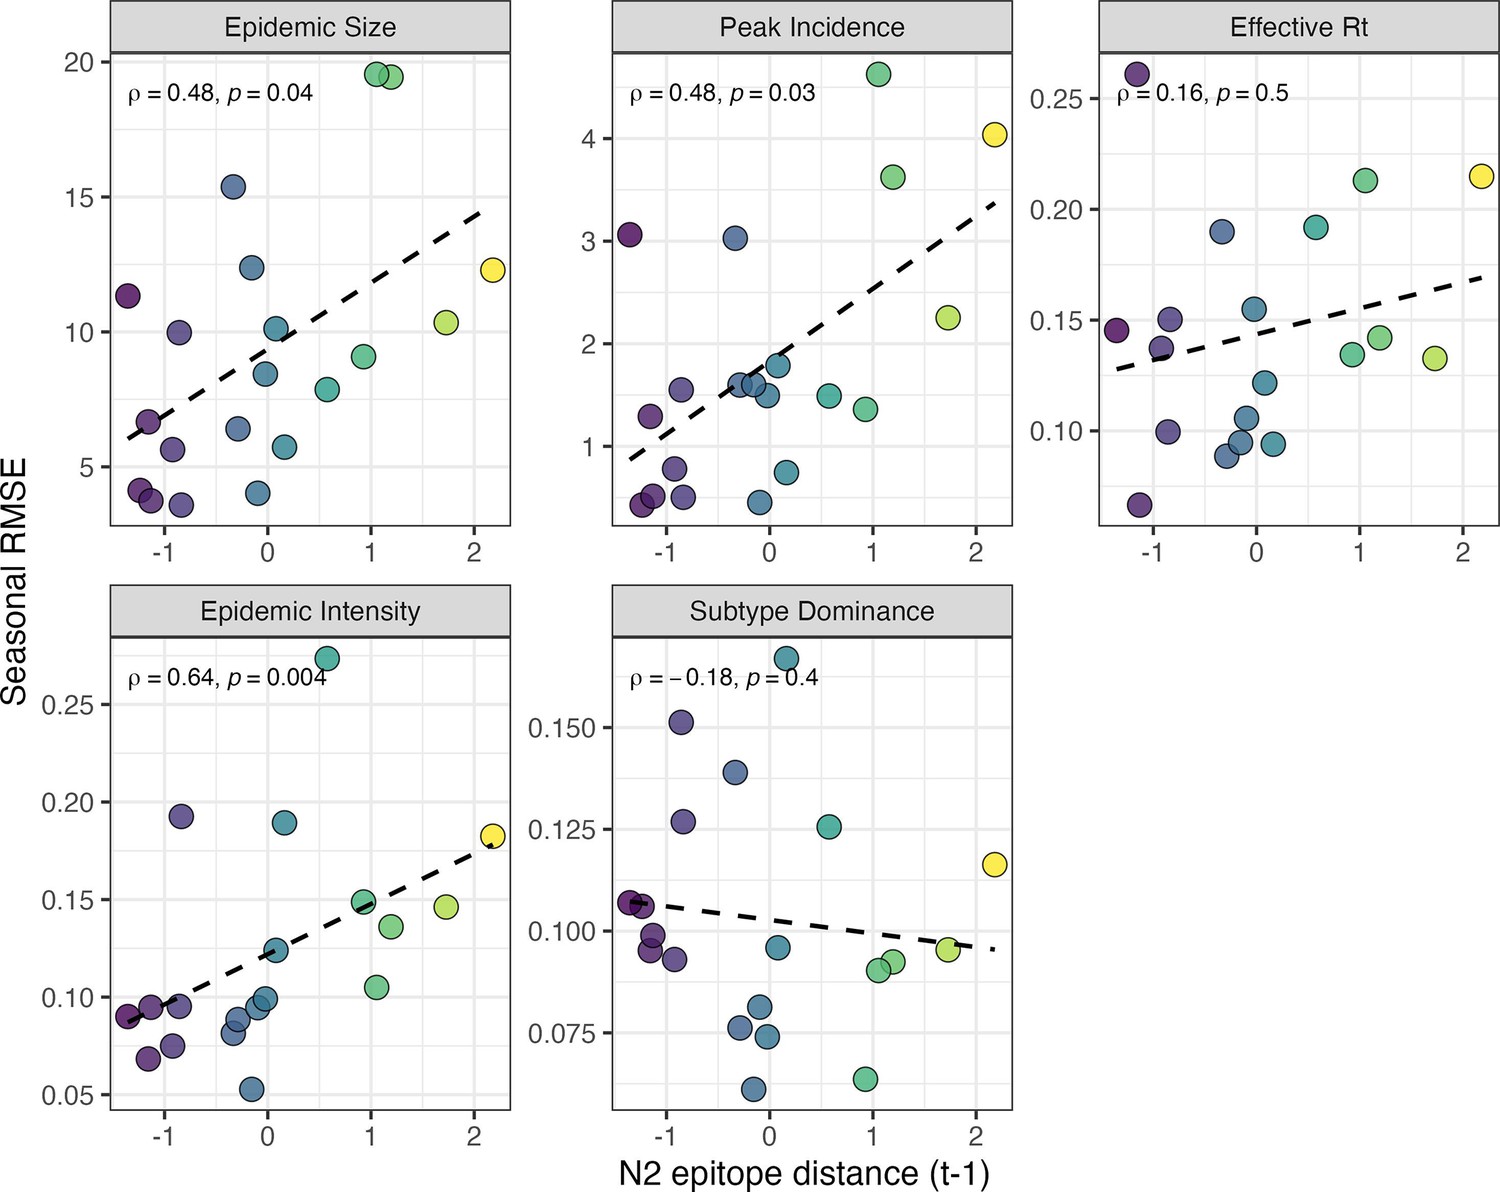
Relationships between the predictive accuracy of random forest models and seasonal N2 epitope distance.
Root mean squared errors between observed and model-predicted values were averaged across regions for each season, and results are facetted according to epidemic metric. Point color corresponds to the mean N2 epitope distance between viruses circulating in the current season and viruses circulating in the prior season ( – 1), with bright yellow points indicating seasons with greater antigenic novelty. In each facet, the Spearman’s rank correlation coefficient and associated p-value are in the top left section, and the black dashed line represents the linear regression fit.
Author response image 1
Adjustment for pre- and post-2009 pandemic only.
Author response image 2
Adjustment for pre- and post-2009 pandemic only.
Tables
Table 1
Evolutionary indicators of seasonal viral fitness.
Evolutionary indicators are labeled by the influenza gene for which data are available (hemagglutinin, HA or neuraminidase, NA), the type of data they are based on, and the component of influenza fitness they represent.
| Evolutionary indicator | Influenza gene | Data type | Fitness category | Citations |
|---|---|---|---|---|
| HI log2 titer distance from the prior season | HA | Hemagglutination inhibition measurements using ferret sera | Antigenic drift | Huddleston et al., 2020; Neher et al., 2016 |
| Epitope distance from the prior season | HA and NA | Sequences | Antigenic drift | Bhatt et al., 2011; Bush et al., 1999; Krammer, 2023; Webster and Laver, 1980; Wiley et al., 1981; Wilson and Cox, 1990; Wolf et al., 2010 |
| Receptor binding site distance from the prior season | HA | Sequences | Antigenic drift | Koel et al., 2013 |
| Mutational load (non-epitope distance from the prior season) | HA and NA | Sequences | Functional constraint | Luksza and Lässig, 2014 |
| Stalk ‘footprint‘ distance from the prior season | HA | Sequences | Negative control | Kirkpatrick et al., 2018 |
| Local branching index | HA and NA | Sequences | Rate of recent phylogenetic branching | Huddleston et al., 2020; Neher et al., 2014 |
-
Table format is adapted from Huddleston et al., 2020.
Table 2
Seasonal metrics of A(H3N2) epidemic dynamics.
Epidemic metrics are defined and labeled by which outcome category they represent.
| Epidemic Outcome | Definition | Outcome category | Citations |
|---|---|---|---|
| Epidemic size | Cumulative weekly incidence | Burden | |
| Peak incidence | Maximum weekly incidence | Burden | |
| Maximum time-varying effective reproduction number, | The number of secondary cases arising from a symptomatic index case, assuming conditions remain the same | Transmissibility | Scott et al., 2021; Bhatt et al., 2023 |
| Epidemic intensity | Inverse Shannon entropy of the weekly incidence distribution (i.e. the spread of incidence across the season) | Sharpness of the epidemic curve | Dalziel et al., 2018 |
| Subtype dominance | The proportion of influenza positive samples typed as A(H3N2) | Viral activity | |
| Excess pneumonia and influenza mortality attributable to A(H3N2) virus | Mortality burden in excess of a seasonally adjusted baseline | Severity | Hansen et al., 2022; Simonsen and Viboud, 2012 |
| Onset week | Winter changepoint in incidence | Timing | Charu et al., 2017 |
| Peak week | First week of maximum incidence | Timing | |
| Spatiotemporal synchrony | Regional variation (s.d.) in onset or peak timing | Speed | Viboud et al., 2006 |
| Onset to peak | Number of days between onset week and peak week | Speed | |
| Seasonal duration | Number of weeks with non-zero incidence | Speed |
Table 3
Comparison of influenza A(H3N2) epidemic timing between A(H3N2) and A(H1N1) dominant seasons.
We used two-sided Wilcoxon rank-sum tests to compare the distributions of epidemic timing metrics between A(H3N2) and A(H1N1) dominant seasons. We categorized seasons as A(H3N2) or A(H1N1) dominant when ≥70% of IAV positive samples were typed as one IAV subtype.
| A(H3N2) timing metric | DominantIAV subtype | Wilcoxon test | ||
|---|---|---|---|---|
| H3N2 | H1N1 | W | p-value | |
| Median onset week (from EW40) | 8 | 11 | 3590 | 2.95×10⁻⁷ |
| Median peak week (from EW40) | 17 | 20.5 | 5294.5 | 3.5×10⁻⁹ |
| Regional variation (s.d.) in onset timing | 9.6 | 16.3 | 4095 | 1.61×10⁻⁵ |
| Regional variation (s.d.) in peak timing | 12 | 22.6 | 6166 | 6.43×10⁻¹⁸ |
| Seasonal duration | 28 | 21.5 | 1977.5 | 6.25×10⁻⁶ |
-
Abbreviations: IAV, influenza A virus; EW40, epidemic week 40 (the start of the influenza season); s.d., standard deviation.
Table 4
Predictors of seasonal A(H3N2) epidemic size, peak incidence, transmissibility, epidemic intensity, and subtype dominance.
Variables retained in the best fit model for each epidemic outcome were determined by BIC.
| Outcome | Best Minimal Model1 | R2 | Adj. R2 | RMSE |
|---|---|---|---|---|
| Epidemic Size | H3 epitope distance ( – 2) + H1 epidemic size + H3 epidemic size ( – 1) | 0.74 | 0.69 | 9.88 |
| Peak Incidence | H3 epitope distance ( – 2) + H1 epidemic size + Dominant IAV Subtype ( – 1) | 0.69 | 0.63 | 2.09 |
| Effective Rt | HI log2 titer distance ( – 2) + H1 epidemic size + N2 distance to vaccine strain | 0.69 | 0.63 | 0.11 |
| Epidemic Intensity | HI log2 titer distance ( – 2) + N2 distance to vaccine strain + vaccination coverage ( – 1) | 0.79 | 0.75 | 0.07 |
| Subtype Dominance | H3 epitope distance ( – 2) + N2 epitope distance ( – 1) + Dominant IAV Subtype ( – 1) | 0.56 | 0.48 | 0.2 |
-
1Candidate models were limited to three independent variables and considered all combinations of the top 10 ranked predictors from conditional inference random forest models (Figure 8).
Additional files
-
Supplementary file 1
GISAID accessions and metadata for influenza H3 and N2 sequences, including originating labs and submitting labs.
- https://cdn.elifesciences.org/articles/91849/elife-91849-supp1-v1.xlsx
-
MDAR checklist
- https://cdn.elifesciences.org/articles/91849/elife-91849-mdarchecklist1-v1.pdf
Download links
A two-part list of links to download the article, or parts of the article, in various formats.
Downloads (link to download the article as PDF)
Open citations (links to open the citations from this article in various online reference manager services)
Cite this article (links to download the citations from this article in formats compatible with various reference manager tools)
Antigenic drift and subtype interference shape A(H3N2) epidemic dynamics in the United States
eLife 13:RP91849.
https://doi.org/10.7554/eLife.91849.3


