Piezo1 mechanosensing regulates integrin-dependent chemotactic migration in human T cells
- IICB-Translational Research Unit of Excellence, CSIR-Indian Institute of Chemical Biology, India
- Department of Biological Sciences, Indian Institute of Science Education and Research, India
- Department of Biological Sciences, Indian Association for Cultivation of Science, India
- Academy of Scientific and Innovative Research, India
Figures
Figure 1 with 4 supplements
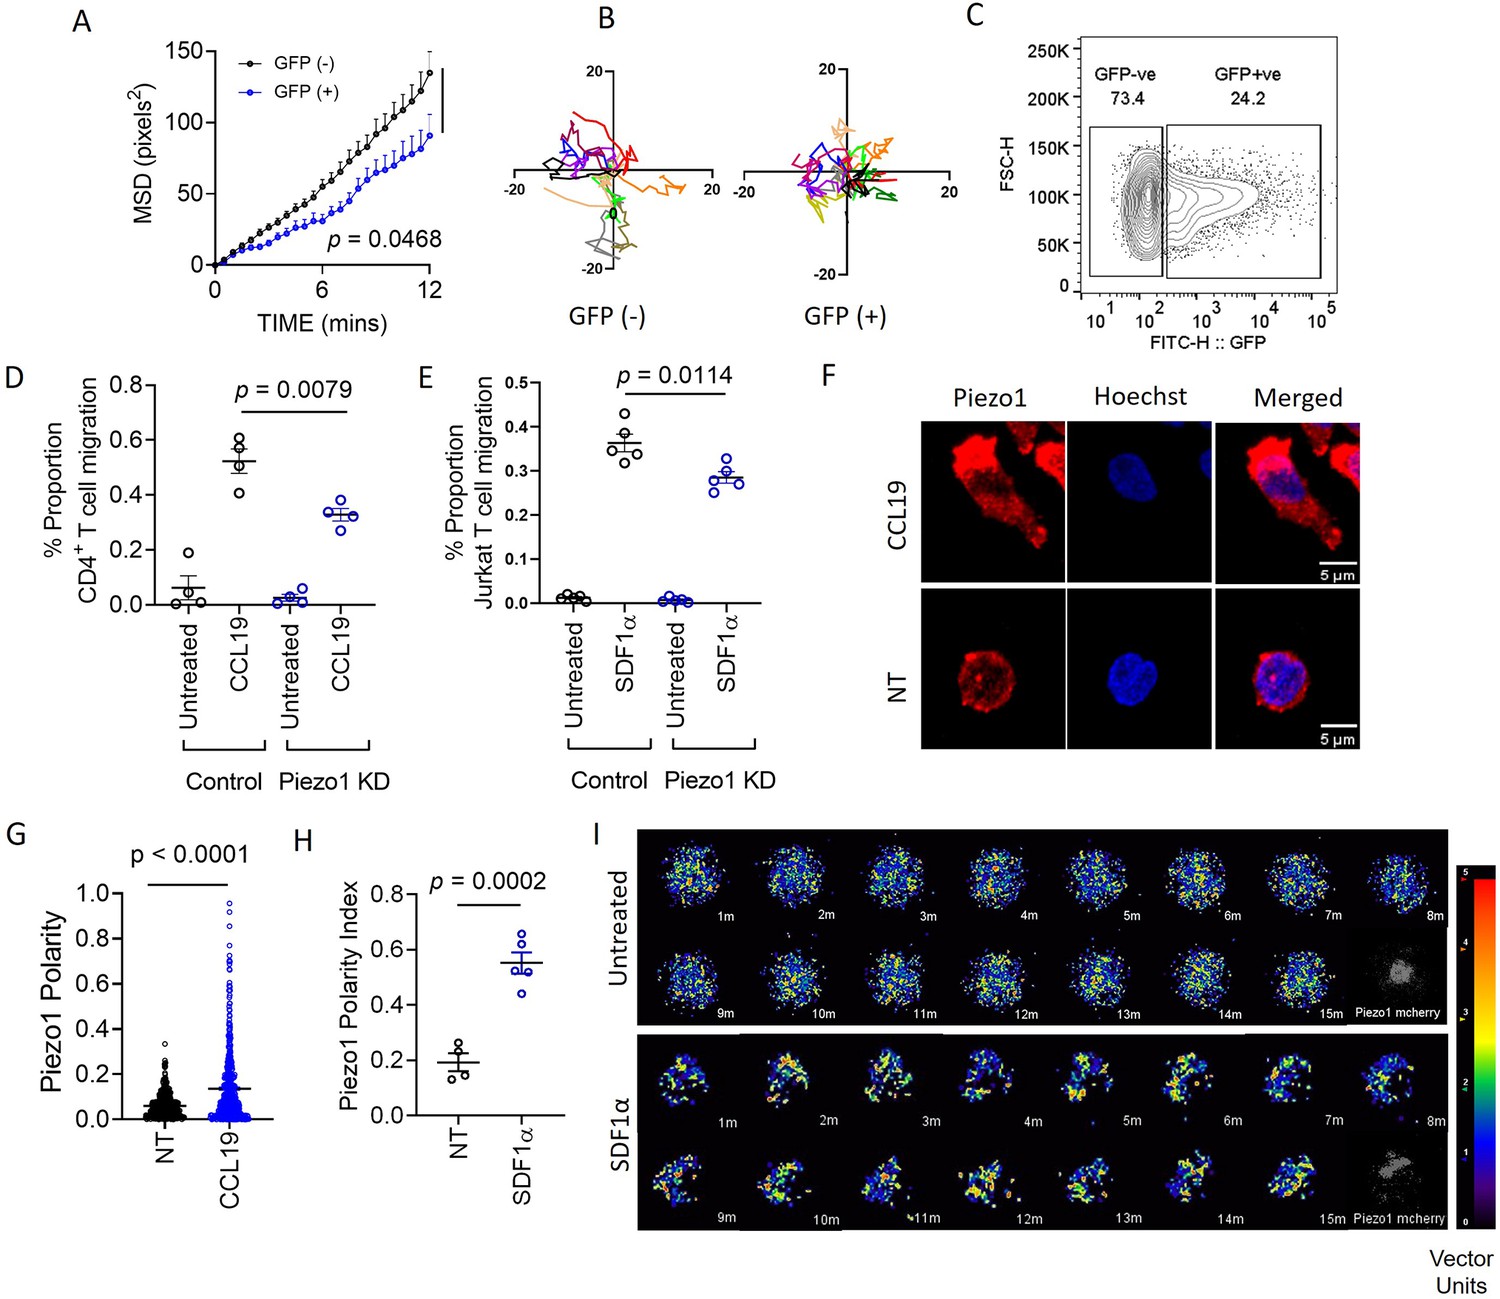
Piezo1 deficiency abrogates integrin-dependent motility in human T cells which is mediated through redistribution of Piezo1 at the leading edge in response to chemokine stimulation.
(A) MSD versus time calculated for GFP+ (potential Piezo1-knockdown cells) and GFP- (potential control cells) in GFP plasmid and Piezo1 siRNA co-transfected human CD4+ T lymphocytes, that were allowed to migrate in the presence of recombinant CCL19 on ICAM1-coated dishes. (B) Representative tracks of GFP- and GFP+ CD4+ T lymphocytes. (C) Comparisons of % GFP+ cells after 72 hr of nucleofection. (D & E) 3-D transwell migration assay of siRNA-transfected primary human CD4+ T lymphocytes (D) and Jurkat T cells (E), respectively. (F) Representative confocal images of Piezo1 distribution in fixed untreated and CCL19-treated CD4+ T lymphocytes. 63 X oil magnification. (G) Comparison between Piezo1 polarity index calculated for fixed, stained, human CD4+ T lymphocytes with or without 0.5 µg/ml CCL19 treatment for 15 min. n>510 random cells, each. (H) Piezo1 polarity index calculated for Jurkat cells, expressing mCherry-tagged Piezo1 during live-cell tracking in the presence of recombinant SDF1α. Each dot represents the polarity index of each cell, averaged over all the time-frames. (I) Representative time kinetics of particle image velocimetry (PIV) analysis of Piezo1-mcherry transfected Jurkat cells, allowed to move on ICAM-coated dishes in the presence of recombinant SDF1α. Top panel: No chemokine. Bottom Panel: SDF1α. All data is representative of at least three independent experiments. Student’s t-test was used to calculate significance and data is represented as mean ± S.E.M.
Figure 1—figure supplement 1
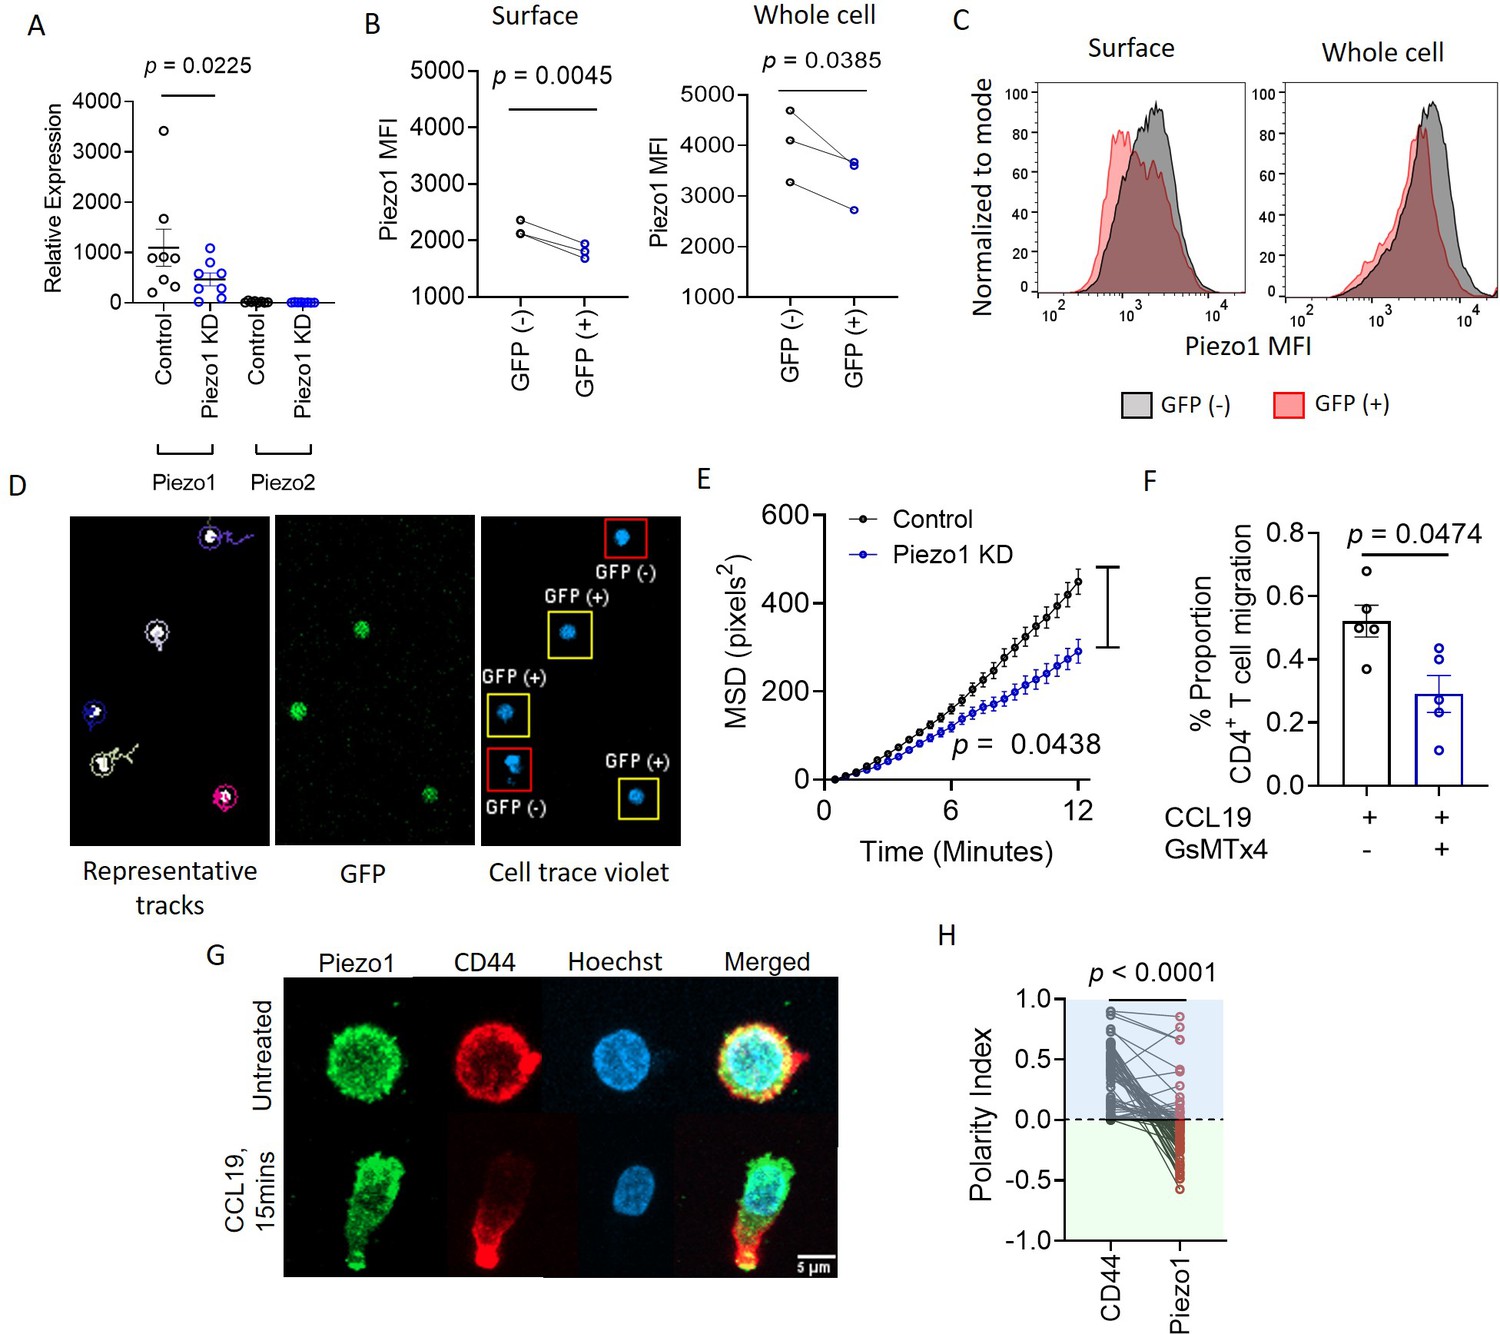
Piezo1 facilitates integrin-dependent human CD4+ T lymphocyte migration by localizing to the leading edge of cells in response to chemokine stimulation.
(A) Quantitative PCR analysis of Piezo1 and Piezo2 relative expression, in control and Piezo1 siRNA-transfected CD4+ T lymphocytes. (B) Flow cytometric measurement of Piezo1 mean fluorescence intensity, MFI (left: surface staining; right: intracellular staining) in Piezo1 siRNA and GFP co-transfected cells. (C) Representative histograms of Piezo1 MFI in GFP (-) and GFP (+) cells in surface stained (left) and intracellularly stained (right) cells. (D) Representative 2-D tracks (left), GFP signal (middle), and cell trace violet signal of CD4+ T cells (right). 20 X magnification. (E) MSD tracks of control siRNA (n=357 cells) and Piezo1 siRNA-transfected CD4+ T cells (n=348 cells) on ICAM1-coated wells in the presence of CCL19. (F) Effect of Piezo1 inhibition by GsMTx4 on 3D ICAM1-coated transwell migration. (G) Representative confocal images depicting anti-polarity of Piezo1 and CD44 (uropod) in untreated and CCL19-stimulated conditions. (H) Polarity indices calculated for Piezo1 and CD44, where negative polarity for Piezo1 means anti-polarity (described in detail in Methods section). n=69 cells, each. All data shown is representative of at least three independent experiments. Student’s t-test was used to calculate significance and data is represented as mean ± S.E.M.
Figure 1—animation 1
Representative animation of cell trace-stained CD4+ T lymphocytes transfected with GFP construct and Piezo1 siRNA, in the presence of recombinant human CCL19 on ICAM1-coated plates, for a total duration 15 min at 30 s per frame.
The left panel represents superimposed cell trace and GFP signals of moving cells. The right panel shows tracks of the moving cells. Boxed cells are GFP+ cells. 20X Magnification. Related to Figure 1A-C and Figure 1—figure supplement 1D.
Figure 1—animation 2
Representative 3D projection of Z-stacks of CD4+ T lymphocyte treated with recombinant human CCL19 for 15 min, immunostained with Piezo1 antibody and Hoechst.
63X magnification. Related to Figure 1F.
Figure 1—animation 3
Representative immunofluorescence time-lapse animation of Piezo1-mCherry expressing Jurkat cell moving on ICAM1-coated dish in the presence of recombinant human SDF1α.
Images were acquired manually for a total duration of 15 min at 1 min per frame interval. Images were captured at 40X magnification. Related to Figure 1l.
Figure 2 with 1 supplement
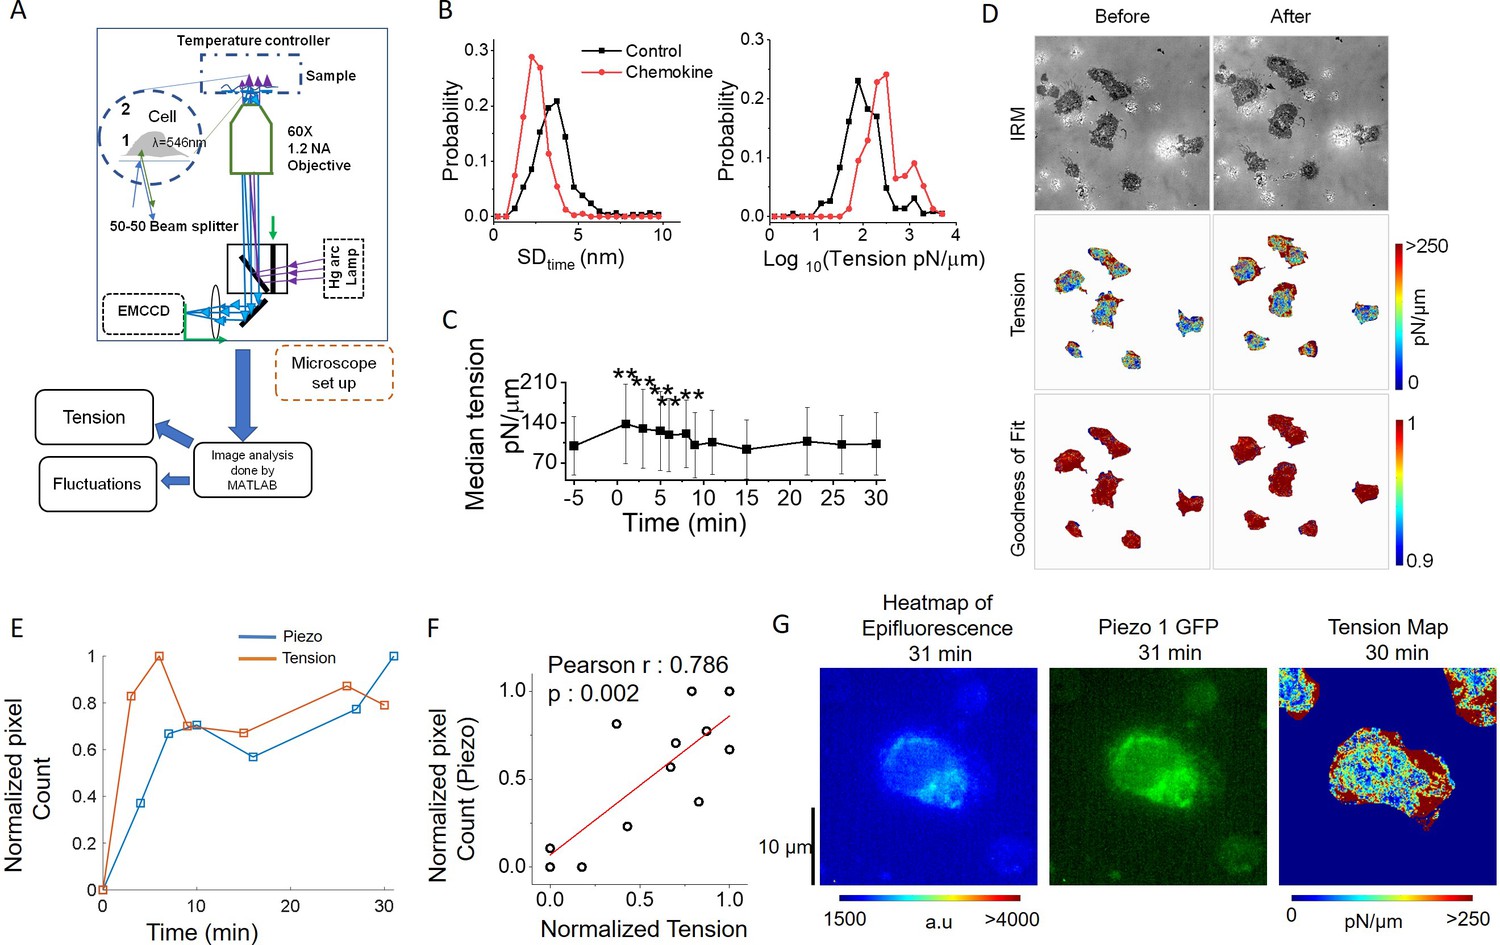
Piezo1 redistribution in migrating T cells follows increased membrane tension in the leading edge.
(A) Schematic illustration of interference reflection microscopy imaging setup. (B) Probability distribution of the amplitude of temporal fluctuations (SDtime, left) and tension (right) before and after the addition of chemokines. (C) Temporal trajectory of tension of cells before and after addition of chemokine with ** indicating a significant difference from control. (D) Representative IRM images of Jurkat cells (top), corresponding tension maps (middle), and R2 maps (bottom), before and after 3 min of chemokine treatment. (E) Correlation between normalized Piezo intensity, tension magnitudes with time. (F) Scatter plot to show the correlation between the normalized pixel count of Piezo1 and normalized tension. Piezo1 intensity at specific time-points were correlated with tension magnitudes at the preceding timepoints. Normalization has been done such that the maximum value is set to 1 and others are accordingly scaled. (G) Colour-coded Piezo1-GFP intensity map (middle), epifluorescence image (left), and tension map (right) of representative Piezo1-GFP expressing Jurkat cell, after 30 min of 0.1 µg/ml of SDF1α treatment.
Figure 2—figure supplement 1
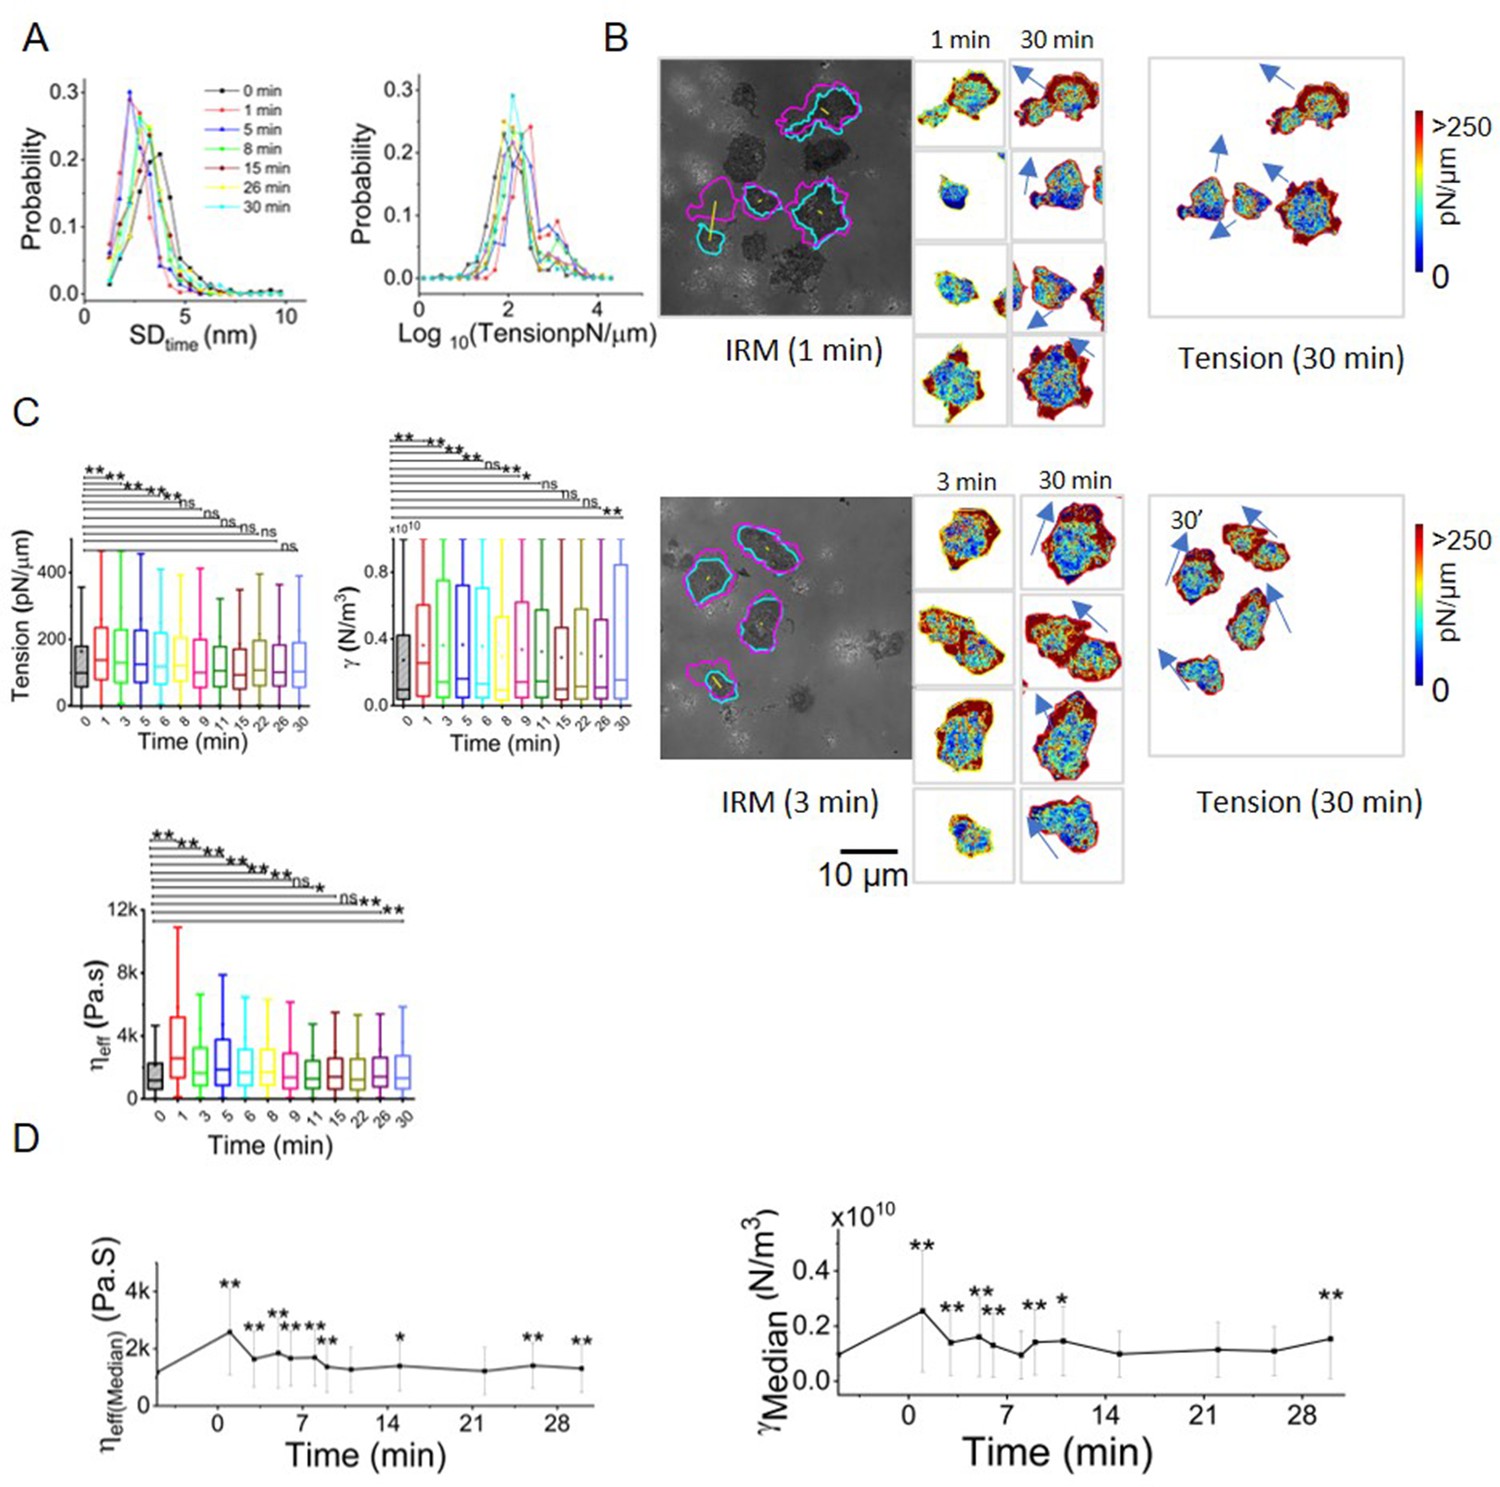
Chemokine stimulation increases leading edge membrane tension in human CD4+ T lymphocytes.
(A) Probability distribution of temporal fluctuation (left) and tension (right) followed over time, (B) Tension maps showing high-tension edges aligning with direction of cell migration (arrows) before and after addition of chemokine. Cells from two fields (top and bottom panel) are depicted. (C) Box plots of time-kinetics of tension (upper left), confinement (upper right), effective cytoplasmic viscosity (lower left). (D) Temporal trajectory of effective cytoplasmic viscosity (left) and confinement (right) of cells before and after addition of chemokine with ** indicating a significant difference from control. ns=p>0.0042, *p<0.0042, **p<0.000083 derived using Mann-Whitney U Test with Bonferroni correction. Ncells = 21, NFBR (control) = 1594, NFBR (1 min)=1228, NFBR (3 min)=643, NFBR (5 min)=1349, NFBR (6 min)=594, NFBR (8 min)=1056, NFBR (9 min)=1562, NFBR (11 min)=638, NFBR (15 min)=1843, NFBR (22 min)=741, NFBR (26 min)=2019, NFBR (30 min)=2,746. Scale bar = 10 μm.
Figure 3 with 2 supplements
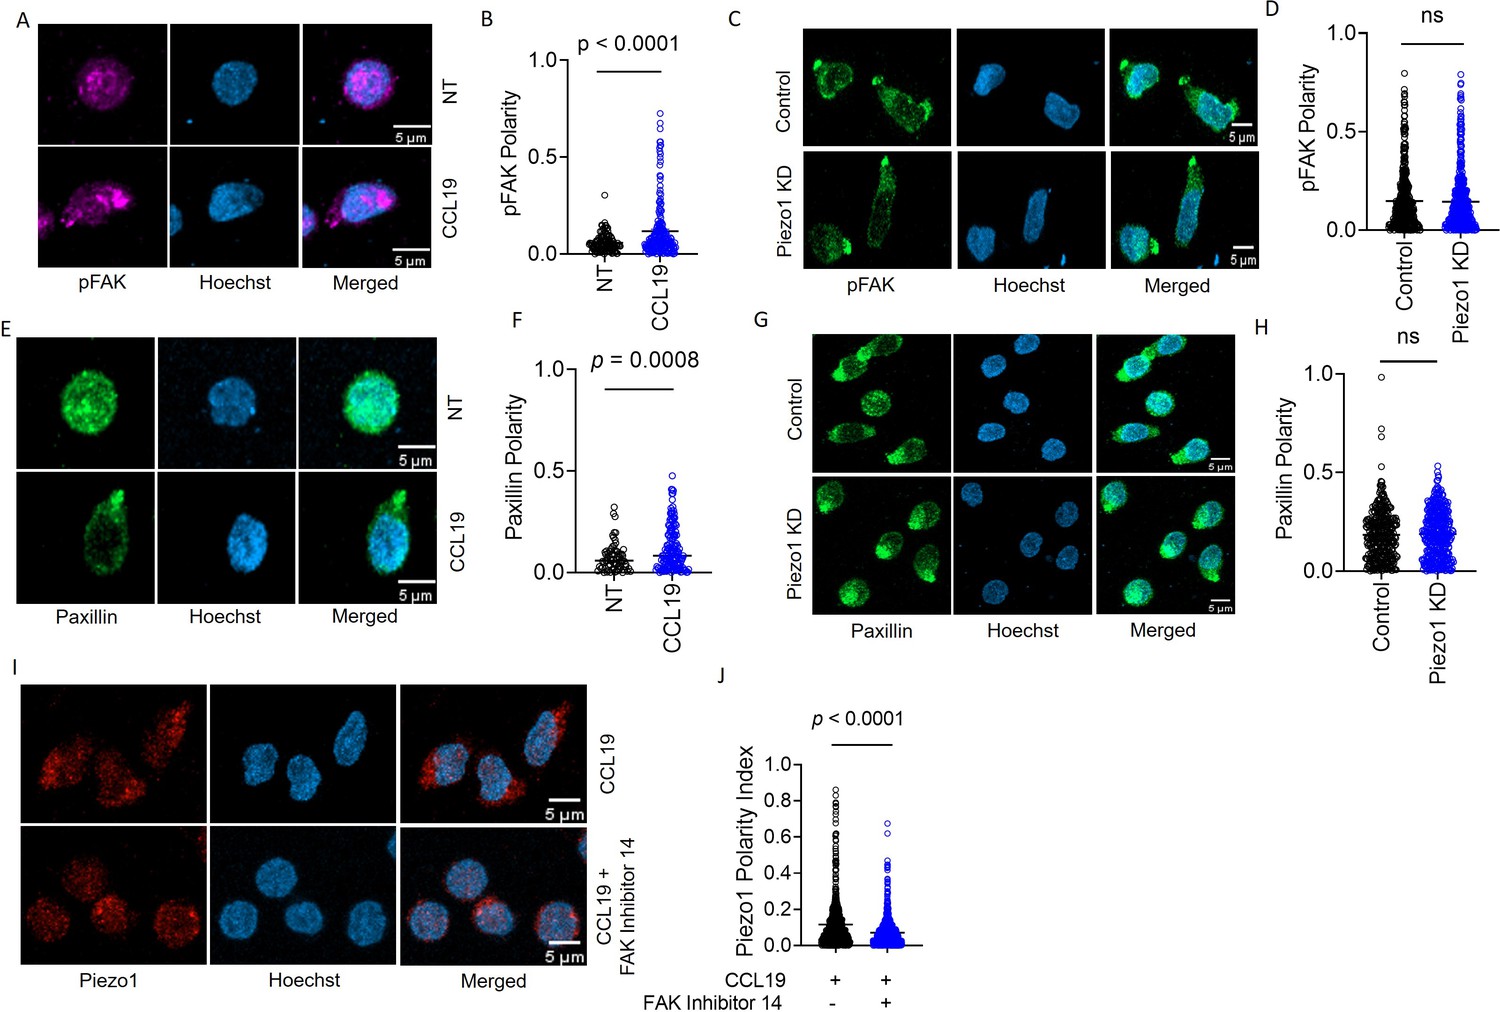
Focal adhesion following chemokine receptor activation does not depend on Piezo1.
(A) Representative confocal images of human CD4+ T lymphocytes, fixed and stained for phospho-FAK (pFAK) under untreated and CCL19-treated conditions. (B) Increased polarity of pFAK upon chemokine stimulation of CD4+ T lymphocytes as compared to unstimulated controls. n>120 cells, each. (C) Representative confocal images of pFAK distribution in control and Piezo1 siRNA-transfected CD4+ T lymphocytes stimulated with chemokine. (D) Comparison of pFAK polarity in CCL19-stimulated control and Piezo1-knockdown CD4+ T lymphocytes. n>450 random cells, each. (E) Representative confocal images of paxillin distribution in untreated versus CCL19-stimulated CD4+ T lymphocytes. (F) Increased paxillin polarity in response to CCL19 stimulation as compared to untreated CD4+ T lymphocytes. Untreated n>70, CCL19-treated n>150. (G) Representative confocal images of immunostained paxillin in chemokine-stimulated, control and Piezo1-knockdown CD4+ T lymphocytes. (H). Comparison of paxillin polarity in CCL19-stimulated control and Piezo1-knockdown CD4+ T lymphocytes. n>550 random cells, each. (I) Representative confocal images of stained Piezo1 in CD4+ T cells stimulated with CCL19 in the presence or absence of FAK inhibitor 14. (J) Effect of focal adhesion kinase (FAK) inhibition on Piezo1 polarity in CD4+ T lymphocytes stimulated with recombinant CCL19 versus untreated cells. n>600 random cells, each. All data represented is from at least three independent experiments. Student’s t-test was used to calculate significance and data is represented as mean ± S.E.M.
Figure 3—figure supplement 1
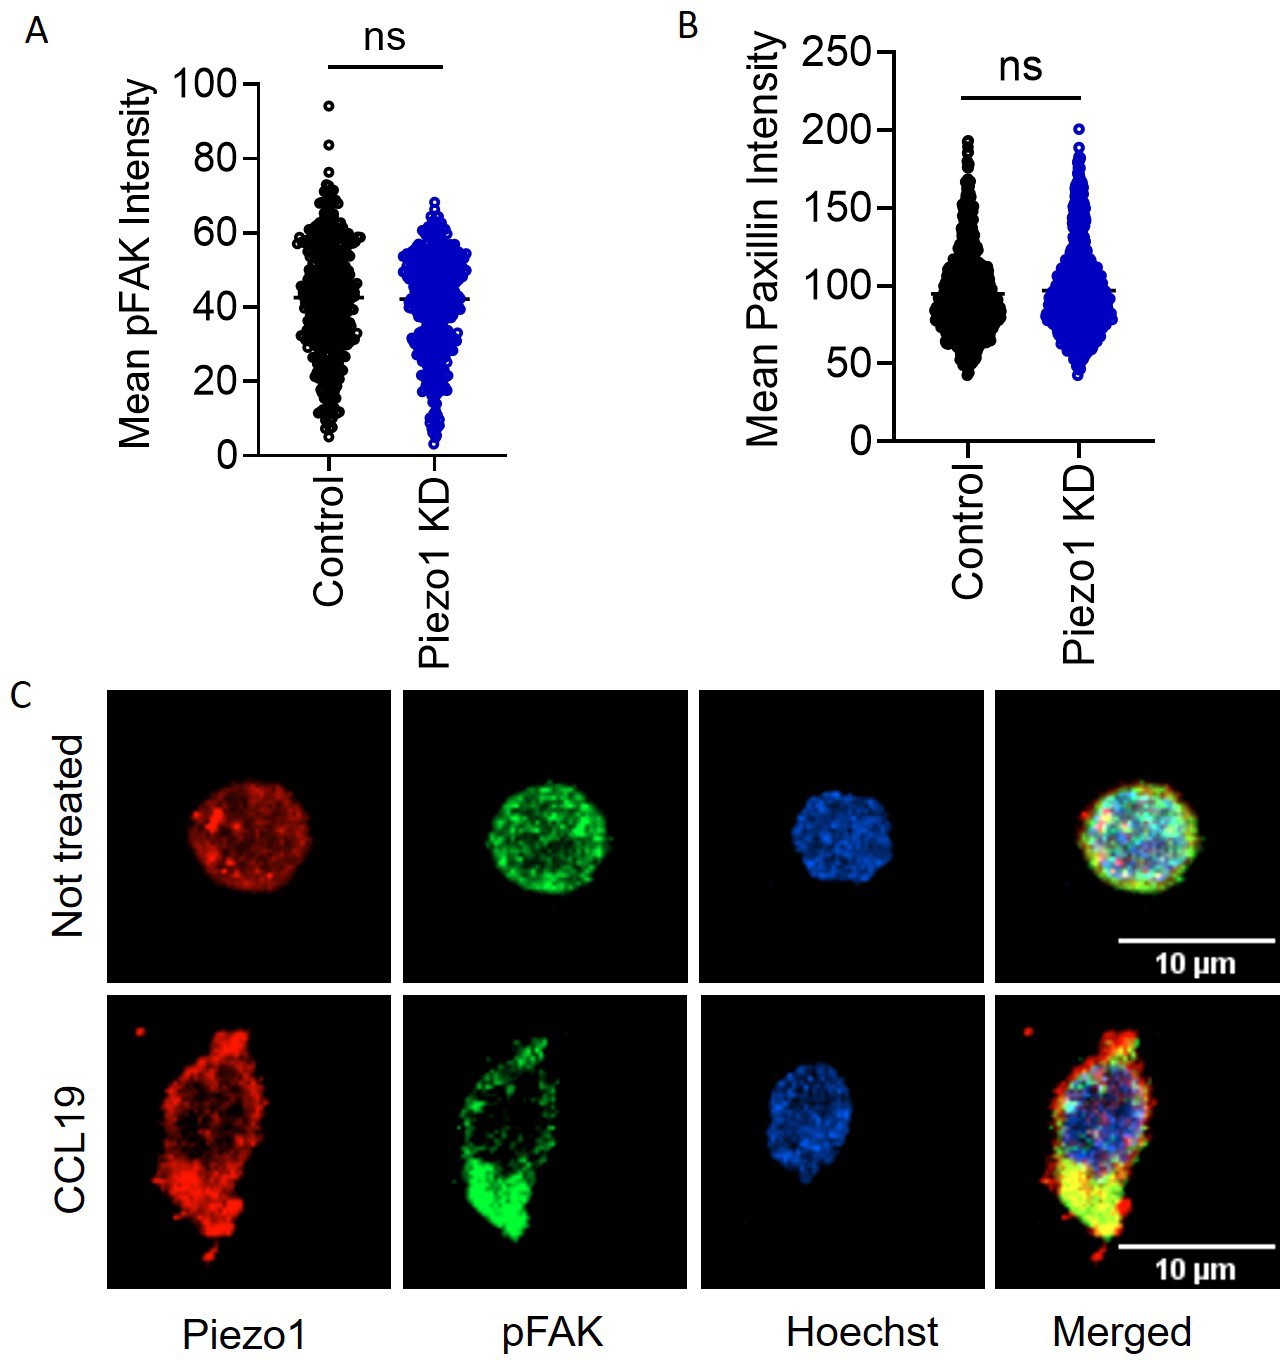
Piezo1 acts downstream of focal adhesion formation and localizes to sites of focal adhesions formed in response to chemokine stimulation.
(A) Mean signal intensity of pFAK in CCL19-treated control and Piezo1 KD cells (n>440 random cells, each). (B) Mean signal intensity of paxillin in CCL19-treated control and Piezo1 KD cells (n>780 random cells, each). (C) Representative images of pFAK and Piezo1 colocalization in untreated (top panel) and CCL19-treated (bottom panel) CD4+ T cells. All data generated is of at least three independent experiments. Student’s t-test was used to calculate significance and data is represented as mean ± S.E.M.
Figure 3—animation 1
Representative 3D rendering of confocal Z-stacks of CD4+ T lymphocyte treated with recombinant human CCL19 for 10 min, immunostained with phosphorylated focal adhesion kinase (pFAK) antibody and Hoechst.
63X magnification. Related to Figure 3A.
Figure 4 with 5 supplements
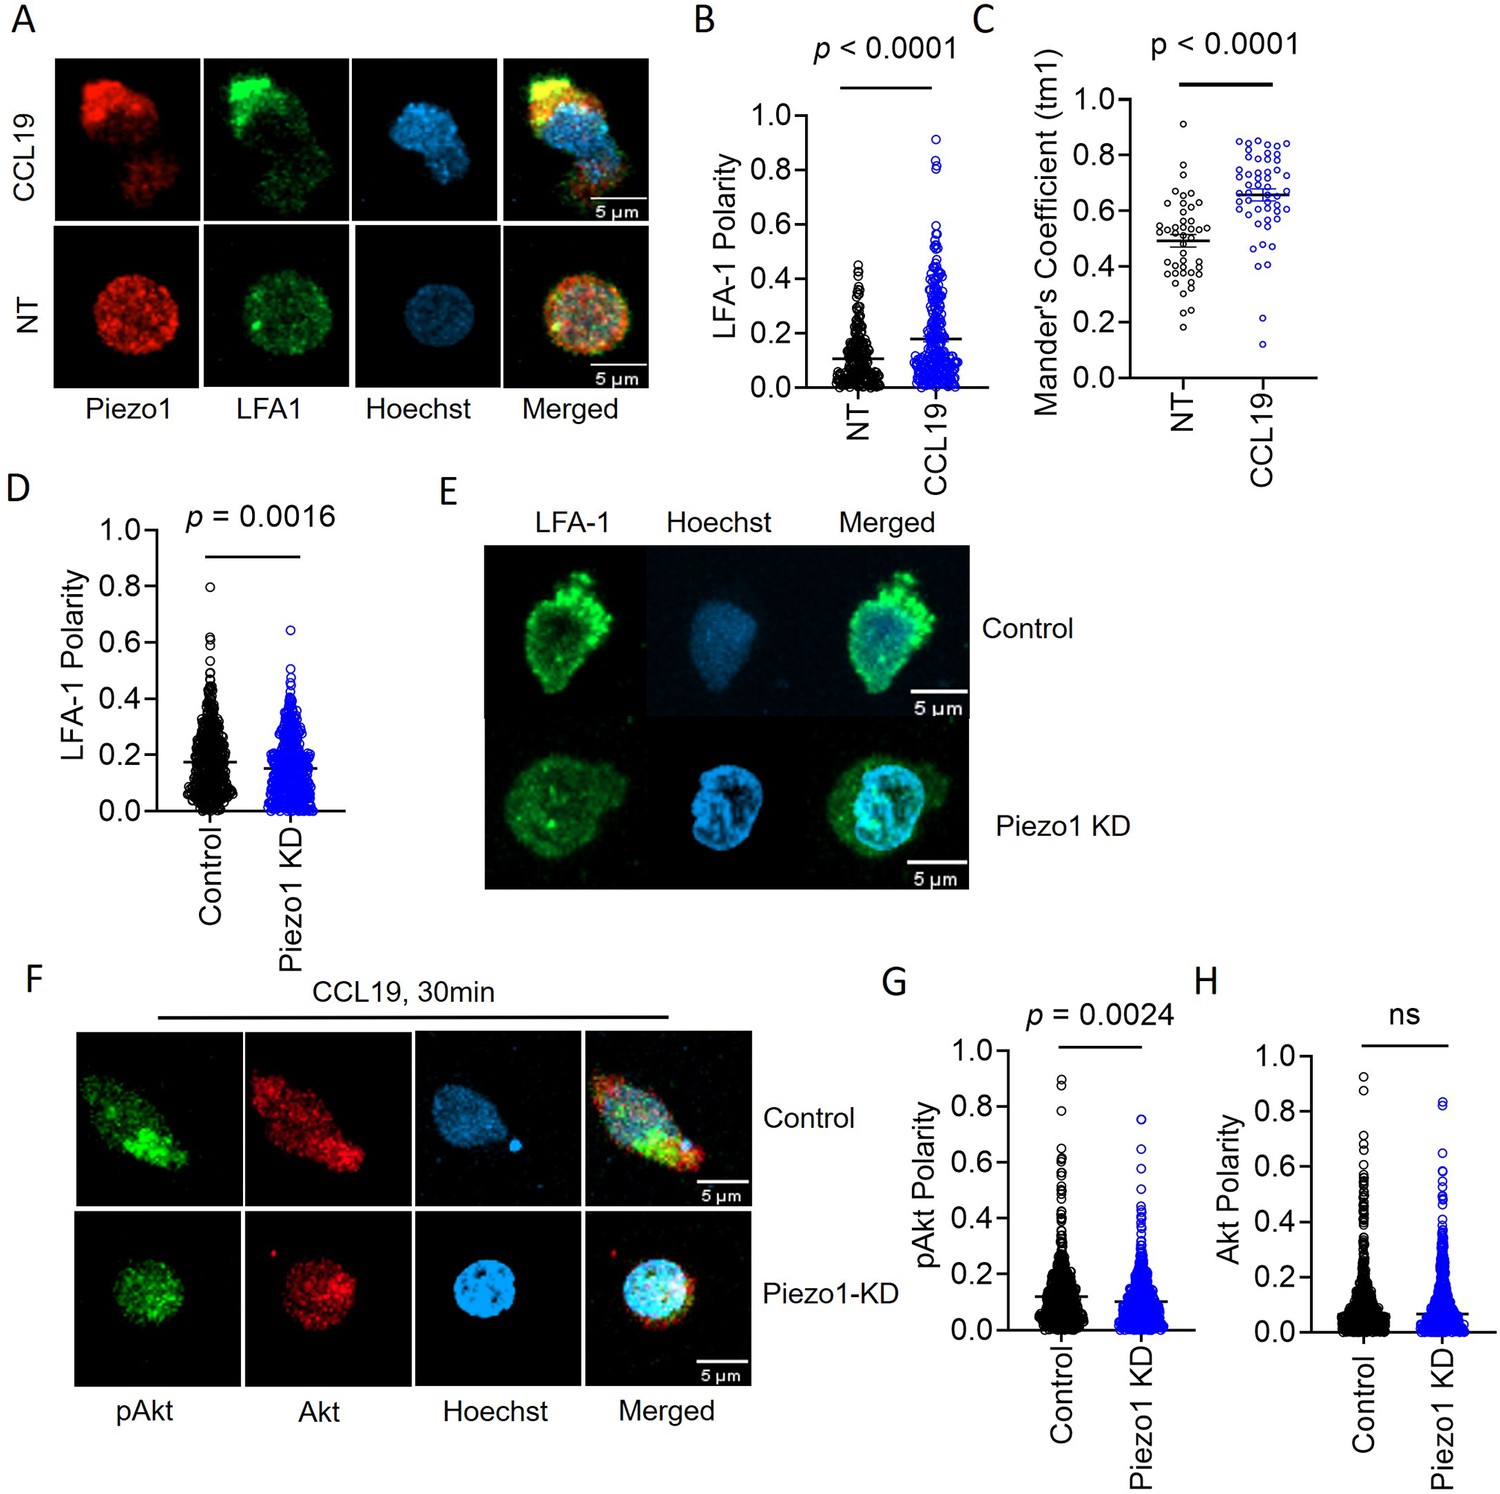
Membrane recruitment of LFA1 on chemokine receptor activation disrupts Piezo1 deficiency.
(A) Representative confocal images of fixed, immunostained Piezo1 and LFA1 in unstimulated and CCL19-stimulated CD4+ T lymphocytes. (B) Increased LFA1 polarity in response to recombinant CCL19 stimulation in CD4+ T cells. n>295 random cells, each. (C) Manders’ co-localization analysis of Piezo1 and LFA1 in untreated and CCL19-treated CD4+ T lymphocytes. n>100 cells, each. (D) Comparison of LFA1 polarity in chemokine-treated control and Piezo1 knockdown CD4+ T lymphocytes. n>490 random cells, each. (E) Representative confocal stained images of LFA1 polarity of CCL19-treated control and Piezo1-knockdown CD4+ T lymphocytes. (F) Representative confocal images of phospho-Akt (pAkt) and Akt distribution upon chemokine treatment of control and Piezo1-knockdown cells. (G & H) Quantitative analyses of pAkt (G) and Akt (H) polarity in control and Piezo1-knockdown cells after CCL19 treatment. n>580 random cells, each. All data is representative of at least three independent experiments. Student’s t-test was used to calculate significance and data is represented as mean ± S.E.M.
Figure 4—animation 1
Representative 3D rendering of confocal Z-stacks of CD4+ T lymphocyte depicting Piezo1 and CD11a/LFA-1 distribution, upon 30 min of recombinant CCL19 treatment.
63X magnification. Related to Figure 4A.
Figure 4—animation 2
Representative 3D rendering of confocal Z-stacks of control siRNA-transfected CD4+ T lymphocyte depicting CD11a/LFA-1 polarity, upon 30 min of recombinant CCL19 treatment.
63X magnification. Related to Figure 4E.
Figure 4—animation 3
Representative 3D rendering of confocal Z-stacks of Piezo1 siRNA-transfected CD4+ T lymphocyte depicting CD11a/LFA-1 polarity, upon 30 min of recombinant CCL19 treatment.
63X magnification. Related to Figure 4E.
Figure 4—animation 4
Representative 3D rendering of confocal Z-stacks of control siRNA-transfected CD4+ T lymphocyte depicting phosphorylated Akt polarity, upon 30 min of recombinant CCL19 treatment.
63X magnification. Related to Figure 4F.
Figure 4—animation 5
Representative 3D rendering of confocal Z-stacks of Piezo1 siRNA-transfected CD4+ T lymphocyte depicting phosphorylated Akt polarity, upon 30 min of recombinant CCL19 treatment.
63X magnification. Related to Figure 4F.
Figure 5 with 1 supplement
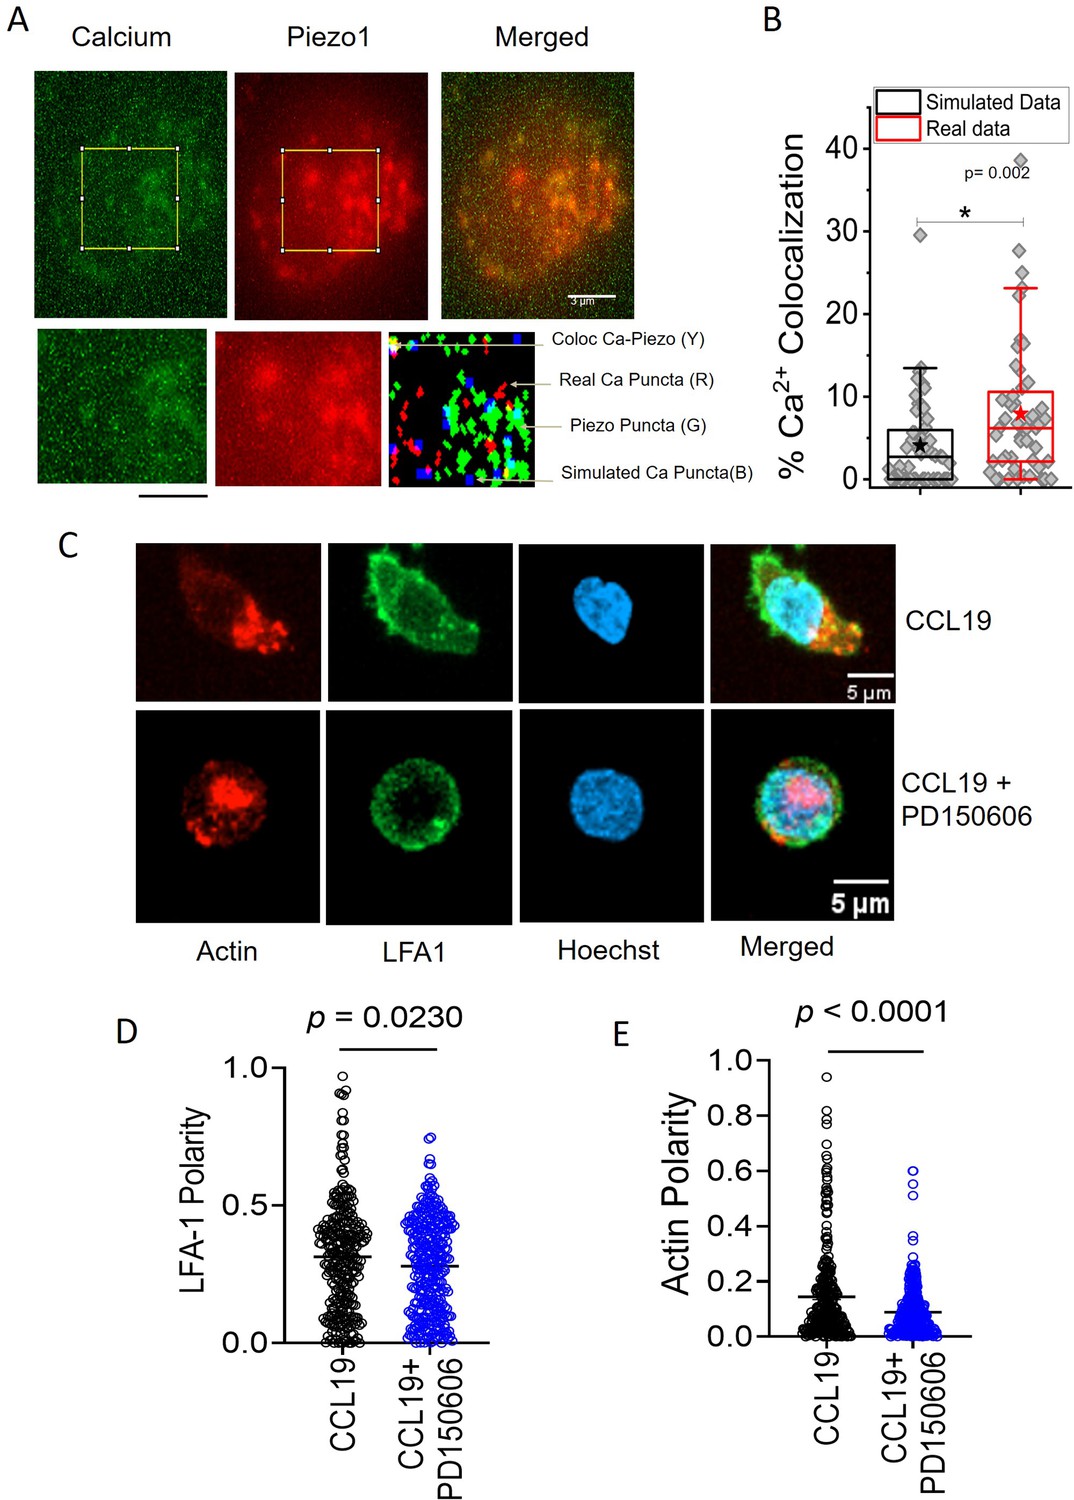
Local Ca2+ mobilization with Piezo1 redistribution upon chemokine stimulation.
(A) Representative total internal reflection fluorescence (TIRF) image of a Jurkat Cell stained with Fluo-3, AM and transiently expressing with Piezo1 mCherry. Lower panel: zoomed-in image and overlap of binary images of objects detected from Calcium and Piezo channels as well as simulated randomly placed punctas having similar total (in the zoomed-in section) and average area as that of the Calcium punctas detected in the real images. Overlap RGB image shows the overlap between real calcium (red) and piezo puncta (green), overlap puncta (yellow), and simulated calcium puncta (blue). (B) Comparison between percentage calcium colocalization of simulated data and real data. * Denote p<0.05 calculated using Mann Whitney U test. n cell = 52 (13 cells x 4 time points). NROIS = 52. (C) Representative confocal images of LFA1 and actin distribution in CCL19-stimulated CD4 + T lymphocytes with or without inhibition of calpain. 100 μM of PD15606 was added to the cells 1 hr prior to the addition of chemokine. Quantitative comparisons of (D) LFA1 and (E) actin polarity upon chemokine stimulation, in the presence or absence of calpain pre-inhibition. n>290 random cells, each. All data is generated from at least three independent experiments. Student’s t-test was used to calculate significance and data is represented as mean ± S.E.M.
Figure 5—figure supplement 1
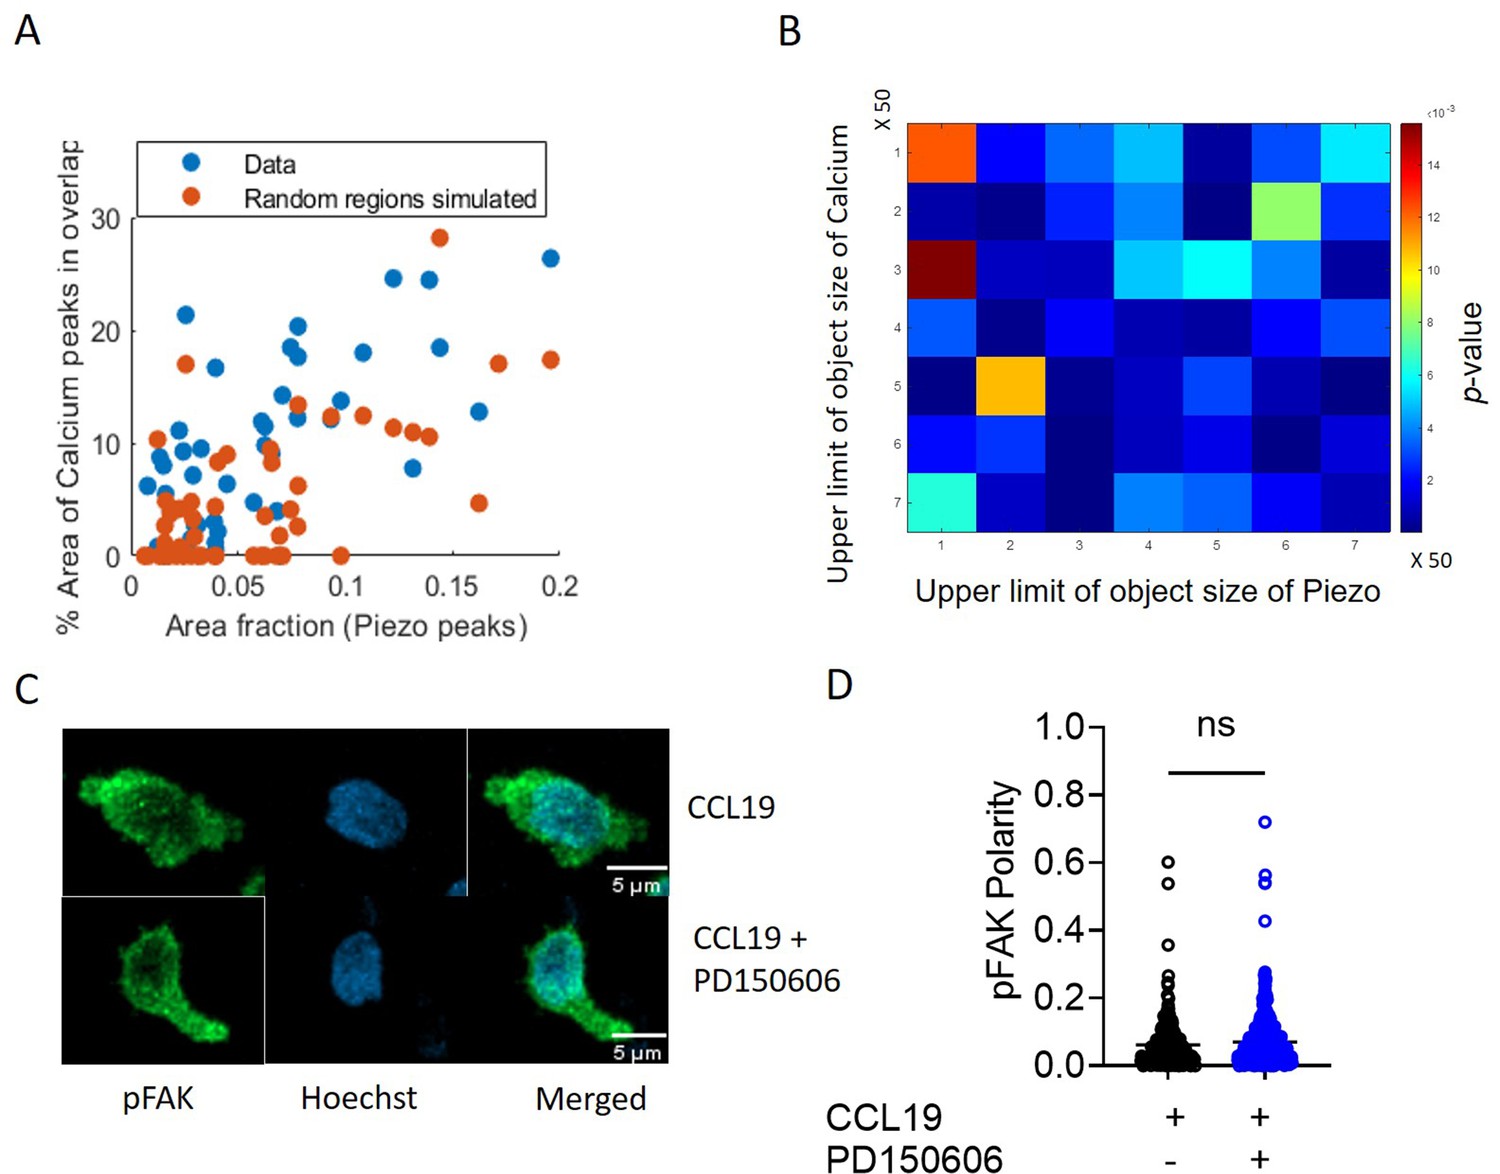
Active calcium mobilization indicating Piezo1 activity at Piezo1-rich areas of focal adhesions formed independently of Piezo1-mediated actin polymerization.
(A) Scatter plot of how percentage area of Ca2+ peaks (real and simulated) that overlap with Piezo1 varies with area fraction of Piezo1, showing the comparison between real and simulated data. (B) Color matrix of p-value of comparison of % overlap obtained using real data and simulated data. Color denotes p-value. As ‘x’ increases maximum object size used for Piezo1 signal changes. As ‘y’ increases maximum object size used for Ca2+ signal changes. (C) Representative confocal images of human CD4+ T cells fixed and stained for phosphorylated focal adhesion kinase (pFAK). Cells were treated with CCL19 with or without prior incubation with calpain inhibitor-PD150606. (D) Comparison of pFAK polarity of cells stimulated with CCL19, with or without prior calpain inhibition. n>230 random cells, each. Data is generated from at least three independent experiments. Student’s t-test was used to calculate significance and data is represented as mean ± S.E.M.
Figure 6 with 5 supplements
Piezo1 deficiency disrupts F-actin retrograde flow in T cells despite chemokine receptor activation.
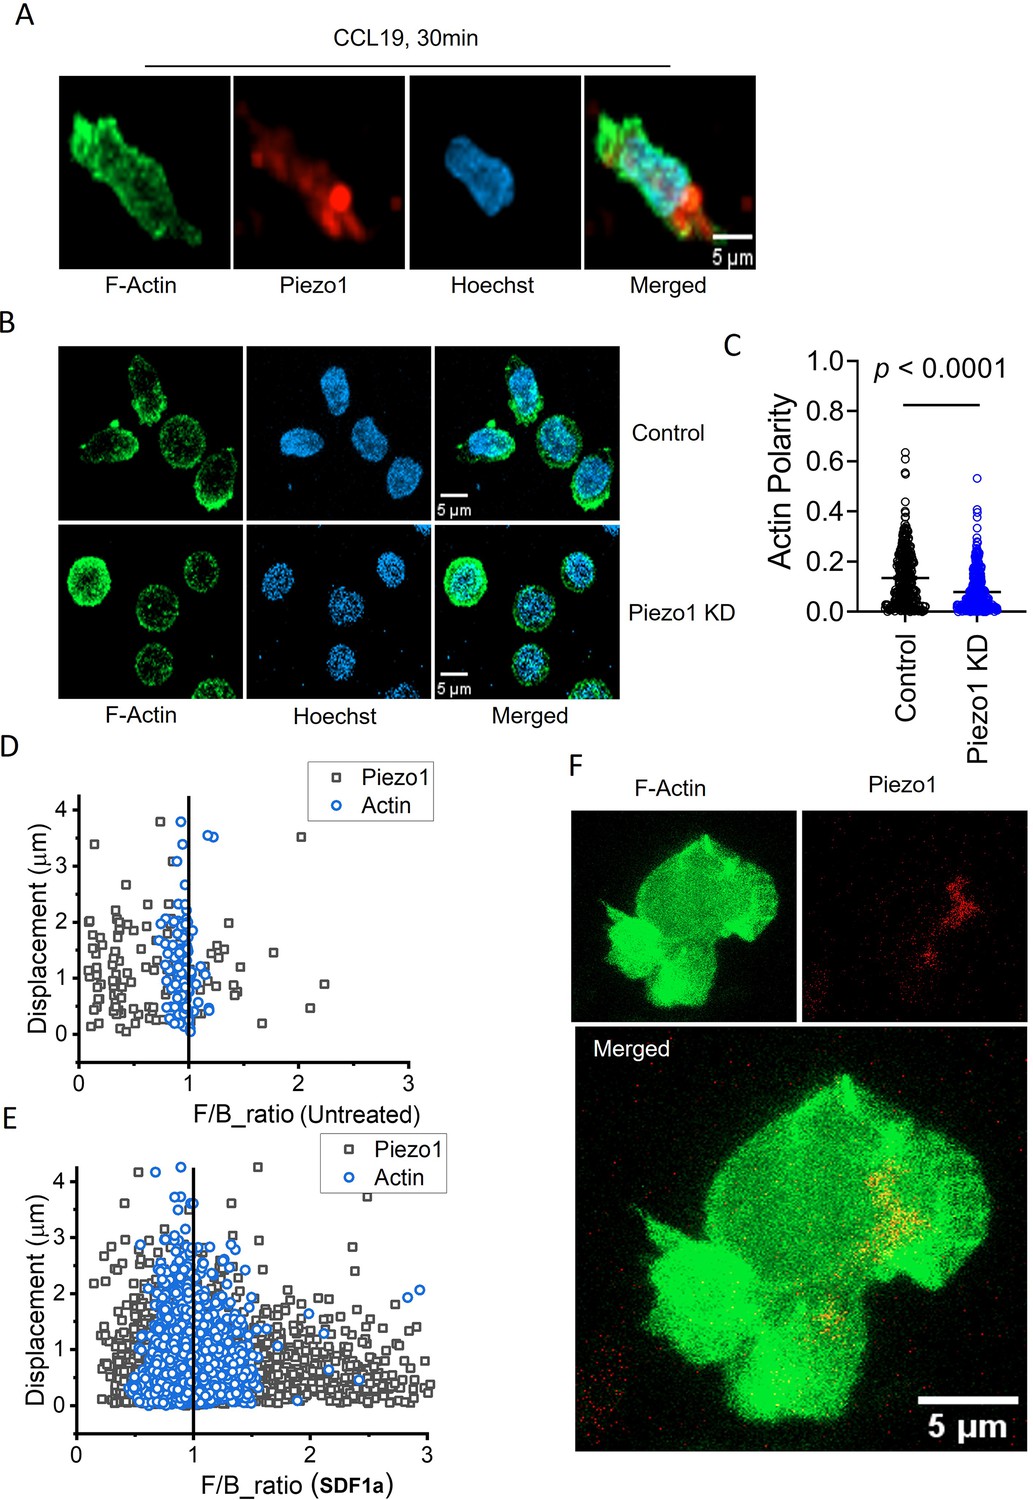
(A) Representative fixed confocal images of actin and Piezo1 distribution in CD4+ T lymphocytes after 30 min of 0.5 µg/ml recombinant CCL19 treatment. (B) Representative fixed confocal images of actin distribution in chemokine-treated, control and Piezo1-knockdown CD4 + T lymphocytes. (C) Quantitative comparison of actin polarity in control and Piezo1-knockdown CD4+ T lymphocytes cells after 30 min of chemokine treatment. n>300 random cells, each. Front-back (F/B) of Piezo1 and actin-GFP in untreated (D) and SDF1α treated (E) Jurkat cells co-expressing actin-GFP and Piezo1-mCherry. (F) A snapshot of time-lapse imaging of Piezo1-mCherry and actin-GFP expressing Jurkat cell treated with 0.1 µg/ml of SDF1α. Image is the maximum Z-projection of the cell at 63 X/1.40 magnification. All data is generated from at least three independent experiments.
Figure 6—figure supplement 1
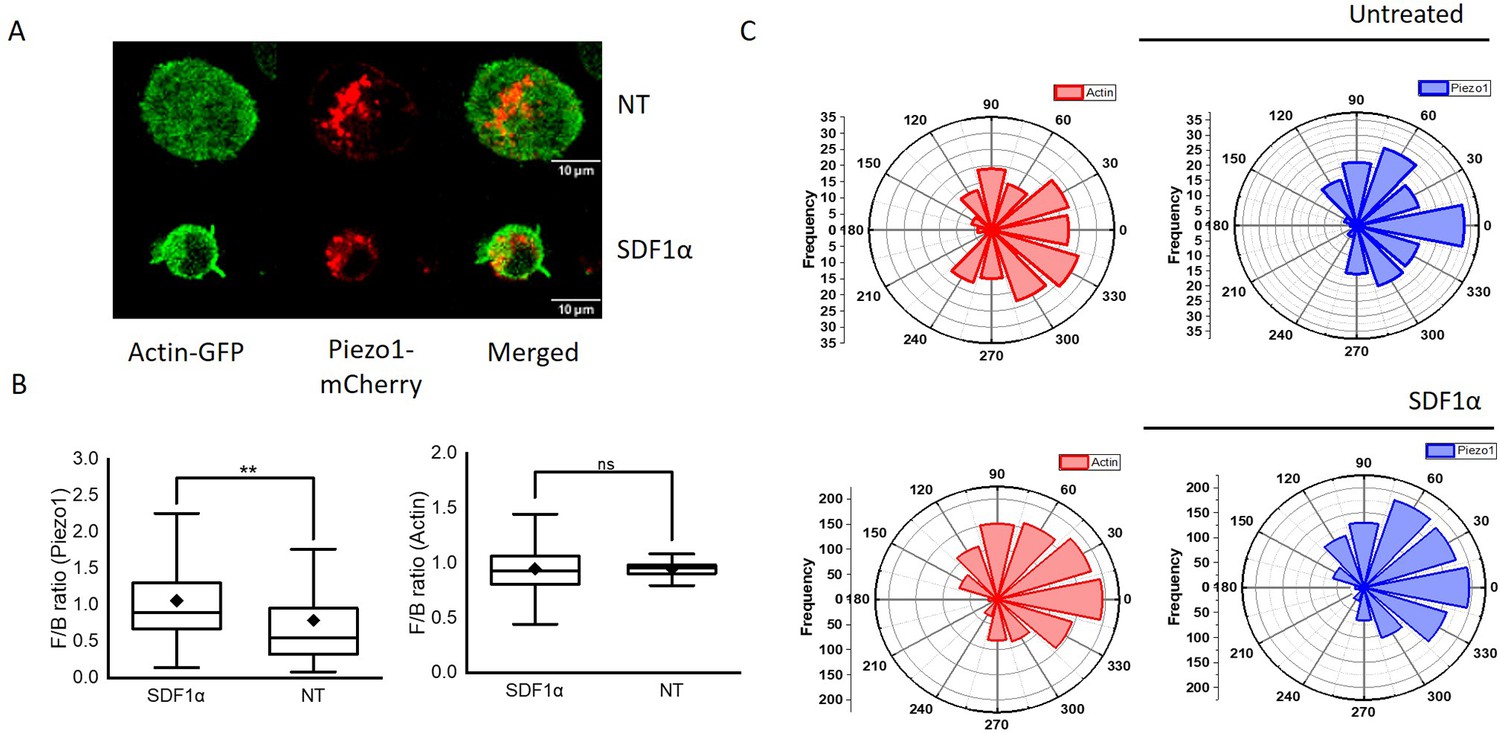
Leading edge polarity of Piezo1-mCherry and dynamic distribution of actin-GFP in SDF1α-treated Jurkat cells.
(A) Representative 2D confocal image of Jurkat cell expressing Piezo1 mCherry and actin GFP in the absence (top panel) or presence (bottom panel) of recombinant SDF1α. (B) Box plots depicting Piezo1 mCherry (left) and actin-GFP (right) front-back polarity in untreated (NT) and chemokine-stimulated conditions. (C) Polar plots depicting relative Piezo1 mCherry and actin-GFP spatial distribution in Jurkat cells with respect to direction of cell trajectory in untreated (top panel) and SDF1α (bottom panel) treated cells. Spatial distribution was calculated for all the time points of time-lapse imaging (see methods).
Figure 6—animation 1
Representative 3D rendering of confocal Z-stacks of CD4+ T lymphocyte depicting Piezo1 and actin distribution, upon 30 min of recombinant CCL19 treatment.
63X magnification. Related to Figure 6A.
Figure 6—animation 2
Representative 3D rendering of confocal Z-stacks of control siRNA-transfected CD4+ T lymphocyte depicting actin polarity, upon 30 min of recombinant CCL19 treatment.
63X magnification. Related to Figure 6B.
Figure 6—animation 3
Representative 3D rendering of confocal Z-stacks of Piezo1 siRNA-transfected CD4+ T lymphocyte depicting loss of actin polarity, after 30 min of recombinant CCL19 treatment.
63X magnification. Related to Figure 6B.
Figure 6—animation 4
Representative time-lapse animation of Piezo1-mCherry/actin-GFP expressing Jurkat cell, moving on ICAM1-coated dish in the presence of recombinant human SDF1α.
Images were acquired as a Z-stack (1µm per stack) at 63X/1.40 oil magnification. Total duration of time-lapse was 5 min at 30 s per frame. Images are represented as maximum intensity projections of the Z stack. Related to Figure 6F.
Figure 7
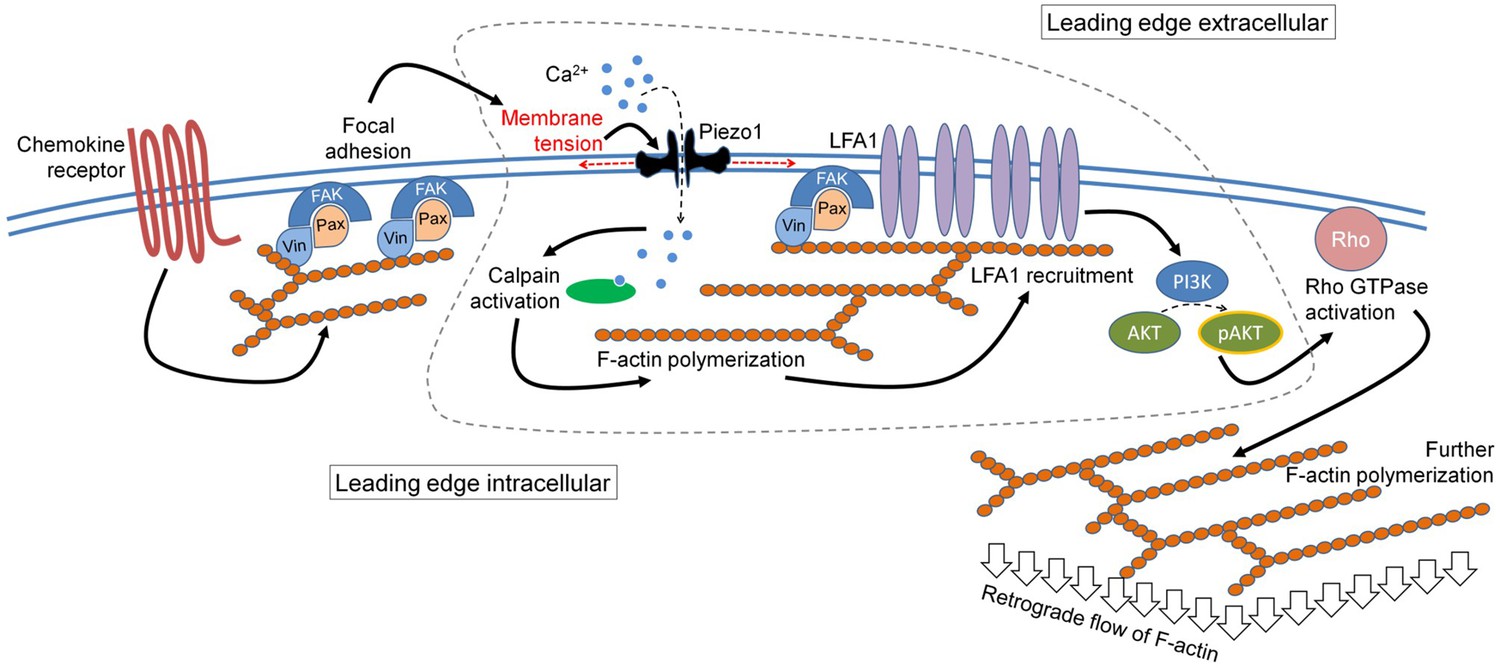
The mechanistic model depicting the involvement of Piezo1 mechanosensing in leading-edge events in a migrating T cell.
Proposed model suggests chemokine receptor activation in human T cells leads to focal adhesion kinase activation and focal adhesion formation. Focal adhesions lead to localized increase in membrane tension at the leading-edge plasma membrane which leads to Piezo1 recruitment and activation. Piezo1 activation leads to calpain activation which potentially drives further cytoskeletal consolidation to recruit integrin LFA1. LFA1 recruitment and activation lead to phosphorylation of AKT and downstream signaling eventually driving the retrograde actin flow in migrating human T cells.
Tables
Appendix 1—key resources table
| Reagent type (species) or resource | Designation | Source or reference | Identifiers | Additional information |
|---|---|---|---|---|
| Transfected construct (Homo sapiens) | Piezo1 mCherry; Piezo1-GFP plasmids | From Dr. Charles Cox at Victor Chang Cardiac Research Laboratory, Darlinghurst, Australia (Cox et al., 2016) | ||
| Transfected construct (Homo sapiens) | pCAG-mGFP-Actin plasmid | Addgene | Plasmid #21948, RRID:Addgene_21948 | |
| Antibody | Piezo1, Rabbit, polyclonal | Proteintech | Cat# 15939–1-AP, RRID:AB_2231460 | 5 µg/ml |
| Antibody | Paxillin, Mouse, Clone 5 H11 | Merck, Sigma Aldrich | Cat# 05–417, RRID:AB_309724 | 5 µg/ml |
| Antibody | phospho-FAK (Tyr 397), Rabbit, polyclonal | Santa Cruz | Cat# sc-11765-R, RRID:AB_653198 | 5 µg/ml |
| Antibody | phospho-Akt (Ser 473), Rabbit, polyclonal | Cell Signalling Technolgies | Cat# 9271, RRID:AB_329825 | 5 µg/ml |
| Antibody | Akt1, Goat, polyclonal | Santa Cruz | Cat# sc-1618, RRID:AB_630849 | 5 µg/ml |
| Antibody | anti-human APC CD44, Mouse, Clone G44-26 | BD Bioscience | Cat# 560890, RRID: AB_398683 | 5 µg/ml |
| Antibody | anti-human FITC CD11a/LFA-1, Mouse, Clone G43-25B | BD Pharmingen | Cat# 555379, RRID:AB_395780 | 5 µg/ml |
| Antibody | anti-mouse IgG Alexa Fluor488, Goat | Thermo Fisher, Invitrogen | Cat# A-11029, RRID:AB_2534088 | 1: 350 dilution |
| Antibody | anti-rabbit IgG Alexa Fluor 568, Goat | Thermo Fisher, Invitrogen | Cat# A-11036, RRID:AB_10563566 | 1: 350 dilution |
| Antibody | anti-goat IgG Alexa Fluor 647, Chicken | Thermo Fisher, Invitrogen | Cat# A-21469, RRID:AB_2535872 | 1: 350 dilution |
| Antibody | Human CD4 microbeads, T cells | Miltenyi Biotec | Cat# 130-097-048 | 1: 350 dilution |
| Peptide, recombinant protein | LifeAct Tag-GFP2 protein | Ibidi | Cat# 60112 | 0.5 µg/ml |
| Peptide, recombinant protein | Recombinant Human MIP-3β (CCL19) | Peprotech | Cat# 300-29B | 0.5 µg/ml |
| Peptide, recombinant protein | Recombinant Human ICAM-1 | Peprotech | Cat# 150–05 | 4 µg/ml |
| Peptide, recombinant protein | Recombinant Human SDF-1α (CXCL12) | Peprotech | Cat# 300–28 A | 0.1 µg/ml |
| Peptide, recombinant protein | Recombinant human fibronectin (RetroNectin) | Takara | Cat# T202 | 10 µg/ml |
| Chemical compound, drug | Calpain Inhibitor, PD 150606 | Merck, Sigma Aldrich | Cat# D5946 | 100 µM |
| Chemical compound, drug | FAK Inhibitor 14 | Merck, Sigma Aldrich | Cat# SML0837 | 10 µM |
| Peptide, recombinant protein | Piezo1 Inhibitor, GsMTx4 | Tocris | Cat# 4912 | 10 µM |
| Commercial assay or kit | Lonza P3 Primary Cell 4D-Nucleofector X Kit L | Lonza | Cat# V4XP-3024 | |
| Sequence-based reagent | Human Piezo1 Forward primer | IDT | 5’-CCC AAG TGG AGC TCA GGC CC-3’ | |
| Sequence-based reagent | Human Piezo1 Reverse primer | IDT | 5’-GGG CCA GGG ACA GGC AGA AG-3’ | |
| Sequence-based reagent | Human Piezo2 Forward primer | IDT | 5'-CAT CTA CAG ACT GGC CCA CCC G-3' | |
| Sequence-based reagent | Human Piezo2 Reverse primer | IDT | 5'-AGA GCA CAG TGA GGC GGT CA-3' | |
| Sequence-based reagent | Human 18 S primer | IDT | 5'-GTA ACC CGT TGA ACC CCA TT-3' | |
| Sequence-based reagent | Human 18 S primer | IDT | 5'-CCA TCC AAT CGG TAG TAG CG-3' | |
| Sequence-based reagent | EGFP control mission esiRNA | Merck, Sigma Aldrich | Cat# EHUEGFP | |
| Sequence-based reagent | Human Piezo1 mission esiRNA | Merck, Sigma Aldrich | Cat# EHU135531 | |
| Cell line (Homo sapiens) | Jurkat cell line | From Dr. Santusabuj Das at National Institute of Cholera and Enteric Diseases (NICED), Kolkata, India. ATCC | TIB-152 | |
| Other | Fluo-3, AM (Calcium indicator) | Thermo Fisher, Invitrogen | Cat# F1241 | |
| Other | Hoechst 33342 | Merck, Sigma Aldrich | Cat# 14533 | |
| Other | Cell Trace Violet | Thermo Fisher, Invitrogen | Cat# C34557 | |
| Other | Cell Trace CFSE | Thermo Fisher, Invitrogen | Cat# C34554 | |
| Other | Alexa Fluor 532 Phalloidin | Thermo Fisher, Invitrogen | Cat# A22282 | |
| Software, algorithm | Fiji | Open Source | https://fiji.sc/ | |
| Software, algorithm | MATLAB 2020b | IISER, Kolkata academic license |
Additional files
-
MDAR checklist
- https://cdn.elifesciences.org/articles/91903/elife-91903-mdarchecklist1-v1.docx
-
Source data 1
Source data ile 1 is an Excel file containing all data corresponding to each figure mentioned in the study.
- https://cdn.elifesciences.org/articles/91903/elife-91903-data1-v1.xlsx
-
Source code 1
Source code file 1 includes a zip file containing codes used in Fiji (.ijm files) and MATLAB (.m files) image analysis.
- https://cdn.elifesciences.org/articles/91903/elife-91903-code1-v1.zip
-
Supplementary file 1
Representative analyses for calculation of cell polarity of (A) Piezo1 (fixed); (B) Piezo1 mCherry (live); (C) phosphorylated FAK (pFAK, fixed cell); (D) paxillin (fixed cell); (E) CD11a/LFA1 (fixed cell); (F) actin (fixed cell).
Region-of-interest identifying cell boundary and polarity indices mentioned. All analyses were performed on Fiji (see methods).
- https://cdn.elifesciences.org/articles/91903/elife-91903-supp1-v1.zip
Download links
A two-part list of links to download the article, or parts of the article, in various formats.
Downloads (link to download the article as PDF)
Open citations (links to open the citations from this article in various online reference manager services)
Cite this article (links to download the citations from this article in formats compatible with various reference manager tools)
Piezo1 mechanosensing regulates integrin-dependent chemotactic migration in human T cells
eLife 12:RP91903.
https://doi.org/10.7554/eLife.91903.3


