Neural network emulation of the human ventricular cardiomyocyte action potential for more efficient computations in pharmacological studies
- Department of Mathematics and Scientific Computing, University of Graz, Austria
- NAWI Graz, University of Graz, Austria
- Gottfried Schatz Research Center for Cell Signaling, Metabolism and Aging - Division of Medical Physics and Biophysics, Medical University of Graz, Austria
- BioTechMed-Graz, Austria
- Department of Pharmacology and Pharmacotherapy, University of Szeged, Hungary
- HUN-REN-TKI, Research Group of Pharmacology, Hungary
- Centre for Mathematical Medicine & Biology, School of Mathematical Sciences, University of Nottingham, United Kingdom
- Division of Imaging Sciences & Biomedical Engineering, King’s College London, United Kingdom
Figures
Figure 1
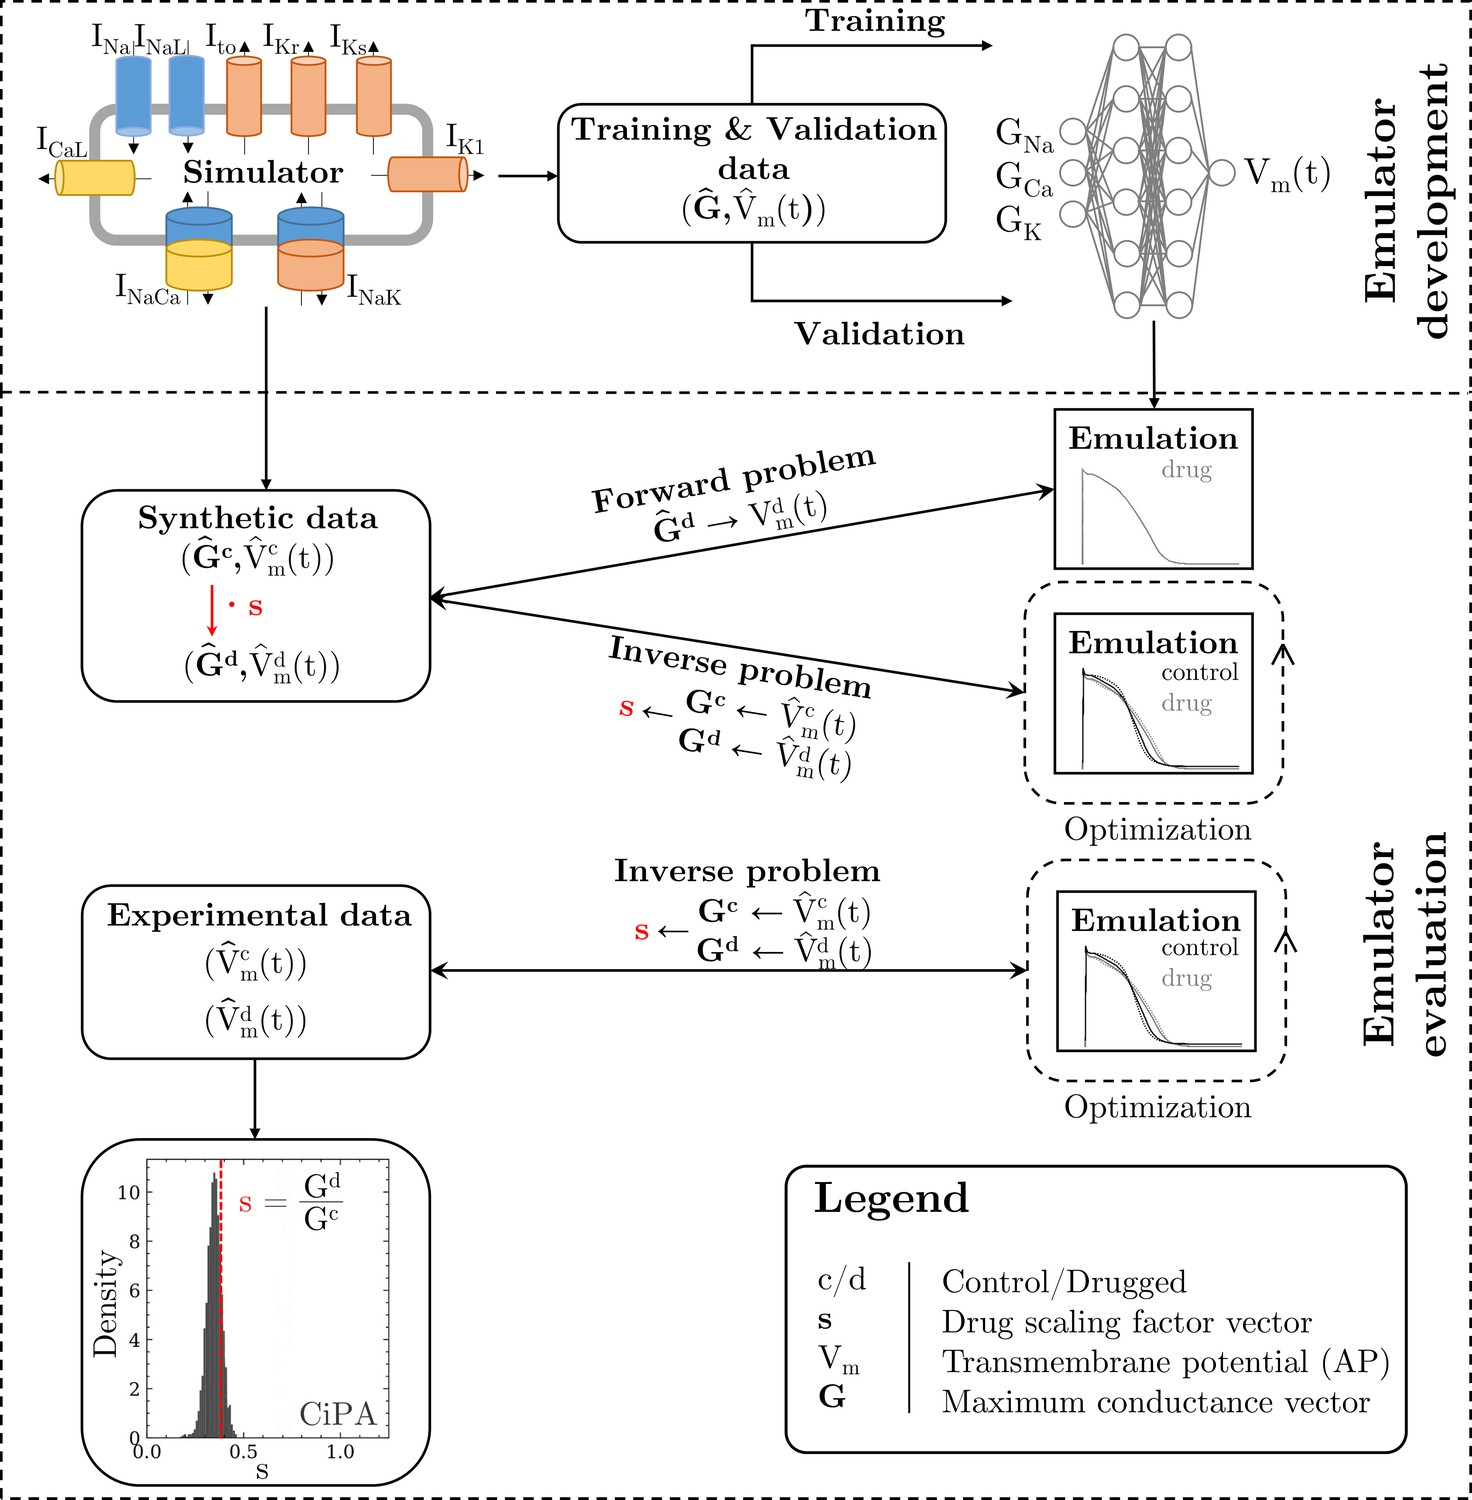
Methodology of this study including the emulator development and the evaluation.
The simulator is visualized by a schematic human ventricular cardiomyocyte that includes all currents considered for the emulator training. Inputs of the emulator (see Figure 3) are the corresponding maximum conductances () but for the sake of illustration, only three representatives are shown. Output is the AP (). Training and validation data (maximum conductances and APs ) were generated by the simulator. The evaluationwas performed for forward and inverse problems and to this end, the pharmacological parameter s was introduced. This describes the interaction between the drug and a given target and was defined as scaling factor of the respective maximum conductance in control conditions (s < 1:block, s=1:no effect, s > 1:enhancement). Synthetic data (control maximum conductances and drugged maximum conductances obtained through scaling, and control and drugged APs) and experimental data (control and drugged APs) were used for the evaluation (Orvos, 2019). The forward problem was only solved for whereas the inverse problem was solved for both synthetic and experimental data. When experimental data were used, estimated pharmacological parameters were compared to distributions derived from data published within the CiPA initiative (Chang et al., 2017; Li et al., 2017).
Figure 2
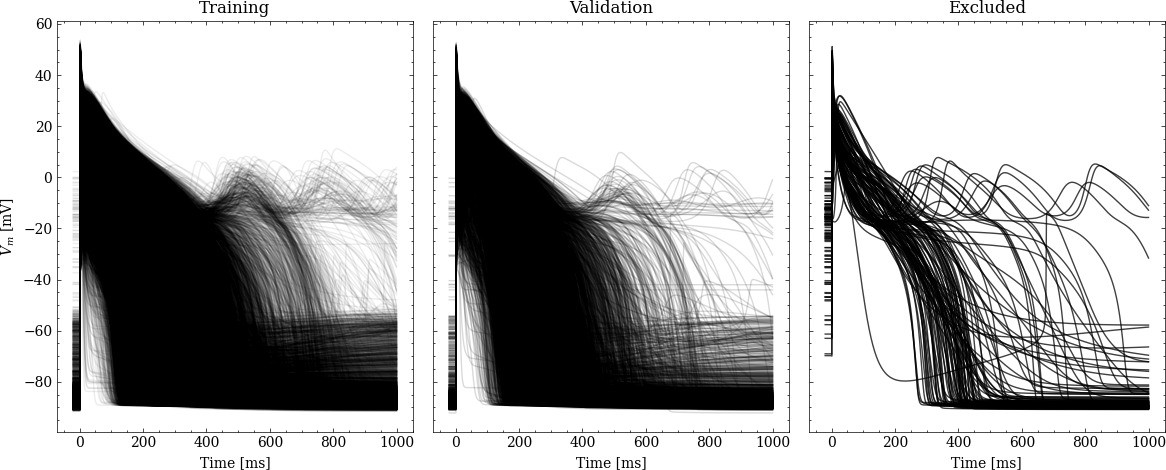
Processed APs used for training and validation (left and center).
Additionally we show the excluded APs on the right (see text for description of the exclusion criteria).
Figure 3
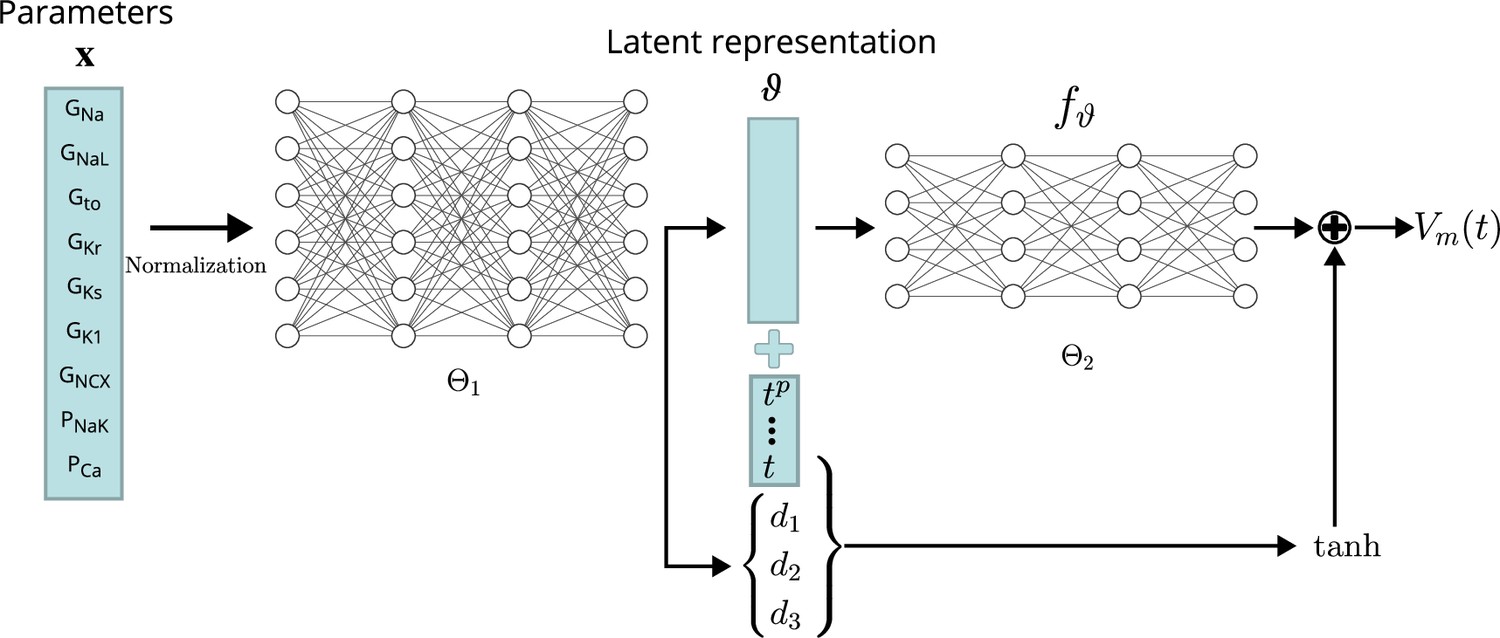
Conceptual architecture of the neural network emulator.
The maximum conductances are encoded into depolarization parameters di and a latent space representation that uniquely defines the time series functional . The time is normalized and encoded in polynomials up to degree 8 ( for ), before being appended to the latent code is then used in conjunction with the depolarization helper to approximate the AP .
Figure 4
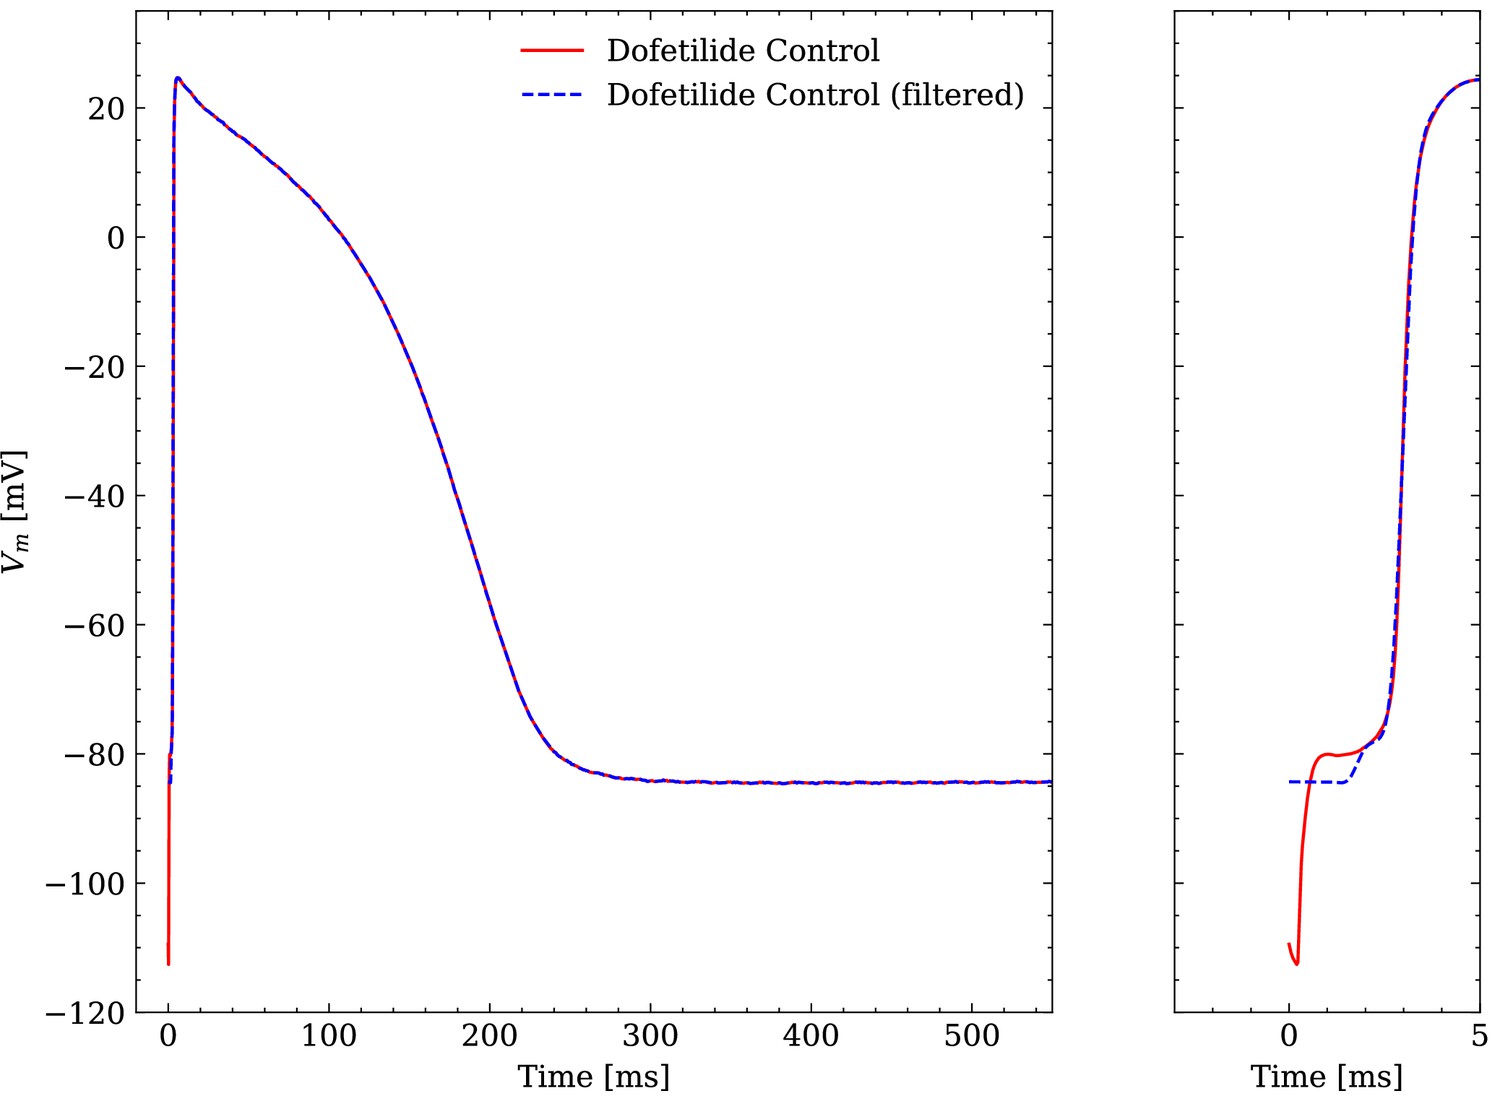
Comparison of an averaged raw and an averaged filtered experimental AP.
One dofetilide control AP is shown as example.
Figure 5
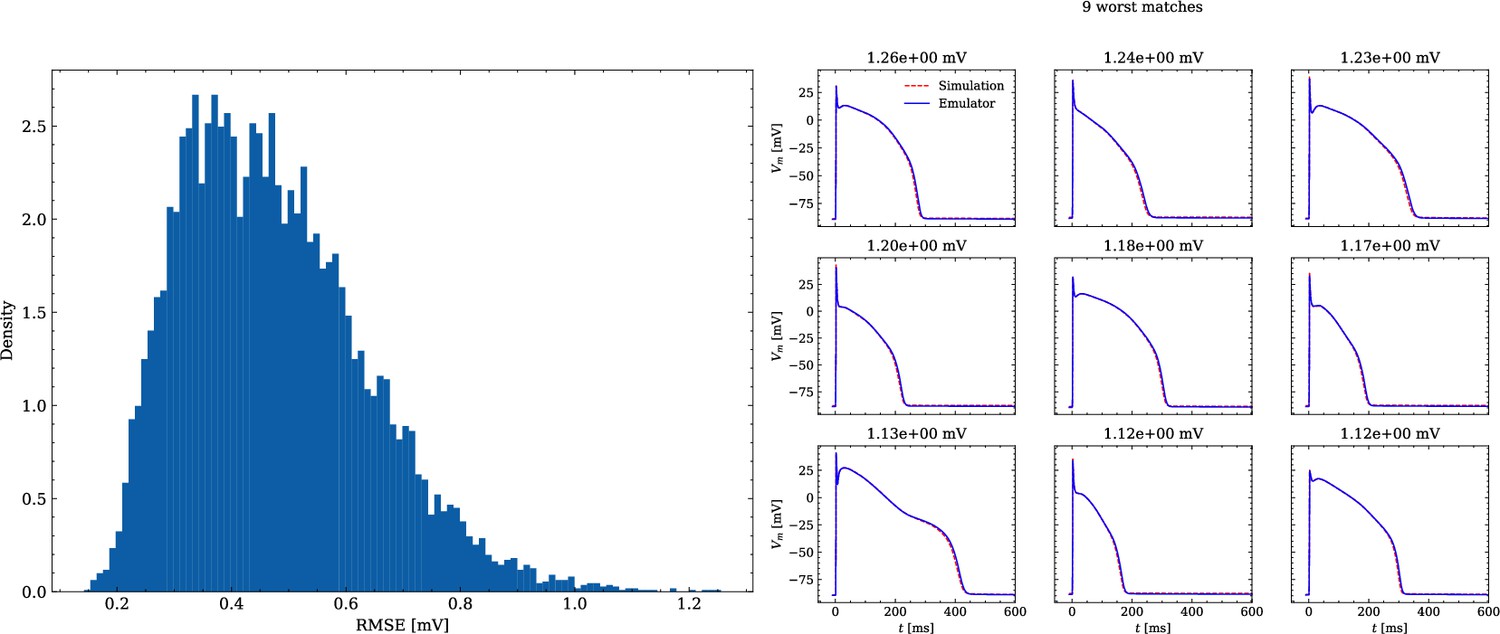
Analysis of solution accuracy of the forward problem on synthetic data including normal APs (drug data of data set #2).
Left: histogram of RMSEs for the APs, right: APs with the largest RMSEs. The RMSE is given above each subplot.
Figure 6
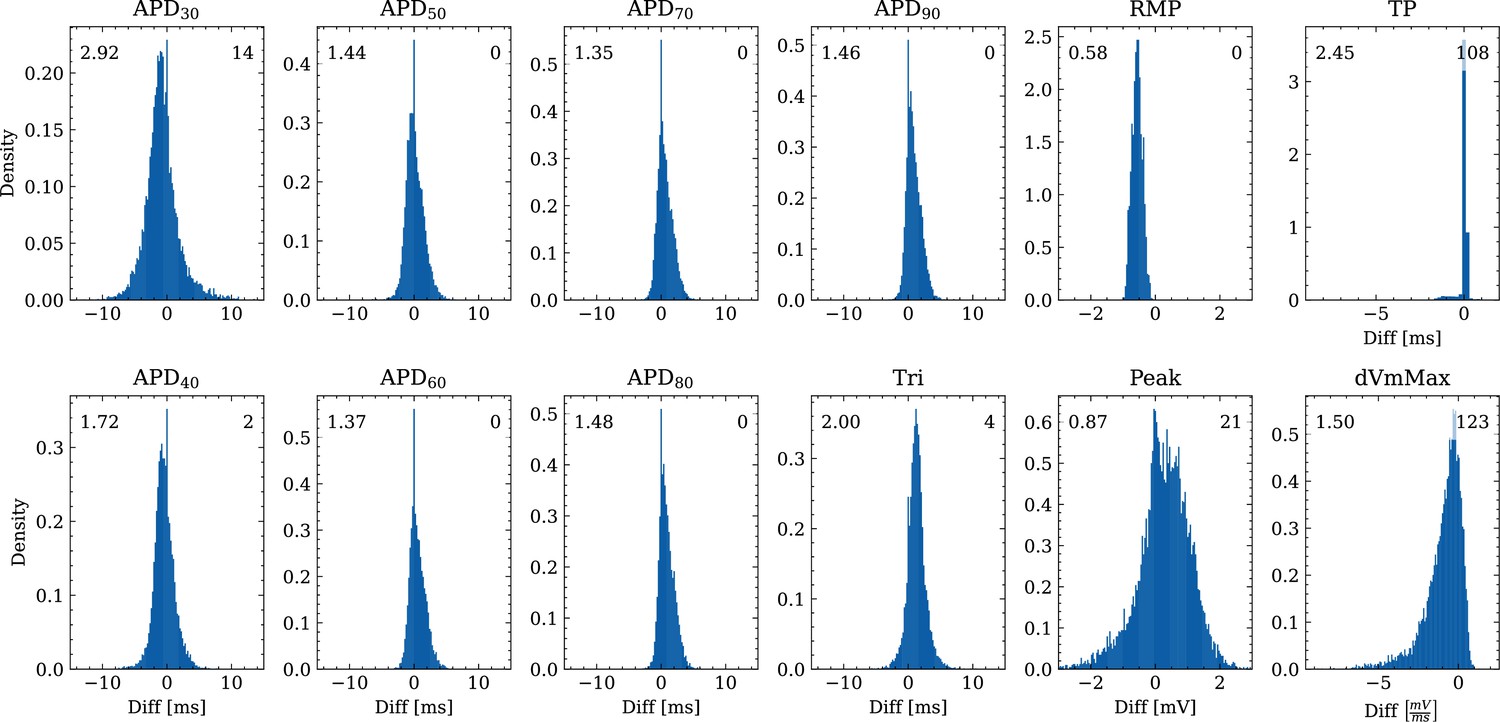
Analysis of solution accuracy of the forward problem on synthetic data including normal APs (drug data of data set #2) with respect to AP biomarkers.
Histograms of mismatches for each biomarker are shown and the RMSE is given in the upper left corner. The number in the right upper corner denotes the number of outliers of the 10,000 samples which lie outside the shown ranges.
Figure 7
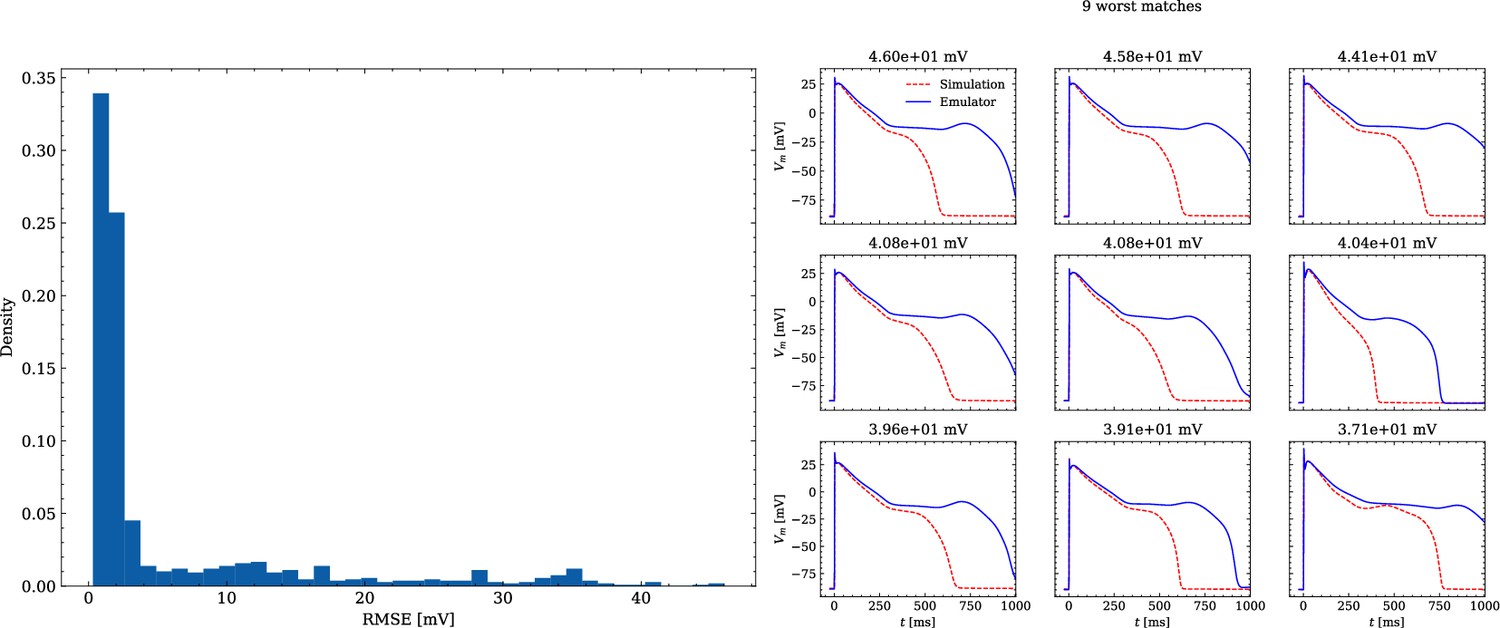
Analysis of solution accuracy of the forward problem on synthetic data including abnormal APs exhibiting EADs (subset of data set #3).
Left: histogram of RMSEs for the APs, right: APs with the largest RMSEs. Of the 171 emulated APs, 124 exhibit the expected EADs (based on the criterion outlined in Appendix 1). The RMSE is given above each subplot. All emulated APs are shown in Appendix 3.
Figure 8
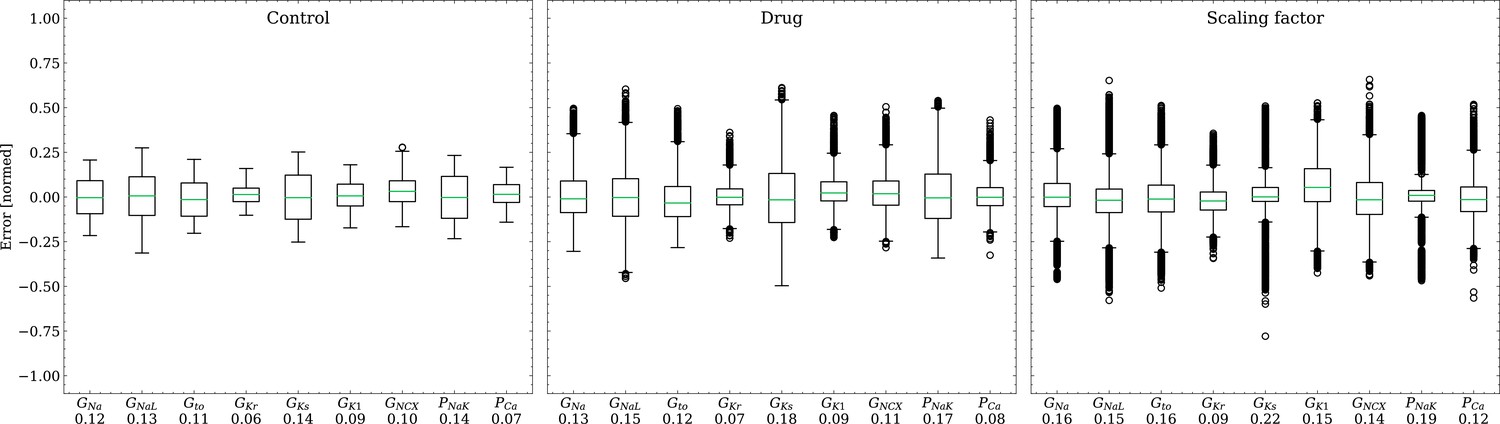
Analysis of solution accuracy of the inverse problem on synthetic data (data set #2).
Left: boxplot of errors between normalized estimated and ground truth control maximum conductances, middle: boxplot of errors between normalized estimated and ground truth drugged maximum conductances, right: boxplot of errors between estimated and ground truth pharmacological parameters. Error definitions are given in (4) and (5). The RMSE over all data is given below each parameter.
Figure 9
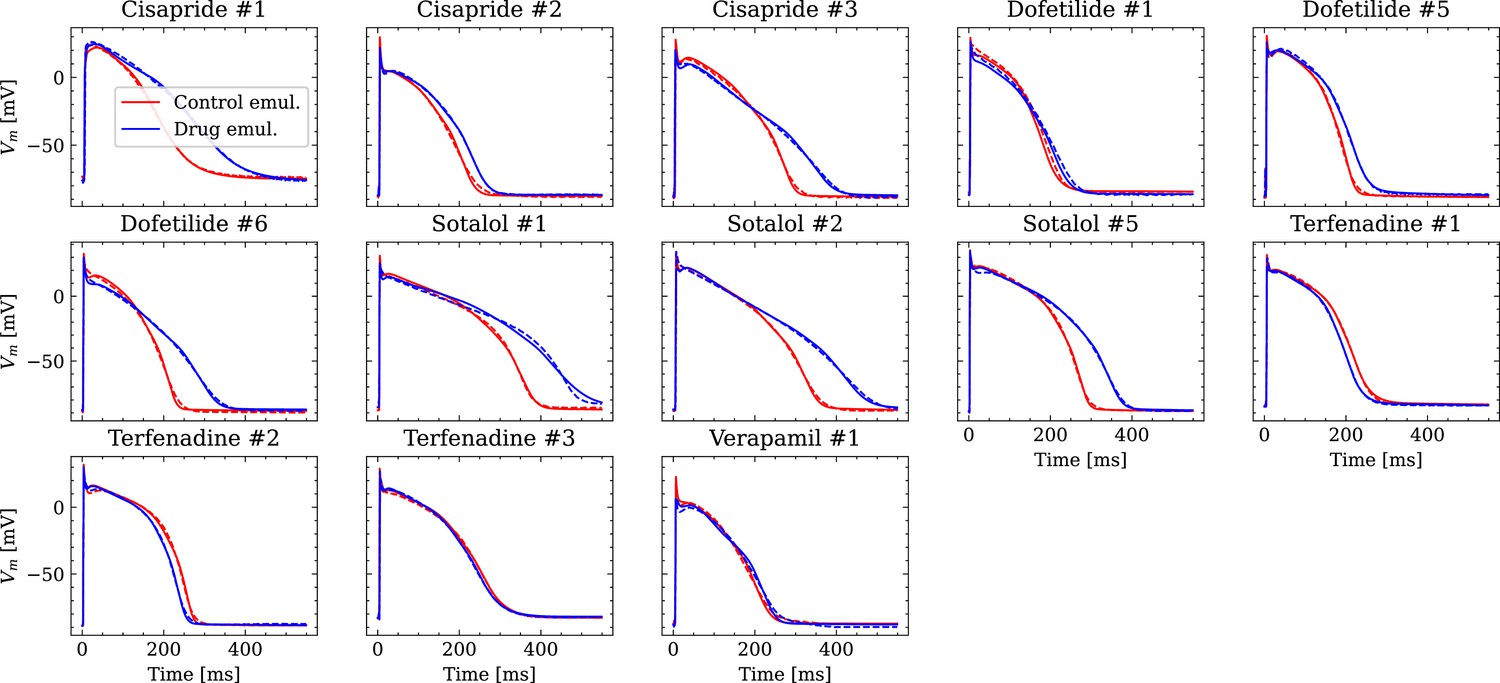
Analysis of fit quality of the inverse problem on experimental data.
Comparison of the fitted APs (solid lines) and the experimental APs (dashed lines) at control (red) and after drug administration (blue) for all drugs.
Figure 10
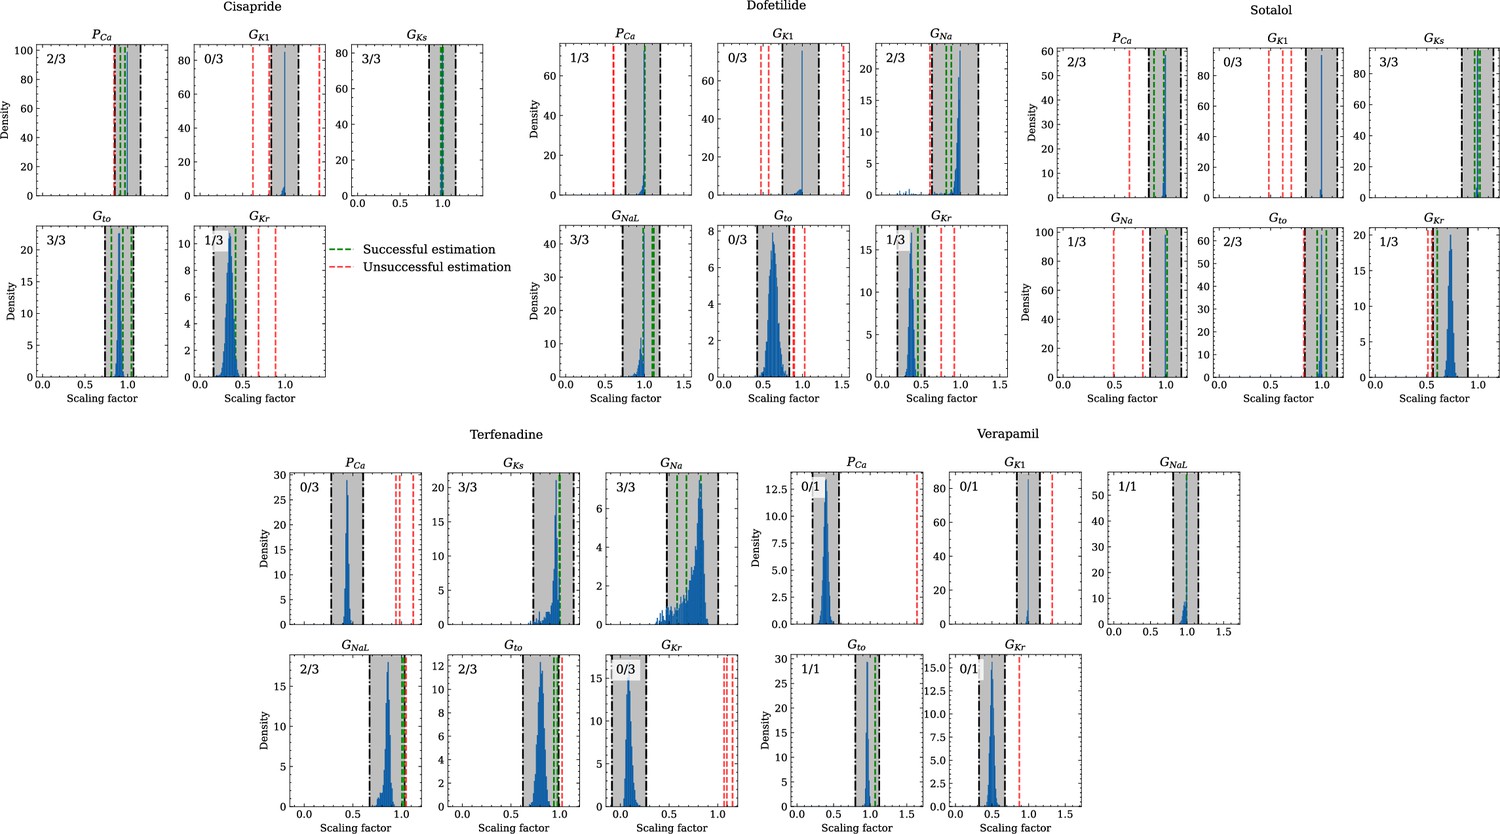
Analysis of solution accuracy of the inverse problem using experimental data.
The histograms compare the estimated pharmacological parameters (dashed vertical lines) from data of multiple preparations with the CiPA distributions (blue; see Inverse problem). The black dash dotted vertical lines are the borders of the range (grey) that was used to determine if the estimation of the given pharmacological parameter was successful. The range is spanned up by µ ± (0.15 + σ) of the CiPA distribution. Successfully estimated parameters are shown as green lines and unsuccessfully estimated parameters are shown as red lines. The number in the upper left corner indicates for how many preparations the parameters could be successfully estimated in relation to the total number of preparations for the given drug.
Appendix 2—figure 1
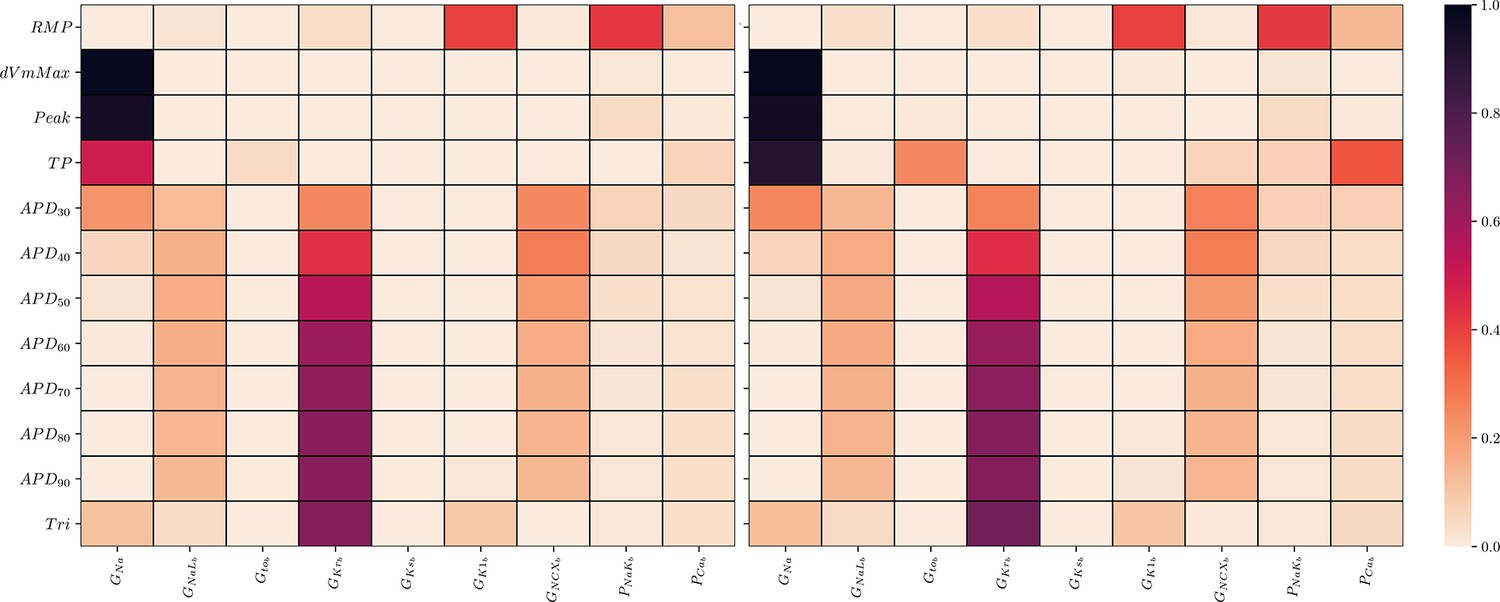
Global sensitivity analysis of the ToR-ORd simulator.
Sobol’ sensitivity indices are shown for each maximum conductance relative to each AP biomarker. Left: first-order (S1), right: total-effect (ST) Sobol’ sensitivity coefficient.
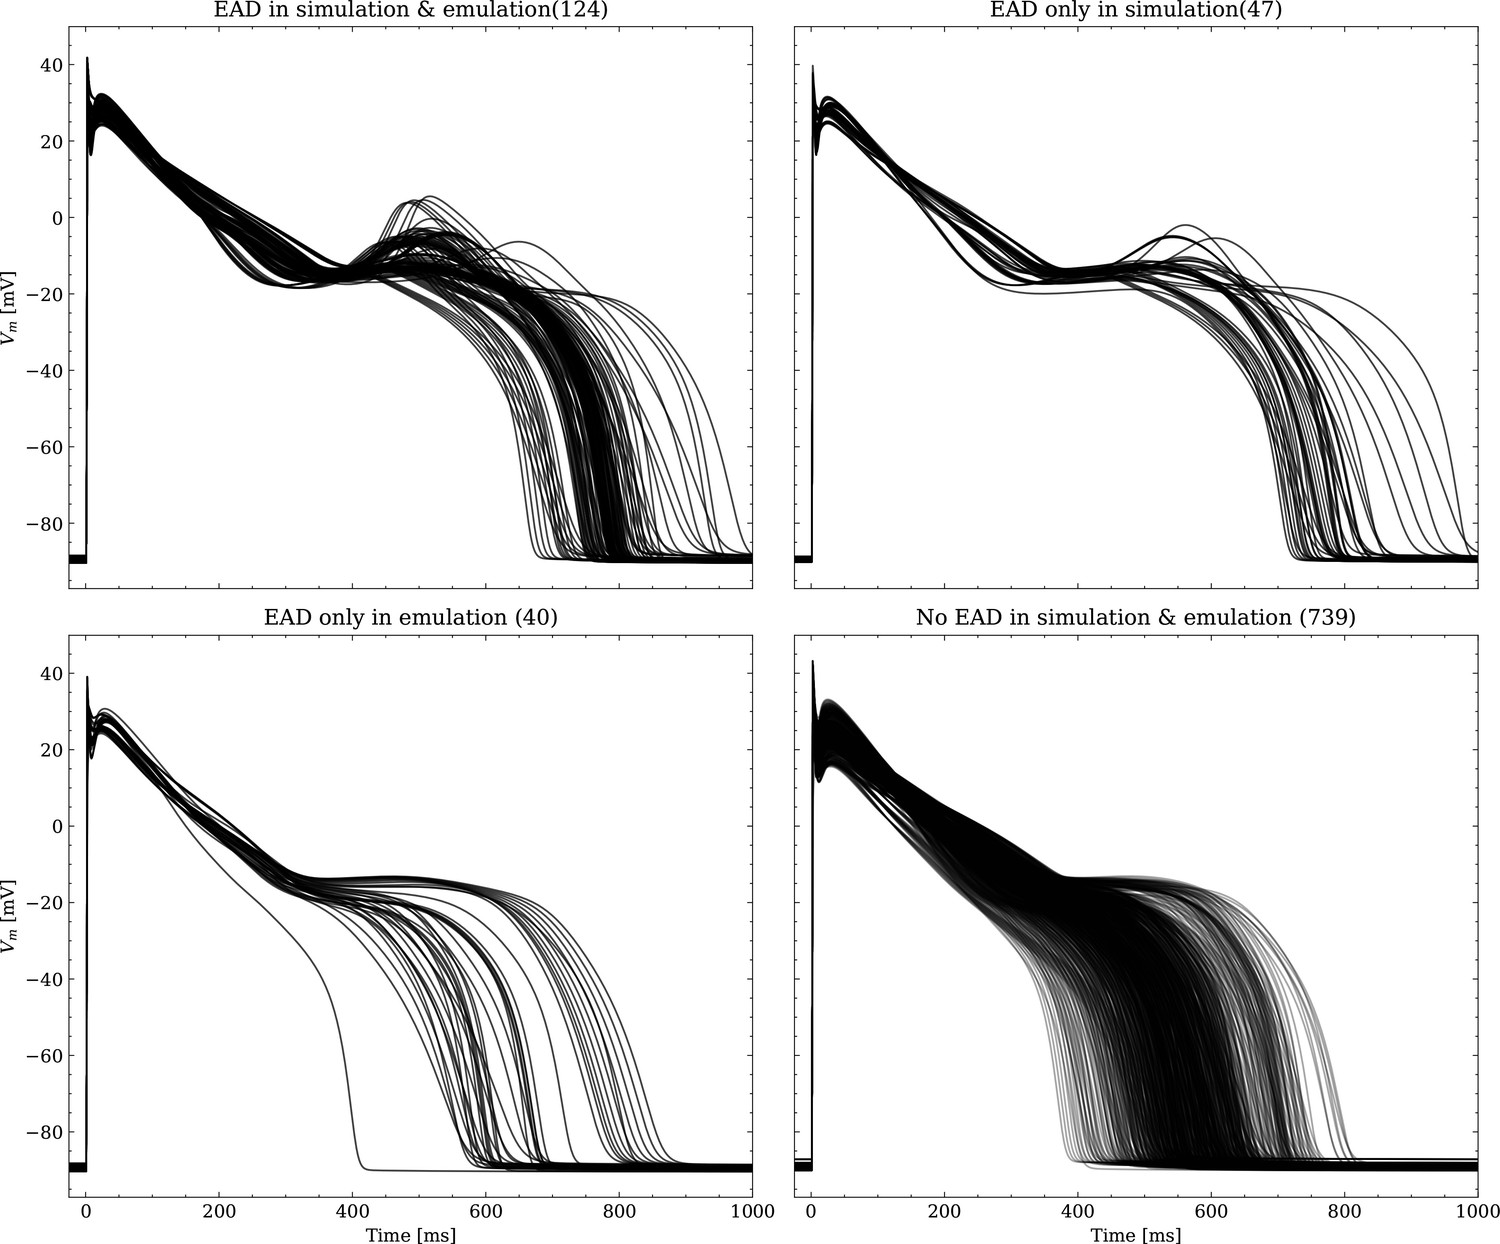
Appendix 3—figure 1
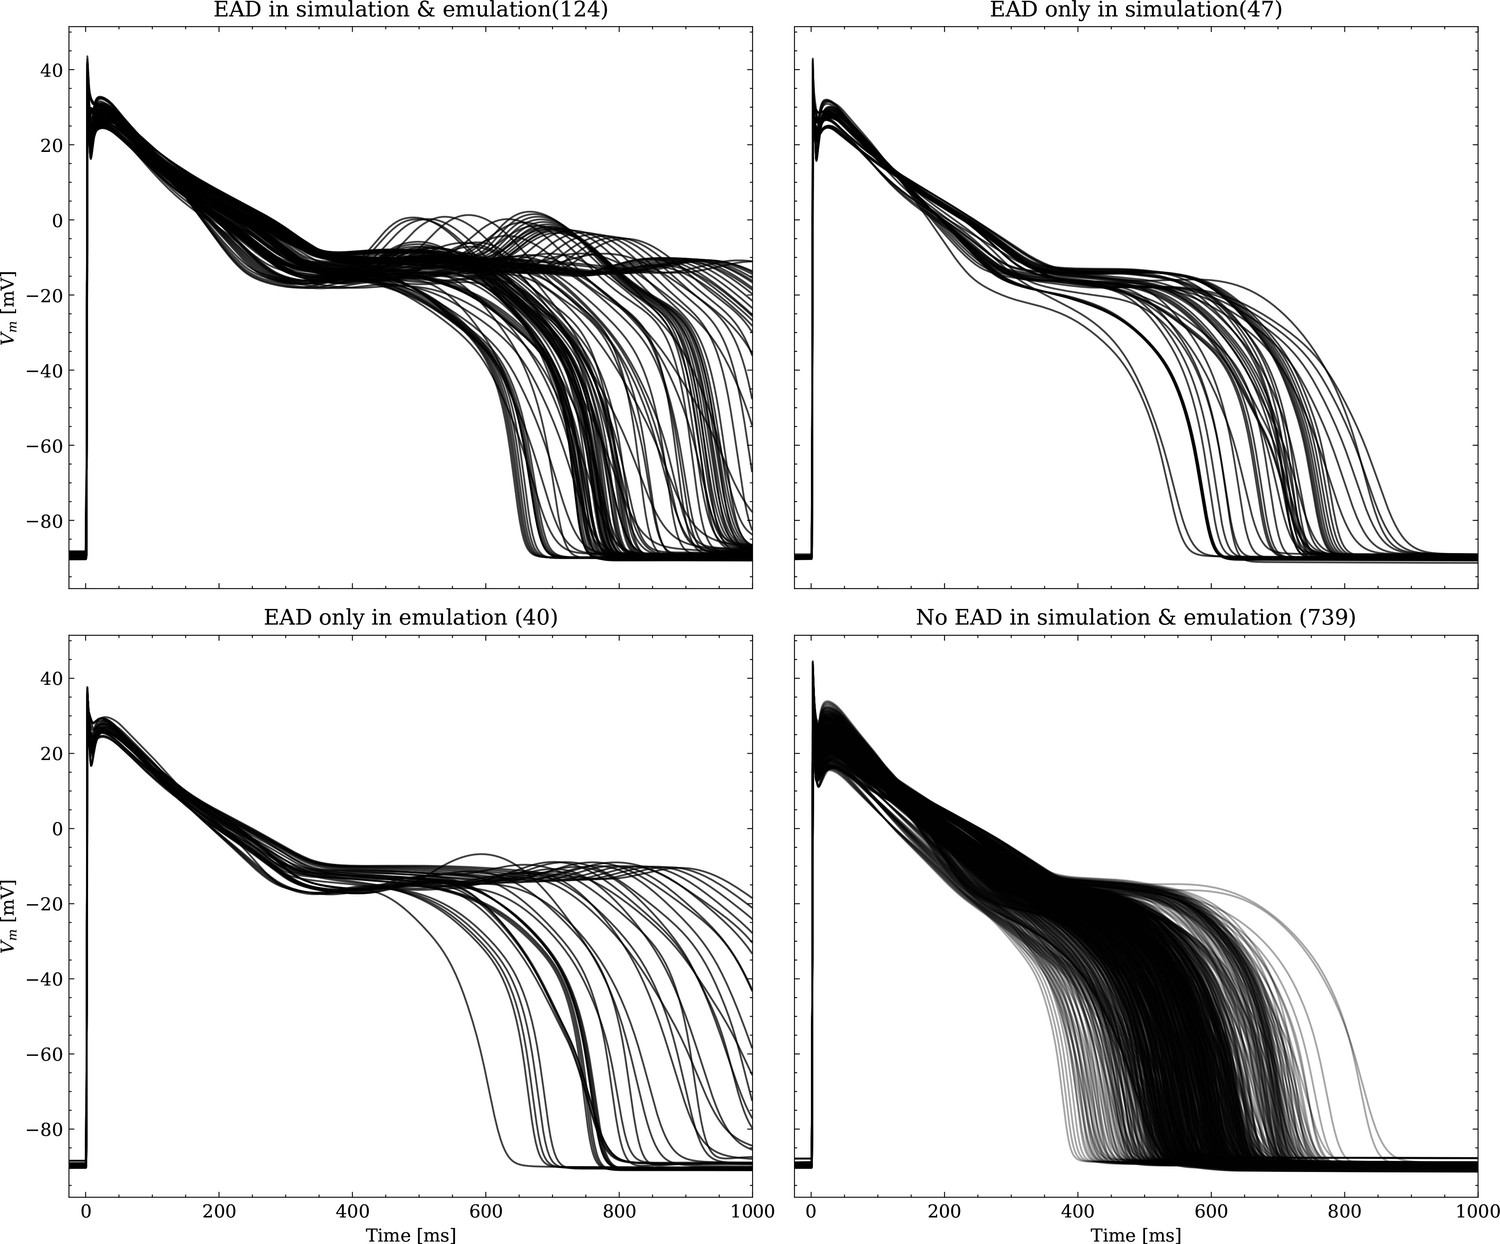
Emulated APs based on the pharmacological parameters of data set #3.
See also Forward problem and Figure 7. From left to right and top to bottom, the plot shows the true positive, false negative, false positive and true negative samples. The number next to the title specifies the number of samples belonging to each category. The classification criterion is outlined in Appendix 1.
Appendix 3—figure 2
Same as Figure 1, but showing the simulated APs.
Tables
Table 1
AP biomarkers and their experimental ranges used to generate the population of synthetic cardiomyocytes.
These were adopted from Passini et al., 2017. Experimental data were collected at 37°C in small right ventricular trabeculae and papillary tissue preparations obtained from healthy human hearts during pacing with a cycle length of (Britton et al., 2017; O’Hara et al., 2011).
| AP biomarker | Unit | Min | Max |
|---|---|---|---|
| mV | -95 | -80 | |
| mVms-1 | 100 | 1000 | |
| mV | 10 | 55 | |
| ms | 85 | 320 | |
| ms | 110 | 350 | |
| ms | 180 | 440 | |
| ms | 50 | 150 |
Table 2
Pharmacological parameter samples (synthetic drugs) with scaling factors for Gkr and Pca to generate the drug data of data set #3.
| ID | 1 | 2 | 3 | 4 | 5 | 6 | 7 | 8 | 9 | 10 |
|---|---|---|---|---|---|---|---|---|---|---|
| Gkr | 0.05 | 0.06 | 0.07 | 0.08 | 0.09 | 0.10 | 0.11 | 0.12 | 0.13 | 0.14 |
| Pca | 1.20 | 1.22 | 1.24 | 1.26 | 1.28 | 1.30 | 1.32 | 1.34 | 1.36 | 1.38 |
Table 3
Summary of the data used in this study, along with their usage and the number of valid samples.
Note that each AP is counted individually, also in cases of control/drug pairs.
| ID | Description | Usage | Origin | Samples |
|---|---|---|---|---|
| #1 | Training/validation data | Training and validating the emulator, choosing the best architecture (Architecture) | Simulation | 39,884 |
| #2 | Synthetic drug data, normal APs | Testing forward and inverse performance for normal APs (‘Forward problem’ and ‘Inverse problem based on synthetic data’) | Simulation | 104 |
| #3 | Synthetic drug data, including EAD APs | Testing forward performance of abnormal (EAD) APs (‘Forward problem’) | Simulation | 950 |
| #4 | Experimental cardiomyocytes | Testing and comparing the inverse performance with data published by the CiPA initiative (Li et al., 2017; Chang et al., 2017; ’Inverse problem based on experimental data’) | Orvos, 2019 | 26 |
Table 4
Average RMSE over control and drugged APs measured in all preparations per drug.
All values in mV.
| Drug | RMSE control | RMSE drug |
|---|---|---|
| Cisapride | 1.53 | 2 |
| Dofetilide | 2.05 | 1.73 |
| Sotalol | 1.4 | 2.51 |
| Terfenadine | 1.22 | 1.08 |
| Verapamil | 1.93 | 2.21 |
Table 5
Pharmacological parameters related to maximum conductances that were considered successfullyor unsuccessfully estimated across all preparations and drugs.
For each channel, the drugs are stated forwhich respective data from the CiPA initiative were available. C, D, S, T, V, A mark cisapride, dofetilide, sotalol,terfenadine, verapamil, all drugs respectively.
| Gna | GNaL | Gto | GKr | GKs | GK | PCa | Total | |
|---|---|---|---|---|---|---|---|---|
| Successful | 6 | 6 | 8 | 3 | 9 | 0 | 5 | 37 |
| Unsuccessful | 3 | 1 | 5 | 10 | 0 | 10 | 8 | 37 |
| Ratio | 0.67 | 0.86 | 0.62 | 0.23 | 1 | 0 | 0.38 | 0.5 |
Author response table 1
Summary of the data used in this study, along with their usage and the number of valid samples.
Note that each AP is counted individually, also in cases of control/drug pairs.
| ID | Description | Usage | Origin | Samples |
|---|---|---|---|---|
| #1 | Training/validation data | Training and validating the emulator, choosing the best architecture (Section ‘Architecture’) | Simulation | 39,884 |
| #2 | Synthetic drug data, normal APs | Testing forward and inverse performance for normal APs (Sections ‘Forward problem’ and ‘Inverse problem based on synthetic data’) | Simulation | 104 |
| #3 | Synthetic drug data, including EAD APs | Testing forward performance of abnormal (EAD) APs (‘Forward problem’) | Simulation | 950 |
| #4 | Experimental cardiomyocytes | Testing and comparing the inverse performance with data published by the CiPA initiative (Li et al.. 2017, Chang et al., 2017; Section ‘Inverse problem based onexperimental data’) | Orvos et al., 2019 | 26 |
Additional files
Download links
A two-part list of links to download the article, or parts of the article, in various formats.
Downloads (link to download the article as PDF)
Open citations (links to open the citations from this article in various online reference manager services)
Cite this article (links to download the citations from this article in formats compatible with various reference manager tools)
Neural network emulation of the human ventricular cardiomyocyte action potential for more efficient computations in pharmacological studies
eLife 12:RP91911.
https://doi.org/10.7554/eLife.91911.3


