Agent-based model demonstrates the impact of nonlinear, complex interactions between cytokines on muscle regeneration
- University of Virginia, United States
- Purdue University, United States
Figures
Figure 1 with 1 supplement
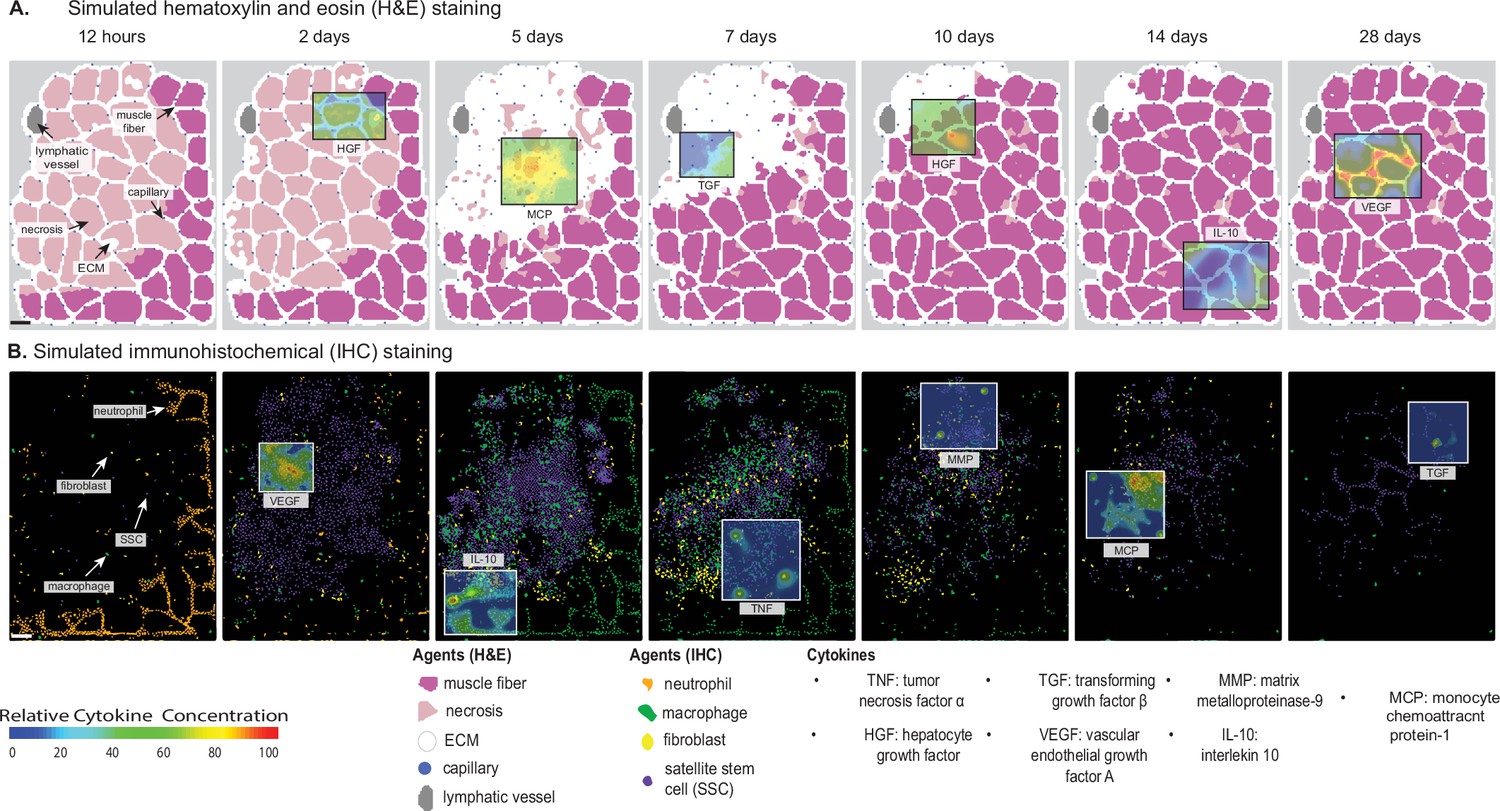
Overview of agent-based model (ABM) simulation of muscle regeneration following an acute injury.
(A) Simulated cross-sections of a muscle fascicle that was initially defined by spatial geometry from a histology image. Muscle injury was simulated by replacing a section of the healthy fibers with necrotic elements. In response to the injury, a variety of factors are secreted in the microenvironment which impacts the behavior of the cells. The colors correspond with those typically seen in H&E staining. (B) ABM screen captures show the spatial locations of the cells throughout the 28-day simulation. The agent colors were matched to those typically seen in IHC-stained muscle sections. Scale bar: 50 µm.
Figure 1—figure supplement 1
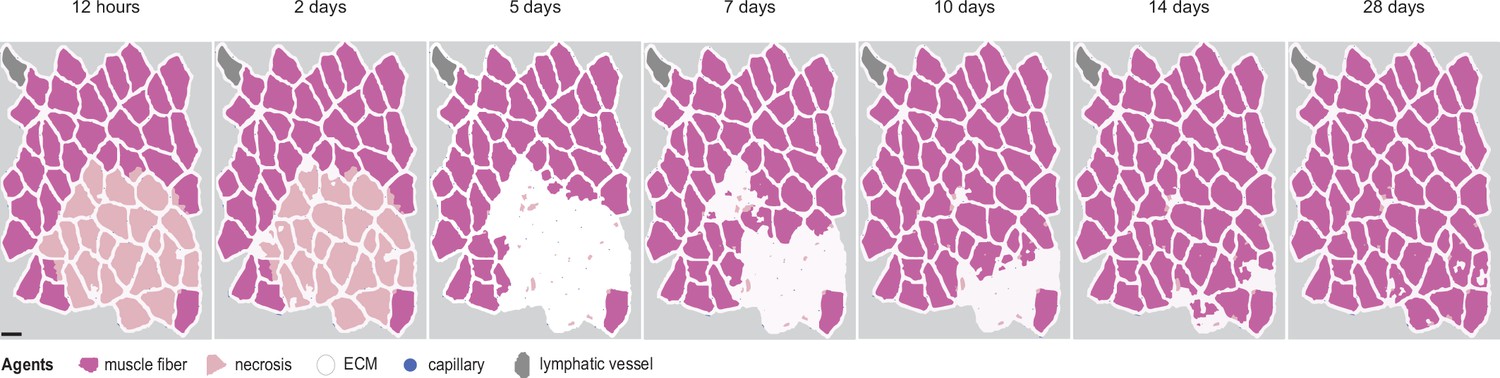
Overview of agent-based model (ABM) simulation with different initial histology configuration.
Scale bar: 50 µm.
Figure 2 with 1 supplement
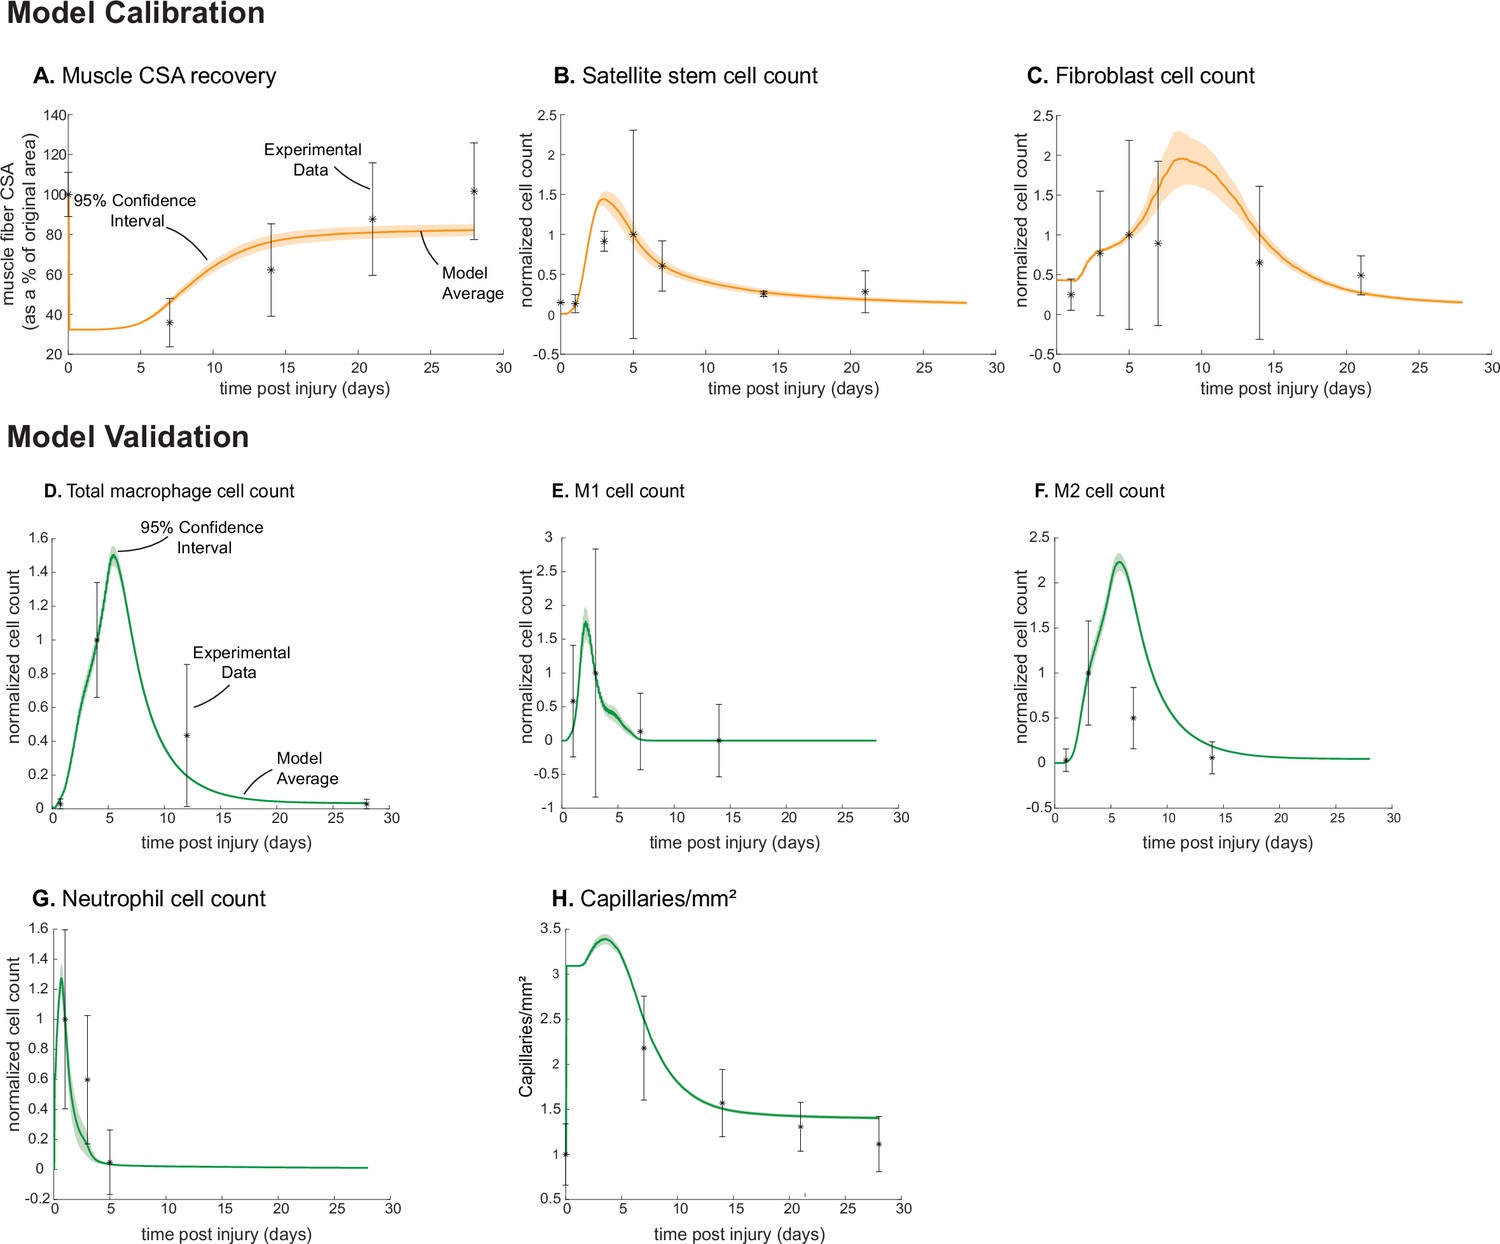
Agent-based model (ABM) calibration and validation.
ABM parameters were calibrated so that model outputs for cross-sectional area (CSA) recovery, satellite stem cell (SSC), and fibroblast counts were consistent with experimental data (A–C). (Murphy et al., 2011; Ochoa et al., 2007). Separate outputs from those used in calibration were compared to experimental data (Hardy et al., 2016; Ochoa et al., 2007; Wang et al., 2018; Nguyen et al., 2011) to validate the ABM (D–H). Error bars represent experimental standard deviation, and model 95% confidence interval is indicated by the shaded region. Cell count data were normalized by number of cells on the day of the experimental peak to allow for comparison between experiments and simulations.
Figure 2—figure supplement 1
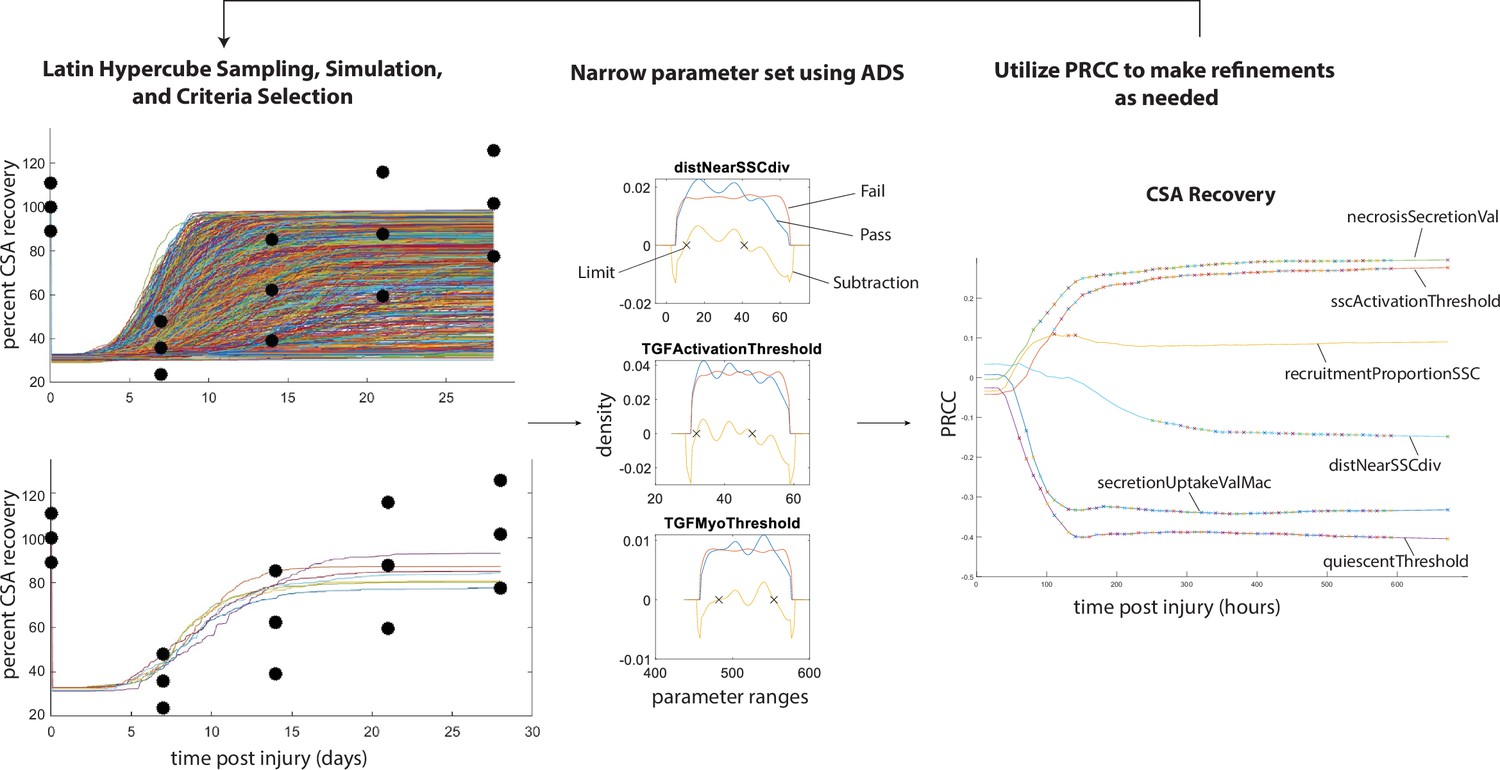
Overview of calibration methods.
Latin hypercube sampling is used to generate 600 unique parameter sets given starting bounds, each of which was run in triplicate. The simulations were filtered given specified criteria (i.e. fitting within experimental bounds for cross-sectional area [CSA] recovery) and then alternative density subtraction (ADS) was used to narrow in the parameter bounds. Partial rank correlation coefficient (PRCC) was used to gain insight into model sensitivity and adjust the bounds in case initial parameter bounds were too wide or too narrow. This method also allowed for model rule execution refinement to correct cases that interfere with the dynamics of other cell types.
Figure 3
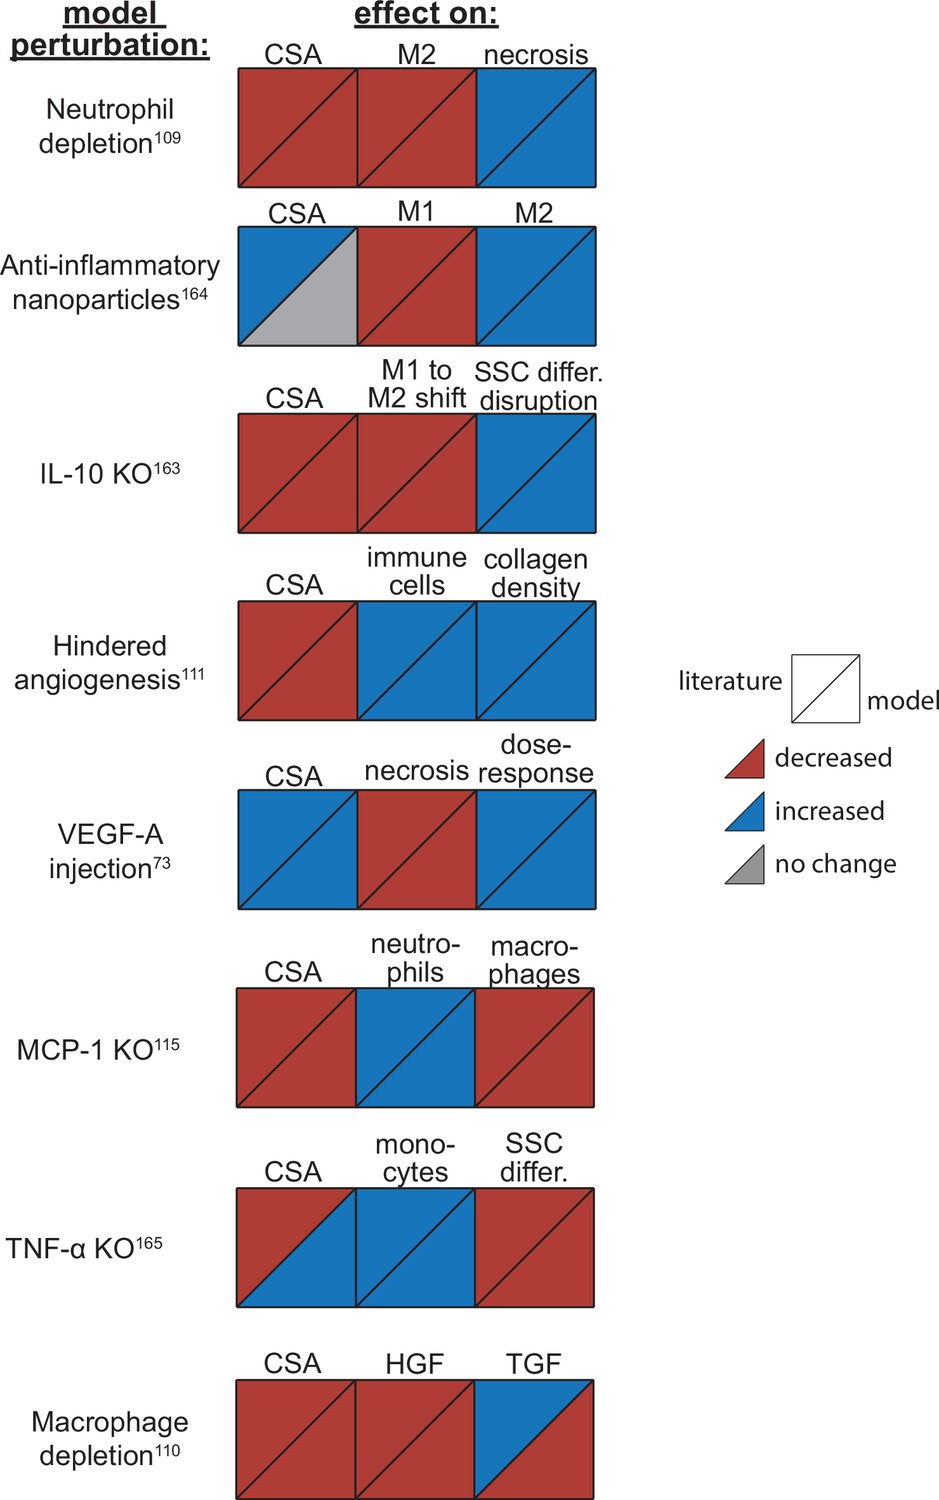
Agent-based model (ABM) perturbation outputs are compared to various literature experimental results.
Each perturbation model output is compared to the available corresponding published result. The top triangles indicate the literature findings and the bottom triangles indicate the model outputs. Red triangles represent a decrease, blue represents an increase, and gray represents no significant change. Timepoints of comparison were based on which timepoints were available from published experimental data. Refer to Table 8 for model input conditions and Supplementary file 7 for information on experimental references.
Figure 4
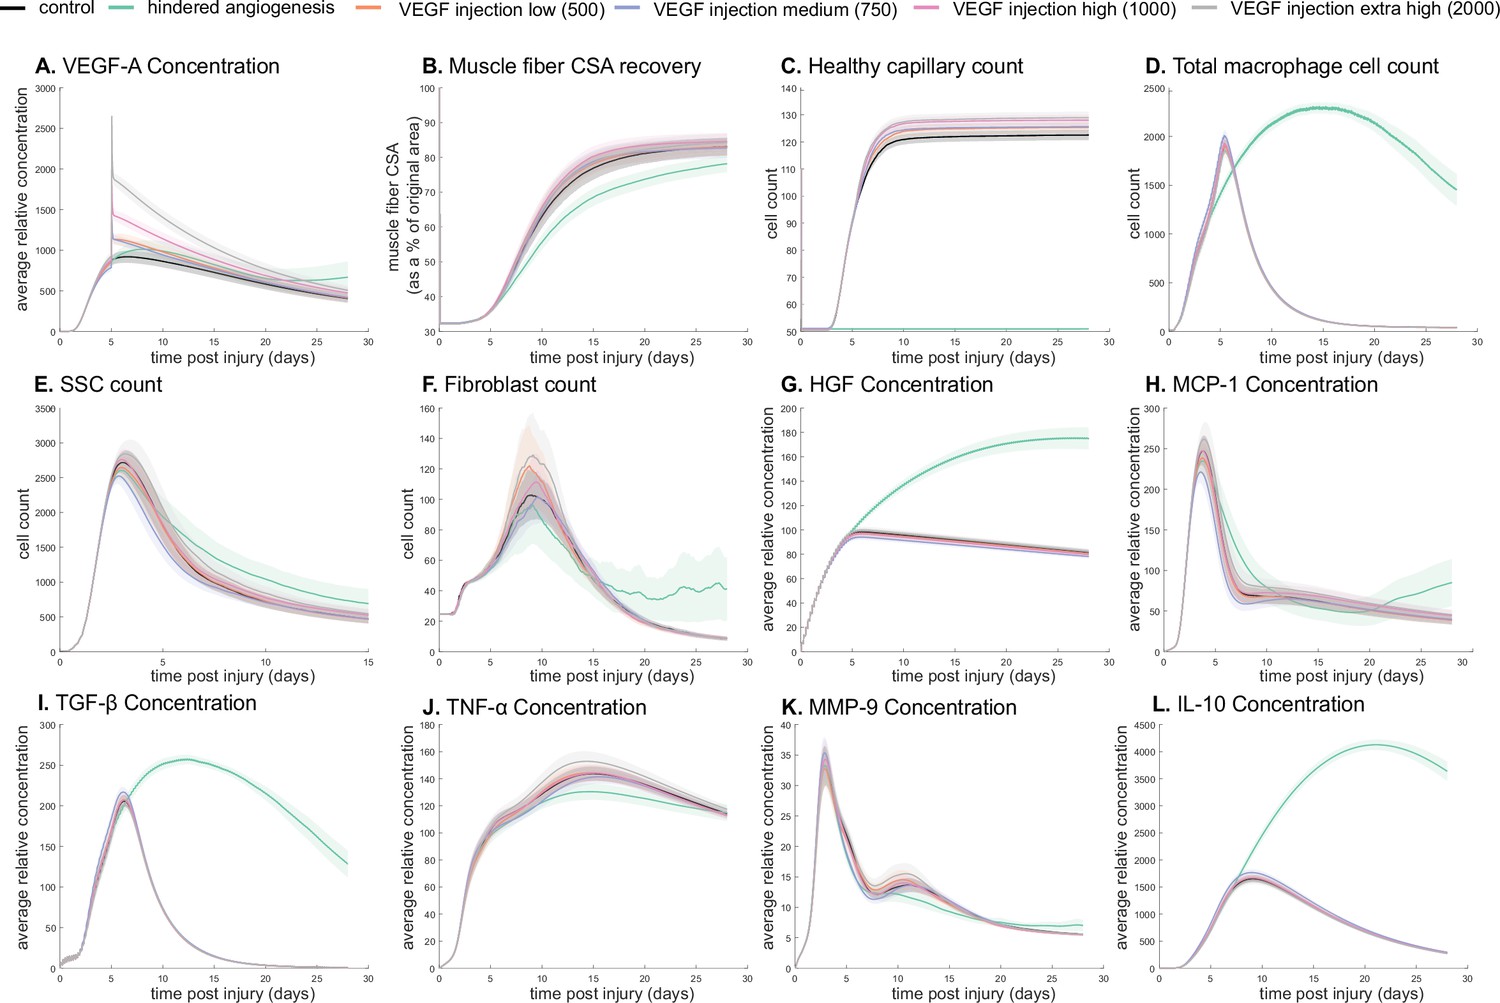
Dose-dependent response with vascular endothelial growth factor A (VEGF-A) injection compared to hindered angiogenesis.
VEGF-A concentration response to varied levels of VEGF injection (A). Hindered angiogenesis resulted in slower and overall decreased cross-sectional area (CSA) recovery (B). Capillary count was dependent on VEGF-A injection level (C). Total macrophage count was similar between control and VEGF-A injection perturbations but macrophage count was higher in later timepoints in the hindered angiogenesis simulation (D). Satellite stem cell (SSC) peak varied with VEGF-A injection level and counts were prolonged in the hindered angiogenesis simulations (E). The fibroblast peak was lower for the hindered angiogenesis perturbation and highest with the extra high VEGF-A injection. In contrast to the other simulations, the fibroblast count was trending upward at later timepoints in the hindered angiogenesis perturbation (F). Hepatocyte growth factor (HGF) levels were consistent between control and VEGF-A injection perturbations but was significantly elevated in the hindered angiogenesis perturbation (G). Monocyte chemoattractant protein-1 (MCP-1), transforming growth factor beta (TGF-β), and interleukin 10 (IL-10) concentrations were elevated at later stages of regeneration with hindered angiogenesis (H, I, L). Tumor necrosis factor alpha (TNF-α) was elevated with the extra high VEGF-A injection and lower with hindered angiogenesis (J). Matrix metalloproteinase-9 (MMP-9) concentration was lower at the simulation midpoint but elevated at late regeneration stages (K).
Figure 5
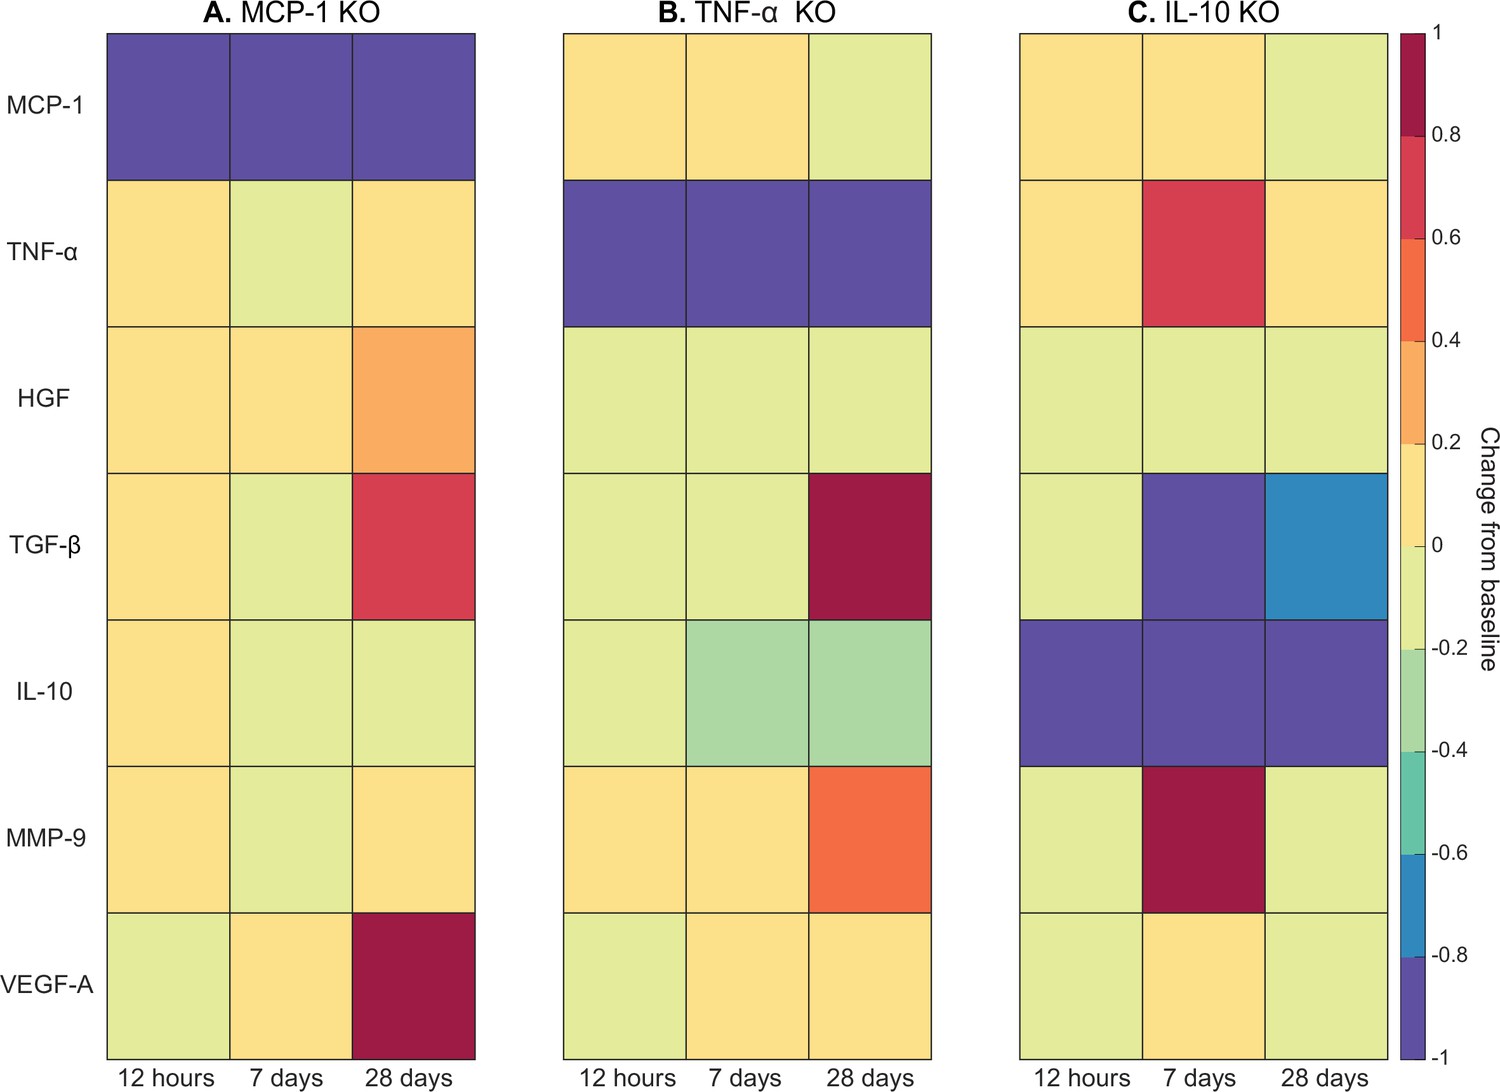
Heatmaps of changes in cytokine concentration at various timepoints throughout regeneration following individual cytokine knockout (KO) demonstrating cross-talk between cytokines.
With monocyte chemoattractant protein-1 (MCP-1) KO there was an increase in all cytokines except vascular endothelial growth factor A (VEGF-A) at 12 hr post injury. Over the course of regeneration there was continued increasing elevation of hepatocyte growth factor (HGF), increases in VEGF-A, and transforming growth factor beta (TGF-β) decreased at day 7 followed by a strong increase by day 28 post injury (A). In the tumor necrosis factor-alpha (TNF-α) KO simulations, there was an early decrease in TGF-β that shifts to strong increases by day 28. Matrix metalloproteinase-9 (MMP-9) increased throughout the duration, HGF and interleukin 10 (IL-10) were decreased, VEGF-A lagged in the beginning but was increased during mid to late timepoints (B). Following IL-10 KO there were increases in TNF-α, decreases in HGF and TGF-β, and elevated MMP-9 at day 7 that decreased by day 28 (C).
Figure 6 with 3 supplements
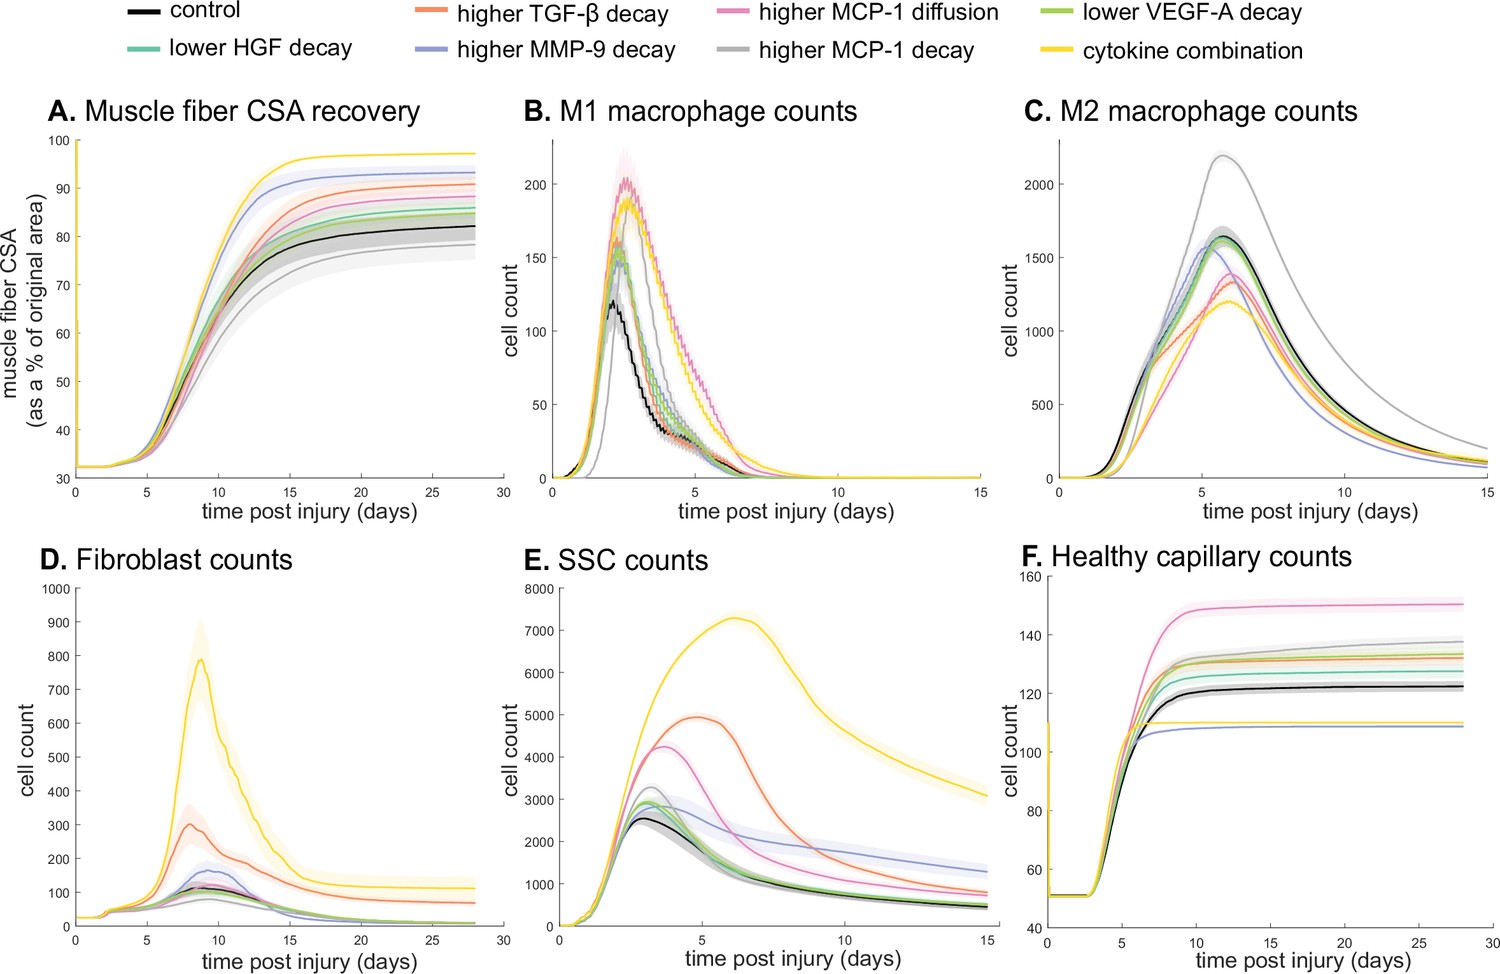
Combined alterations of various cytokine dynamics enhance muscle regeneration outcomes.
All tested alterations except higher monocyte chemoattractant protein-1 (MCP-1) decay resulted in higher cross-sectional area (CSA) recovery compared to the control (A). M1 cell count was higher for all perturbations with the highest peaks with increased MCP-1 diffusion and the combined cytokine alteration perturbation (B). Higher MCP-1 decay resulted in the largest M2 peak and higher MCP-1 diffusion, higher transforming growth factor beta (TGF-β) decay, and the combined cytokine alteration had a lower M2 peak than the control (C). Fibroblasts had the largest increase in cell count with the higher TGF-β decay and the cytokine combination perturbations (D). All perturbations resulted in an increased satellite stem cell (SSC) count with the largest increase resulting from the combined cytokine alteration (E). All perturbations except the combined and higher matrix metalloproteinase-9 (MMP-9) decay resulted in increased capillaries as a result of additional capillary sprouts (F).
Figure 6—figure supplement 1
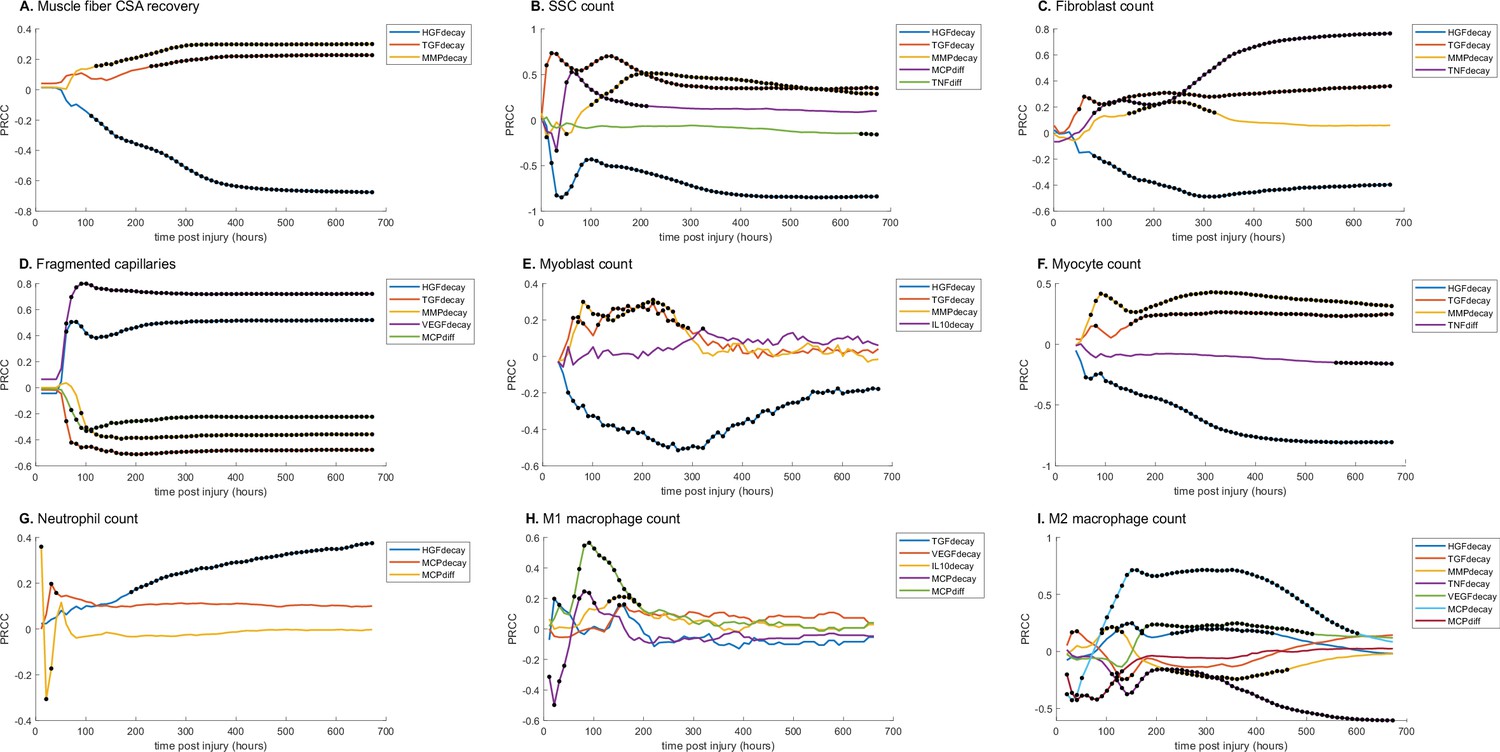
Partial rank correlation coefficient (PRCC) plots for various model outputs over time to illustrate how the significance of cytokine decay and diffusion parameters varies at different points throughout regeneration.
Black dots indicate statistically significant (p<0.05) correlation for that timepoint. (A) Cross-sectional area (CSA) recovery had correlations with hepatocyte growth factor (HGF), transforming growth factor beta (TGF-β), and matrix metalloproteinase-9 (MMP-9) decay. (B) Satellite stem cell (SSC) count was correlated with HGF, TGF-β, MMP-9 decay and MCP-1 and TND diffusion. (C) Fibroblast count was correlated with HGF, TGF-β, MMP-9, and tumor necrosis factor alpha (TNF-α) decay. (D) HGF, TGF-β, MMP-9, VGEF decay, and MCP-1 diffusion were correlated with the number of non-perfused capillaries. (E) Myoblast cell count was correlated with HGF, TGF-β, MMP-9, and interleukin 10 (IL-10) decay. (F) Myocyte cell count was correlated with HGF, TGF-β, and MMP-9 decay and TNF-α diffusion. (G) HGF and MCP-1 decay as well as MCP-1 diffusion were correlated with neutrophil count. (H) M1 macrophage cell count was correlated with TGF-β, vascular endothelial growth factor A (VEGF-A), IL-10, and MCP-1 decay and MCP-1 diffusion. (I) M2 macrophage count was correlated with HGF, TGF-β, MMP-9, TNF-α, VEGF-A, MCP-1 decay, and MCP-1 diffusion.
Figure 6—figure supplement 2
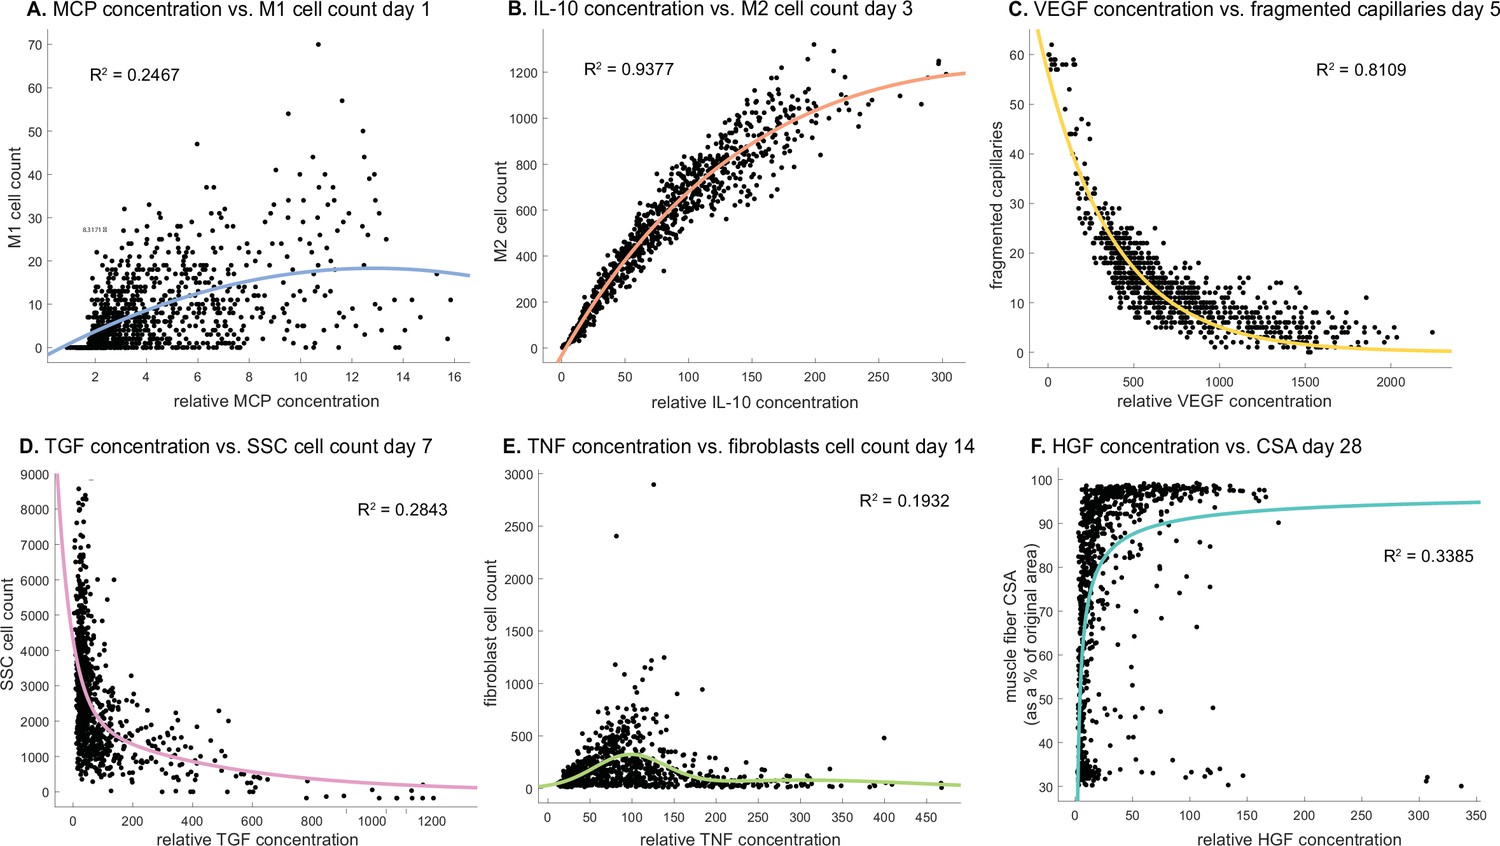
Cytokine concentrations are correlated with cell counts and recovery metrics at various stages of regeneration.
There is an optimal monocyte chemoattractant protein-1 (MCP-1) concentration that tends to result in higher M1 counts 1 day post injury (A). Interleukin 10 (IL-10) concentration is positively correlated with M2 count 3 days post injury (B). Vascular endothelial growth factor A (VEGF-A) concentration is negatively correlated with the number of fragmented (non-perfused) capillaries 5 days post injury (C). Higher transforming growth factor beta (TGF-β) concentrations tend to result in lower satellite stem cell (SSC) cell count 7 days post injury (D). Fibroblasts cell count is highest at an optimal tumor necrosis factor alpha (TNF-α) concentration with higher or lower levels hindering cell count 14 days post injury (E). Hepatocyte growth factor (HGF) concentration is positively correlated with cross-sectional area (CSA) recovery at day 28 post injury but there appears to be a threshold where high HGF is no longer correlated with increased recovery (F).
Figure 6—figure supplement 3

Non-perfused capillaries for each cytokine perturbation.
The combined cytokine perturbation had the lowest number of non-perfused capillaries and all other perturbations resulted in less non-perfused capillaries compared to the control.
Figure 7
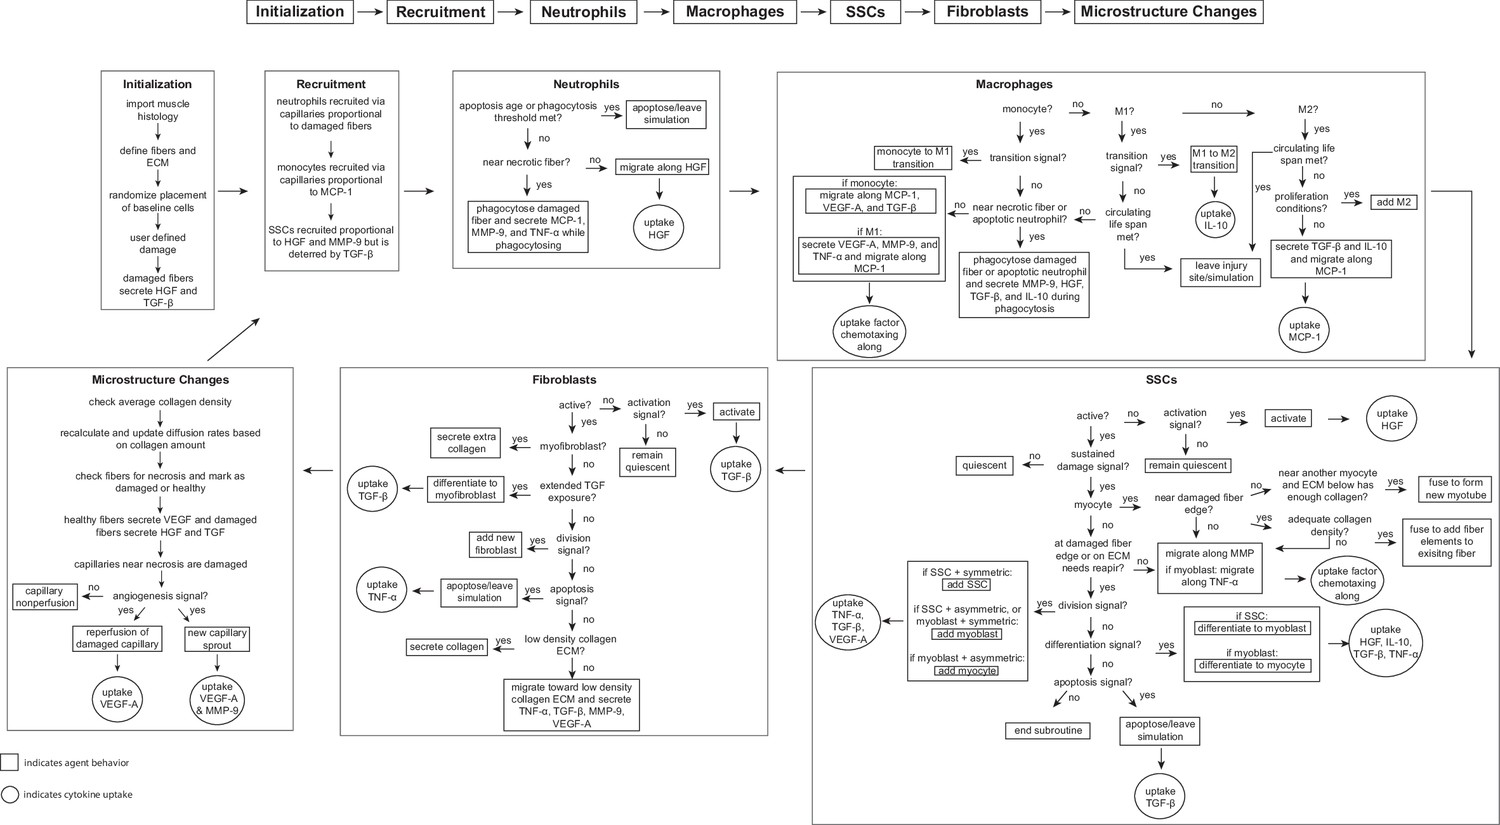
Flowchart of agent-based model (ABM) rules.
The model starts with initialization of the geometry and the prescribed injury. This is followed by recruitment of cells based on relative cytokine amounts within the microenvironment. The inflammatory cells, SSCs, and fibroblasts follow their literature-defined rules and probability-based decision tree to govern their behaviors. The boxes represent the behavior that the agent completes during that timestep given the appropriate conditions and the circles represent the uptake that occurs as a result of the simulated binding with microenvironmental factors for certain cell behaviors. ABM, agent-based model; SSC, satellite stem cell; ECM, extracellular matrix; TGF-β, transforming growth factor beta; HGF, hepatocyte growth factor; TNF-α, tumor necrosis factor alpha; VEGF-A, vascular endothelial growth factor A; MMP-9, matrix metalloproteinase-9; MCP-1, monocyte chemoattractant protein-1; IL-10; interleukin 10.
Tables
Table 1
Neutrophil agent rules.
| Neutrophil agent behavior | Sources |
|---|---|
| Recruitment signal: necrosis | Madaro and Bouché, 2014 |
| Neutrophils are brought to site of injury via capillaries | Wang et al., 2020 |
| Phagocytose necrosis | Butterfield et al., 2006 |
| Secretes MMP-9, MCP-1, TNF-α during phagocytosis | Martin et al., 2016; Madaro and Bouché, 2014; Wang, 2018; Soehnlein et al., 2008 |
| Undergoes apoptosis after phagocytosis or 12.5 hr | Fox et al., 2010 |
| Migrates toward areas of high HGF | Molnarfi et al., 2015 |
| Migration speed ~7.5 µm/min | Zhao et al., 2020; Heit et al., 2008 |
Table 2
Macrophage agent rules.
| Macrophage agent behavior | Sources |
|---|---|
| Initial count: 1 resident macrophage per 5 myofibers | Oishi and Manabe, 2018 |
| Recruitment signal: MCP-1 | Vogel et al., 2014; Chazaud et al., 2003 |
| Monocytes are brought to the site of injury via microvessels | Kratofil et al., 2017 |
| Resident macrophages secrete MMP-9, MCP-1, and TNF-α and chemotax along MCP-1 and HGF | Elkington et al., 2009; Chen and Nuñez, 2010; Lacy and Stow, 2011; Vogel et al., 2014; Molnarfi et al., 2015; Furrer and Handschin, 2017 |
| Monocytes chemotax along MCP-1, VEGF-A, and TGF-β | Chazaud et al., 2003; Owen and Mohamadzadeh, 2013; Reibman et al., 1991; Martin et al., 2017 |
| Monocyte migration speed ~4 µm/min | van den Bos et al., 2020 |
| M1 macrophages secrete VEGF-A, MMP-9, and TNF-α and chemotax along MCP-1 | Corliss et al., 2016; Newby, 2008; Lu et al., 2018; Cui et al., 2018 |
| Monocytes, resident, and M1 macrophages phagocytose apoptotic neutrophils and necrosis | Greenlee-Wacker, 2016; Watanabe et al., 2019; Uribe-Querol and Rosales, 2020 |
| Monocytes and macrophages secrete MMP-9, HGF, TGF-β, and IL-10 during phagocytosis | Martin et al., 2016; Yoon et al., 2016; D’Angelo et al., 2013; Popov et al., 2010; Arnold et al., 2007; Chung et al., 2007 |
| Monocyte transitions into M1 occurs when TNF-α threshold is met or based on literature means and standard deviation properties | Arnold et al., 2007; Mosser and Edwards, 2008 |
| M1 transition into M2 is mediated by the amount of IL-10 and the amount the M1 has phagocytosed | Martin et al., 2016; Arnold et al., 2007; Saini et al., 2016; Das et al., 2015 |
| M2 macrophages secrete TGF-β and IL-10 and chemotax along MCP-1 | Martin et al., 2016; Vogel et al., 2014; Arabpour et al., 2021; da Silva et al., 2015 |
| Macrophages can proliferate following the transition to the anti-inflammatory (M2) state | Arnold et al., 2007 |
| Macrophage migration speed ~0.62 µm/min | van den Bos et al., 2020 |
| Macrophages apoptose in a Poisson distribution | Moncayo, 2007 |
Table 3
SSC agent rules.
| SSC agent behavior | Sources |
|---|---|
| Initial count: 1 SSC per 4 fibers | Virgilio et al., 2018; Reimann et al., 2000 |
| Recruitment signal: HGF + MMP-9 - TGF-β | Virgilio et al., 2018; Kawamura et al., 2004; Wang et al., 2009; Allen and Boxhorn, 1989; González et al., 2017 |
| Activation signal: HGF | Virgilio et al., 2018; González et al., 2017; Allen et al., 1995; Miller et al., 2000; Tatsumi et al., 1998 |
| Activated SSCs secrete MCP-1 and VEGF-A | Chazaud et al., 2003 |
| Activated SSCs migrate toward areas of high MMP-9 | Wang et al., 2009; Chen and Li, 2009 |
| Myoblasts migrate toward high TNF-α | Torrente et al., 2003 |
| Division signal: TNF-α + VEGF-A - TGF-β | Virgilio et al., 2018; Allen and Boxhorn, 1989; Bakkar et al., 2008; Saclier et al., 2013 |
| Differentiation signal: 3*IL-10 - HGF - TNF-α - TGF-β | Virgilio et al., 2018; Saini et al., 2016; Perandini et al., 2018; Gal-Levi et al., 1998; Ten Broek et al., 2010 |
| Activated SSCs differentiate into myoblasts, myoblasts into myocytes, and myocytes into myotubes/myofibers | Cooper et al., 1999; Flamini et al., 2018; Bentzinger et al., 2012 |
| Differentiated myocytes fuse at damaged fiber edge or fuse together to form new, immature myotubes | Yin et al., 2013; Wang et al., 2014; Nguyen et al., 2019; Ruiz-Gómez et al., 2002 |
| 50% cell divisions are symmetric, 50% asymmetric | Virgilio et al., 2018; Kuang et al., 2007; Yennek et al., 2014 |
| Division probability decreases with each cell division; first division 85%; second 65%; third 20% | Virgilio et al., 2018; Siegel et al., 2011 |
| VEGF-A and macrophages nearby can block apoptosis | Chazaud et al., 2003; Arsic et al., 2004; Sonnet et al., 2006 |
| TGF-β triggers apoptosis | Cencetti et al., 2013 |
| Time to divide: 10 hr | Virgilio et al., 2018; Siegel et al., 2011; Rocheteau et al., 2012 |
| Migration speed ~0.94 µm/min | Otto et al., 2011 |
| Return activated SSCs to quiescence without sustained HGF | González et al., 2017 |
Table 4
Fibroblast agent rules.
| Fibroblast agent behavior | Sources |
|---|---|
| Initial count: 1 fibroblast per every 2 fibers | Virgilio et al., 2018; Murphy et al., 2011 |
| Activation signal: TGF-β | Gibb et al., 2020 |
| Fibroblasts move to low collagen ECM | Virgilio et al., 2018; Dickinson et al., 1994 |
| Fibroblasts secrete TNF-α, TGF-β, MMP-9, VEGF-A. Collagen is secreted at low-density ECM | Virgilio et al., 2018; Zou et al., 2008; Sanderson et al., 1986; Yokoyama et al., 1999; Skutek et al., 2001; Lindner et al., 2012; Newman et al., 2011 |
| Fibroblast division signaled by SSC division | Virgilio et al., 2018; Murphy et al., 2011 |
| Division probability decreases with each cell division; first division 100%; second 25%; third 6% | Alberts et al., 2002 |
| Fibroblast differentiation into myofibroblasts with extended TGF-β exposure | Virgilio et al., 2018; Desmoulière et al., 1993; Wipff et al., 2007 |
| Myofibroblasts secrete double the amount of collagen and secretion is not dependent on collagen density | Virgilio et al., 2018; Petrov et al., 2002 |
| Fibroblasts apoptose with sustained exposure to TNF-α | Virgilio et al., 2018; Lemos et al., 2015 |
| Fibroblast migration speed ~0.73 µm/min | Cornwell et al., 2004 |
| Sufficient TGF-β can block fibroblast apoptosis | Virgilio et al., 2018; Lemos et al., 2015 |
Table 5
Fiber agent rules.
| Fiber agent behavior | Sources |
|---|---|
| Damaged muscle fibers secrete HGF and TGF-β | Miller et al., 2000; Kim and Lee, 2017 |
| Healthy fibers secrete VEGF-A | Huey, 2018 |
| Fibers that are fully necrotic are fusion incompetent, but damaged fibers are fusion competent | Snijders et al., 2015 |
| Immature myotubes gain functional capacity as they fully mature over time | Nguyen et al., 2019; Abmayr and Pavlath, 2012; Isesele and Mazurak, 2021 |
Table 6
Microvasculature rules.
| Microvessel agent behavior | Sources |
|---|---|
| Initial count: ~4 capillaries per fiber, 1 lymphatic vessel per fascicle | Wickler, 1981; Gehlert et al., 2010 |
| Capillaries near necrosis will become damaged and unable to perfuse | Jacobsen et al., 2021 |
| With sufficient VEGF-A damaged capillaries will undergo angiogenesis | Frey et al., 2012 |
| MMP-9 is elevated during capillary growth | Haas et al., 2000; Qutub et al., 2009 |
| Increasing capillary-to-myofiber ratio during muscle regeneration from new sprouting capillaries at areas with enough MMP-9 and VEGF-A | Jacobsen et al., 2021; Hardy et al., 2016; Haas et al., 2000 |
| Cells and cytokines near lymphatic vessel will be drained via the vessel and removed from microenvironment | Hampton and Chtanova, 2019 |
Table 7
Model parameters of spatial mechanisms.
| Parameter | Value | Source/justification |
|---|---|---|
| Volume parameters | ||
| Target volume neutrophil | 12 | Chosen for an average cell diameter of 12 μm (Tigner et al., 2021) |
| Target volume SSC | 10 | Chosen for an average cell diameter of 10 μm (Garcia et al., 2018) |
| Target volume macrophage | 21 | Chosen for an average cell diameter of 21 μm (Krombach et al., 1997) |
| Target volume monocyte | 8.5 | Chosen for an average cell diameter of 8.5 μm (Downey et al., 1990) |
| Target volume fibroblast | 15 | Chosen for an average cell diameter of 15 μm (Freitas, 1999) |
| Volume multiplier | 50 | Volume constraint to maintain target (Swat et al., 2012) |
| Diffusion coefficients | ||
| HGF | 66.38 μm2/s | Estimated diffusivity within the ECM accounting for baseline GAGs and collagen (Filion and Popel, 2005) |
| MMP-9 | 63.40 μm2/s | |
| MCP-1 | 189.27 μm2/s | |
| VEGF-A | 112.10 μm2/s | |
| TGF-β | 90.33 μm2/s | |
| TNF-α | 138.95 μm2/s | |
| IL-10 | 135.17 μm2/s | |
| Chemotaxis parameters | ||
| Neutrophils | 750 | Chosen for a cell velocity between 1 and 20 µm/min (Zhao et al., 2020) |
| Macrophage | 9.3 | Chosen for a cell velocity around 0.62 µm/min (van den Bos et al., 2020) |
| Monocyte | 75 | Chosen for a cell velocity around 4 µm/min (van den Bos et al., 2020) |
| SSC | 11.3 | Chosen for a cell velocity around 0.94 µm/min (Otto et al., 2011) |
| Fibroblast | 23 | Chosen for a cell velocity around 0.73 µm/min (Westman et al., 2021) |
Table 8
Model perturbation input conditions and corresponding published experimental results.
| Perturbation | Specific model conditions | Published outcomes |
|---|---|---|
| IL-10 knockout | Adjust diffusion and decay parameters so IL-10 is removed from the system | Attenuates shift to M2, disrupted SSC differentiation, slowed regeneration (Deng et al., 2012) |
| Neutrophil depletion | Lower neutrophil recruitment proportion | Abundant necrotic tissue 7 days post injury (Teixeira et al., 2003) |
| Macrophage depletion | Lower macrophage recruitment proportion | Decreased HGF, increased TGF-β and TNF-α, impaired regeneration (Liu et al., 2017) |
| MCP-1 knockout | Adjust diffusion and decay parameters so MCP-1 is removed from the system | Increased necrosis at day 7, lower CSA at day 21, impaired phagocytosis (Lu et al., 2011) |
| Directed M2 polarization (anti-inflammatory nanoparticles) | Require less phagocytosis and IL-10 for transition | Improved muscle histology and inflammatory resolution (Raimondo and Mooney, 2018) |
| TNF-α knockout | Adjust diffusion and decay parameters so TNF-α is removed from the system | Impaired recovery at days 5 and 12, increased inflammation (Chen et al., 2005) |
| Hindered angiogenesis | Increase VEGF-A and MMP-9 threshold required for angiogenesis | Delayed regeneration with toxin injury, and persistent immune cell infiltration with freeze injury (Hardy et al., 2019) |
| VEGF-A injection | Add VEGF-A at specified concentration (100 for low and 1000 relative concentration for high), radius (300 pixels), and timepoint (5 days post injury) | Lower injury area at day 20 post injury with injection 5 days after damage (Arsic et al., 2004) |
Table 9
Summary of cytokine sensitivity analysis.
Significance was determined with α=0.05, and a Bonferroni correction for the number of tests. + and - represent statistically significant positive and negative correlations, respectively.
| CSA | SSC | Fibroblasts | Non-perfused capillaries | Myoblasts | Myocytes | Neutrophils | M1 | M2 | |
|---|---|---|---|---|---|---|---|---|---|
| Day | 16.7 | 6.3 | 10.5 | 8.4 | 6.3 | 8.4 | 8.4 | 4.2 | 6.3 |
| HGF decay | - | - | - | + | - | - | + | + | |
| TGF-β decay | + | + | + | - | + | - | |||
| MMP-9 decay | + | + | + | - | + | + | |||
| TNF-α decay | + | - | |||||||
| VEGF-A decay | + | ||||||||
| MCP-1 decay | + | + | |||||||
| MCP-1 diffusion | + | - | + |
Additional files
-
Supplementary file 1
Unknown model parameters calibrated using Latin hypercube sampling (LHS) to recapitulate published literature.
- https://cdn.elifesciences.org/articles/91924/elife-91924-supp1-v2.docx
-
Supplementary file 2
Cytokine perturbations based on partial rank correlation coefficient (PRCC).
- https://cdn.elifesciences.org/articles/91924/elife-91924-supp2-v2.docx
-
Supplementary file 3
Cellular-Potts model (CPM) mathematical implementation.
- https://cdn.elifesciences.org/articles/91924/elife-91924-supp3-v2.docx
-
Supplementary file 4
Cellular-Potts model (CPM) agent adhesion parameters.
- https://cdn.elifesciences.org/articles/91924/elife-91924-supp4-v2.docx
-
Supplementary file 5
Cellular-Potts model (CPM) initialization model parameters.
- https://cdn.elifesciences.org/articles/91924/elife-91924-supp5-v2.docx
-
Supplementary file 6
Criteria utilized for CaliPro model calibration.
- https://cdn.elifesciences.org/articles/91924/elife-91924-supp6-v2.docx
-
Supplementary file 7
Experimental data description for model comparison.
- https://cdn.elifesciences.org/articles/91924/elife-91924-supp7-v2.docx
-
MDAR checklist
- https://cdn.elifesciences.org/articles/91924/elife-91924-mdarchecklist1-v2.pdf
Download links
A two-part list of links to download the article, or parts of the article, in various formats.
Downloads (link to download the article as PDF)
Open citations (links to open the citations from this article in various online reference manager services)
Cite this article (links to download the citations from this article in formats compatible with various reference manager tools)
Agent-based model demonstrates the impact of nonlinear, complex interactions between cytokines on muscle regeneration
eLife 13:RP91924.
https://doi.org/10.7554/eLife.91924.3


