ESAT-6 undergoes self-association at phagosomal pH and an ESAT-6-specific nanobody restricts M. tuberculosis growth in macrophages
- Department of Molecular Microbiology and Immunology, Oregon Health & Sciences University, United States
- Department of Chemical Physiology and Biochemistry, Oregon Health & Science University, United States
- Department of Biochemistry and Microbiology, University of Victoria, Canada
- Program in Cellular and Molecular Medicine, Boston Children's Hospital, Harvard Medical School, United States
- Department of Biochemistry and Molecular Biology, The University of British Columbia, Canada
Figures
Figure 1 with 2 supplements
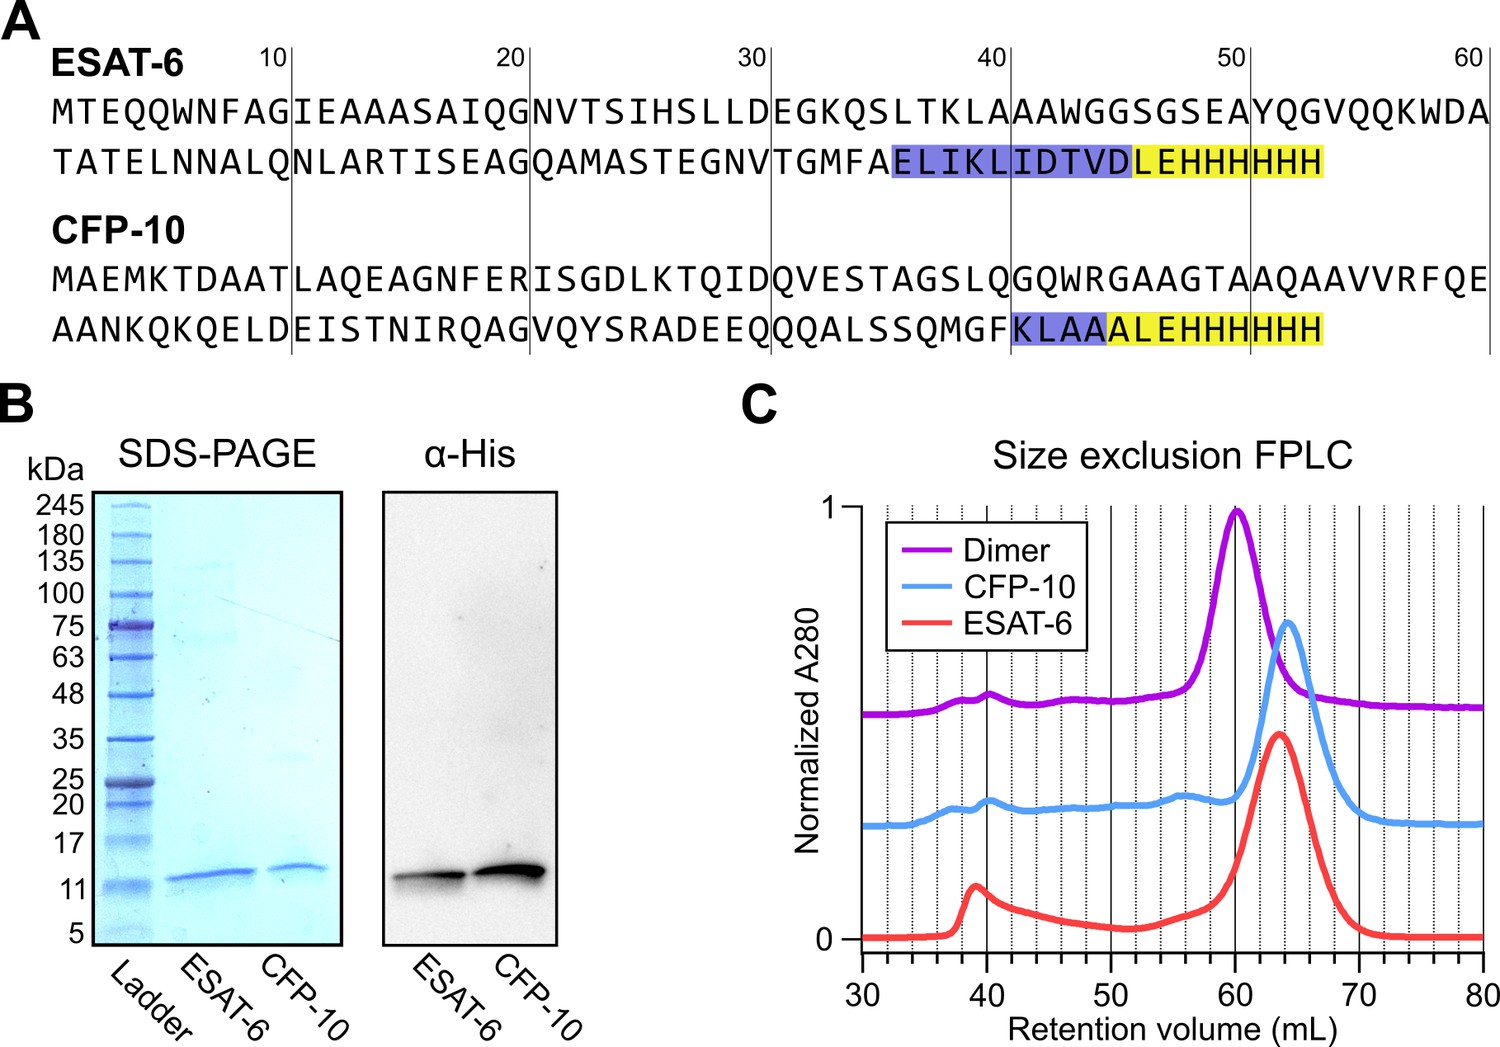
Expression of recombinant ESAT-6 and CFP-10.
(A) Amino acid sequences derived from plasmid sequencing of pMRLB.7 (ESAT-6) and pMRLB.46 (CFP-10) plasmids available from BEI Resources. The yellow highlights indicate the expected FALE-Histidine tag amino acid sequence while the blue highlights indicate unexpected additional amino acids. (B) SDS-PAGE gel of purified ESAT-6 and CFP-10 with a paired anti-His6 western blot. (C) Size exclusion chromatography traces showing the retention volumes of purified ESAT-6, CFP-10 and an equimolar mixture of both (Dimer).
-
Figure 1—source data 1
SDS-PAGE and western blot.
(A) Uncropped SDS-PAGE gel showing recombinant ESAT-6 and CFP-10 next to a BLUEstain 2 (Gold Bio) protein ladder and stained with Blazin' Blue (Goldbio) protein gel stain. (B) Uncropped western blot showing recombinant ESAT-6 and CFP-10 using a His-tag specific antibody.
- https://cdn.elifesciences.org/articles/91930/elife-91930-fig1-data1-v1.zip
Figure 1—figure supplement 1
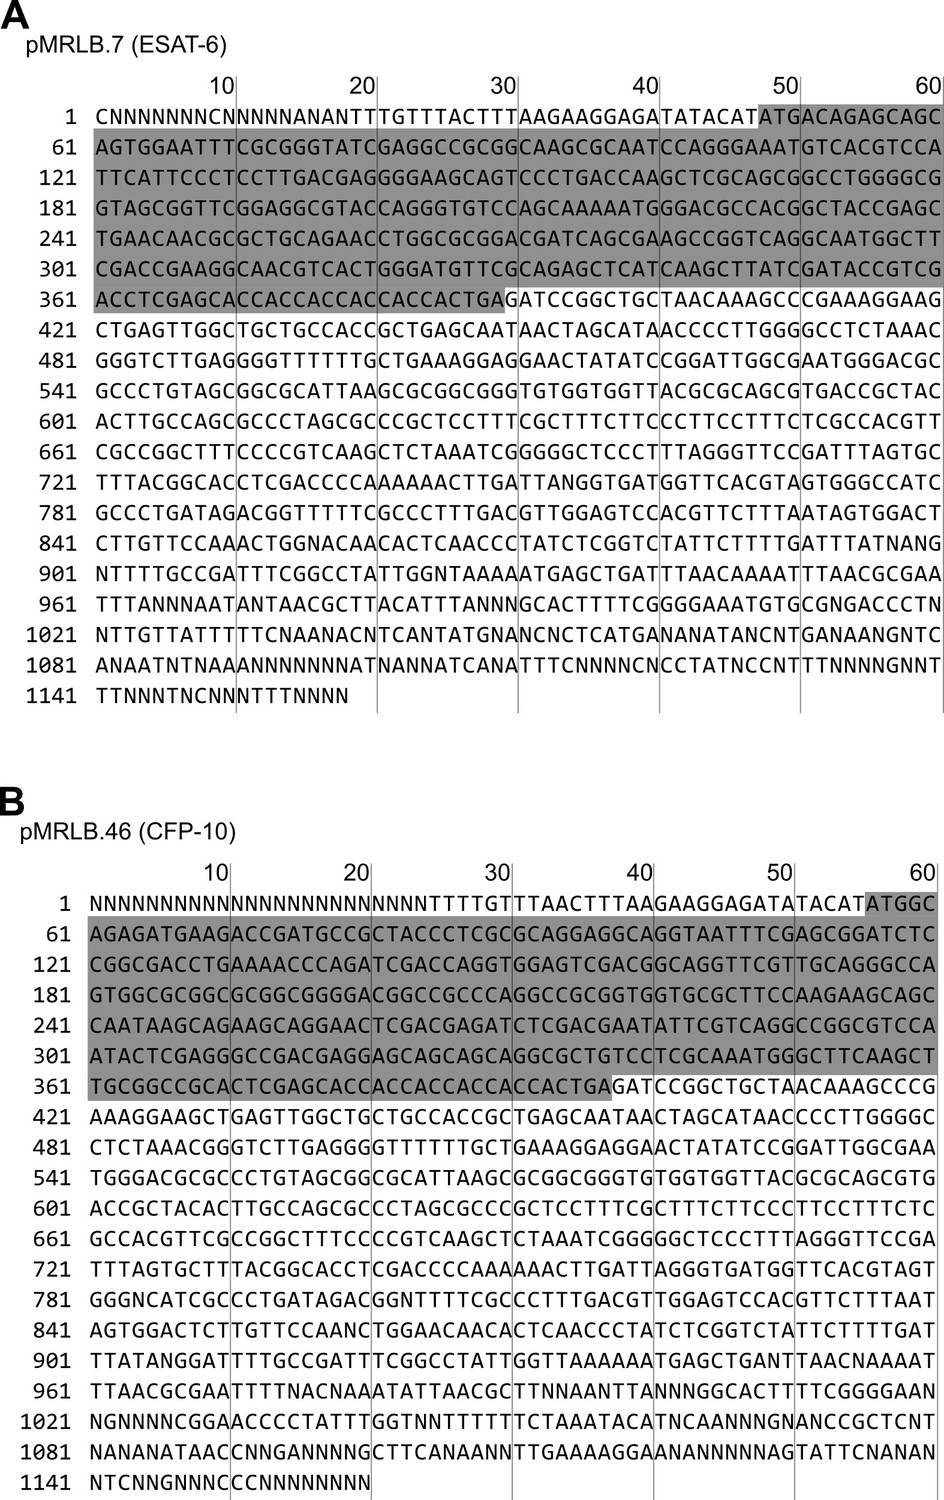
Sequencing.
(A) Sanger sequencing of pMRLB.7 with the ESAT-6 open reading frame (ORF) highlighted grey. (B) Sanger sequencing of pMRLB.46 with the CFP-10 ORF highlighted grey.
Figure 1—figure supplement 2

Whole protein mass spectrometry (MS) of recombinant ESAT-6 and CFP-10.
(A) Deconvoluted mass spectrum of recombinant ESAT-6 MS run. (B) Deconvoluted mass spectrum of recombinant CFP-10 MS run. (C) Computed mass of each protein compared with the measured masses. Fractional abundance combined the main peak with the harmonic artifact at twice the mass and gives an approximate relative proportion of each molecule in the sample. ESAT-6 is approximately 38% demethionylated while CFP-10 is fully demethionylated.
Figure 2 with 1 supplement
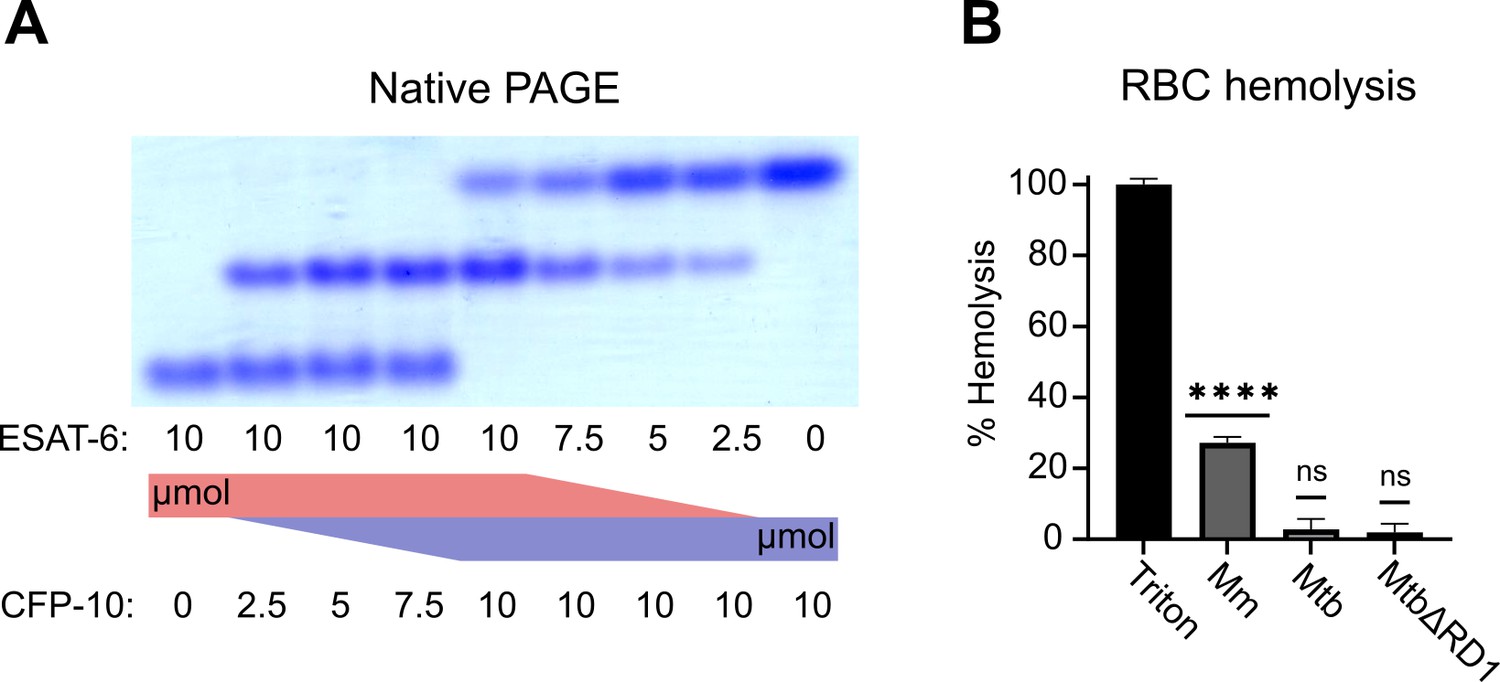
Functional testing of ESAT-6 and CFP-10.
(A) Native-PAGE analysis of ESAT-6 and CFP-10 showing 1:1 complex formation at neutral pH. The displayed gel is representative of 3 replicates. (B) Contact-dependent red blood cell (RBC) hemolysis by whole bacteria, either Mycobacterium marinum (Mm), Mycobacterium tuberculosis (Mtb), or Mtb with the region of difference 1 deletion, incapable of producing ESAT-6 or CFP-10 (MtbΔRD1). Data in B represents 6 replicates. Error bars represent the 95% confidence interval. Statistical significance was determined using a one sample t test against a theoretical mean of 0. *=0.05, **=0.01, ***=0.001, ****=0.0001.
-
Figure 2—source data 1
Native PAGE.
(A) Native PAGE gel showing pure ESAT-6 on the left, pure CFP-10 on the right, and mixtures of both in the indicated ratios. The gel was stained with Blazin' Blue (Goldbio) protein gel stain.
- https://cdn.elifesciences.org/articles/91930/elife-91930-fig2-data1-v1.zip
Figure 2—figure supplement 1

Hemolysis by recombinant ESAT-6.
(A) Sheep red blood cell hemolysis assay carried out with purified ESAT-6 in citrate buffer at various pH values. Percent hemolysis was calculated by subtracting buffer background and dividing by Triton-X100 detergent lysed samples.
Figure 3
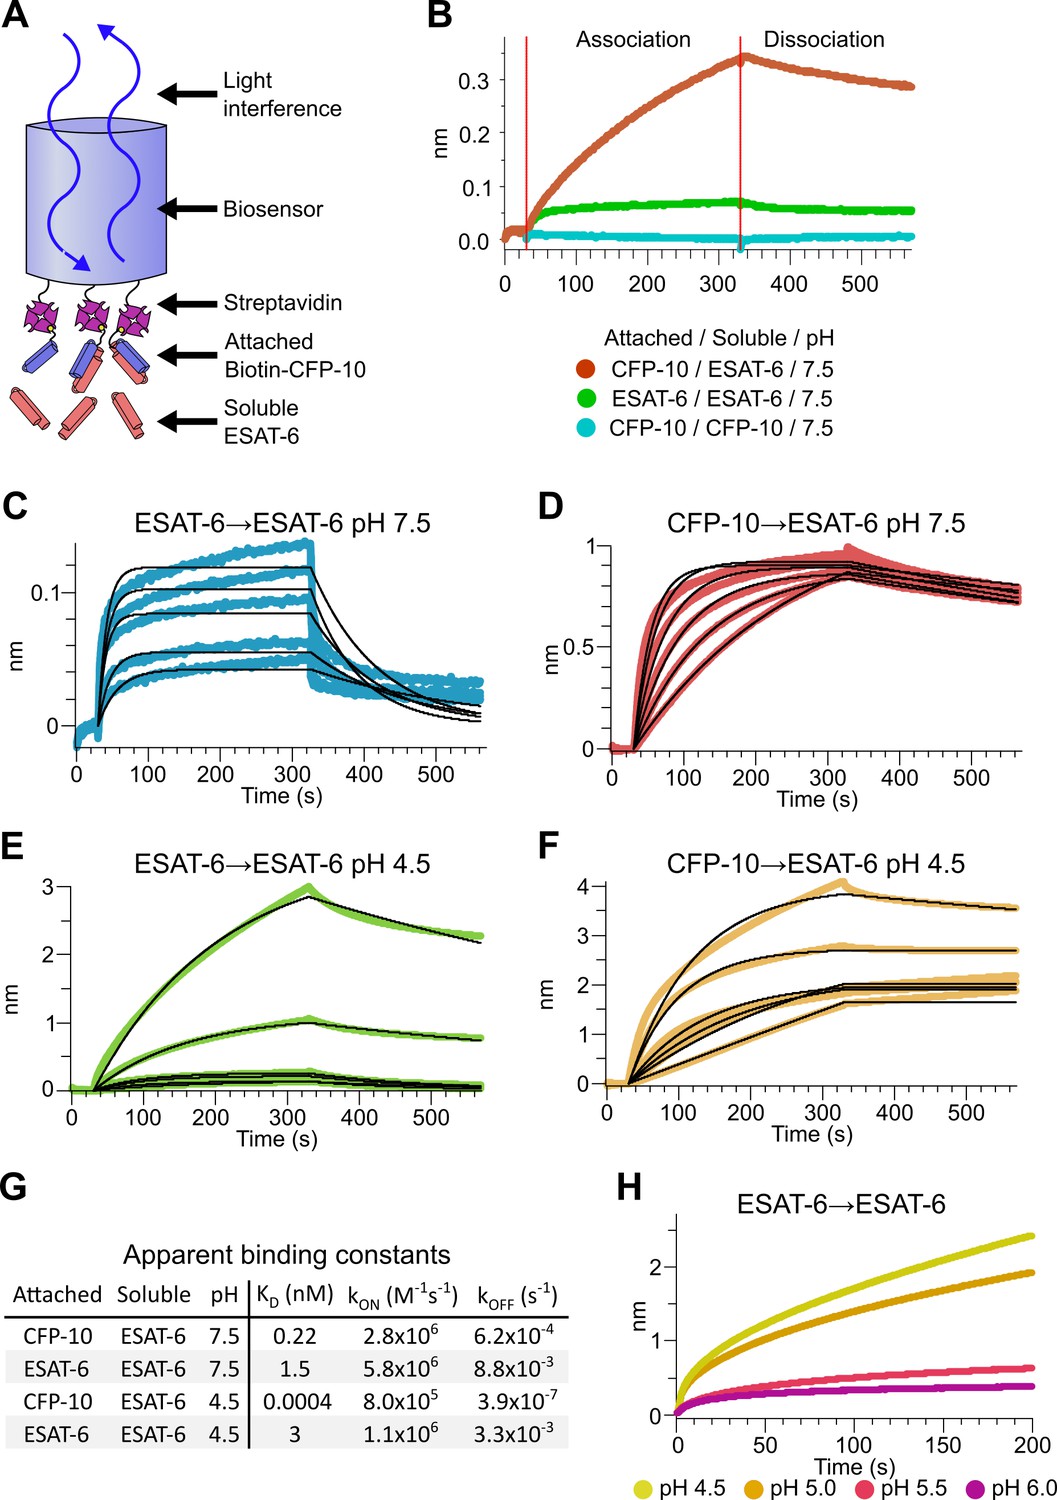
Binding kinetics of ESAT-6 and CFP-10 under neutral and acidic conditions.
(A) Biolayer interferometry (BLI) experimental design. Biotinylated ESAT-6 or CFP-10 are attached to streptavidin coated biosensors, then dipped into solutions of free ESAT-6 or CFP-10. (B) BLI experiment depicting ESAT-6 and CFP-10 association, ESAT-6 self-association, and CFP-10 self-association at pH 7.5 with 50 µM. BLI experiment showing (C) ESAT-6 self-association at pH 7.5, (D) CFP-10/ESAT-6 association at pH 7.5, (E) ESAT-6 self-association at pH 4.5, and (F) CFP-10/ESAT-6 association at pH 4.5 Proteins in (C–F) were tested at 1, 3.16, 10, 31.6, and 100 µM. (G) Table of apparent binding constants calculated with a 1:1 model for each indicated condition. (H) BLI experiment testing ESAT-6 self-association at pH 4.5, 5.0, 5.5, and 6.0 with 100 µM protein.
Figure 4
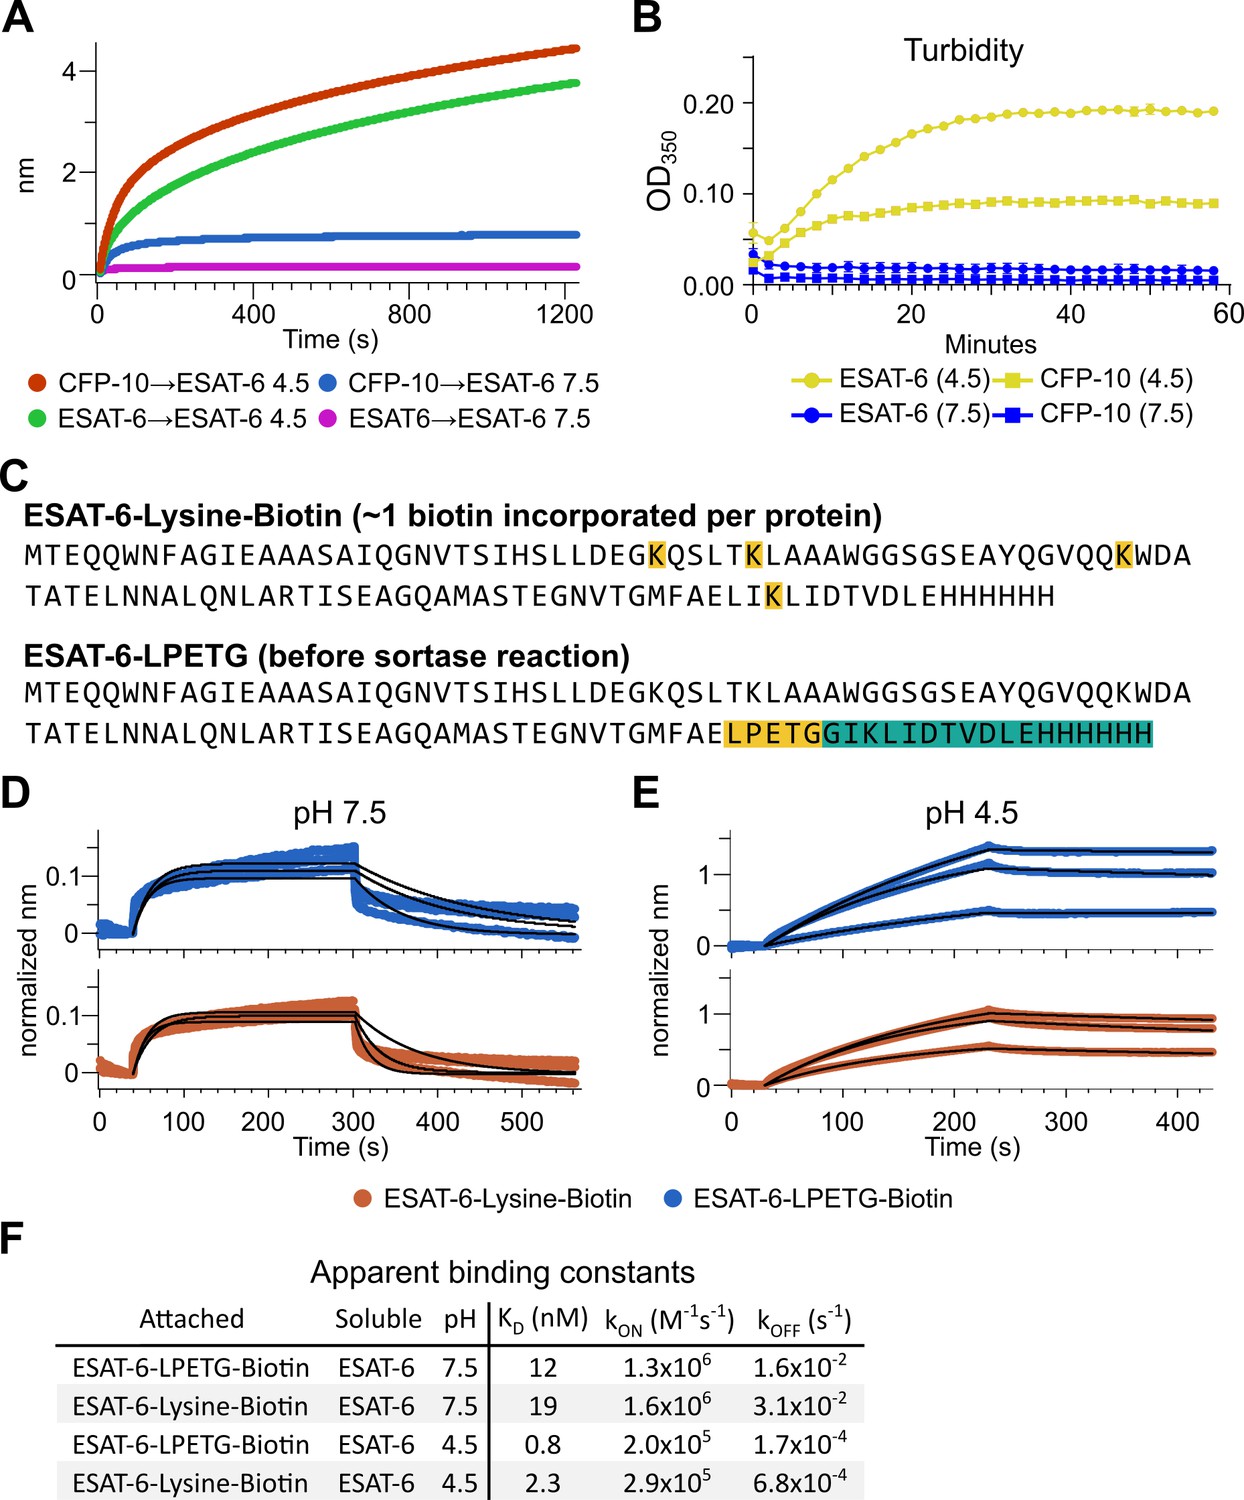
Extensive self-association of ESAT-6.
(A) BLI long-association experiment showing 50 µM ESAT-6 at pH 4.5 or 7.5 attaching to biosensors coated with either ESAT-6 or CFP-10. (B) Turbidity assay showing 50 µM ESAT-6 or 50 µM CFP-10 at pH 4.5 or 7.5 over time. Absorbance at 350 nm read every 2 min. (C) Lysine-labeled Biotinylated ESAT-6 has an average of 1 biotin per protein attached to the N-terminus or one of the orange highlighted lysine residues. The ESAT-6-LPETG construct amino acid sequence is shown which includes and inserted LPETG motif, in orange. Reaction with biotinylated poly-glycine via sortase-mediated transpeptidation results in the teal highlighted residues being removed and replaced with a biotin molecule. BLI experiments at (D) pH 7.5 and (E) pH 4.5 showing unmodified soluble ESAT-6 interacting with streptavidin biosensor tips loaded with ESAT-6-Lysine-Biotin (red) or ESAT-6-LPETG-Biotin (blue). Curves were normalized by dividing response values by the amount of protein added during the loading step. (F) Summary of apparent kinetic binding constants in (D–E).
Figure 5
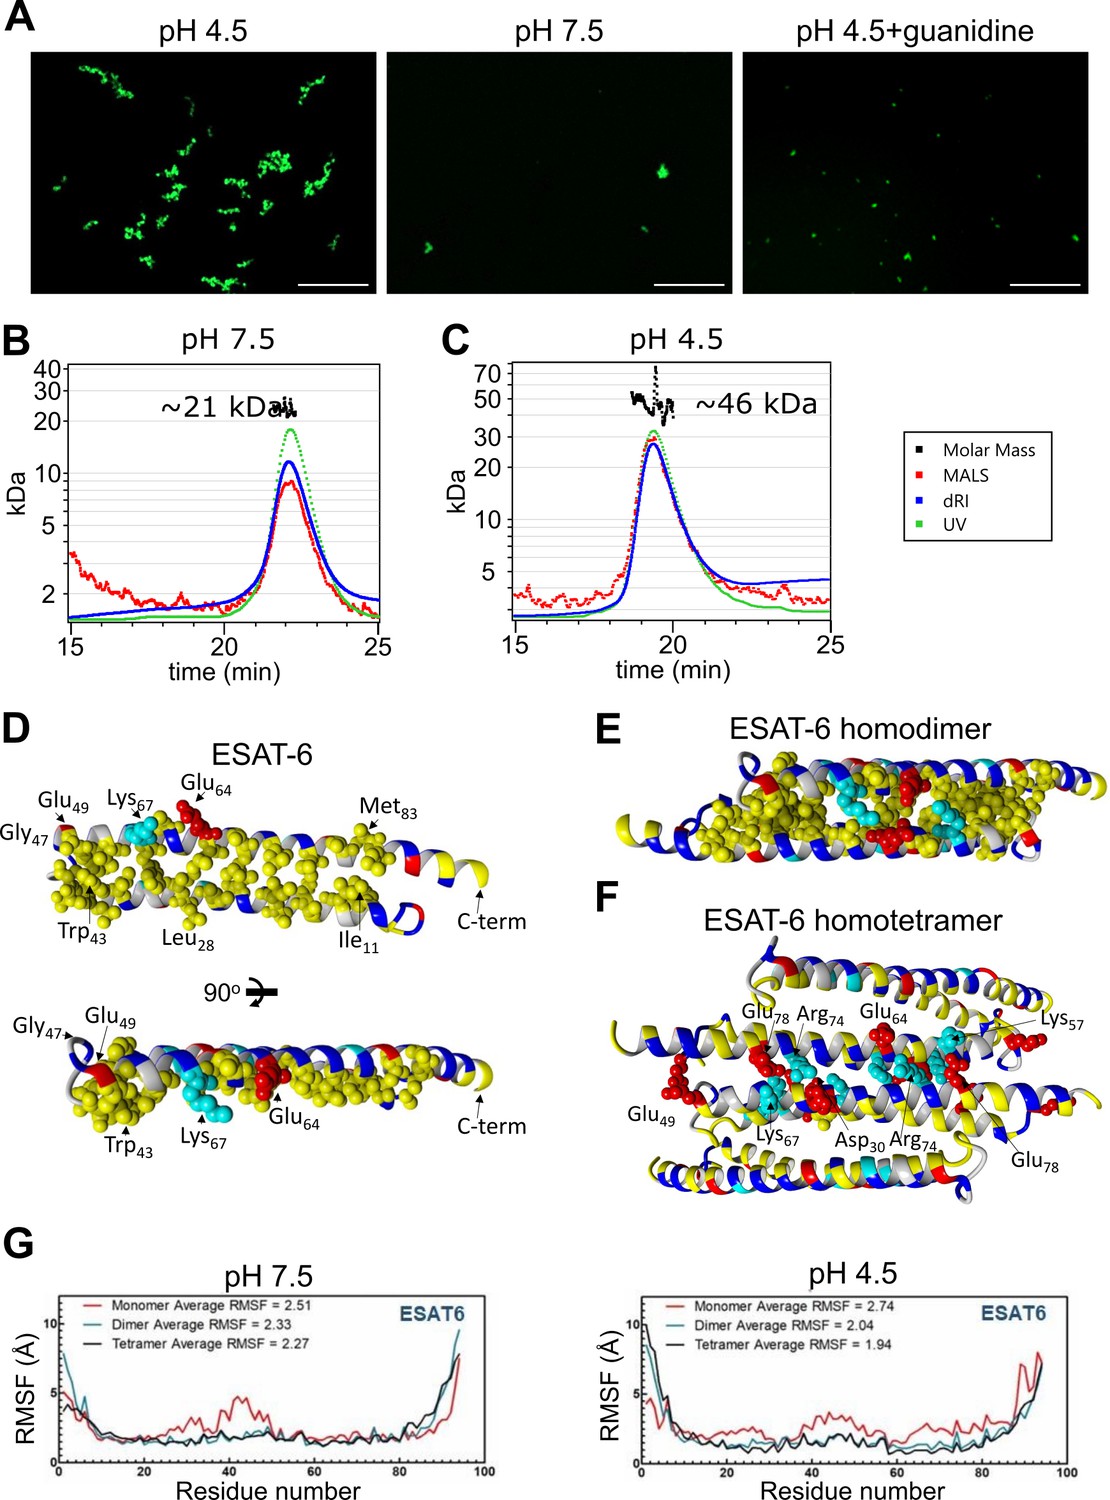
Stoichiometry of ESAT-6 self-interaction.
(A) Fluorescence microscopy showing fluorescently labeled ESAT-6 complexes under different conditions: pH 4.5, pH 7.5, and pH 4.5+6 M guanidine. The images shown are representative of three replicates. Size exclusion chromatography followed by multi-angle light scattering (SEC-MALS) traces showing UV absorbance, refractive index (dRI), and MALS data along with calculated molar mass over the peak at pH 7.5 (B), and pH 4.5 (C). Data in (B–C) is representative of three replicates. (D–F) Modeling of ESAT-6 in monomeric (D), homodimeric (E), and homotetrameric form (F). Hydrophobic residues are in yellow, polar residues are in blue, basic residues are in cyan, and acidic residues are in red. Key side chain residues are shown as spheres. (G) Root mean square fluctuation (RMSF) values are shown per residue for ESAT-6 monomer, dimer, and trimer at pH 7.5 and 4.5.
Figure 6
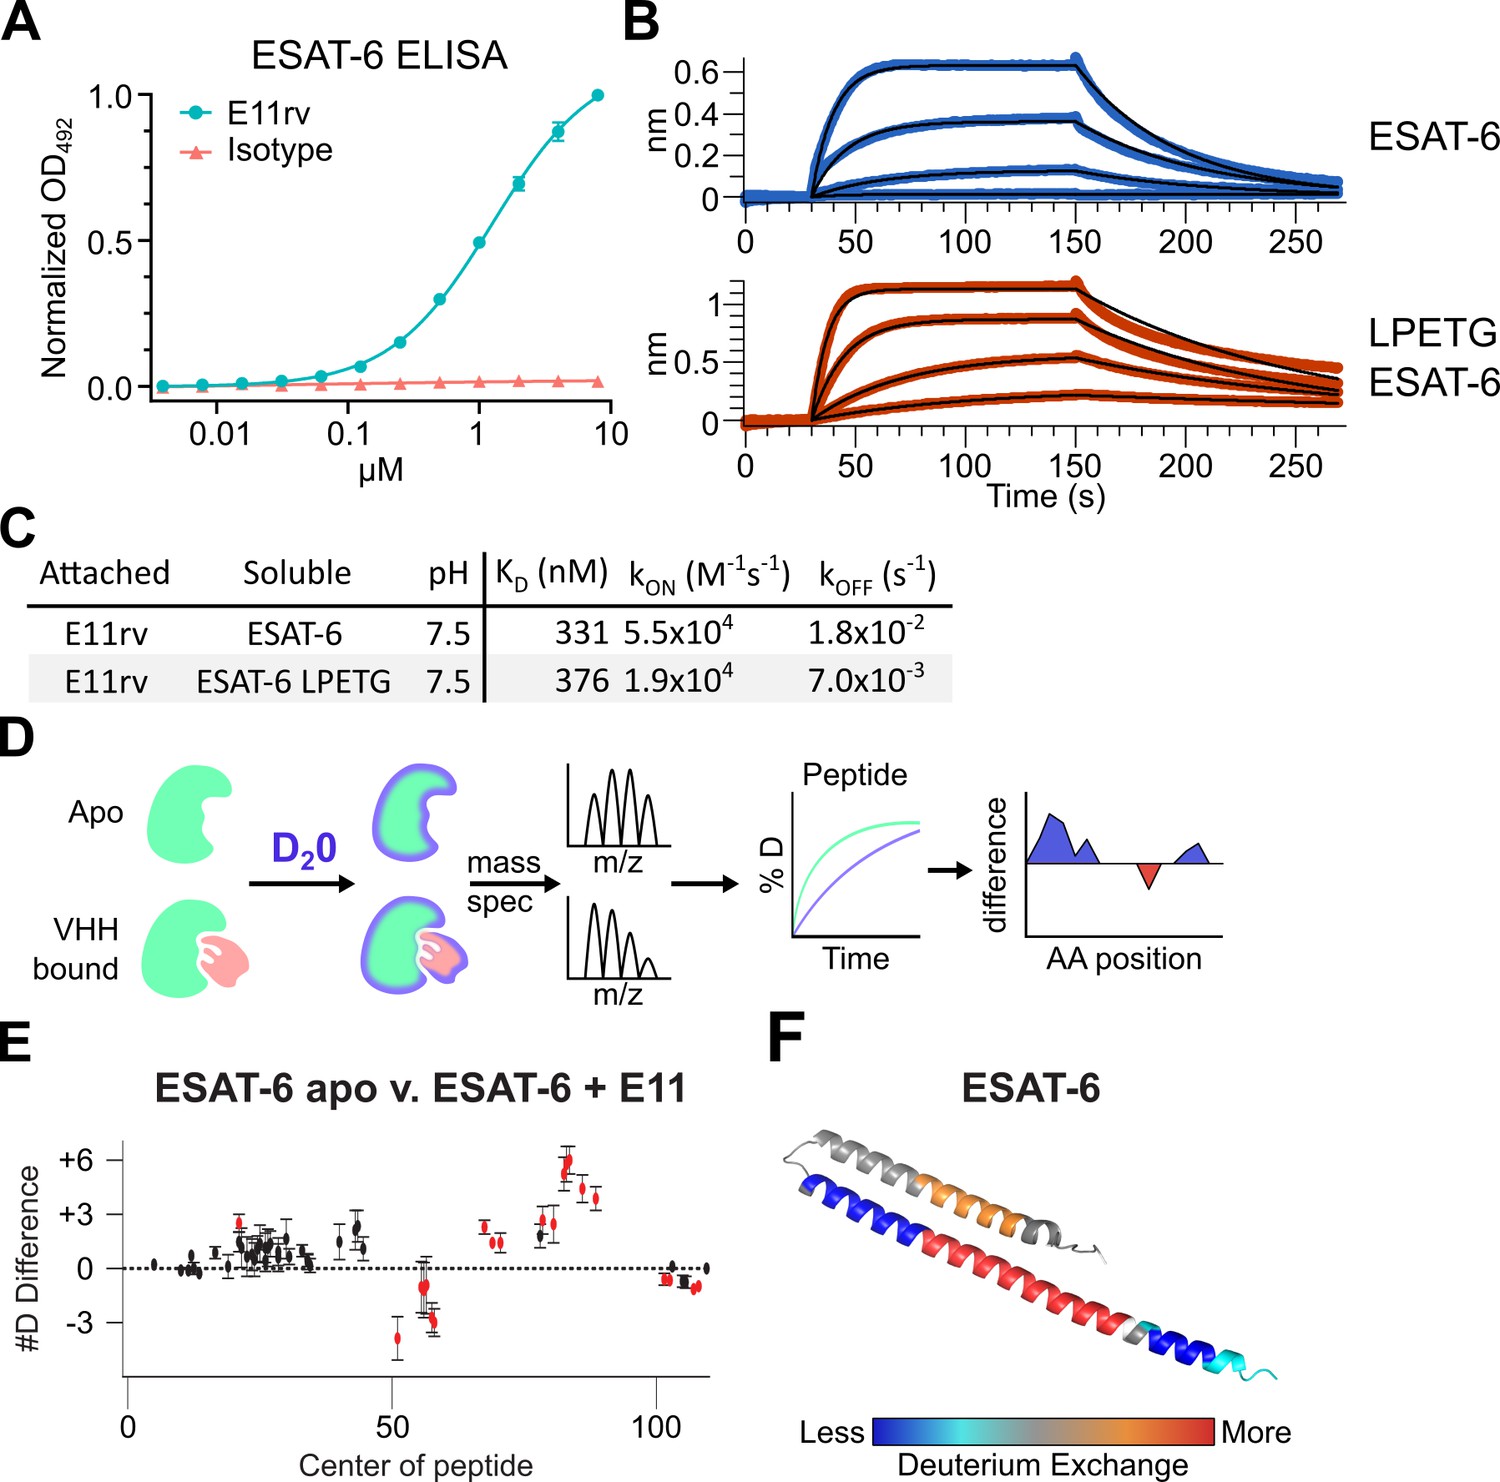
An ESAT-6-binding alpaca nanobody.
(A) ELISA experiment on ESAT-6-coated plates showing nanobody E11rv and an irrelevant isotype control. E11rv displays an EC50 of 17.5 (95% CI 16.0–19.4) µg/mL. (B) BLI experiments with E11rv-coated biosensors tested against pMRLB.7 ESAT-6 (blue) or ESAT-6-LPETG (red) at 10, 3.3, 1, and 0.3 µM. (C) Summary of kinetic binding constants from (B). (D) Schematic diagram of hydrogen-deuterium exchange (HDX) experiment showing apo ESAT-6 or E11rv-bound ESAT-6 incubated in D20, then subjected to digestion and mass spectrometry to measure the levels of deuterium incorporation at different times for different peptides, then mapping this to the protein sequence to identify areas with less or greater deuterium exchange between the apo and bound conditions. (E) HDX data for ESAT-6 and E11rv showing reduced deuterium uptake around residue 50 and increased uptake around residue 75. (F) HDX shifts mapped to the ESAT-6 structure (PDB: 3FAV).
Figure 7
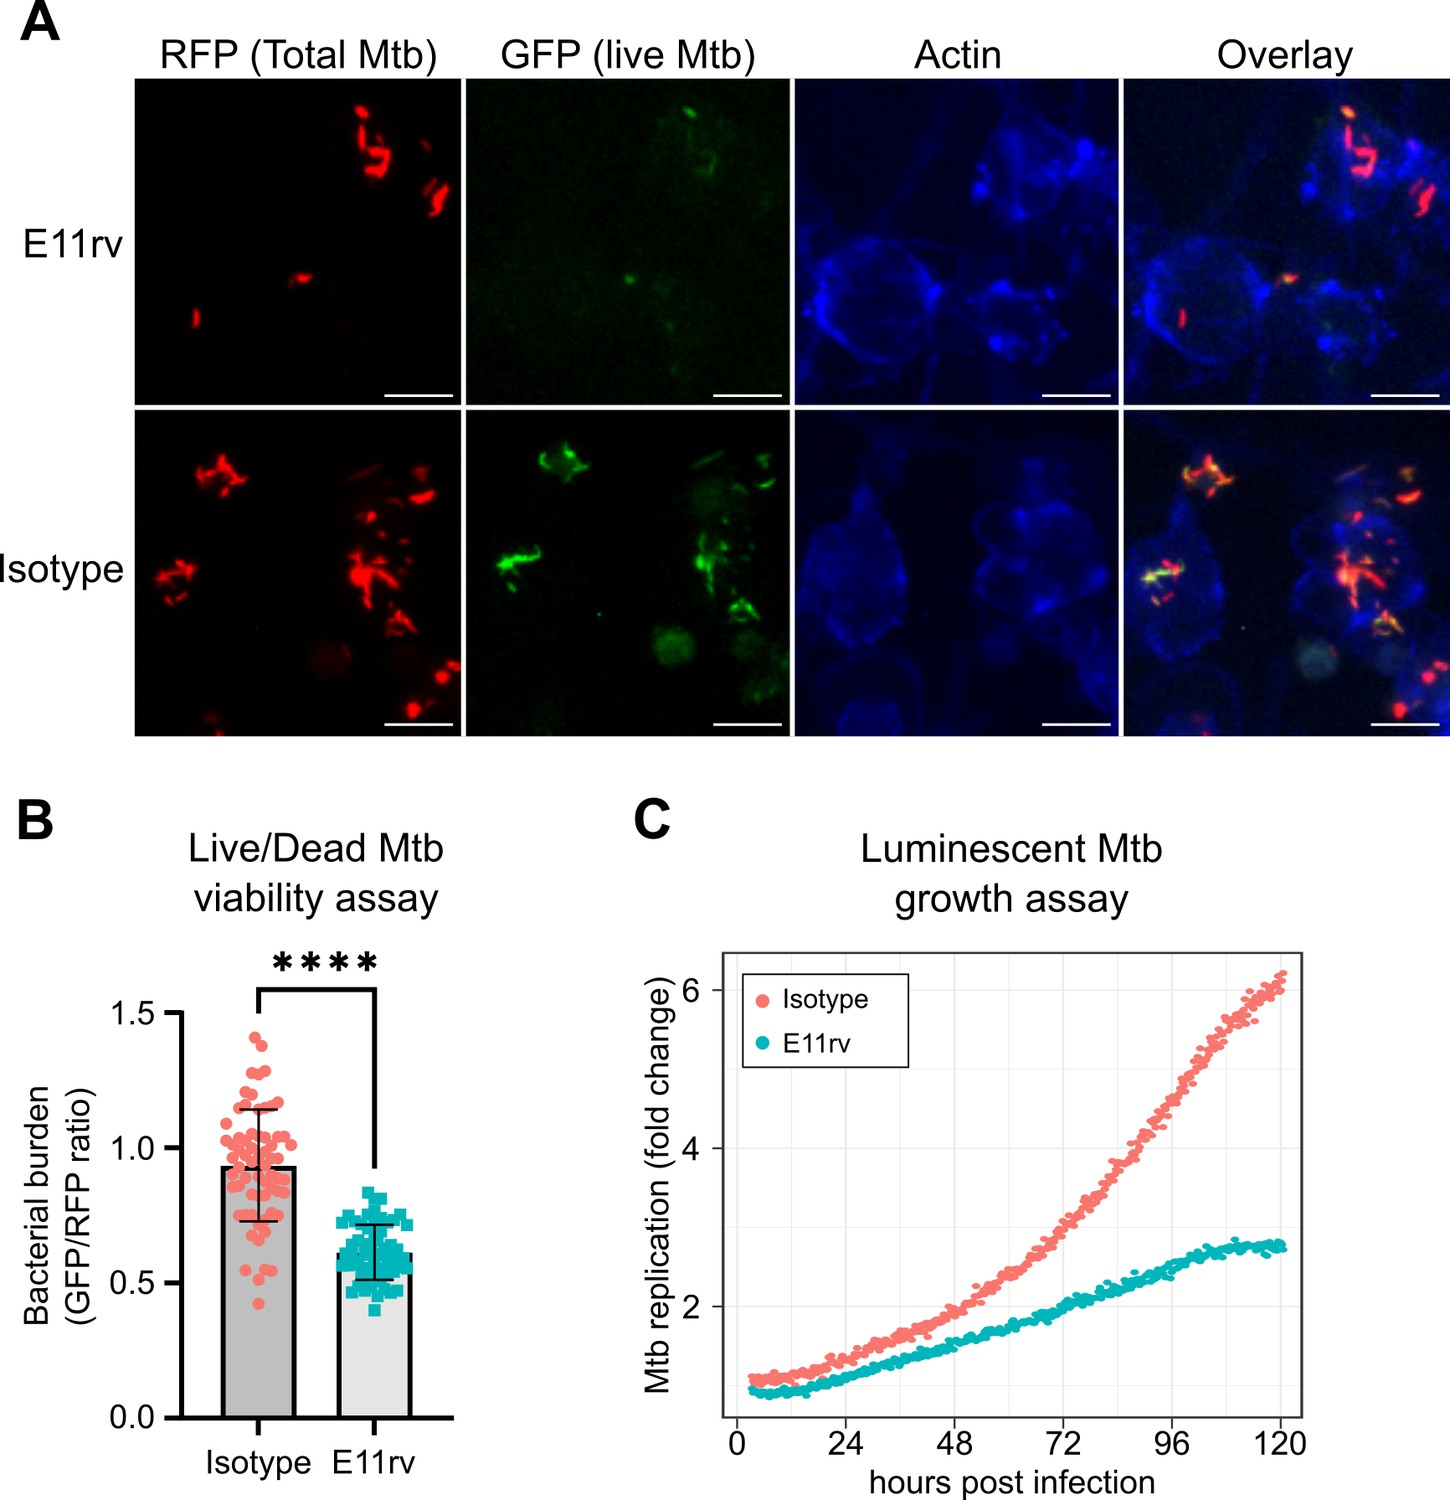
E11rv inhibits Mtb growth in cells.
(A) Representative fluorescence microscopy images for E11rv and isotype-treated cultures. Results include data from three replicates. (B) Cellular assay testing the effect of infecting THP-1 cells with Live/Dead Mtb in the presence of E11rv for 3 days, treated with doxycycline for 24 hr to induce GFP expression by remaining metabolically active Mtb. The GFP/RFP ratio was calculated for each Mtb spot identified by fluorescence microscopy. Error bars represent the 95% confidence interval. Statistical significance was determined with a two-tailed unpaired t test. *=0.05, **=0.01, ***=0.001, ****=0.0001. (C) Luminescence growth assay of stably transfected THP-1 cells expressing E11rv or isotype nanobody in their cytoplasm. Cells were infected with luminescent Mtb and monitored by luminescence plate reader for 120 hr. Results are representative of 6 replicates.
Additional files
Download links
A two-part list of links to download the article, or parts of the article, in various formats.
Downloads (link to download the article as PDF)
Open citations (links to open the citations from this article in various online reference manager services)
Cite this article (links to download the citations from this article in formats compatible with various reference manager tools)
ESAT-6 undergoes self-association at phagosomal pH and an ESAT-6-specific nanobody restricts M. tuberculosis growth in macrophages
eLife 12:RP91930.
https://doi.org/10.7554/eLife.91930.3


