Inter-species association mapping links splice site evolution to METTL16 and SNRNP27K
- School of Life Sciences, University of Dundee, United Kingdom
- Department of Biochemistry, University of Oxford, United Kingdom
- Cell & Molecular Sciences, James Hutton Institute, United Kingdom
Figures
Figure 1 with 1 supplement
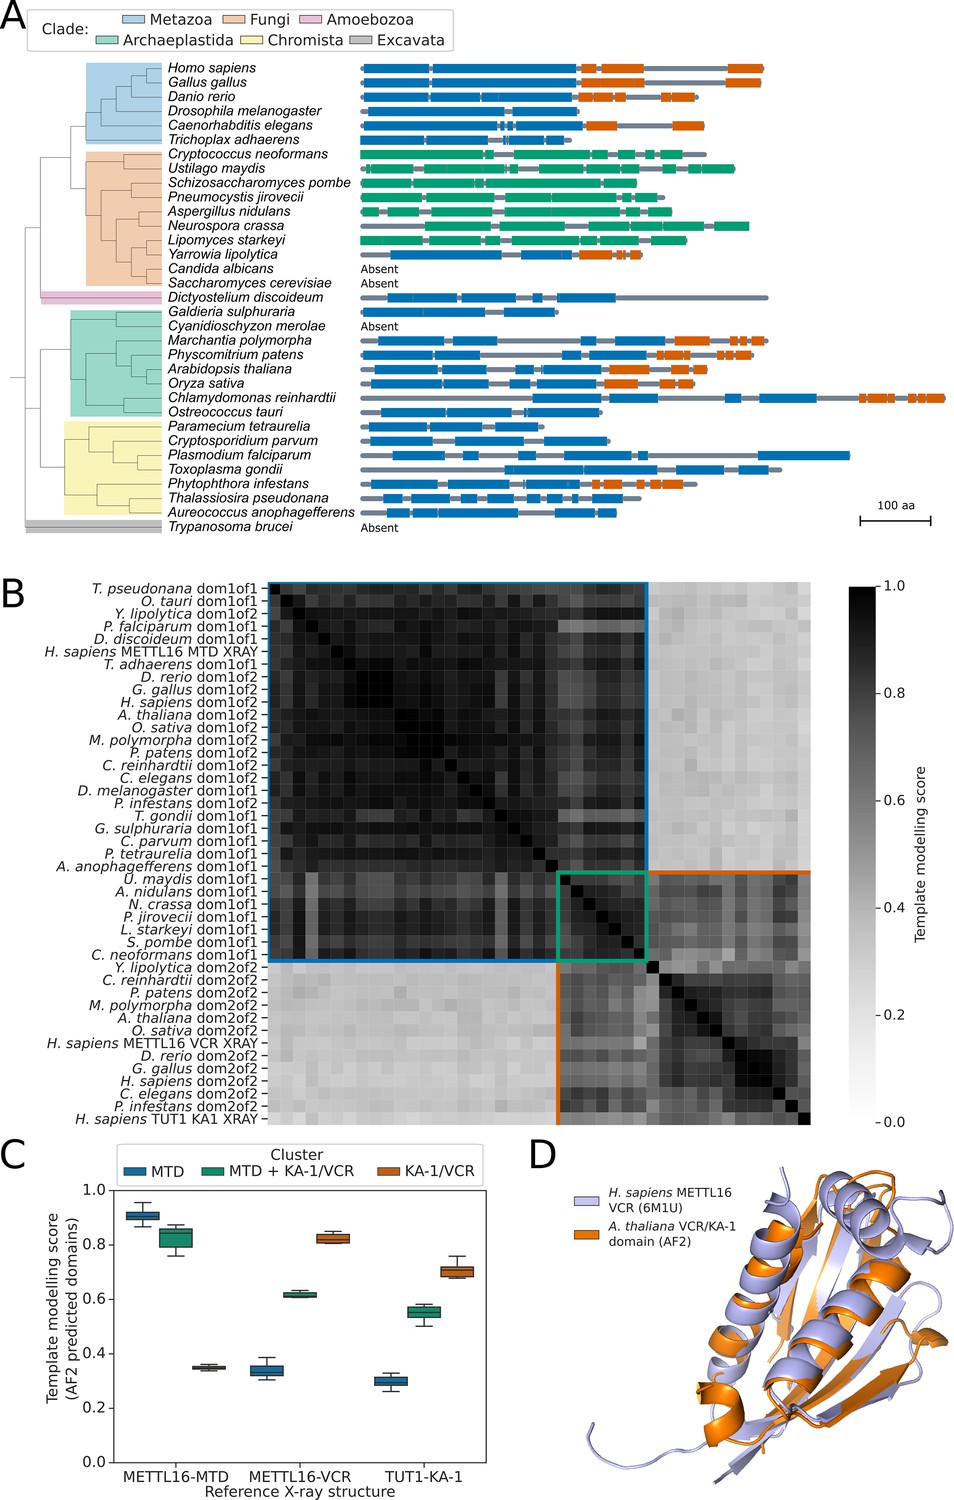
METTL16 is widely conserved across eukaryotes.
(A) Phylogenetic tree showing the presence and absence of a METTL16 ortholog in 33 eukaryotic species. Linear protein structures with globular domains identified from Alphafold2 models are shown on the right of the tree. Domains are colored by cluster: MTD domains in blue, MTD +VCR/KA-1 domains in green, and VCR/KA-1 domains in orange. Likely loop/disordered regions with low confidence predictions are shown as grey lines. (B) Distance matrix heatmap showing the pairwise TMscore of segmented domains from the Alphafold2 predictions of 29 METTL16 orthologs. The X-ray structures of human METTL16 MTD and VCR, and TUT1 KA-1 are included as positive controls. Domains are grouped into clusters (diagonal boxes) using the same color scheme as in (A). (C) Boxplot showing TMscores of segmented domains from Alphafold2 predictions of 28 METTL16 orthologs superimposed onto experimentally determined structures of human METTL16 MTD and VCR, and TUT1 KA-1. (D) Superimposition of the VCR/KA-1 domain of Arabidopsis FIO1 predicted by Alphafold2 onto the X-ray structure of the human METTL16 VCR.
Figure 1—figure supplement 1
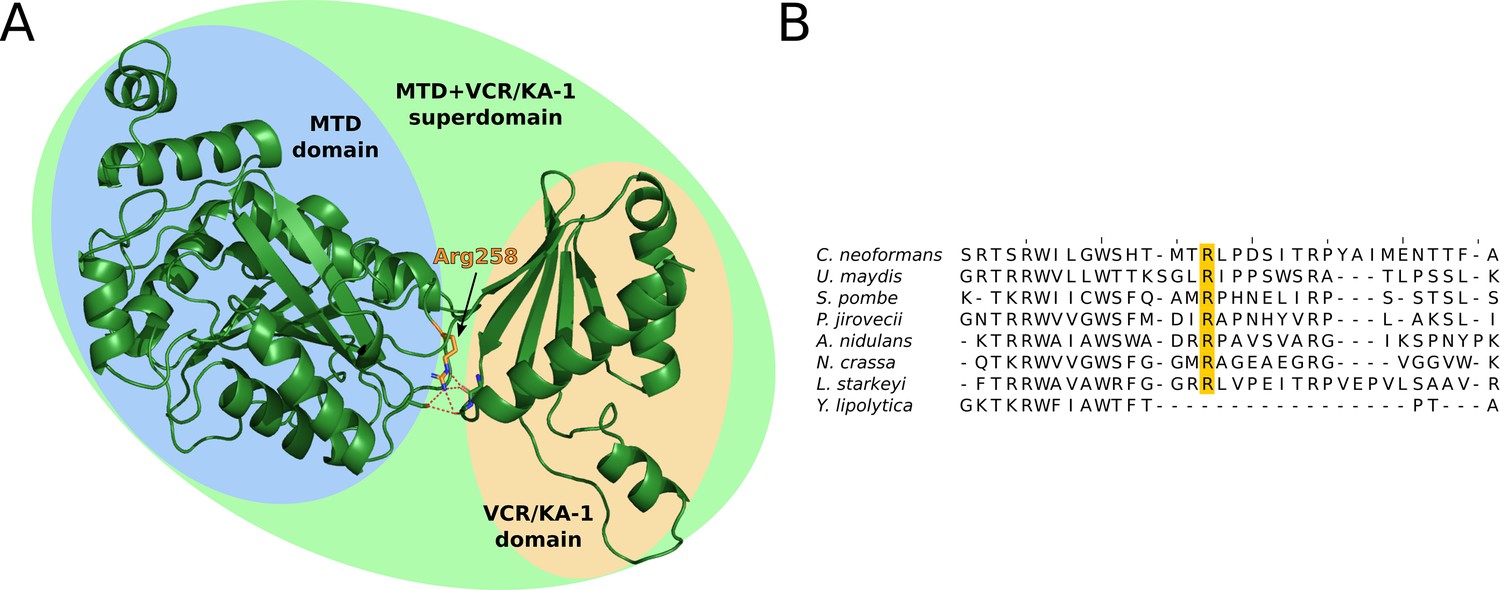
Structural analysis of fungal METTL16 orthologs.
(A) Alphafold2 predicted structure of S. pombe MTL16, which cannot be segmented into separate MTD and VCR/KA-1-like domains using the PAE method. Alphafold2 predicts that the MTD and VCR/KA-1 subdomains are sandwiched together by hydrogen bonding of Arginine 258 (orange, hydrogen bonding shown as dashed red lines) with backbone carbonyl oxygens, to create the superdomain structure. (B) Multiple sequence alignment of the 8 fungal METTL16 orthologs, of which 7 cannot be segmented into separate MTD and VCR/KA-1-like domains using the PAE method. Arg258 is highly conserved in these 7 orthologs (orange), but not in Y. lipolytica, which is segmentable into two domains.
Figure 2 with 4 supplements
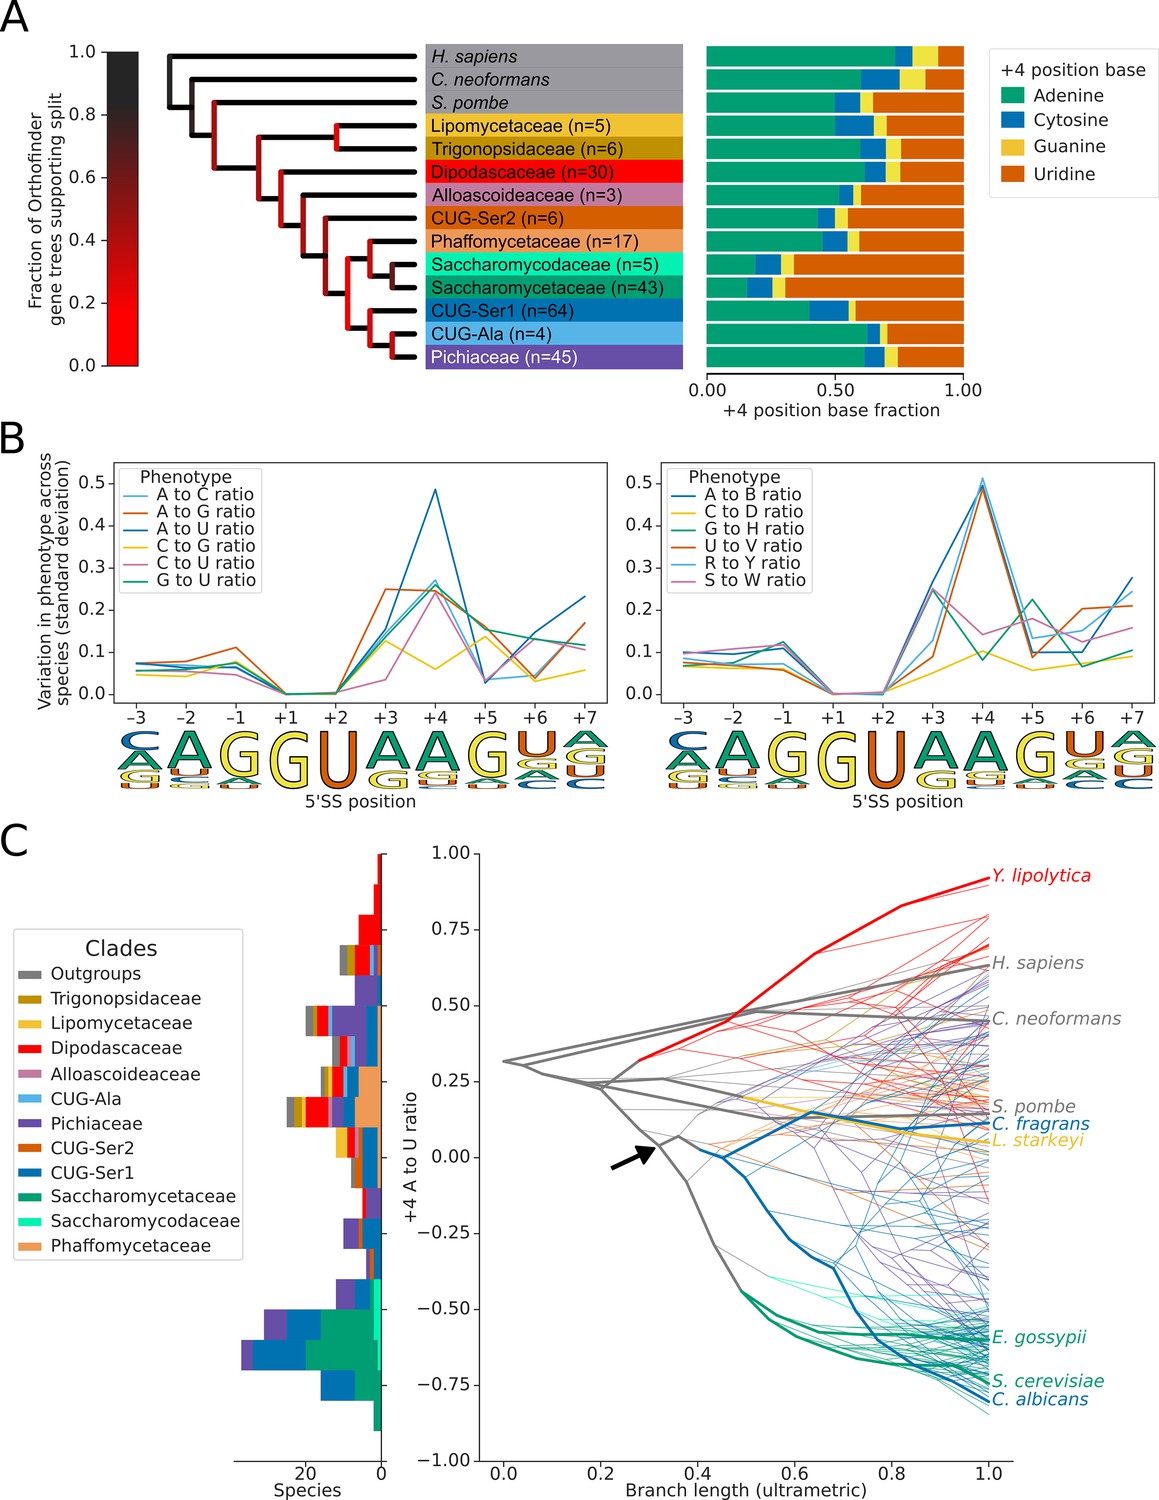
Variation in the identity of the 5’ splice site +4 position evolved independently on multiple occasions.
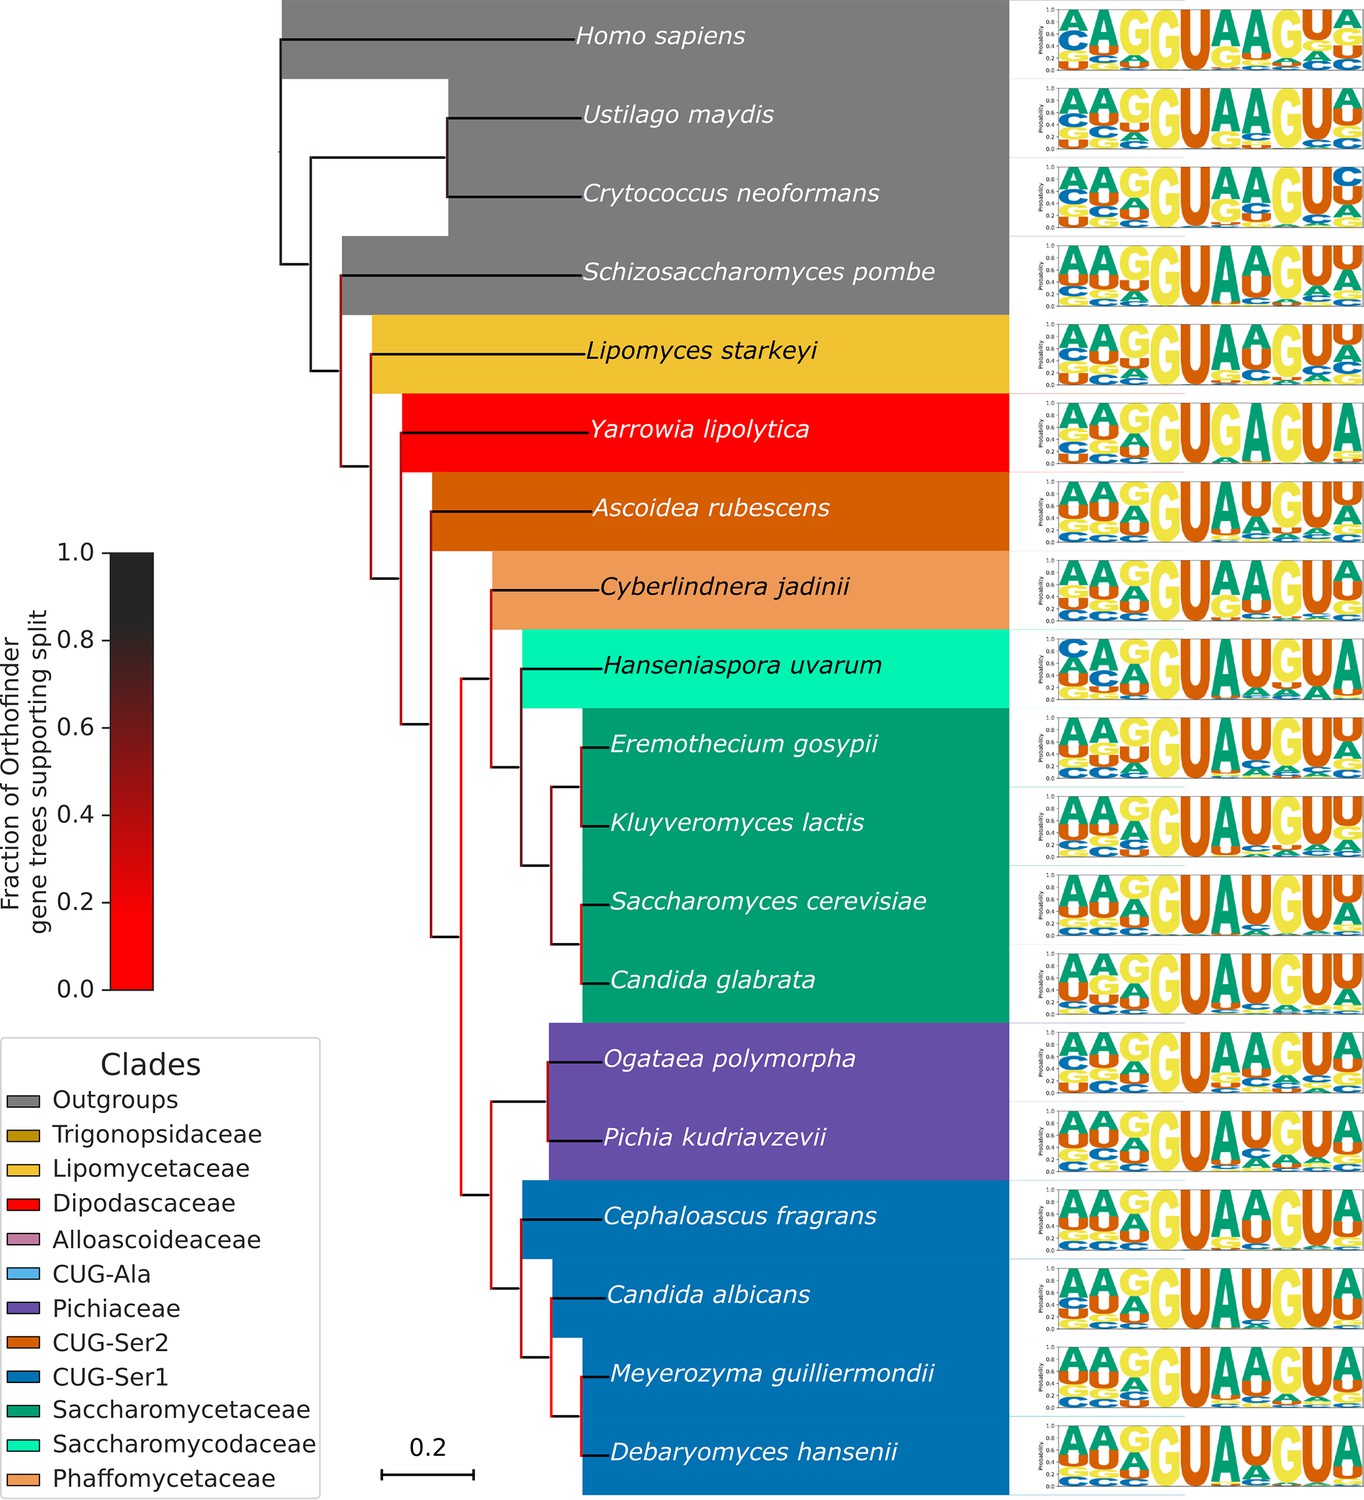
(A) Phylogenetic tree showing the estimated +4 position nucleotide fractions (as stacked bars) of the last common ancestors of 11 clades of Saccharomycotina, plus three outgroup species. The phylogenetic tree used is a collapsed ultrametric version of the species tree generated by Orthofinder from the proteomes of 240 species. Bifurcations are colored by confidence, calculated using the number of single-locus gene trees that support the bifurcation in the Orthofinder STAG algorithm (Emms and Kelly, 2019; Emms and Kelly, 2018) (this measure is generally more stringent than bootstrap values for trees generated using concatenated multiple sequence alignment and maximum likelihood methods). Ancestral nucleotide fractions were calculated using Sankoff Parsimony (Schwartz et al., 2008) (B) Line plots showing the standard deviation of nucleotide frequency ratio phenotypes for 240 species, across the –3 to +7 positions of the 5’SS. Left panel shows all pairwise combinations of single nucleotide frequency phenotypes (e.g. A to U ratio), right panel shows all single nucleotide versus other combinations (e.g. G to H [A, C or U]), as well as R (A or G) to Y (C or U) and S (G or C) to W (A or U) ratios. Human 5'SS consensus sequences are shown for each position as a guide. (C) Stacked histogram and traitgram showing the distribution of 5’SS +4 A to U ratio phenotypes in different Saccharomycotina species. The traitgram shows the predicted path of the 5’SS +4 A to U ratio phenotype through evolutionary time by plotting the branch length on the x-axis, and the measured or estimated phenotype of each node on the y-axis. Clades defined in (A) have been colored accordingly and the paths of 9 key species have been highlighted in bold – for example showing that the last common ancestor of S. cerevisiae and C. albicans is unlikely to have had a +4 U preference phenotype (last common ancestor of S. cerevisiae and C. albicans is also indicated by black arrow). L. starkeyi = Lipomyces starkeyi, C. fragrans = Cephaloascus fragrans, E. gossypii = Eremothecium gossypii.
Figure 2—figure supplement 1
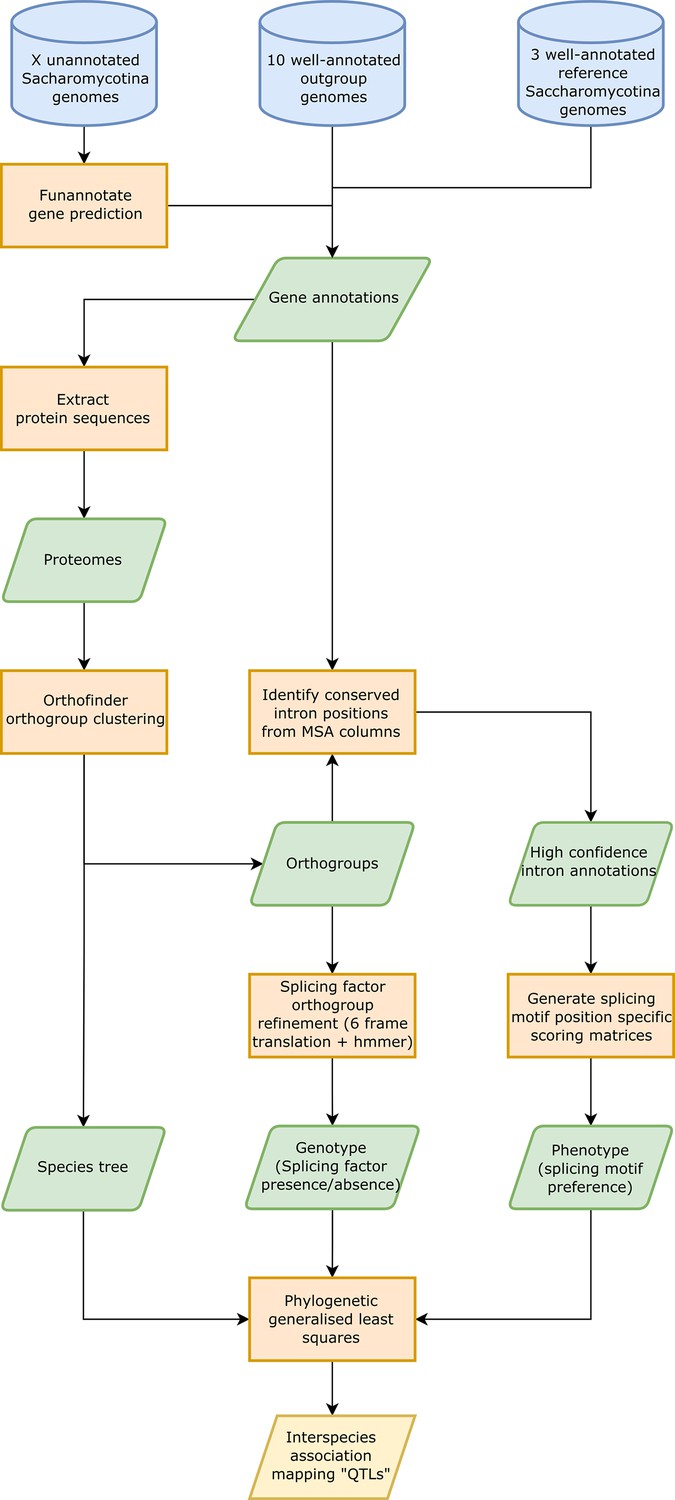
Interspecies association mapping pipeline.
Workflow showing the overall method used for generating inter-species association mapping results. Blue cylinders represent input data, orange boxes represent processes, green parallelograms represent intermediate datasets, and yellow parallelograms represent output datasets.
Figure 2—figure supplement 2
Variation in 5’SS splicing signal sequence preference phenotypes across Saccharomycotina.
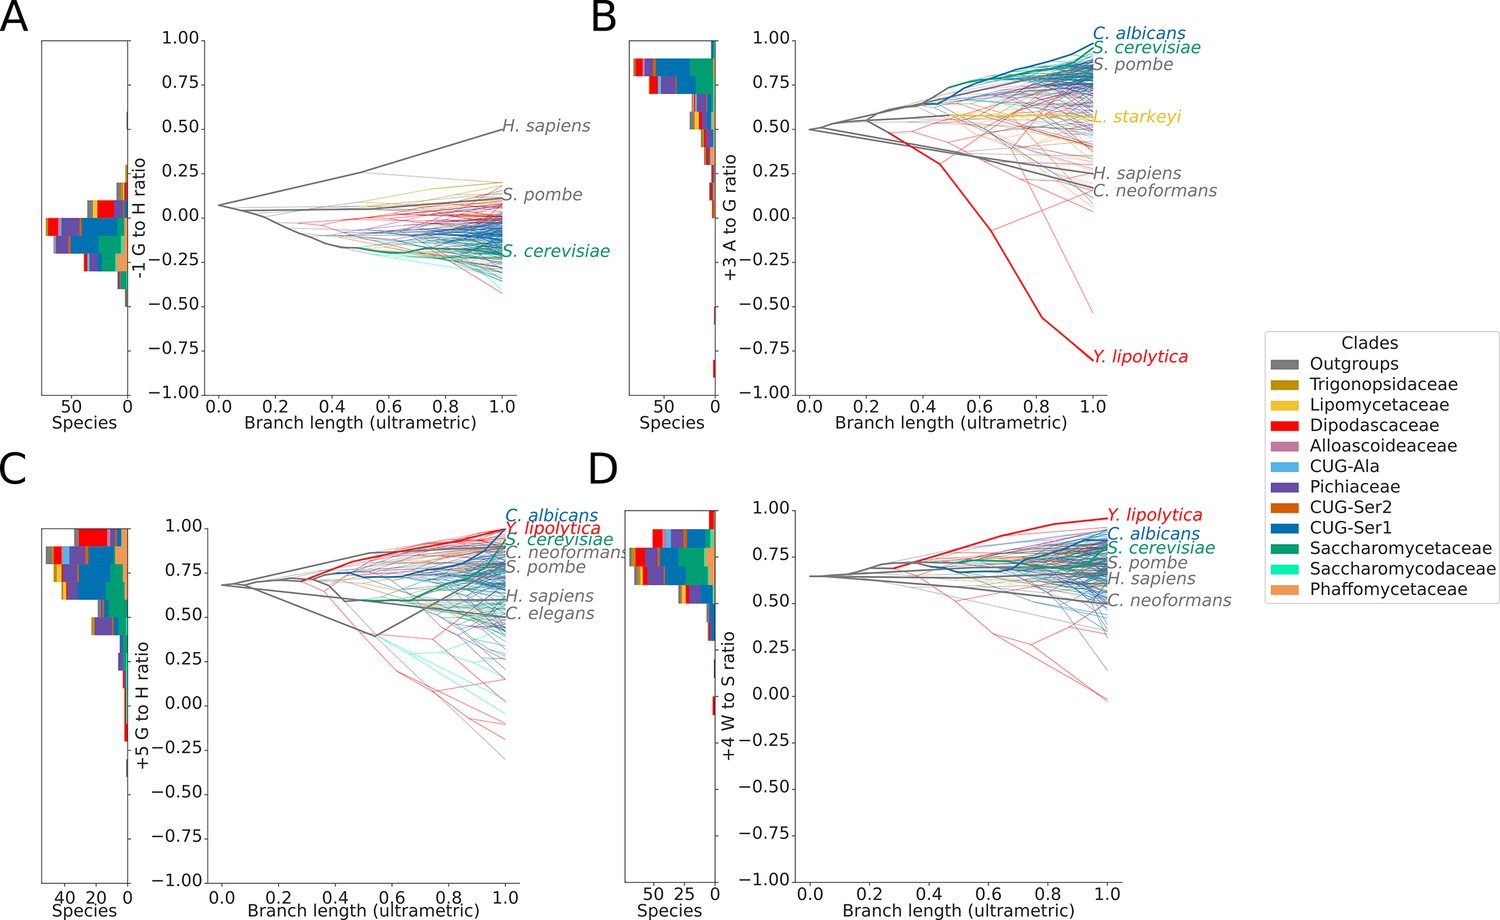
Stacked histogram and traitgrams showing the distribution of (A) –1 G to H (A, C or U), (B) +3 A to G, (C) +5 G to H and (D) +4 W (A or U) to S (G or C) ratio phenotypes in different Saccharomycotina species. The traitgram shows the predicted path of the phenotypes through evolutionary time by plotting the branch length on the x-axis, and the measured or estimated phenotype of each node on the y-axis. Species have been colored by clade (see key) and the paths of various key species have been highlighted in bold.
Figure 2—figure supplement 3
Variation in 5’SS splicing signal sequence preference phenotypes across Saccharomycotina.
Pruned Saccharomycotina tree showing the diversity of 5'SS sequence preferences. Species were selected to represent those Saccharomycotina species previously analysed by Schwartz et al., 2008, with new additions which demonstrate that changes in 5'SS +4 preference have occurred multiple times in Saccharomycotina.
Figure 2—figure supplement 4
Variation in 3’SS splicing signal sequence preference phenotypes across Saccharomycotina.
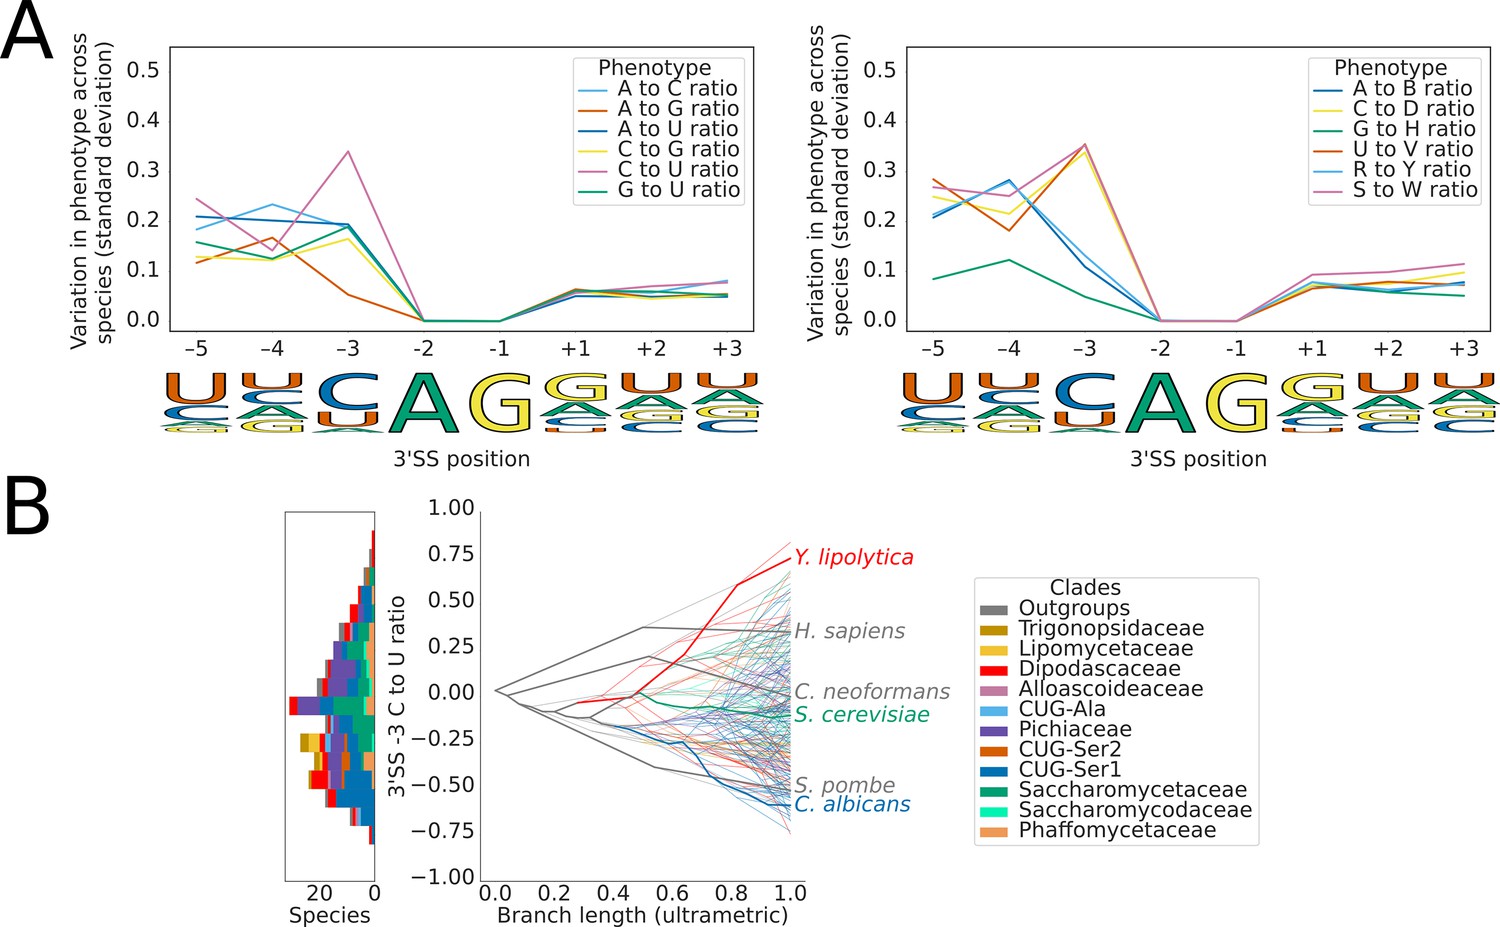
(A) Line plots showing the standard deviation of nucleotide frequency ratio phenotypes for 240 species, across the –5 to +3 positions of the 3’SS. Left panel shows all pairwise combinations of single nucleotide frequency phenotypes (e.g. A to U ratio), right panel shows all single nucleotide versus other combinations (e.g. G to H [A, C or U]), as well as R (A or G) to Y (C or U) and S (G or C) to W (A or U) ratios. Human 3'SS consensus sequences are shown for each position as a guide. (B) Stacked histogram and traitgram showing the distribution of 3'SS –3 C to U ratio phenotypes in different Saccharomycotina species. The traitgram shows the predicted path of the phenotypes through evolutionary time by plotting the branch length on the x-axis, and the measured or estimated phenotype of each node on the y-axis. Species have been colored by clade (see key) and the paths of various key species have been highlighted in bold.
Figure 3 with 1 supplement
Switches in 5’SS sequence preference are not associated with compensatory changes in U6 snRNA sequence.
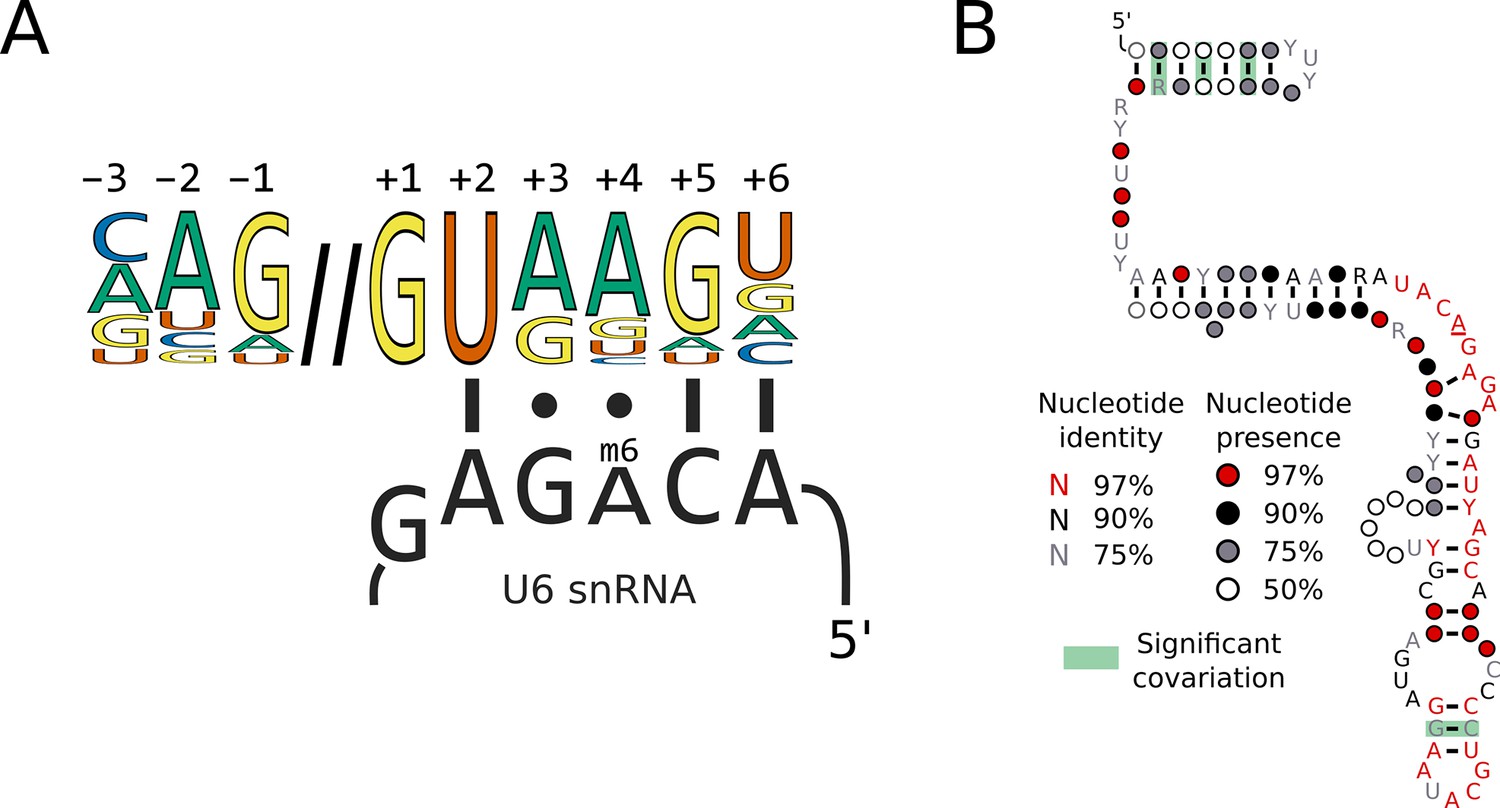
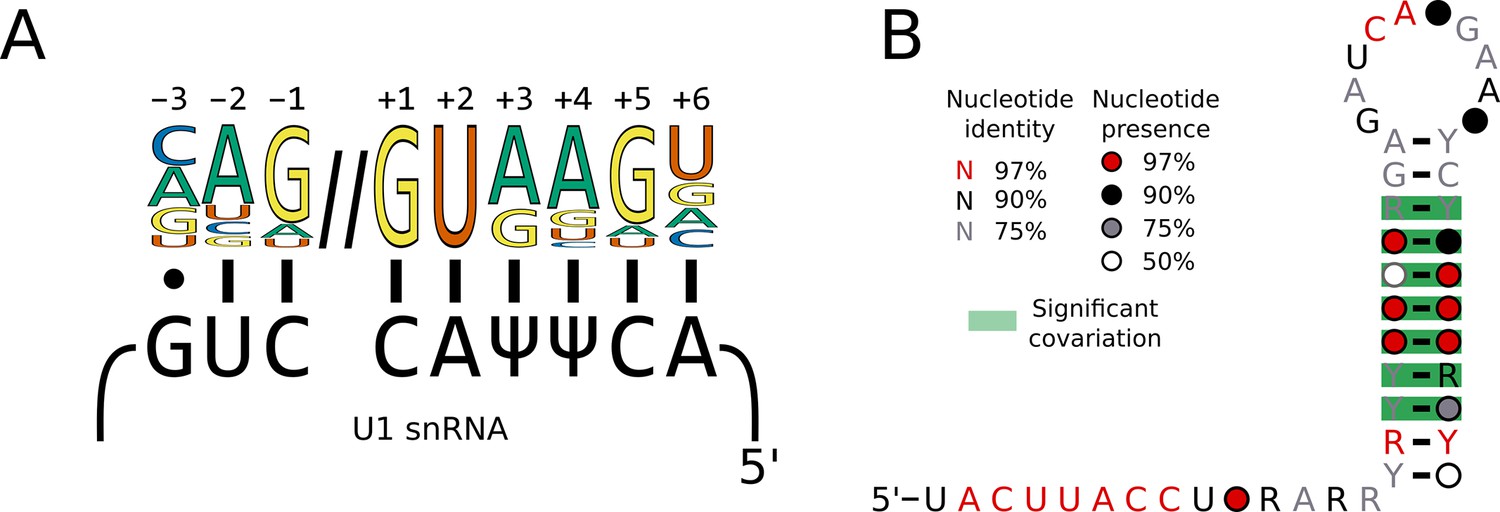
(A) Diagram showing the interaction of the U6 snRNA ACAGA box with the approximate human 5'SS consensus sequence. The methylated position of the ACAGA box is located opposite the 5'SS +4 position. (B) Conservation of U6 snRNA positions calculated from best U6 snRNA sequences predicted from genomes for 240 species (including 230 Saccharomycotina and 10 outgroups) using Infernal and plotted onto the predicted structure using R-scape and R2R. The predicted structure is derived from the predicted human U6 snRNA structure (Aoyama et al., 2020). All the positions in the ACAGA box were 100% conserved across all 240 species.
Figure 3—figure supplement 1
Switches in 5’SS sequence preference are not associated with compensatory changes in U1 snRNA sequence.
(A) Diagram showing the interaction of the U1 snRNA 5'SS interacting site with the approximate 5'SS consensus sequence of humans. In humans and S. cerevisiae, the 5'SS +4 position is located opposite a pseudouridylated uridine. (B) Conservation of the 5’ end and stem 1 of the U1 snRNA positions calculated from best U1 snRNA stem 1 sequences predicted from genomes for 236 species (including 227 Saccharomycotina and 9 outgroups) using Infernal and plotted onto the predicted structure using R-scape and R2R. All the positions in the 5’SS interacting region were 100% conserved across all species.
Figure 4 with 1 supplement
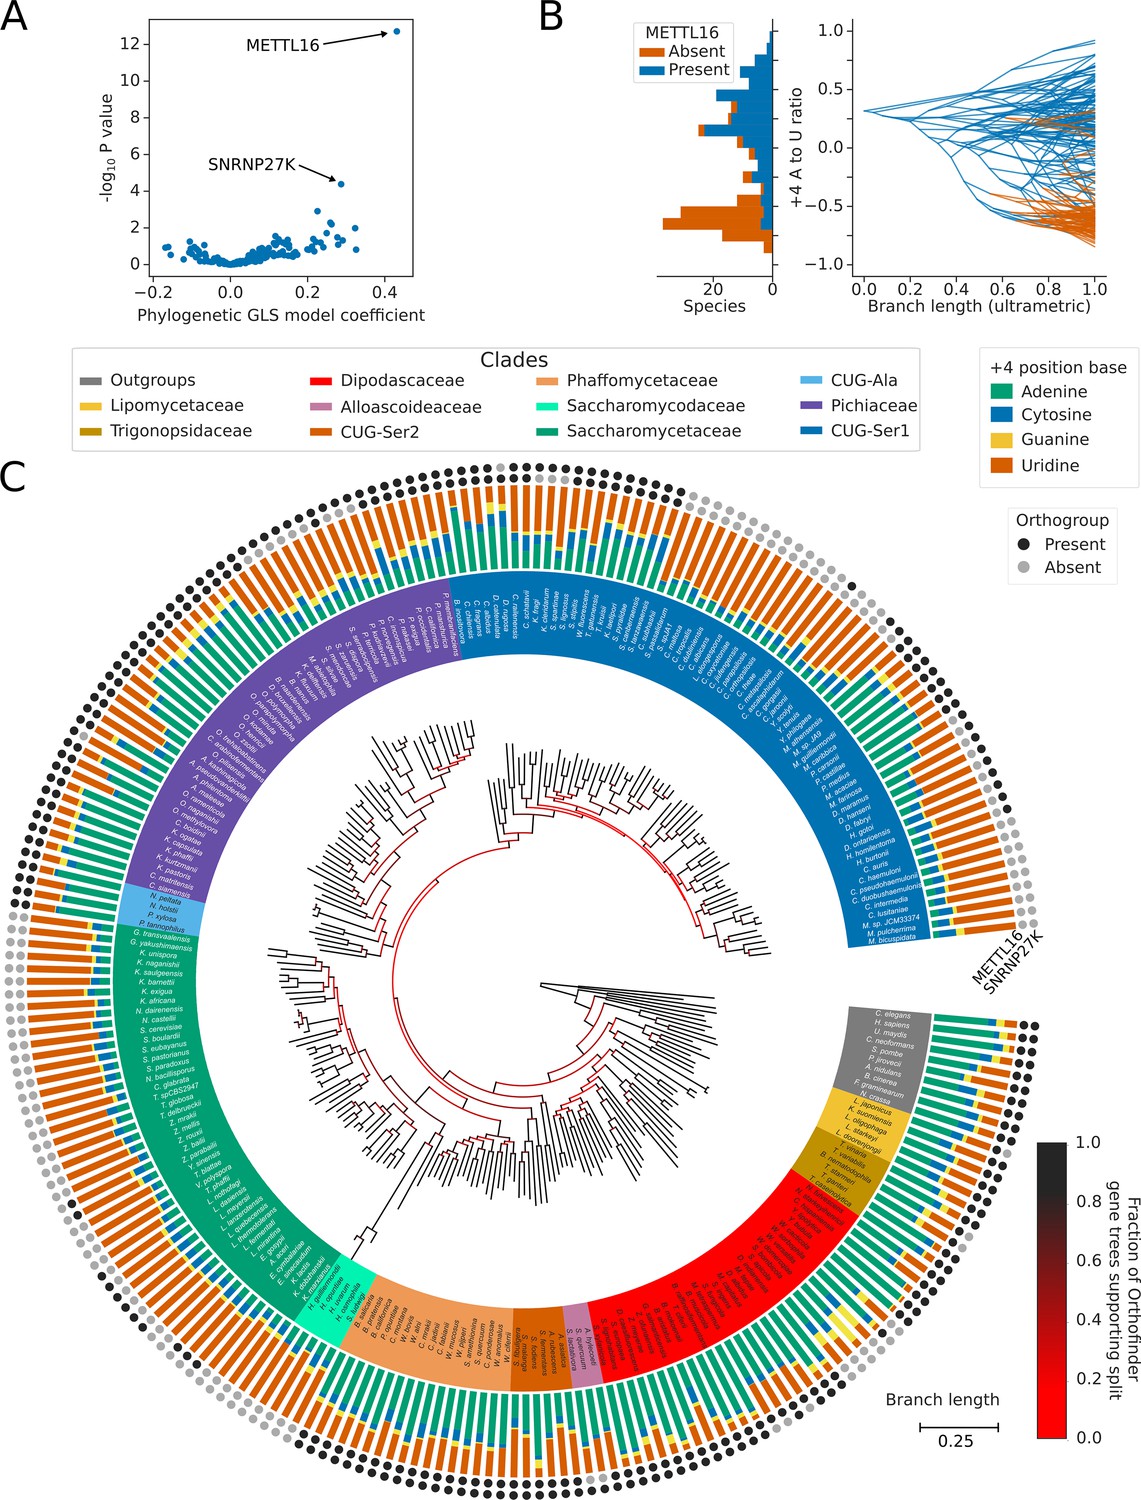
Inter-species association mapping links METTL16 to 5’SS +4 sequence preference.
(A) Volcano plot showing the results of the PGLS analysis of the 5’SS +4 A to U ratio phenotype for orthogroups corresponding to known human splicing factors and METTL16. The magnitude and directionality of the model coefficients (x-axis) are used as a measure of effect size and direction of effect on phenotype, respectively. (B) Stacked histogram and traitgram showing the distribution of 5’SS +4 A to U ratio phenotypes for species which retain or lack a METTL16 ortholog. Ancestral loss events shown on the traitgram are estimated using Dollo parsimony. (C) Circular tree showing the full phylogenetic relationship between 240 Saccharomycotina species identified using Orthofinder. Bifurcations are colored by confidence, calculated using the number of single-locus gene trees that support the bifurcation in the Orthofinder STAG algorithm (Emms and Kelly, 2019; Emms and Kelly, 2018). Clades defined in Figure 2A have been colored accordingly. Stacked bar charts show the 5’SS +4 position nucleotide fractions of each species identified from conserved introns. Outer circles show the presence (black) or absence (grey) of an ortholog from the orthogroups representing METTL16 (inner ring) and SNRNP27K (outer ring), respectively.
Figure 4—figure supplement 1
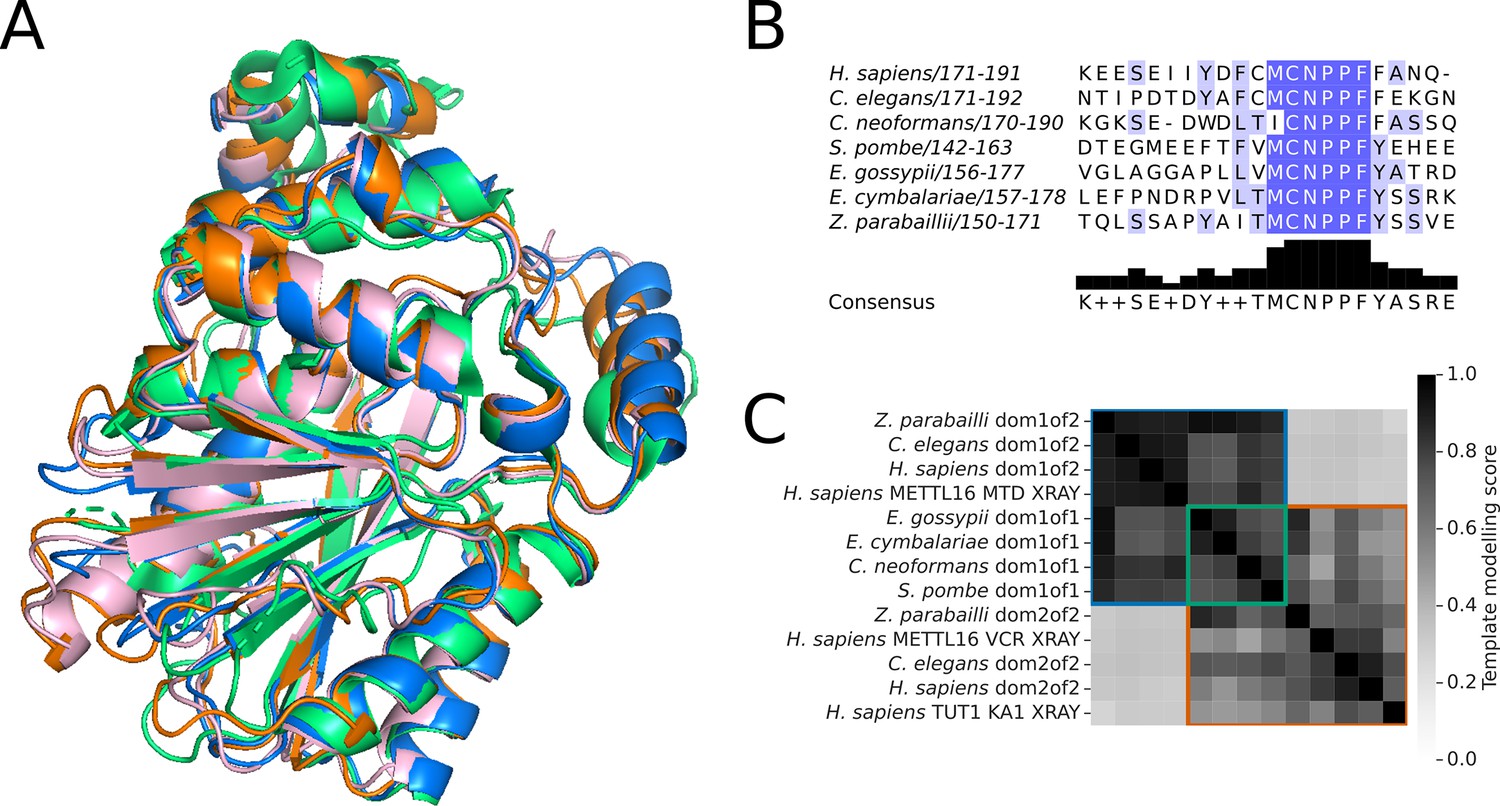
Structural analysis of METTL16 orthologs in the Saccharomycetaceae clade.
(A) Superimposition of the structure of human METTL16 MTD (green) solved by X-ray crystallography (PDB: 6DU4) with the Alphafold2 predicted structures of the MTD domains of putative METTL16 orthologs from E. gossypii (pink), E. cymbalariae (orange), and Z. parabailli (blue). (B) Multiple sequence alignment showing the conservation of the catalytic NPPF motif of METTL6 in the putative orthologs from subgenera of Eremothecium and Zygosaccharomyces. Generated using Jalview (Procter et al., 2021) (C) Heatmap showing the pairwise TMscore of segmented domains from the Alphafold2 predictions of METTL16 orthologs from Eremothecium and Zygosaccharomyces species, with selected outgroups. The X-ray structures of human METTL16 MTD and VCR, and TUT1 KA-1 are included as positive controls. Domains are grouped into clusters (diagonal boxes) using the same color scheme as in Figure 1A.
Figure 5 with 1 supplement
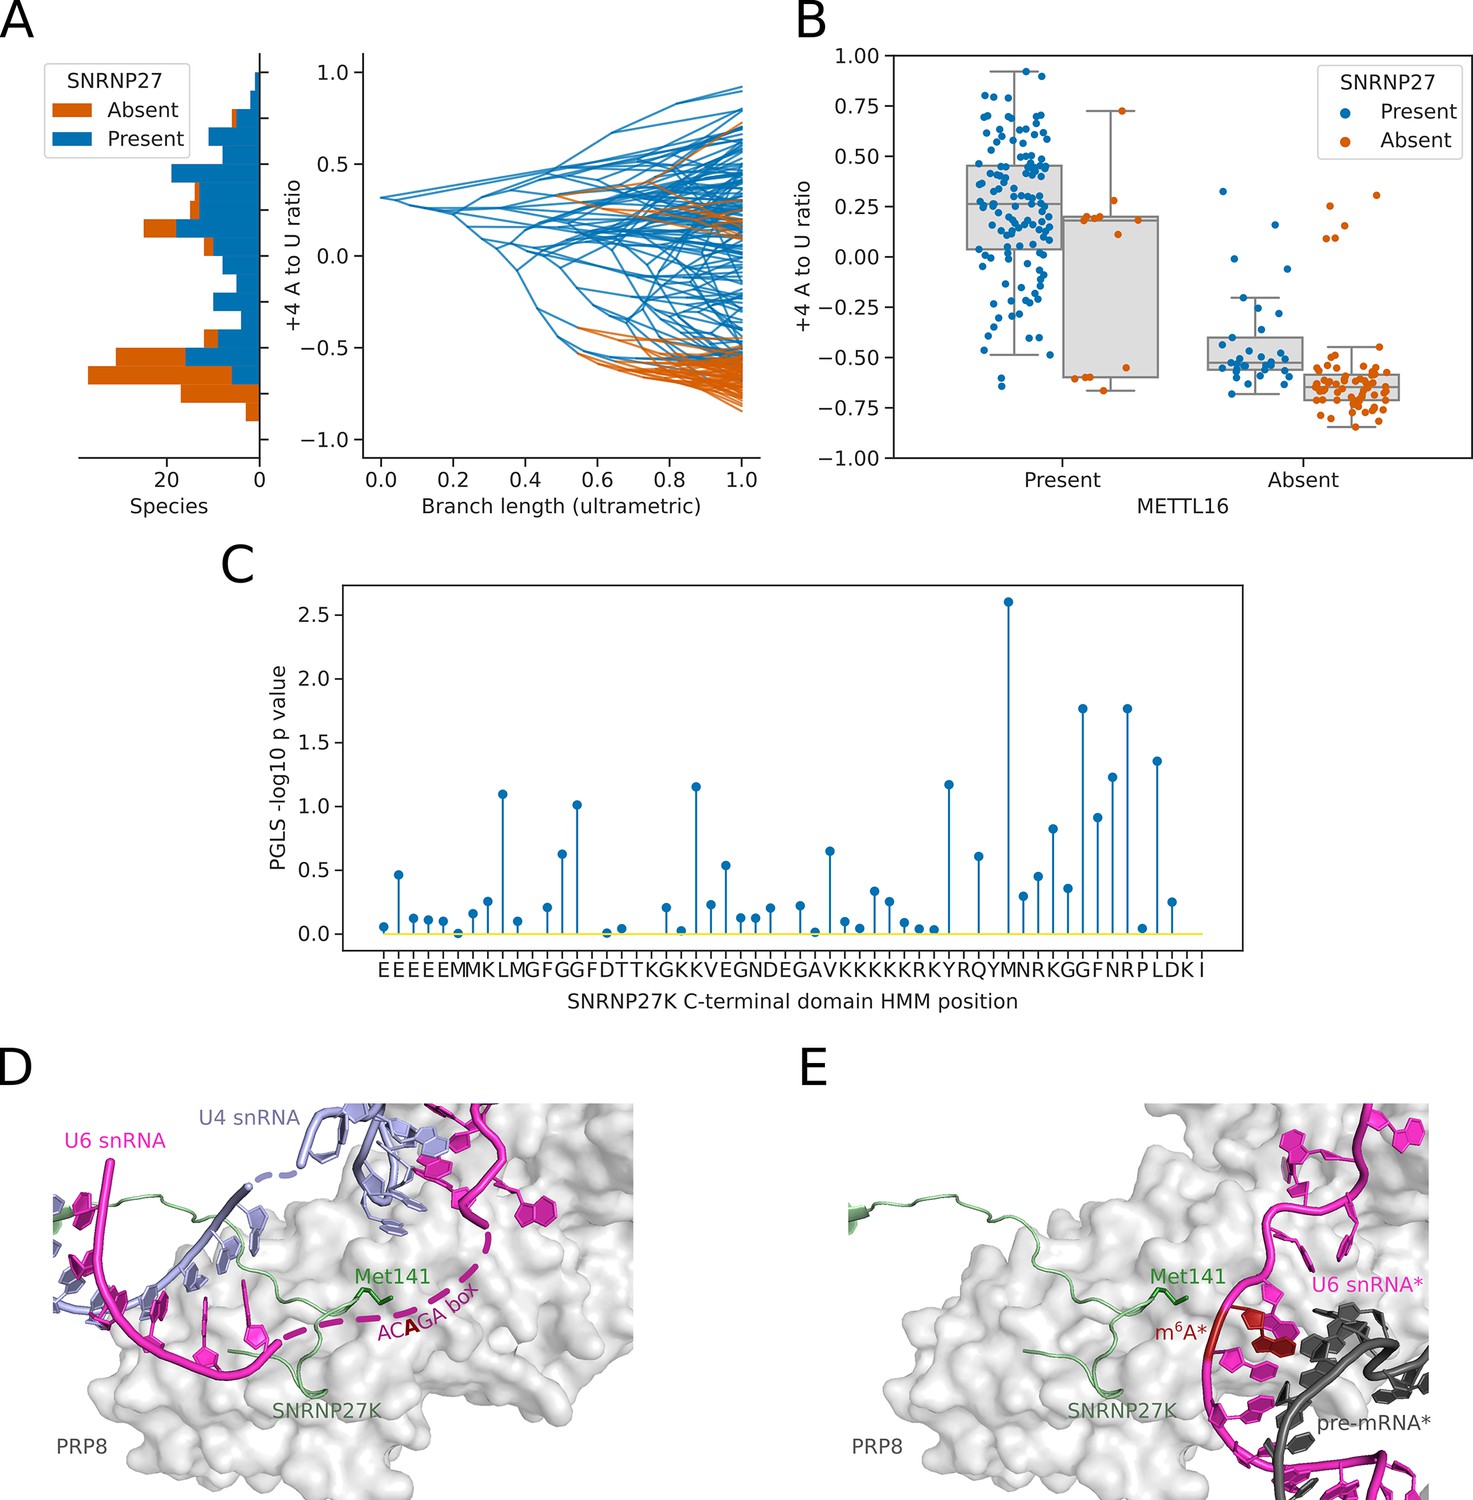
Inter-species association mapping links SNRNP27K Methionine 141–5’SS sequence preference.
(A) Stacked histogram and traitgram showing the distribution of 5’SS +4 A to U ratio phenotypes for species which retain or lack a SNRNP27K ortholog. Ancestral loss events shown on the traitgram are estimated using Dollo parsimony. (B) Boxplots showing the distribution of 5’SS +4 A to U ratio phenotypes for species retaining or lacking a SNRNP27K ortholog, whilst also controlling for the presence or absence of a METTL16 ortholog. (C) Stem plot showing the association of individual conserved positions in the C-terminus of SNRNP27K with the 5’SS +4 A to U ratio phenotype in 158 species retaining a SNRNP27K ortholog. The most strongly associated position is Met141, which is in extreme proximity to the ACAGA box in the pre-B complex. (D) Cryo-EM snapshot of the C-terminus of SNRNP27K in the pre-B complex, in close proximity to the region occupied by the flexible ACAGA box of the U6 snRNA. The surface of PRP8 is shown in grey. (E) Overlayed Cryo-EM snapshots showing the position of SNRNP27K in the pre-B complex, relative to the position of the ordered U6/5’SS helix in the B complex. Positioning of the components labelled with asterisks was determined relative to the position of pre-B complex PRP8 by the superimposition of the PRP8 structures from the pre-B and B complexes.
Figure 5—figure supplement 1
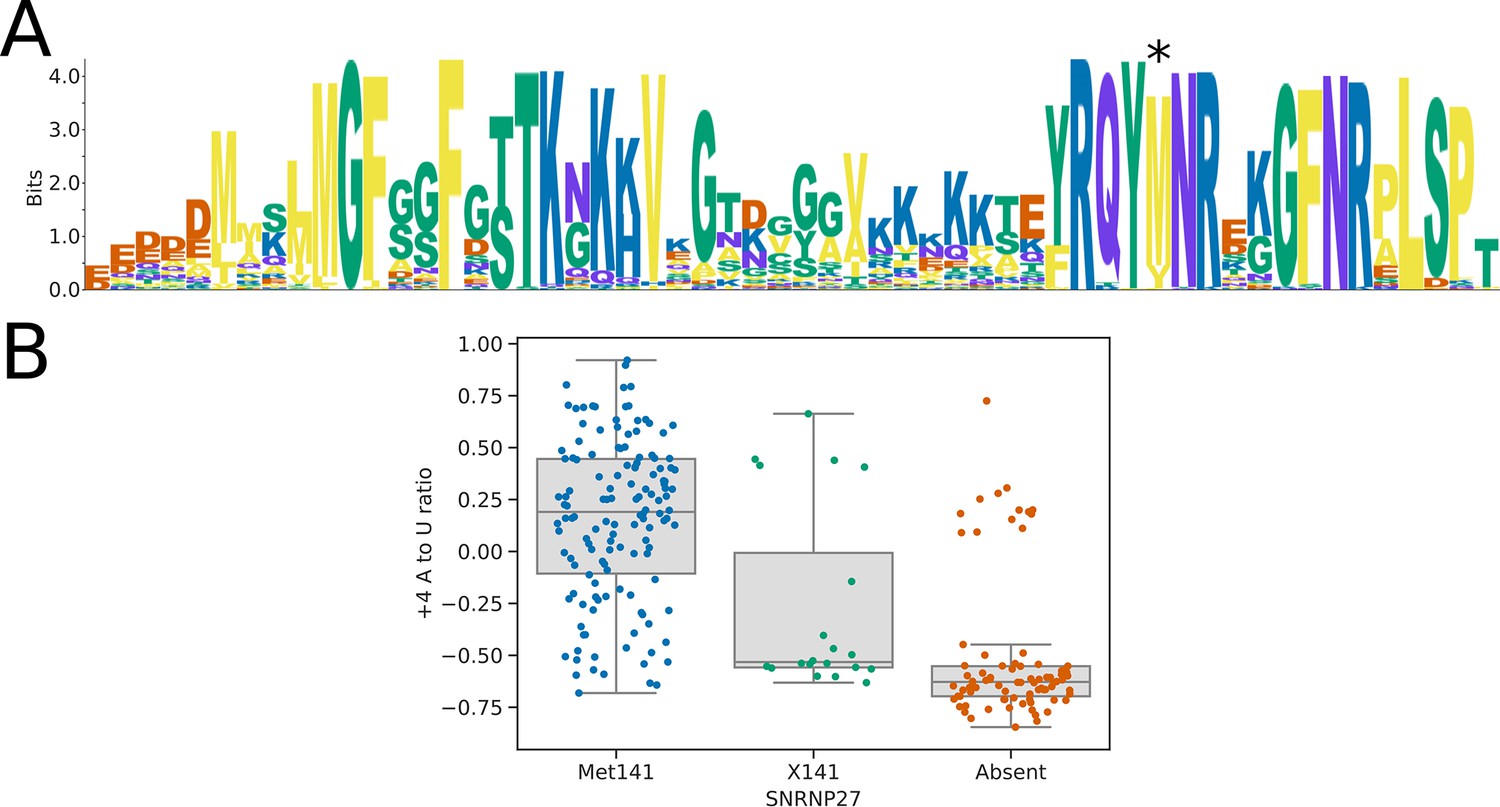
Sequence analysis of the SNRNP27K C-terminal domain.
(A) Sequence logo showing the alignment of the SNRNP27K orthologs from 158 species to the SNRNP27K C-terminal domain pHMM model. Position 141 (marked with an asterisk) is most commonly occupied by a methionine residue but is replaced in some species with a valine or isoleucine. (B) Boxplots showing the distribution of 5’SS +4 A to U ratio phenotypes for species retaining a SNRNP27K ortholog with a methionine in the pHMM alignment position corresponding to human Met141, compared to those with a different residue at this position (X141), and those that lack a SNRNP27K ortholog entirely.
Figure 6 with 1 supplement
5’SS +4 sequence preference interacts with intron number and U5/U6 interaction strength patterns.
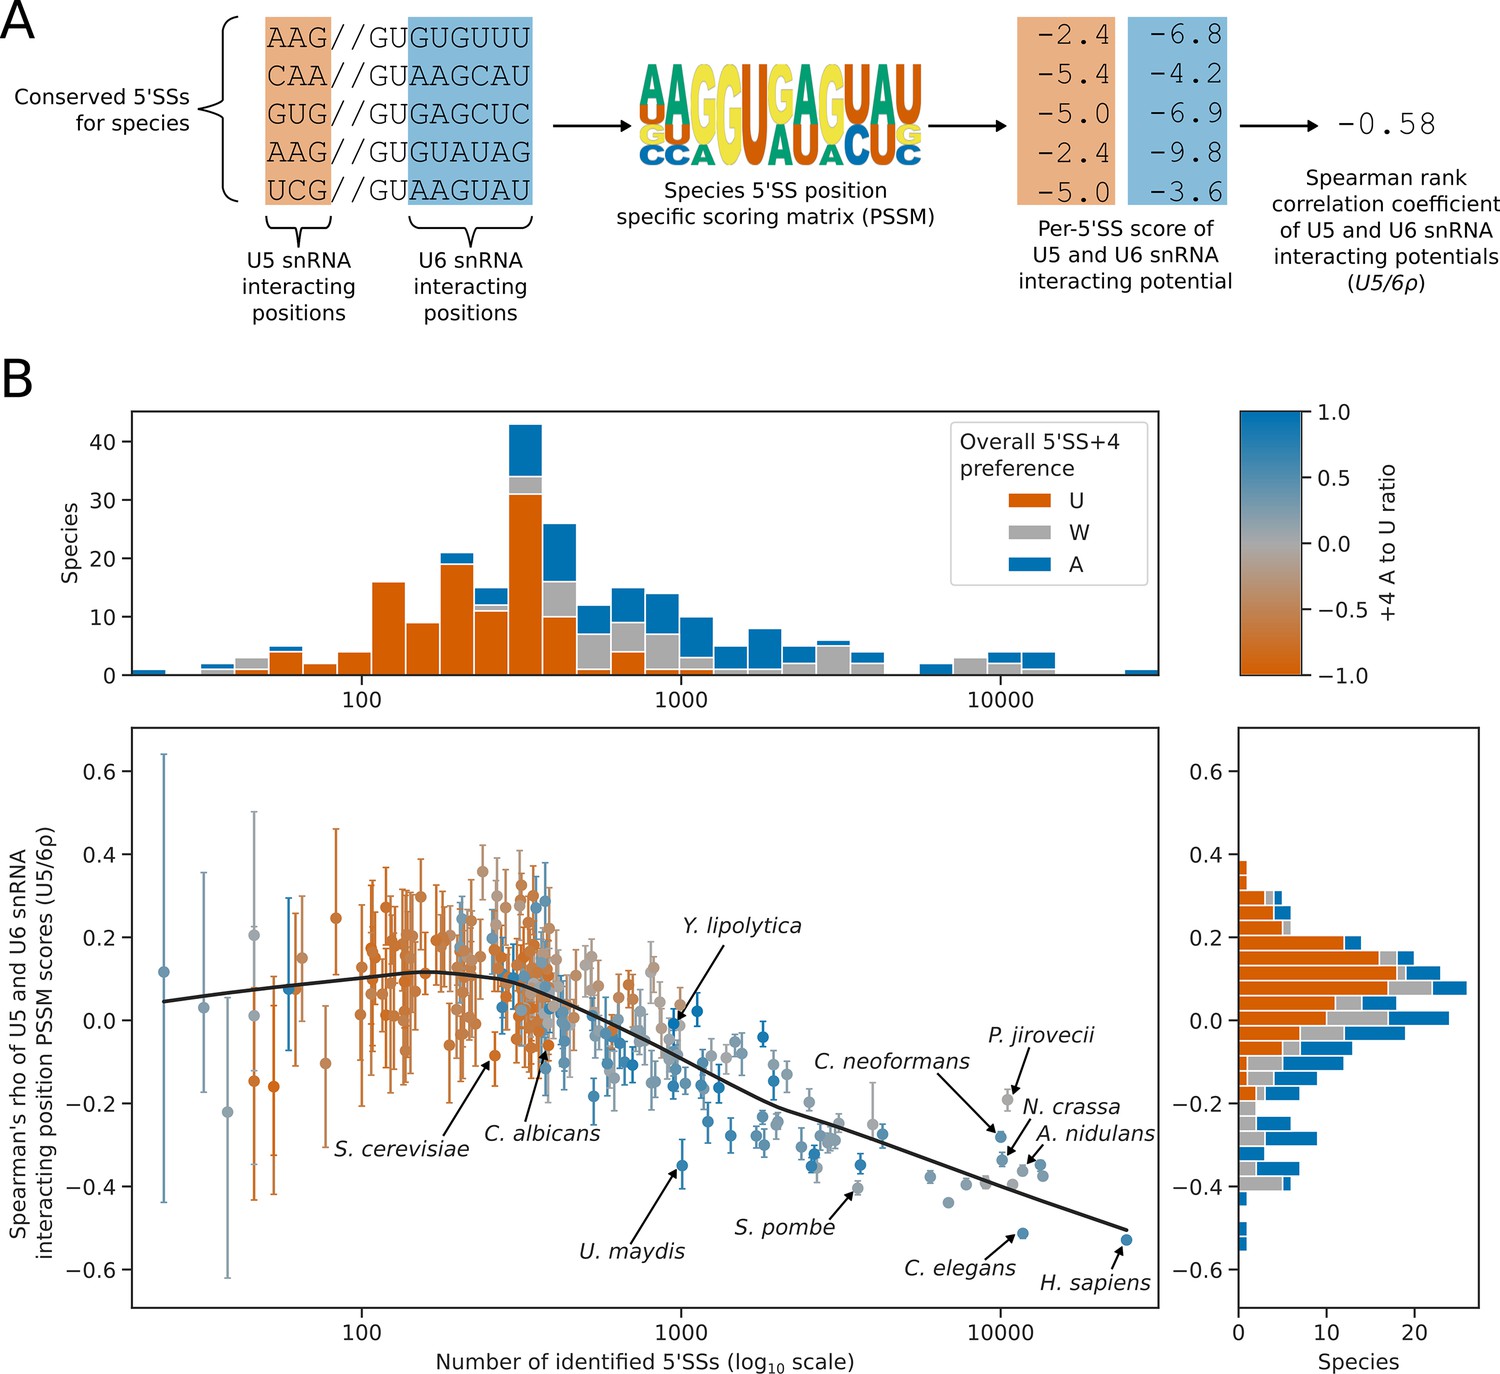
(A) Diagram showing the calculation of the U5/6ρ metric. For each species, all conserved 5’SSs were used to generate a log2 transformed position specific scoring matrix (PSSM) representing the consensus 5’SS sequence in that species. This PSSM was then used to score how well each individual 5’SS matched the consensus at the U5 and U6 snRNA interacting positions. These scores were used as a measure of U5 and U6 snRNA interaction potential for each 5’SS. Per-5’SS U5 and U6 snRNA interaction potentials were then correlated using the Spearman rank method to give a correlation coefficient for each species. This metric is referred to as U5/6ρ. In the example given, the species has a negative U5/6ρ indicating an overall anti-correlation between the U5 and U6 snRNA interaction potentials of individual 5’SSs. (B) Scatterplot with marginal histograms showing the relationship between the number of conserved introns (scatterplot x-axis), the correlation of U5 and U6snRNA interaction potentials (U5/6ρ, scatterplot y-axis), and 5’SS +4 nucleotide preference (color). Marginal histograms show the distribution of conserved intron size (top margin) and U5/6ρ (right margin) amongst species. For scatterplot points, 5’SS +4 A to U ratio is shaded using the color map shown on the top right. For marginal histograms, 5’SS +4 preference is discretised into an overall preference for either A (A to U ratio >0.2, blue), U (A to U ratio <= –0.2, orange), or no overall preference (–0.2<A to U ratio ≤ 0.2, grey). Confidence intervals for the U5/6ρ metric were obtained by bootstrapped resampling of conserved 5’SSs for each species before performing the calculations described in (A). The lowess (locally weighted scatterplot smoothing) regression line indicates a strong negative relationship between U5/6ρ and conserved intron number in intron rich species, compared to a weak relationship for intron poor species.
Figure 6—figure supplement 1

Interspecies association mapping of the U5/6ρ phenotype.
Volcano plot showing the results of the PGLS analysis of the U5/6ρ phenotype for orthogroups corresponding to known human splicing factors and METTL16. The magnitude and directionality of the model coefficients (x-axis) are used as a measure of effect size and direction of effect on phenotype, respectively.
Author response image 1
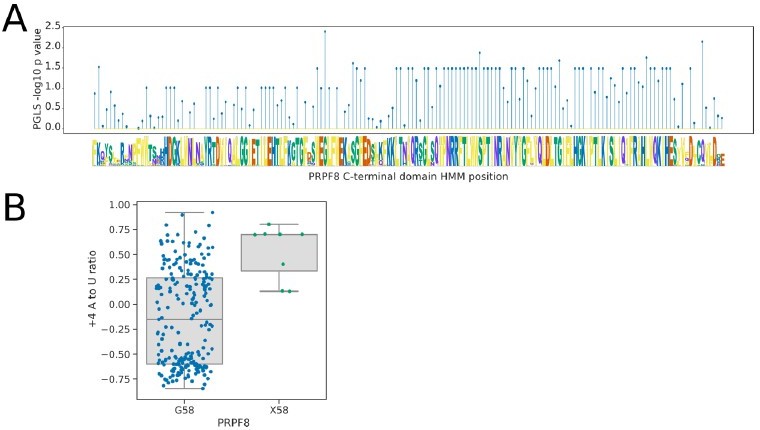
Analysis of the U6-interacting region of the PRPF8 linker domain using pHMMPGLS analysis.
(A) Stem plot showing the association of individual conserved positions in the U6 snRNA interacting domain of PRPF8 with the 5’SS+4 A to U ratio phenotype in 239 species retaining a detectable PRPF8 ortholog. (B) Boxplot showing the distribution of 5’SS+4 A to U ratio phenotypes for species retaining a PRPF8 ortholog with a Glycine at pHMM alignment position 58, compared to those with a different or unalignable residue at this position (X58). Six of the eight species without a Glycine at this position are from the clade Dipodascaceae and have PRPF8 orthologs that align poorly to the pHMM, suggesting that this position itself may not be specifically important for the +4 phenotype.
Additional files
-
Supplementary file 1
Table containing the 240 genome assemblies used for phylogenetic association mapping.
All assemblies were downloaded from NCBI. Where available, RefSeq assemblies were preferred over GenBank.
- https://cdn.elifesciences.org/articles/91997/elife-91997-supp1-v2.xlsx
-
MDAR checklist
- https://cdn.elifesciences.org/articles/91997/elife-91997-mdarchecklist1-v2.docx
Download links
A two-part list of links to download the article, or parts of the article, in various formats.
Downloads (link to download the article as PDF)
Open citations (links to open the citations from this article in various online reference manager services)
Cite this article (links to download the citations from this article in formats compatible with various reference manager tools)
Inter-species association mapping links splice site evolution to METTL16 and SNRNP27K
eLife 12:e91997.
https://doi.org/10.7554/eLife.91997


