Proteomic and functional comparison between human induced and embryonic stem cells
- Molecular, Cell and Developmental Biology, School of Life Sciences, University of Dundee, United Kingdom
- Cell Signalling & Immunology, School of Life Sciences, University of Dundee, United Kingdom
- Human Pluripotent Stem Cell Facility, School of Life Sciences, University of Dundee, Dow St, Dundee DD1 5EH, United Kingdom
- Dundee Imaging Facility, School of Life Sciences, University of Dundee, United Kingdom
- MRC Protein Phosphorylation and Ubiquitylation Unit, School of Life Sciences, University of Dundee, United Kingdom
Figures
Figure 1 with 1 supplement
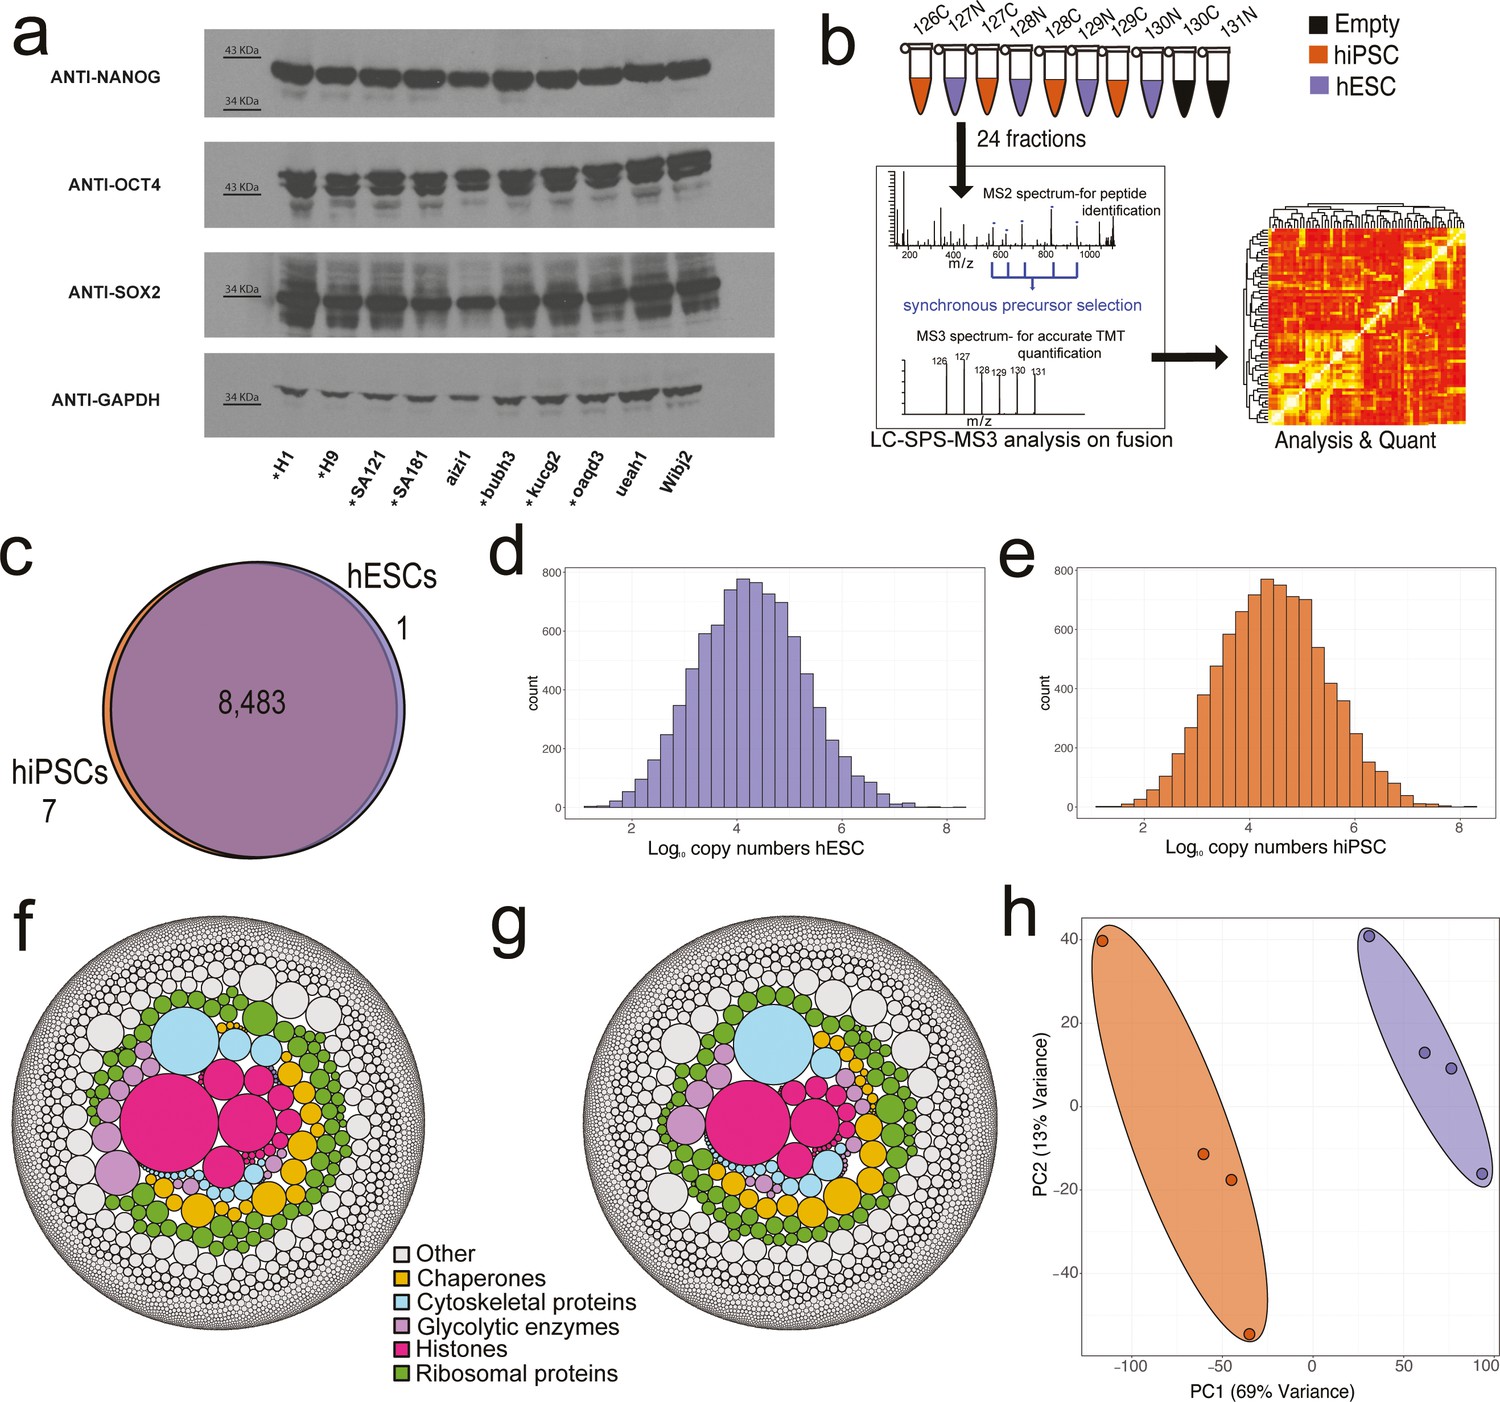
Proteomic overview.
(a) Western blots showing the expression of the pluripotency factors NANOG, OCT4, and SOX2 across all human embryonic stem cell (hESC) and human induced pluripotent stem cell (hiSPC) lines. The eight lines showed with * were used within the proteomic analysis. (b) Diagram showing the SPS-MS3 tandem mass tag (TMT) proteomic workflow used for the experiment. (c) Venn diagram showing the overlap of proteins identified within the hiPSC and hESC populations. (d) Average copy number histogram for the hESCs (N=4). (e) Average copy number histogram for the hiPSCs (N=4). (f) Bubble plot showing proteins coloured by specific categories where the size is represented by the average hESC estimated protein copy numbers. (g) Bubble plot showing proteins coloured by specific categories where the size is represented by the average hiPSC estimated protein copy numbers. (h) Principal component analysis (PCA) plot based on the log10 copy numbers for all eight stem cell lines. hESCs are shown in purple and hiPSCs in orange.
-
Figure 1—source data 1
PDF containing the western blots for Figure 1a.
- https://cdn.elifesciences.org/articles/92025/elife-92025-fig1-data1-v1.zip
-
Figure 1—source data 2
Original files for the western blots displayed in Figure 1a.
- https://cdn.elifesciences.org/articles/92025/elife-92025-fig1-data2-v1.zip
Figure 1—figure supplement 1
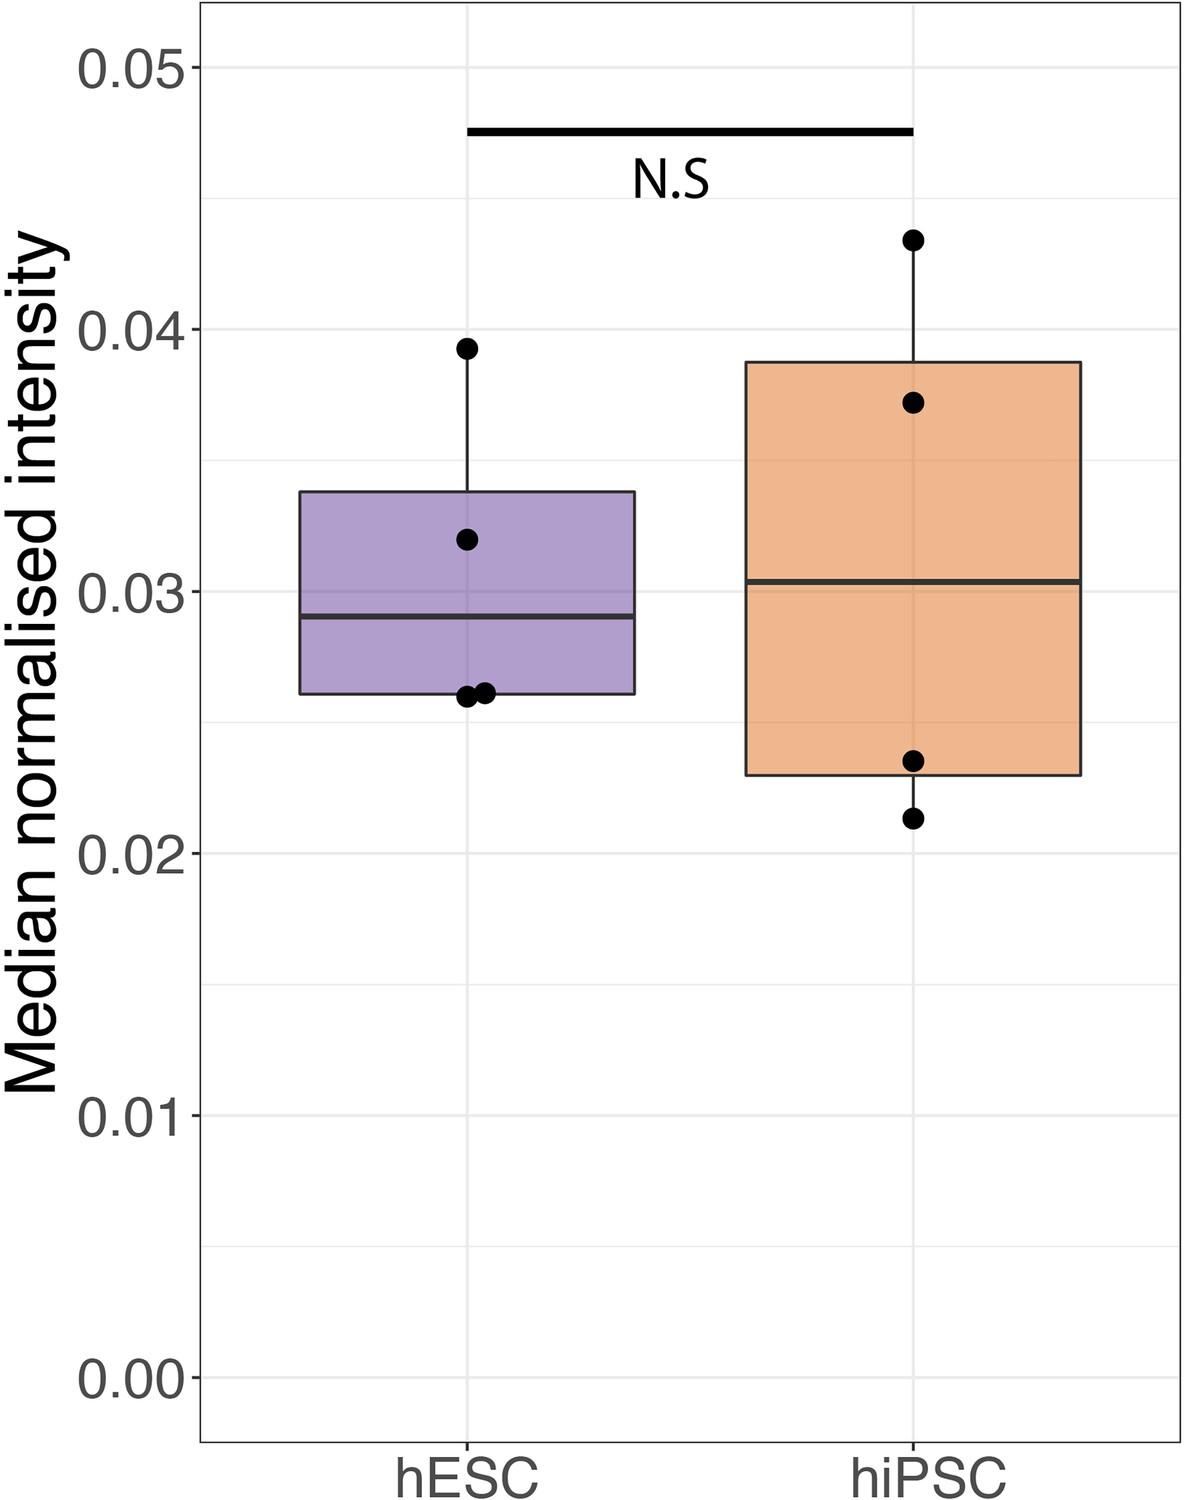
Box plot showing the sum of the normalised intensity for all histones across human embryonic stem cells (hESCs) and human induced pluripotent stem cells (hiPSCs).
For the boxplots, the bottom and top hinges represent the first and third quartiles. The top whisker extends from the hinge to the largest value no further than 1.5 × IQR from the hinge; the bottom whisker extends from the hinge to the smallest value at most 1.5 × IQR of the hinge.
Figure 2 with 1 supplement
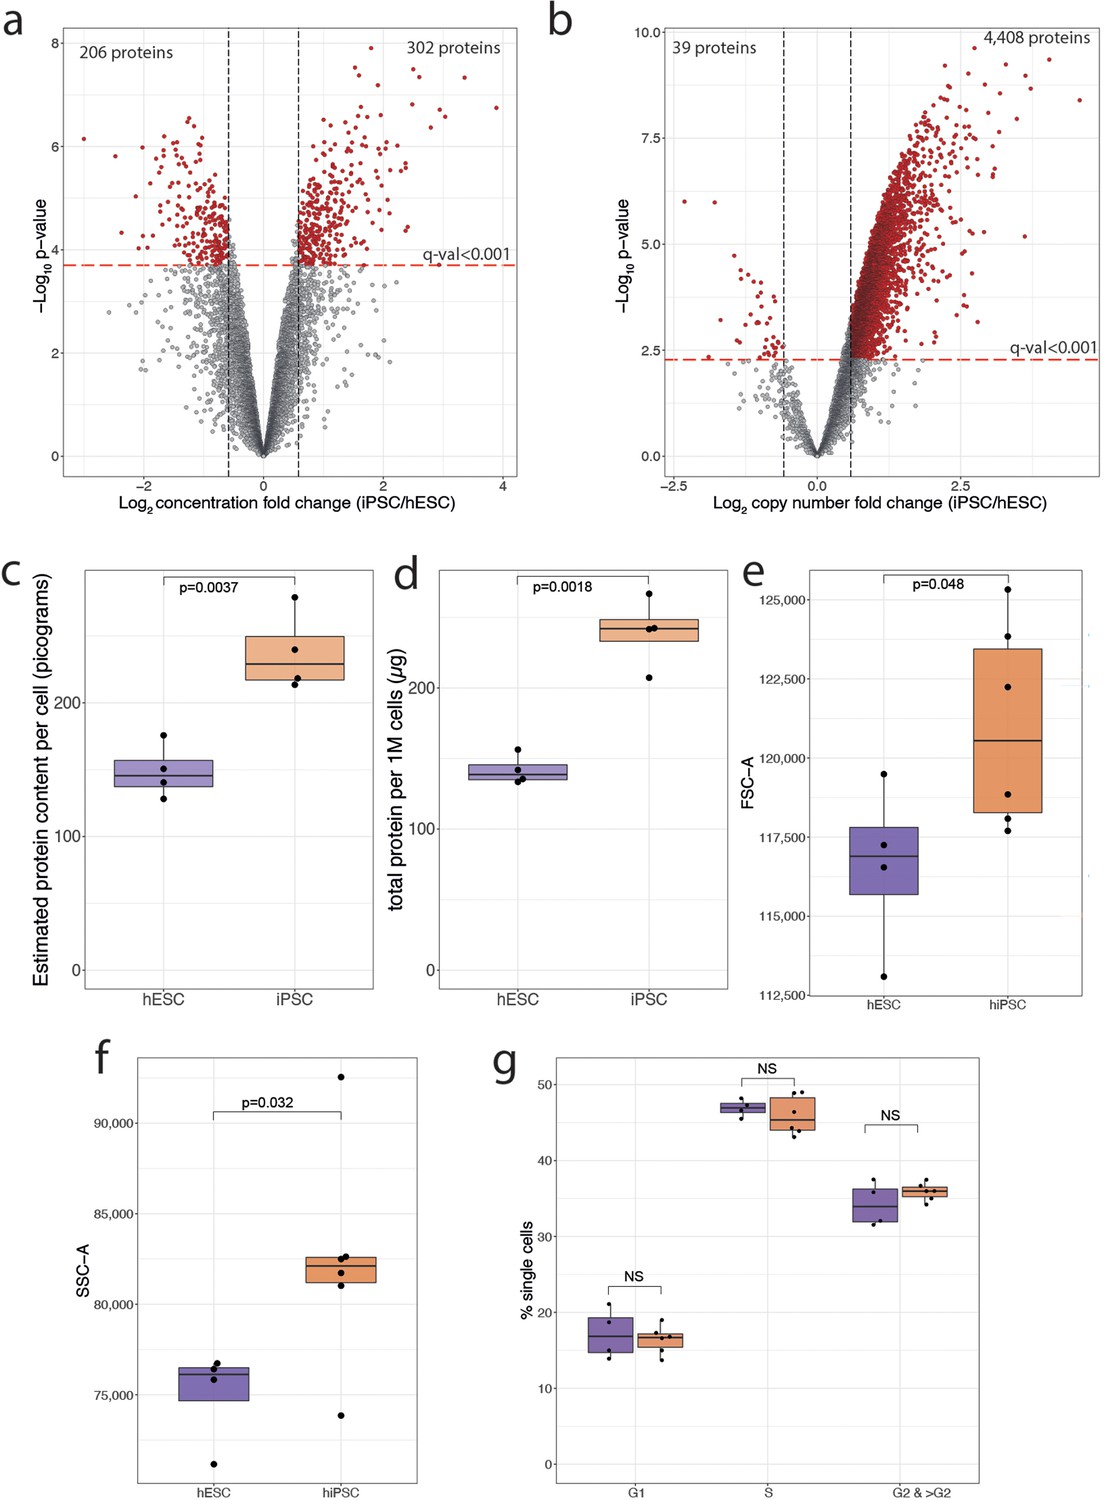
Normalisation and protein content.
(a) Concentration-based volcano plot showing the -log10 p-value and the log2 fold change comparing human induced pluripotent stem cells (hiPSCs) (N=4) to human embryonic stem cells (hESCs) (N=4). Elements shaded in red are considered significantly changed. All dots above the red line have a q-value lower than 0.001. (b) Copy number-based volcano plot showing the -log10 p-value and the log2 fold change comparing hESCs (N=4) to hiSPC (N=4). Elements shaded in red are considered significantly changed. All dots above the red line have a q-value lower than 0.001. (c) Boxplot showing the mass spectrometry (MS)-based estimated protein content for hESCs (N=4) and hiPSC(N=4). (d) Boxplot showing the protein amount per million cells derived from the EZQ Protein Quantification Kit for all hESCs (N=4) and hiPSC (N=4). (e) Boxplot showing the median forward scatter of hESCs (N=4) and hiPSCs (N=6). (f) Boxplot showing the median side scatter of hESCs (N=4) and hiPSCs (N=6). (g) Boxplot showing the median percentage of cells across cell cycle stages for hESCs (N=4) and hiPSCs (N=6). For all boxplots, the bottom and top hinges represent the first and third quartiles. The top whisker extends from the hinge to the largest value no further than 1.5 × IQR from the hinge; the bottom whisker extends from the hinge to the smallest value at most 1.5 × IQR of the hinge.
Figure 2—figure supplement 1
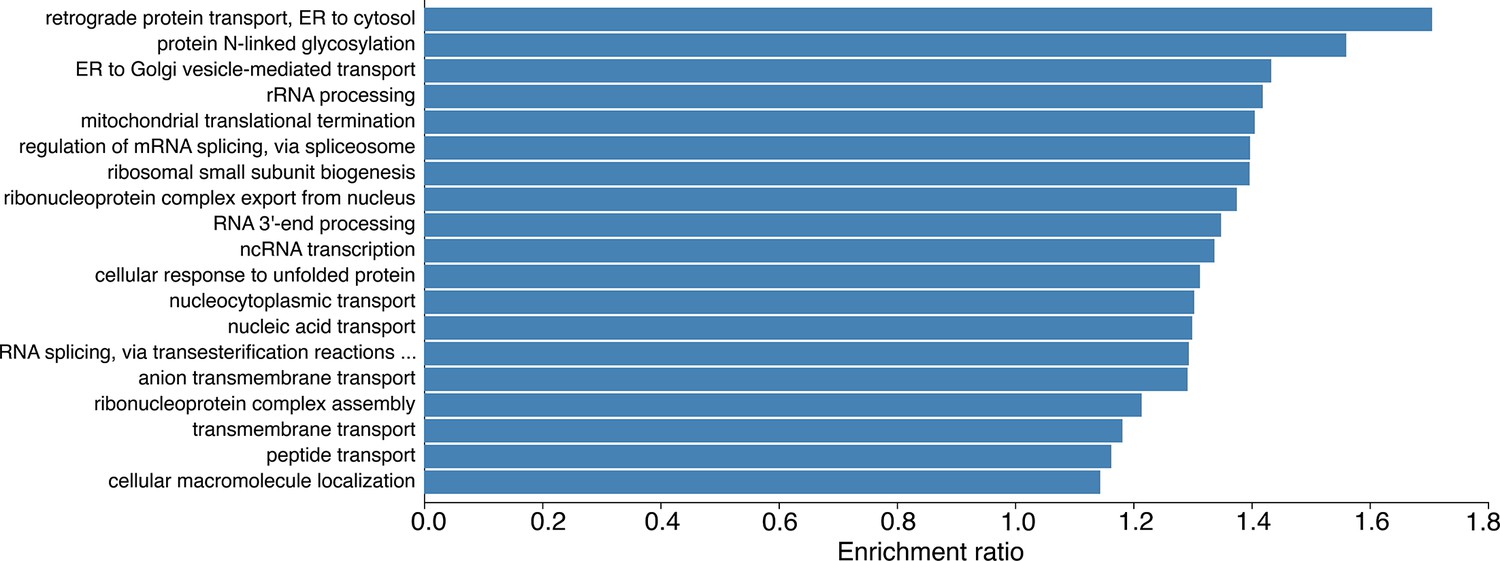
Barplot showing the results of a Gene Ontology Biological Process overrepresentation analysis for proteins that are significantly increased in human induced pluripotent stem cells (hiPSCs) compared to human embryonic stem cells (hESCs) in the copy number analysis.
Figure 3
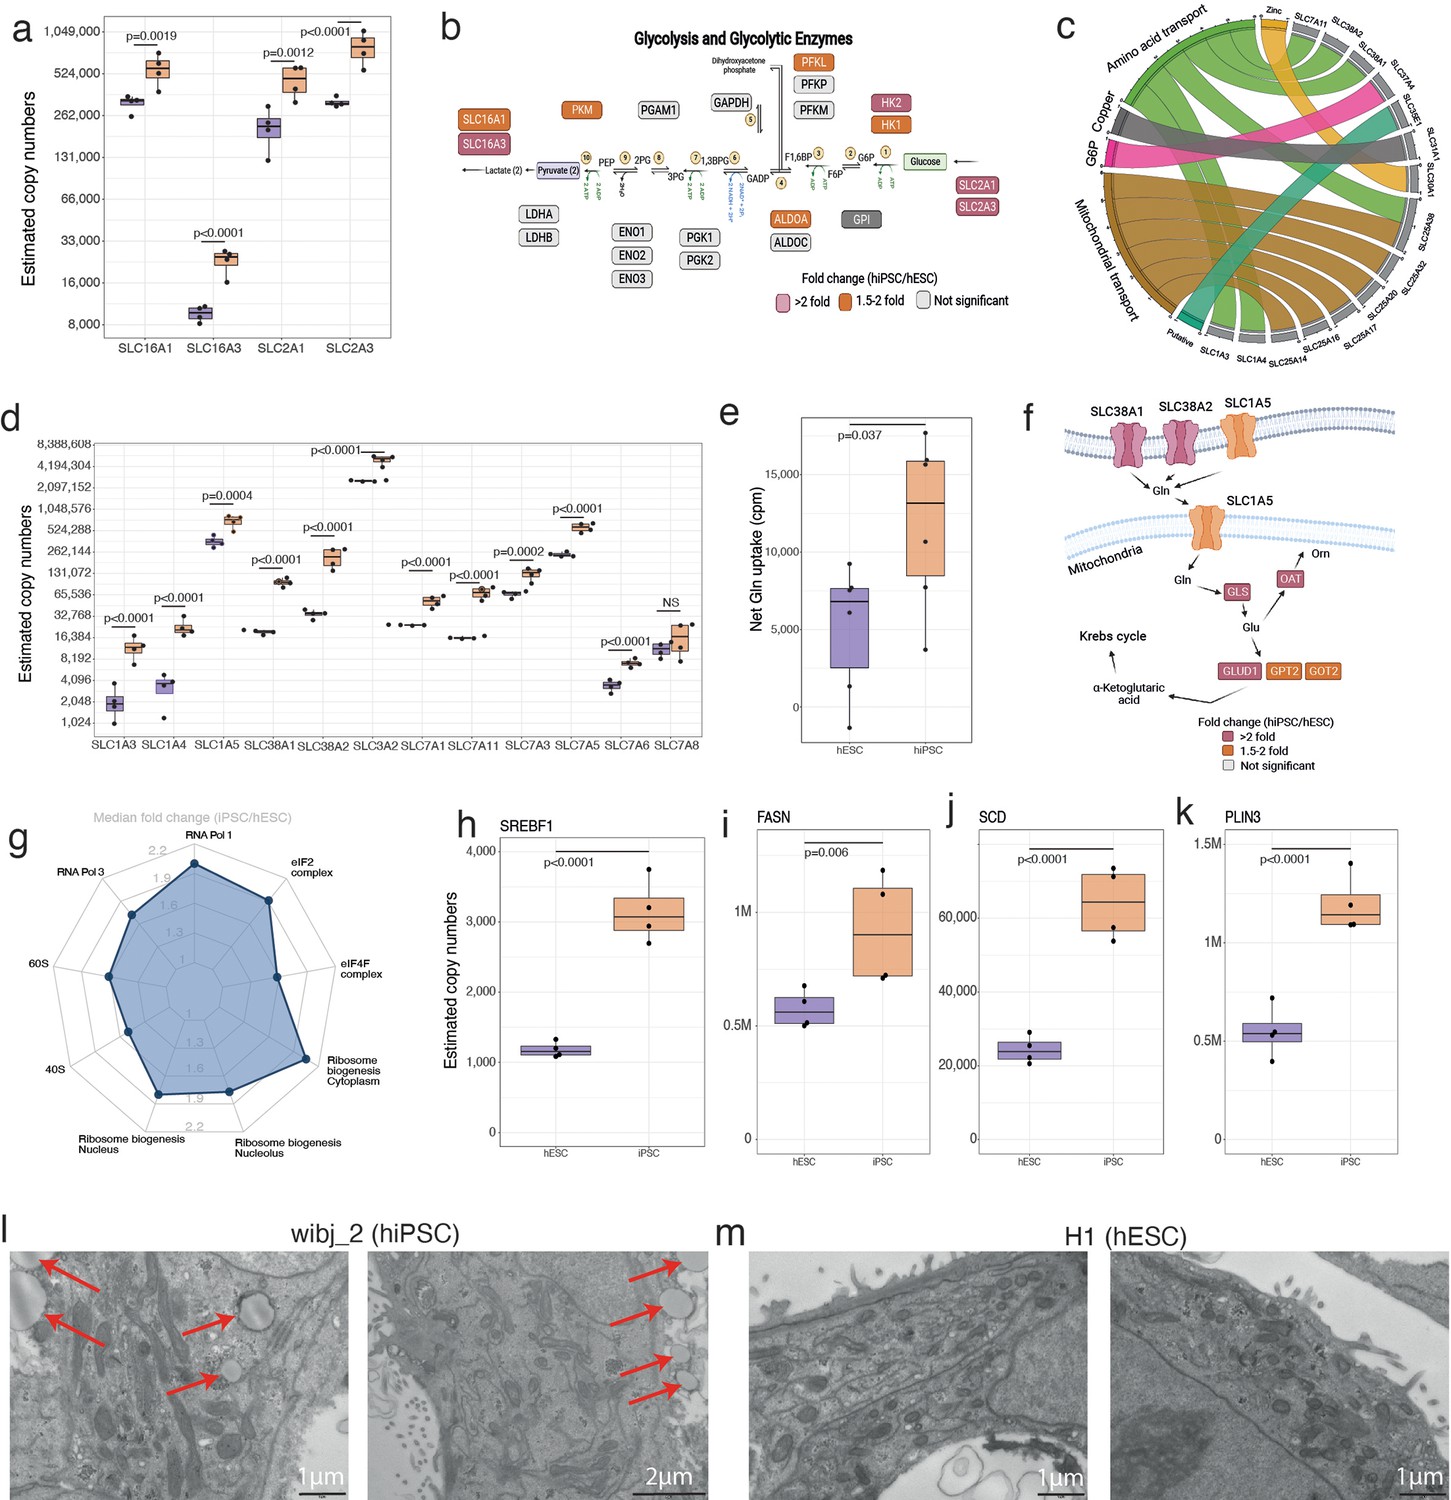
Fuelling growth.
(a) Boxplots showing the estimated copy numbers for the lactate (SLC16A1 and SLC16A3) and glucose transporters (SLC2A1 and SLC2A3) across human embryonic stem cells (hESCs) (N=4) and human induced pluripotent stem cell (hiPSC) (N=4). (b) Schematic showing the glycolytic proteins and their fold change in hESC vs hiPSCs. This panel was created using BioRender.com. (c) Chord diagram showing the 15 most upregulated solute carrier proteins along with their classification based on transport activities/localisation. (d) Boxplots showing the estimated copy numbers of the main amino acid transporters in hESCs (N=4) and hiPSC (N=4). (e) Boxplot showing the net glutamine uptake (see Materials and methods) in hESCs (N=6) and hiPSC (N=6). (f) Schematic showing the glutaminolysis proteins and their fold change in hESCs (N=4) and hiPSC (N=4). This panel was created using BioRender.com. (g) Radar plot showing the median fold change (hiPSC/ESC) for protein categories which are related to the pre-ribosomes. Boxplots showing the estimated copy numbers for (h) SREBF1, (i) FASN, (j) SCD, (k) PLIN3 in hESCs (N=4) and hiPSC (N=4). (l) Transmission electron microscopy images for wibj_2 (hiPSC). Lipid droplets are marked with red arrows. (m) Transmission electron microscopy images for H1 (hESC). For all boxplots, the bottom and top hinges represent the first and third quartiles. The top whisker extends from the hinge to the largest value no further than 1.5 × IQR from the hinge; the bottom whisker extends from the hinge to the smallest value at most 1.5 × IQR of the hinge.
Figure 4
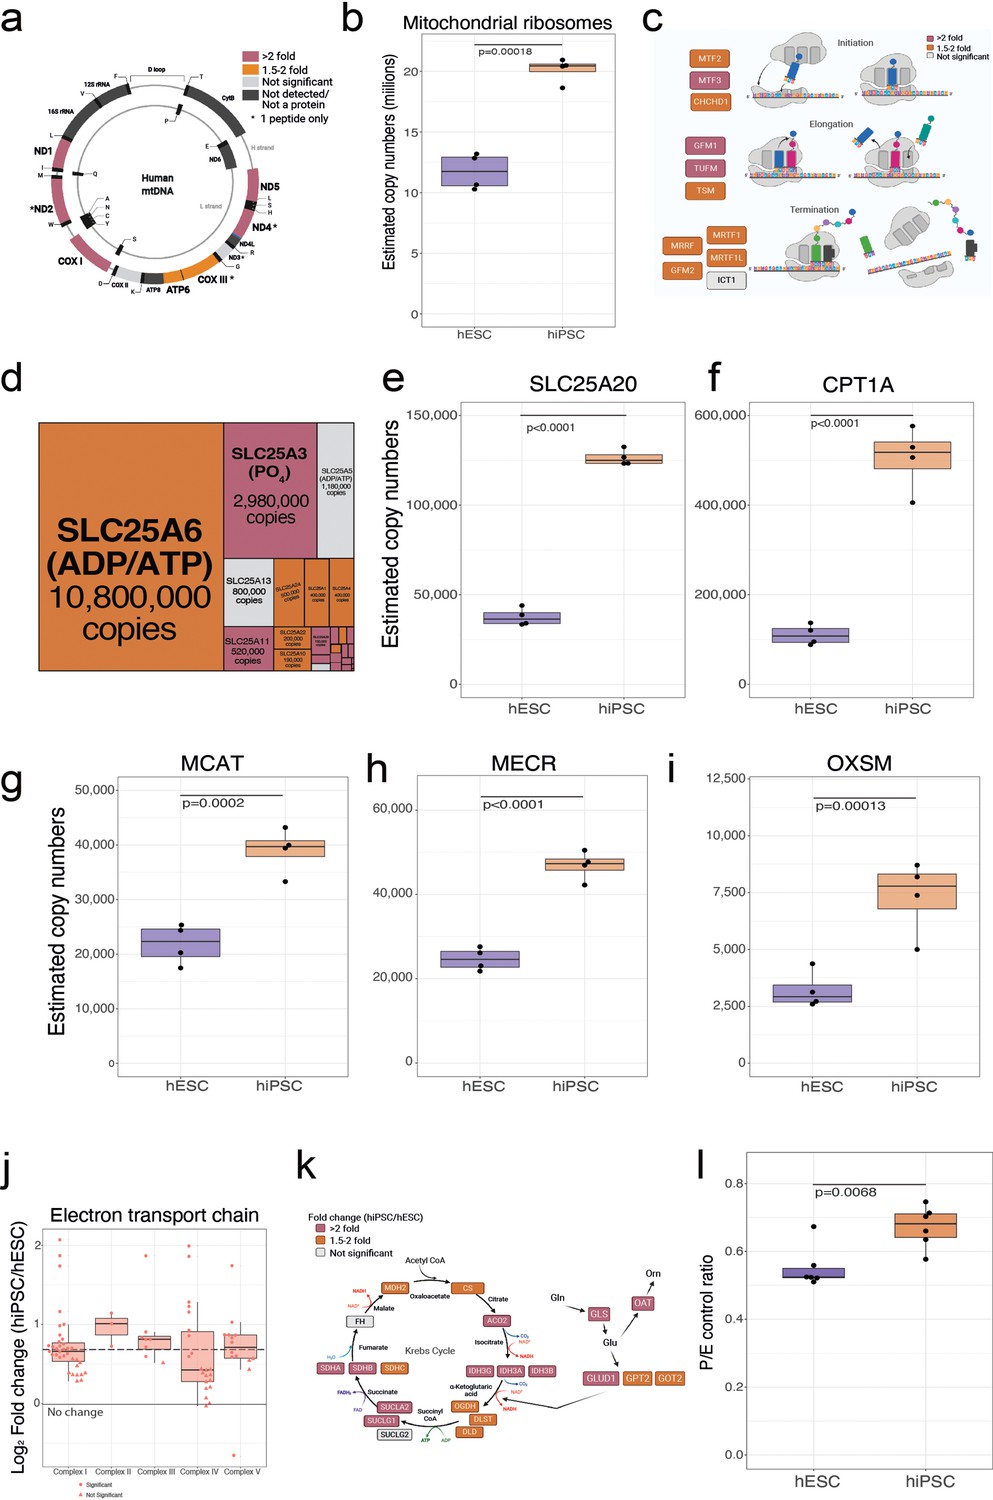
Mitochondrial differences.
(a) Schematic showing the mitochondrial genome encoded proteins and their fold change in human embryonic stem cells (hESCs) and human induced pluripotent stem cells (hiPSCs). This panel was created using BioRender.com. (b) Boxplot showing the estimated copy numbers of all mitochondrial ribosomal proteins hESCs (N=4) and hiPSC (N=4). (c) Schematic showing proteins involved in mitochondrial translation and their fold change (hiPSCs/hESCs). This panel was created using BioRender.com. (d) Treeplot showing all mitochondrial transporters, size is proportional to the median estimated copy numbers in hiPSCs (N=4). Boxplot showing the estimated copy numbers for (e) SLC25A20. (f) CPT1A. (g) MCAT, (h) MECR, (i) OSXM, in hESCs (N=4) and hiPSC (N=4). (j) Boxplot showing the log2 fold change (hiPSC/hESCs) for all subunits of the different complexes of the electron transport chain. The median fold change across all detected proteins is shown as a dotted line. (k) Schematic showing the fold change of critic acid cycle and glutaminolysis proteins in hiPSCs (N=4) vs hESCs (N=4). This panel was created using BioRender.com. (l) Boxplot showing the P (oxphos capacity)/E (electron transfer capacity) control ratio in wibj_2 (hiPSC; N=6) vs H1 (hESC; N=6). For all boxplots, the bottom and top hinges represent the first and third quartiles. The top whisker extends from the hinge to the largest value no further than 1.5 × IQR from the hinge; the bottom whisker extends from the hinge to the smallest value at most 1.5 × IQR of the hinge.
Figure 5
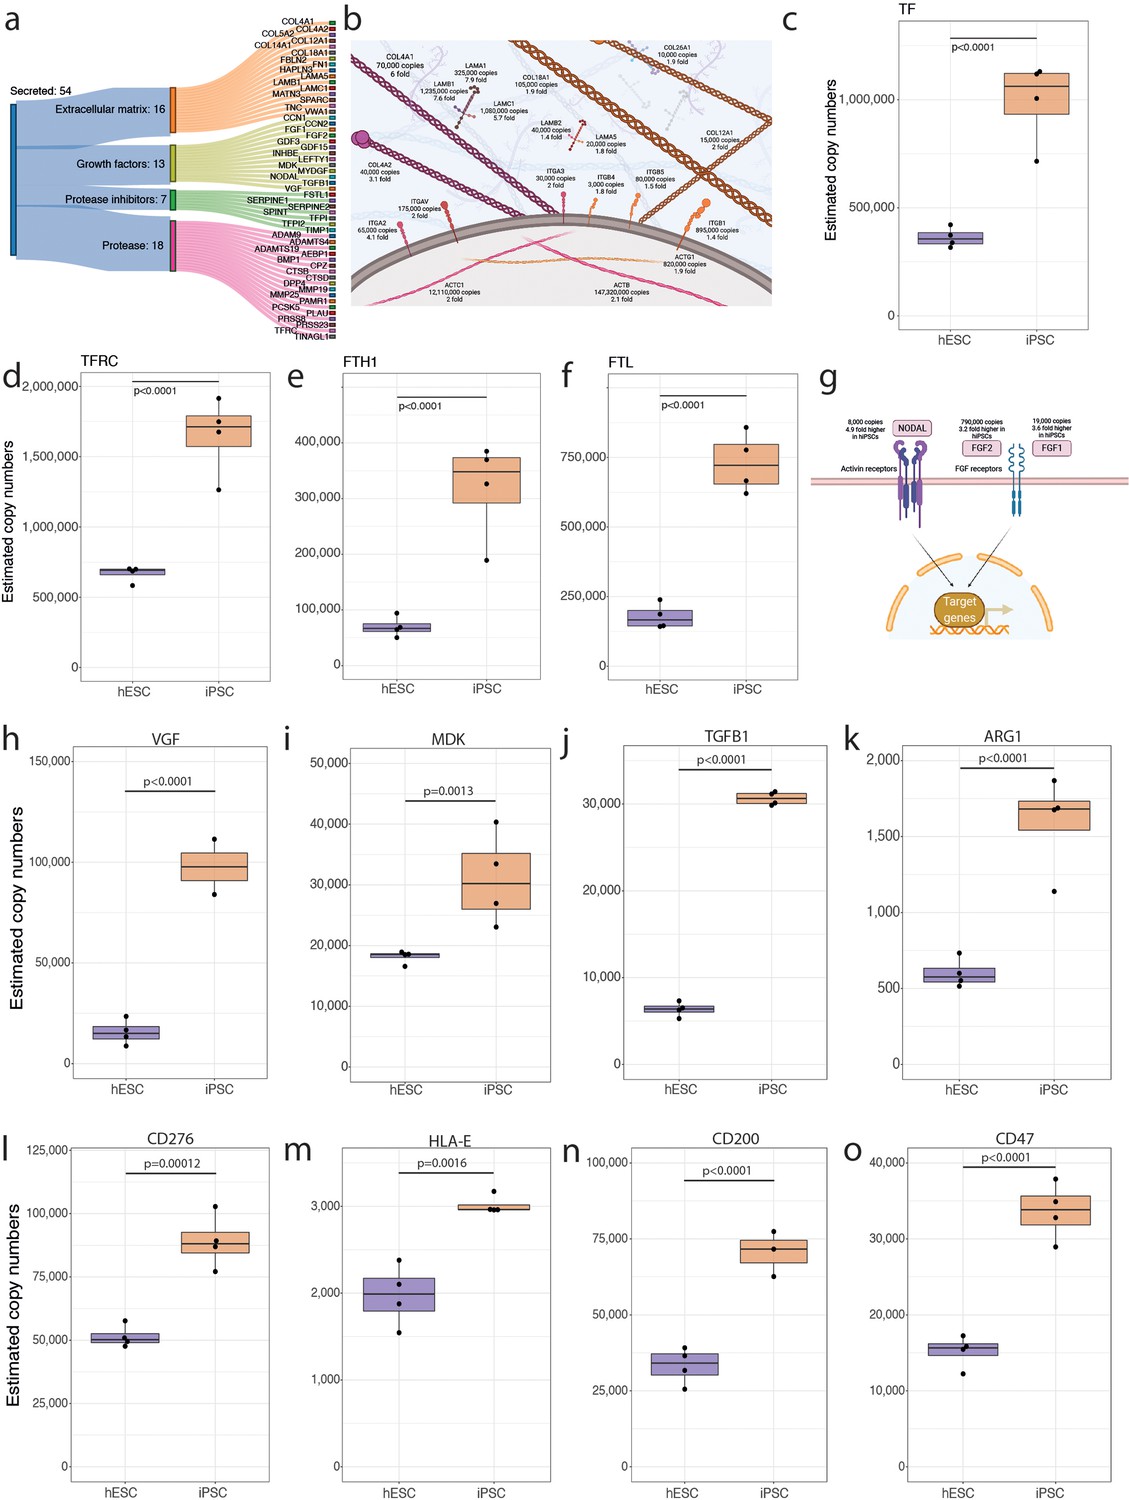
Secreted proteins.
(a) Sankey diagram showing the secreted proteins that belong to the extracellular matrix (ECM), growth factor, protease inhibitor, or protease categories and are significantly increased in abundance in human induced pluripotent stem cells (hiPSCs). (b) Schematic showing ECM proteins that are significantly increased in abundance in hiPSCs. Boxplot showing the estimated copy numbers for (c) TF, (d) TFRC, (e) FTH1, and (f) FTL in human embryonic stem cells (hESCs) (N=4) and hiPSC (N=4). (g) Schematic showing the changes in abundance in primed pluripotency growth factors. (h) Boxplot showing the estimated protein copy numbers for VGF. (i) Boxplot showing the estimated protein copy numbers for MDK. Boxplot showing the estimated protein copy numbers for (j) TGFB1, (k) ARG1, (l) CD276, (m) HLA-E, (n) CD200, and (o) CD47. All boxplots show the data for hESCs and hiPSCs. For all boxplots, the bottom and top hinges represent the first and third quartiles. The top whisker extends from the hinge to the largest value no further than 1.5 × IQR from the hinge; the bottom whisker extends from the hinge to the smallest value at most 1.5 × IQR of the hinge.
Figure 6 with 2 supplements
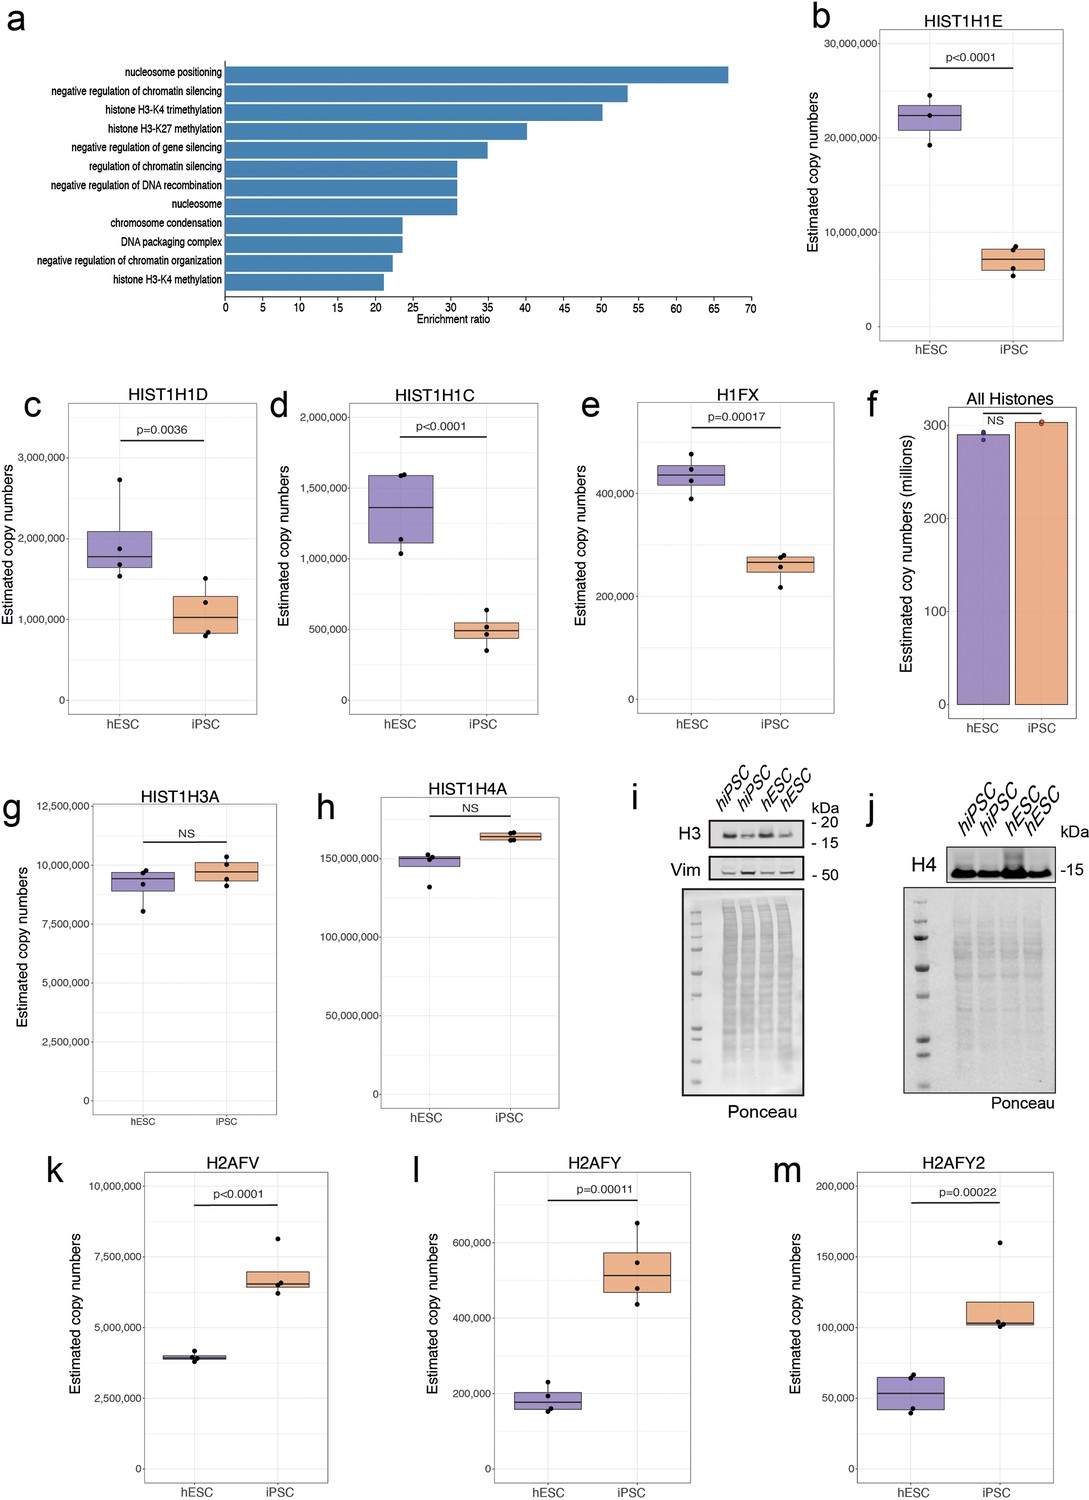
Changes within histones.
(a) Barplot showing the GO term enrichment results for proteins significantly decreased in abundance (see Materials and methods) in human induced pluripotent stem cells (hiPSCs). Boxplots showing estimated copy numbers for (b) HIST1H1E, (c) HIST1H1D, (d) HIST1H1C, and (e) H1FX in human embryonic stem cells (hESCs) (N=4) and hiPSC (N=4). (f) Barplot showing the median estimated copy numbers for all histones in hESCs and hiPSCs. Boxplots showing estimated copy numbers for (g) HIST1H3A and (h) HIST1H4A in hESCs and hiPSCs. Western blot showing the abundance of (i) H3 and (j) H4 histones in hESCs (N=4) and hiPSC (N=4). Boxplots showing estimated copy numbers for (k) H2AFV, (l) H2AFY, and (m) H2AFY2 in hESCs (N=4) and hiPSC (N=4). For all boxplots, the bottom and top hinges represent the first and third quartiles. The top whisker extends from the hinge to the largest value no further than 1.5 × IQR from the hinge; the bottom whisker extends from the hinge to the smallest value at most 1.5 × IQR of the hinge.
-
Figure 6—source data 1
PDF containing the western blots for Figure 6i and j.
- https://cdn.elifesciences.org/articles/92025/elife-92025-fig6-data1-v1.zip
-
Figure 6—source data 2
Original files for the western blots displayed in Figure 6i and j.
- https://cdn.elifesciences.org/articles/92025/elife-92025-fig6-data2-v1.zip
Figure 6—figure supplement 1

Schematic showing the unique and shared peptides detected for H1 histones as well as boxplots showing the log2 histone normalised intensity for both human embryonic stem cells (hESCs) and human induced pluripotent stem cells (hiPSCs).
For all boxplots, the bottom and top hinges represent the first and third quartiles. The top whisker extends from the hinge to the largest value no further than 1.5 × IQR from the hinge; the bottom whisker extends from the hinge to the smallest value at most 1.5 × IQR of the hinge.
Figure 6—figure supplement 2
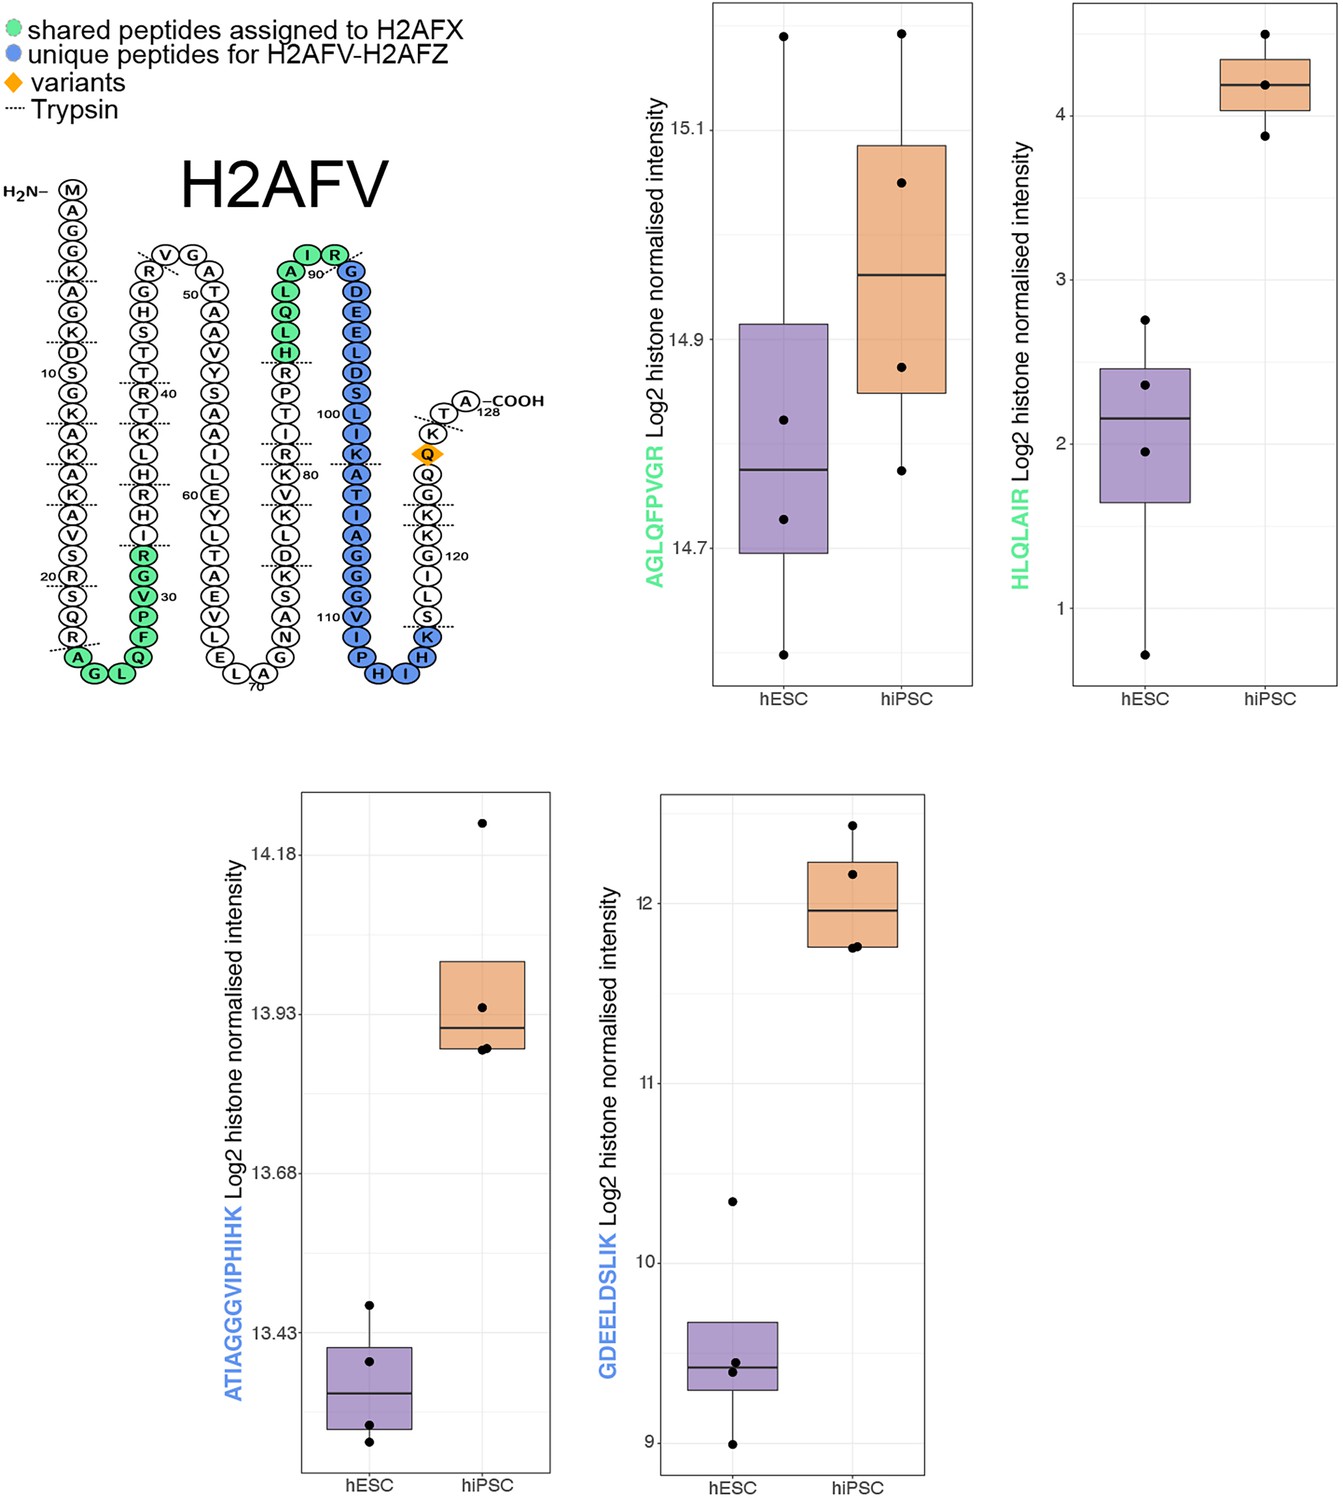
Schematic showing the unique and shared peptides detected for H2AFV as well as boxplots showing the log2 histone normalised intensity for both human embryonic stem cells (hESCs) and human induced pluripotent stem cells (hiPSCs).
For all boxplots, the bottom and top hinges represent the first and third quartiles. The top whisker extends from the hinge to the largest value no further than 1.5 × IQR from the hinge; the bottom whisker extends from the hinge to the smallest value at most 1.5 × IQR of the hinge.
Author response image 1

Tables
Key resources table
| Reagent type (species) or resource | Designation | Source or reference | Identifiers | Additional information |
|---|---|---|---|---|
| Cell line (Homo sapiens) | wibj_2 | HipSci Consortium (https://www.hipsci.org/) | RRID:CVCL_AE65 | |
| Cell line (Homo sapiens) | kucg_2 | HipSci Consortium (https://www.hipsci.org/) | RRID:CVCL_AE60 | |
| Cell line (Homo sapiens) | bubh_3 | HipSci Consortium (https://www.hipsci.org/) | RRID:CVCL_AE78 | |
| Cell line (Homo sapiens) | aqd_3 | HipSci Consortium (https://www.hipsci.org/) | RRID:CVCL_EE62 | |
| Cell line (Homo sapiens) | ueah_1 | HipSci Consortium (https://www.hipsci.org/) | RRID:CVCL_AG29 | |
| Cell line (Homo sapiens) | aizi_1 | HipSci Consortium (https://www.hipsci.org/) | RRID:CVCL_AG87 | |
| Cell line (Homo sapiens) | H1 (WA01) | WiCell Research Institute (https://www.wicell.org/) | RRID:CVCL_9771 | |
| Cell line (Homo sapiens) | H9 (WA09) | WiCell Research Institute (https://www.wicell.org/) | RRID:CVCL_9773 | |
| Cell line (Homo sapiens) | SA121 | Takara Bio Europe AB (Cellartis) | RRID:CVCL_B296 | |
| Cell line (Homo sapiens) | SA181 | Takara Bio Europe AB (Cellartis) | RRID:CVCL_B299 | |
| Software, algorithm | MaxQuant | https://www.maxquant.org/ | RRID:SCR_014485 | |
| Software, algorithm | LIMMA | http://bioinf.wehi.edu.au/limma/ | RRID:SCR_010943 | |
| Software, algorithm | qvalue | Bioconductor | RRID:SCR_001073 | |
| Software, algorithm | FlowJo | TreeStar | ||
| Antibody | Anti-Histone H3 (rabbit polyclonal) | Abcam | RRID:AB_302613 | (1:1000) |
| Antibody | Anti-Histone H4 (rabbit polyclonal) | Abcam | RRID:AB_296888 | (1:1000) |
| Antibody | Anti-Vimentin (rabbit monoclonal) | Cell Signaling Technology | RRID:AB_10695459 | (1:1000) |
| Antibody | Anti-GAPDH (mouse monoclonal) | Cell Signaling Technology | RRID:AB_2756824 | (1:10,000) |
| Antibody | Anti-OCT4A (rabbit monoclonal) | Cell Signaling Technology | RRID:AB_2167691 | (1:10,000) |
| Antibody | Anti-SOX2 (rabbit monoclonal) | Cell Signaling Technology | RRID:AB_2195767 | (1:10,000) |
| Antibody | Anti-NANOG (rabbit monoclonal) | Cell Signaling Technology | RRID:AB_10559205 | (1:10,000) |
Additional files
-
Supplementary file 1
Protein copy numbers for all human induced pluripotent stem cells (hiPSCs) and human embryonic stem cells (hESCs).
- https://cdn.elifesciences.org/articles/92025/elife-92025-supp1-v1.csv
-
Supplementary file 2
Median intensity normalisation (concentration-like) based differential expression analysis for human induced pluripotent stem cells (hiPSCs) and human embryonic stem cells (hESCs).
- https://cdn.elifesciences.org/articles/92025/elife-92025-supp2-v1.csv
-
Supplementary file 3
Copy number-based differential expression analysis for human induced pluripotent stem cells (hiPSCs) and human embryonic stem cells (hESCs).
- https://cdn.elifesciences.org/articles/92025/elife-92025-supp3-v1.csv
-
MDAR checklist
- https://cdn.elifesciences.org/articles/92025/elife-92025-mdarchecklist1-v1.pdf
Download links
A two-part list of links to download the article, or parts of the article, in various formats.
Downloads (link to download the article as PDF)
Open citations (links to open the citations from this article in various online reference manager services)
Cite this article (links to download the citations from this article in formats compatible with various reference manager tools)
Proteomic and functional comparison between human induced and embryonic stem cells
eLife 13:RP92025.
https://doi.org/10.7554/eLife.92025.3


