Homeostatic regulation of rapid eye movement sleep by the preoptic area of the hypothalamus
- Department of Neuroscience, Chronobiology and Sleep Institute, Perelman School of Medicine, University of Pennsylvania, United States
- Department of Fundamental Neurosciences, University of Lausanne, Switzerland
Figures
Figure 1 with 2 supplements
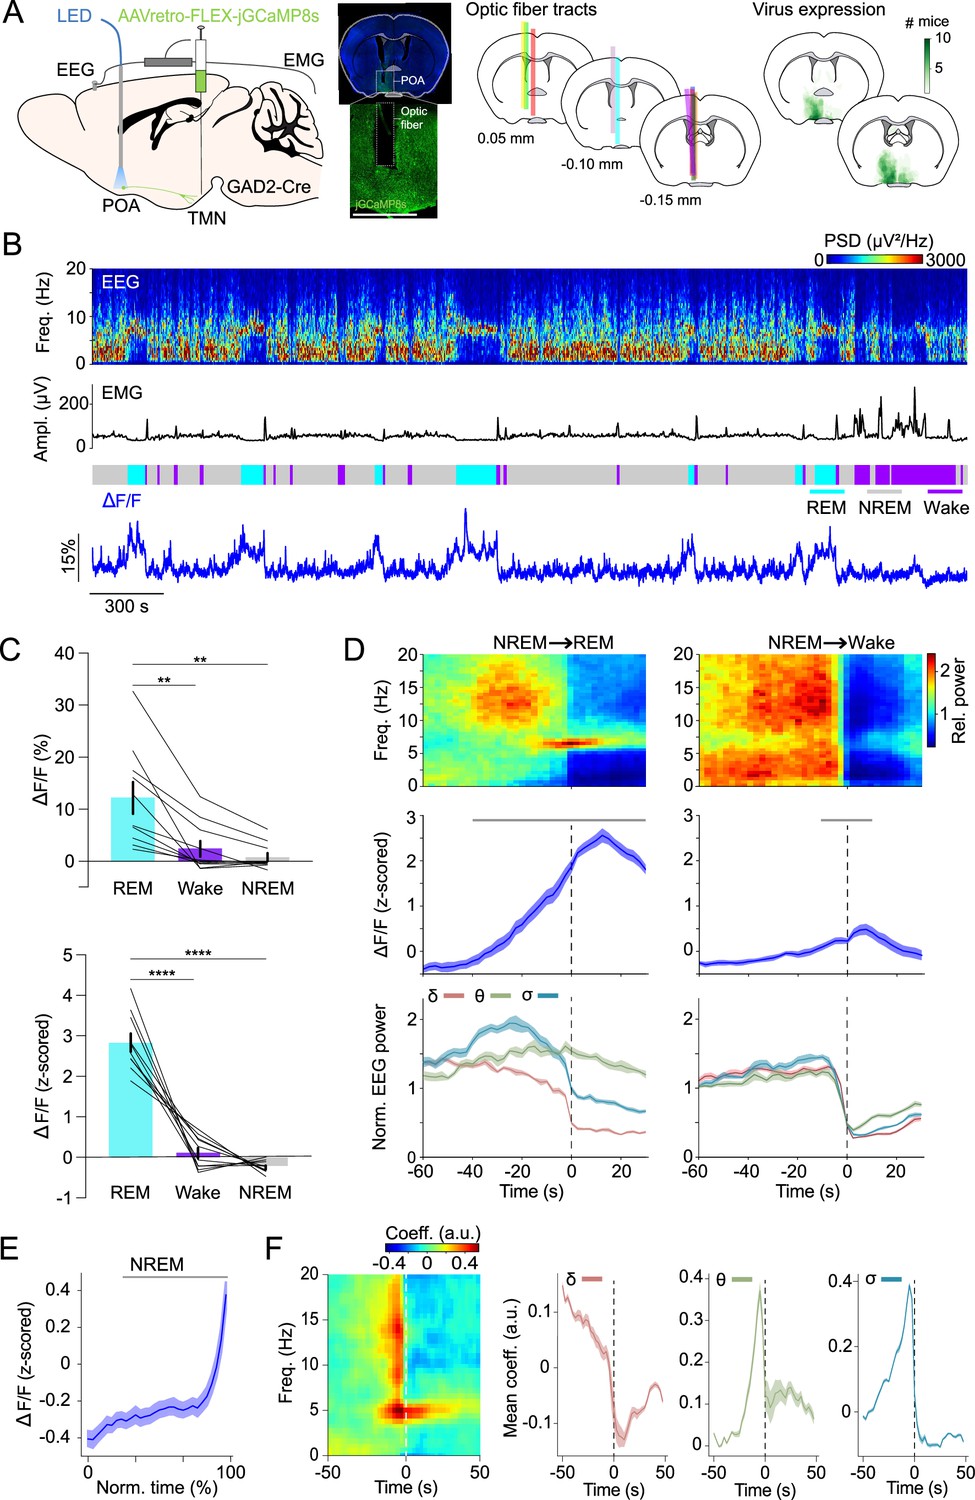
POAGAD2→TMN neurons are most active during rapid eye movement sleep (REMs).
(A) Left, schematic of fiber photometry with simultaneous electroencephalogram (EEG) and electromyogram (EMG) recordings. Mouse brain figure adapted from the Allen Reference Atlas - Mouse Brain. Center left, fluorescence image of POA in a GAD2-Cre mouse injected with AAVretro-FLEX-jGCaMP8s into the TMN. Scale bar, 1 mm. Center right, location of fiber tracts. Each colored bar represents the location of optic fibers for photometry recordings. Right, heatmaps outlining areas with cell bodies expressing GCaMP8. The green color code depicts how many mice the virus expression overlapped at the corresponding location (n=10 mice). (B) Example fiber photometry recording. Shown are EEG spectrogram, EMG amplitude, color-coded brain states, and ΔF/F signal. (C) Non-normalized and z-scored ΔF/F activity during REMs, wake, and non-rapid eye movement sleep (NREMs). Bars, averages across mice; lines, individual mice; error bars, ± s.e.m. One-way repeated measures (rm) ANOVA, p=9e-4, 2e-6 for non-normalized ΔF/F and z-scored ΔF/F signals; pairwise t-tests with Bonferroni correction, non-normalized ΔF/F, p=0.0056, 0.0039 for REMs vs. wake and REMs vs. NREMs; z-scored ΔF/F, p=6e-5, 1e-7. n=10 mice. (D) Average EEG spectrogram (top), z-scored ΔF/F activity (middle) and normalized EEG δ, θ, and σ power (bottom) during NREMs→REMs transitions (left) and NREMs→wake transitions (right). Shading, ± s.e.m. One-way rm ANOVA, p=3.18e-49, 9.50e-8 for NREMs→REMs and NREMs→wake; pairwise t-tests with Holm-Bonferroni correction, NREMs→REMs p<0.0419 between –40 and 30 s, NREMs→wake p<0.0106 between –10 and 10 s. Gray bar, period when ΔF/F activity was significantly different from baseline (−60 to –50 s). n=10 mice. (E) ΔF/F activity during NREMs. The duration of NREMs episodes was normalized in time, ranging from 0% to 100%. Shading, ± s.e.m. Pairwise t-tests with Holm-Bonferroni correction p<8.14e-9 between 20 and 100. Gray bar, intervals where ΔF/F activity was significantly different from baseline (0% to 20%, the first time bin). n=566 events. (F) Left, linear filter mapping the normalized EEG spectrogram onto the POAGAD2→TMN neural activity. Time point 0 s corresponds to the predicted neural activity. Right, coefficients of the linear filter for δ, θ, and σ power band. Shading, ± s.e.m. See Supplementary file 1 for the actual p-values.
Figure 1—figure supplement 1
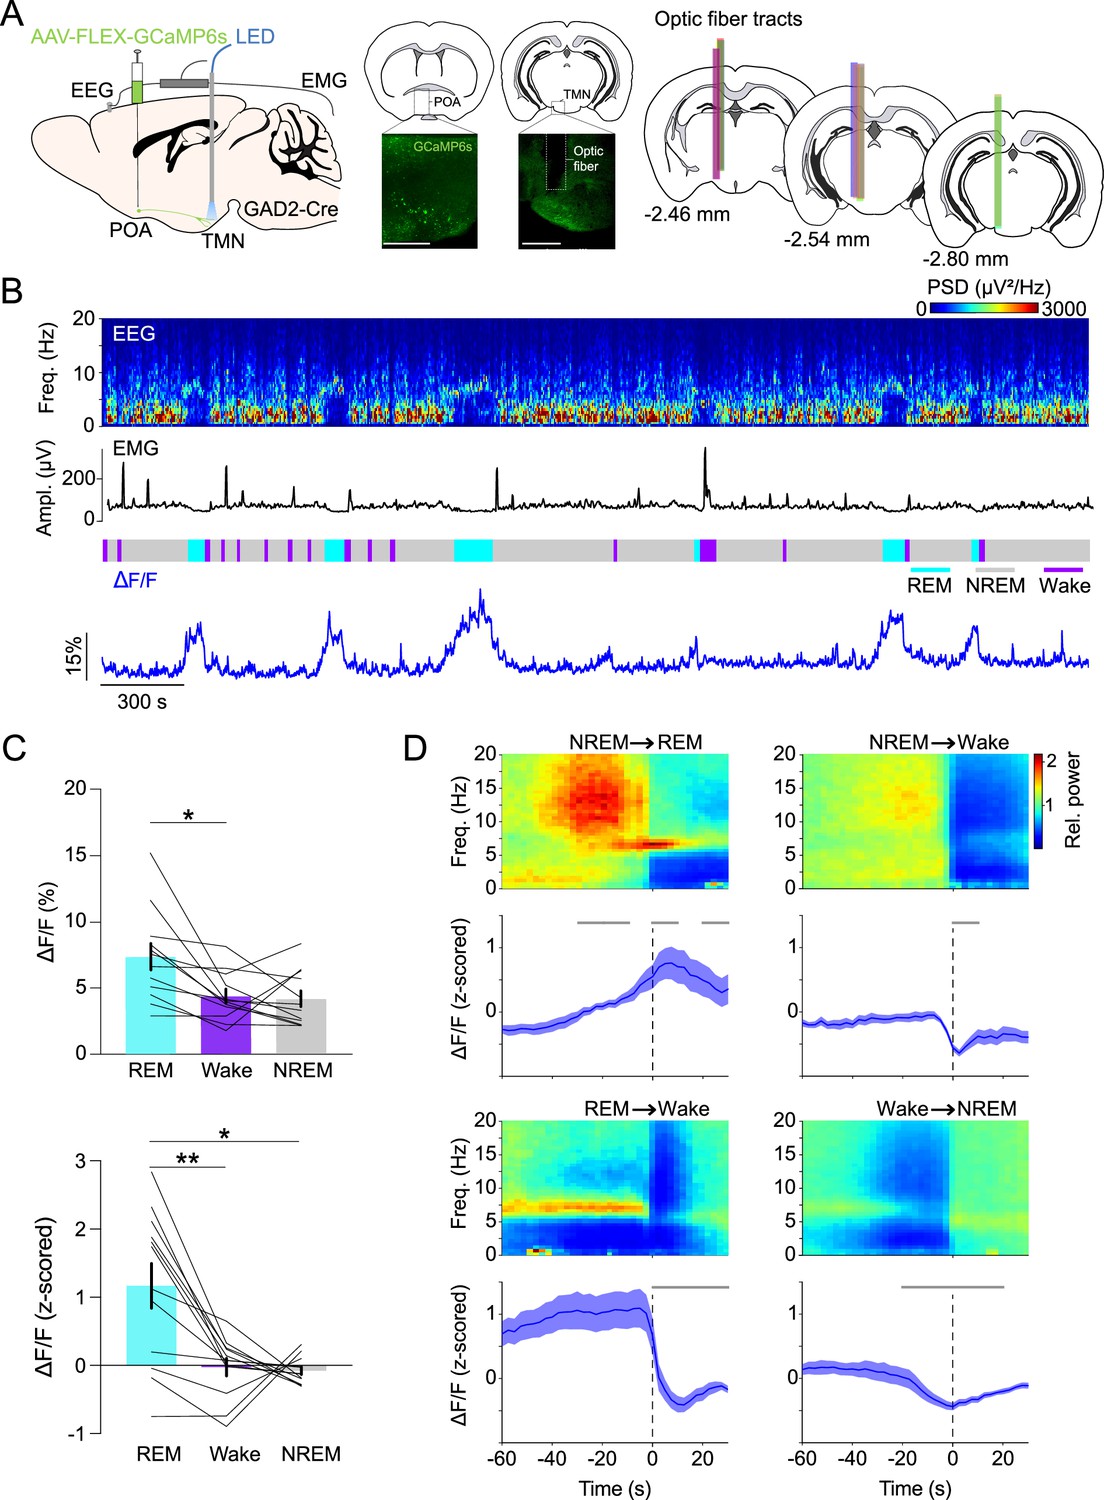
POAGAD2→TMN axonal fibers are most active during rapid eye movement sleep (REMs).
Related to Figure 1. (A) Left, schematic of fiber photometry with simultaneous electroencephalogram (EEG) and electromyogram (EMG) recordings. Mouse brain figure adapted from the Allen Reference Atlas - Mouse Brain. Middle, fluorescence image of POA and TMN in a GAD2-Cre mouse injected with AAV-FLEX-GCaMP6s into the POA and implanted with an optic fiber in the TMN. Scale bar, 0.5 mm. Right, location of fiber tracts. Each colored bar represents the location of optic fibers for photometry recordings. (B) Example fiber photometry recording. Shown are EEG spectrogram, EMG amplitude, color-coded brain states, and ΔF/F signal. (C) Non-normalized and z-scored ΔF/F activity during REMs, wake, and non-rapid eye movement sleep (NREMs). Bars, averages across mice; lines, individual mice; error bars, ± s.e.m. One-way repeated measures (rm) ANOVA p=0.0162, 0.0029 for non-normalized ΔF/F and z-scored ΔF/F; pairwise t-tests with Bonferroni correction, non-normalized ΔF/F, p=0.0187 for REMs vs. wake; z-scored ΔF/F, p=0.0018, 0.0227 for REMs vs. wake or REMs vs. NREMs. (D) Average EEG spectrogram (top), calcium activity (bottom) during brain state transitions. Shading, ± s.e.m. One-way rm ANOVA, p=6.89e-8 for NREMs→REMs transitions; pairwise t-tests with Holm-Bonferroni correction, p<0.0149 between –30 and –10 s, p=0.0002 between 0 and 10 s, p=0.0361 between 20 and 30 s. Gray bar, period when ΔF/F activity was significantly different from baseline (−60 to –50 s). n=12 mice. See Supplementary file 1 for the actual p-values.
Figure 1—figure supplement 2
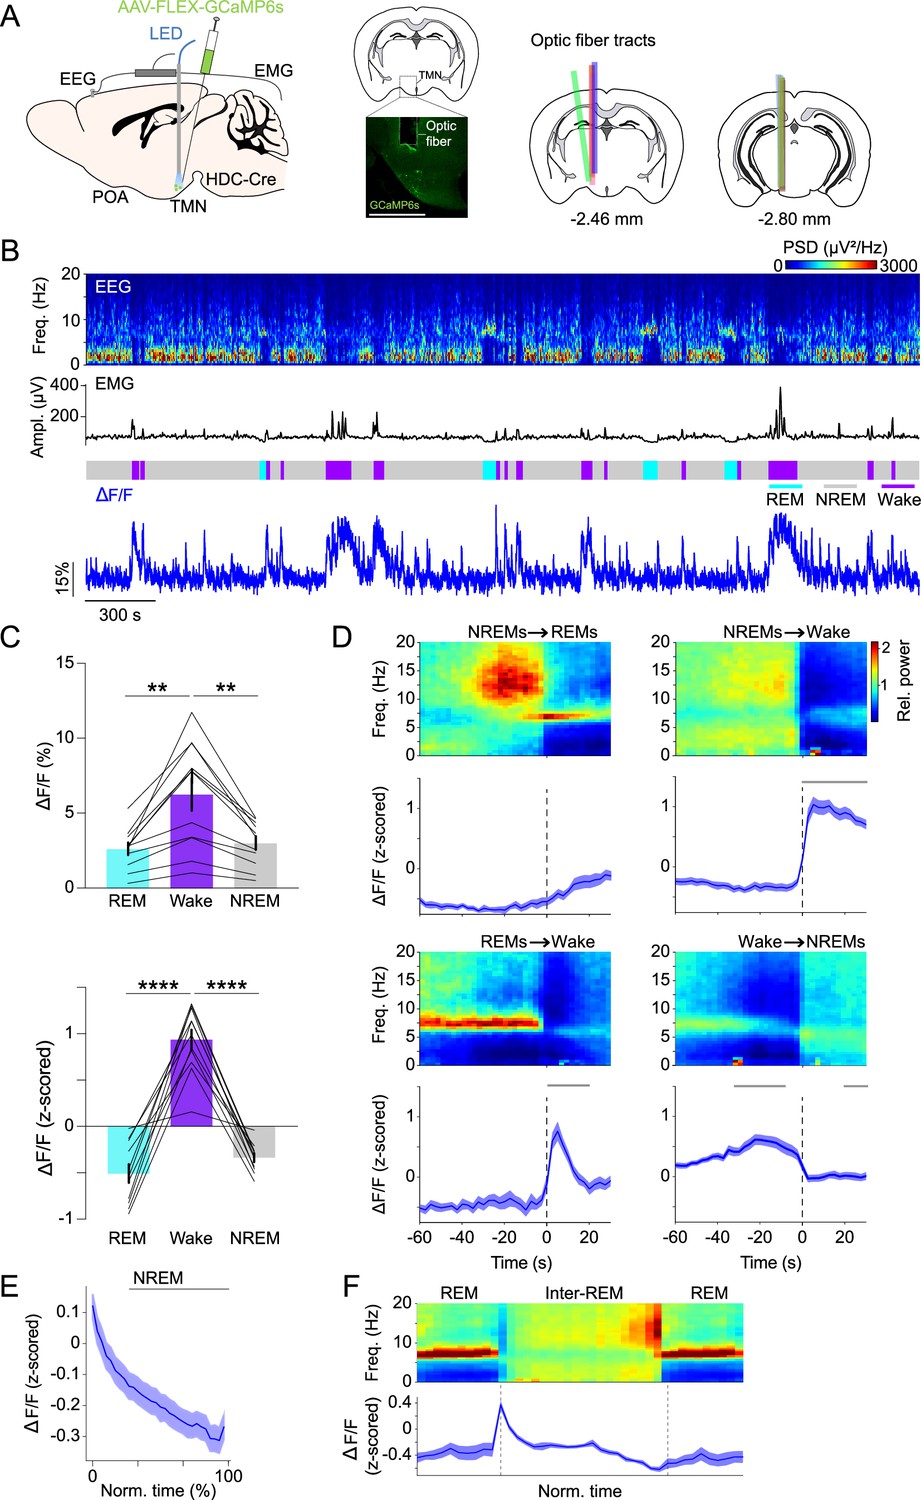
TMNHIS neurons are least active during sleep.
Related to Figure 1. (A) Left, schematic of fiber photometry with simultaneous electroencephalogram (EEG) and electromyogram (EMG) recordings. Middle, fluorescence image of TMN in an HDC-Cre mouse injected with AAV-FLEX-GCaMP6s and implanted with an optic fiber in the TMN. Scale bar, 1 mm. Right, location of fiber tracts. Each colored bar represents the location of optic fibers for photometry recordings. Mouse brain figure adapted from the Allen Reference Atlas - Mouse Brain. (B) Example fiber photometry recording. Shown are EEG spectrogram, EMG amplitude, color-coded brain states, and ΔF/F signal. (C) Non-normalized and z-scored ΔF/F activity during rapid eye movement sleep (REMs), wake, and non-rapid eye movement sleep (NREMs). Bars, averages across mice; lines, individual mice; error bars, ± s.e.m. One-way repeated measures (rm) ANOVA p=5.23e-4, 1.862e-11 for non-normalized ΔF/F and z-scored ΔF/F; pairwise t-tests with Bonferroni correction, non-normalized ΔF/F, p=0.0035, 0.0022 for REMs vs. wake or wake vs. NREMs; z-scored ΔF/F, p=2.95e-7, 3.81e-8. n=11 mice. (D) Average EEG spectrogram (top), and calcium activity (bottom) during brain state transitions. Shading, ± s.e.m. One-way rm ANOVA, p=4.28e-40, 3.69e-22 for NREMs→wake and REMs→wake; pairwise t-tests with Holm-Bonferroni correction, NREMs→wake p<1.44e-05 between 0 and 30 s, REMs→wake p<0.002 between 0 and 20 s. Gray bar, period when ΔF/F activity was significantly different from baseline (−60 to –50 s). n=11 mice. (E) ΔF/F activity during NREMs. The duration of NREMs episodes was normalized in time, ranging from 0% to 100%. Shading, ± s.e.m. Pairwise t-tests with Holm-Bonferroni correction p<5.36e-33 between 20 and 100. Gray bar, intervals where ΔF/F activity was significantly different from baseline (0% to 20%, the first time bin). n=889 events. (F) Average normalized EEG spectrogram (top), and z-scored ΔF/F activity (bottom) during two successive REMs episodes and the inter-REM interval. Each REMs episode and inter-REM interval was compressed to unit length and the ΔF/F activity was averaged over multiple episodes/intervals. Shading, s.e.m.
Figure 2 with 2 supplements
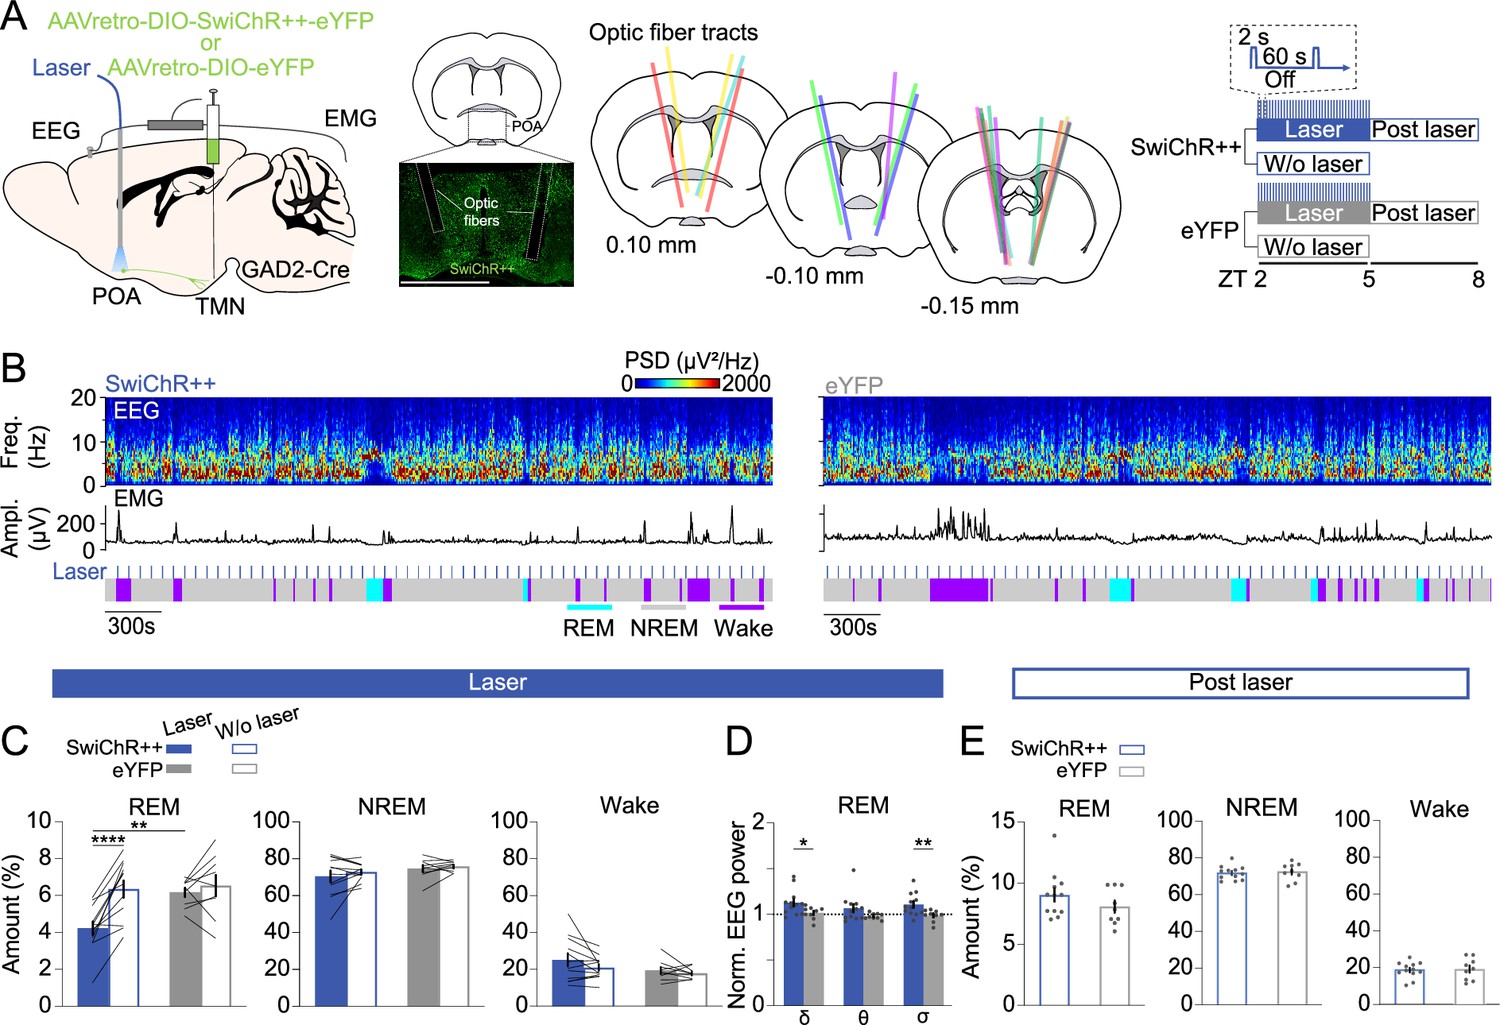
Inhibiting POAGAD2→TMN neurons reduces rapid eye movement sleep (REMs).
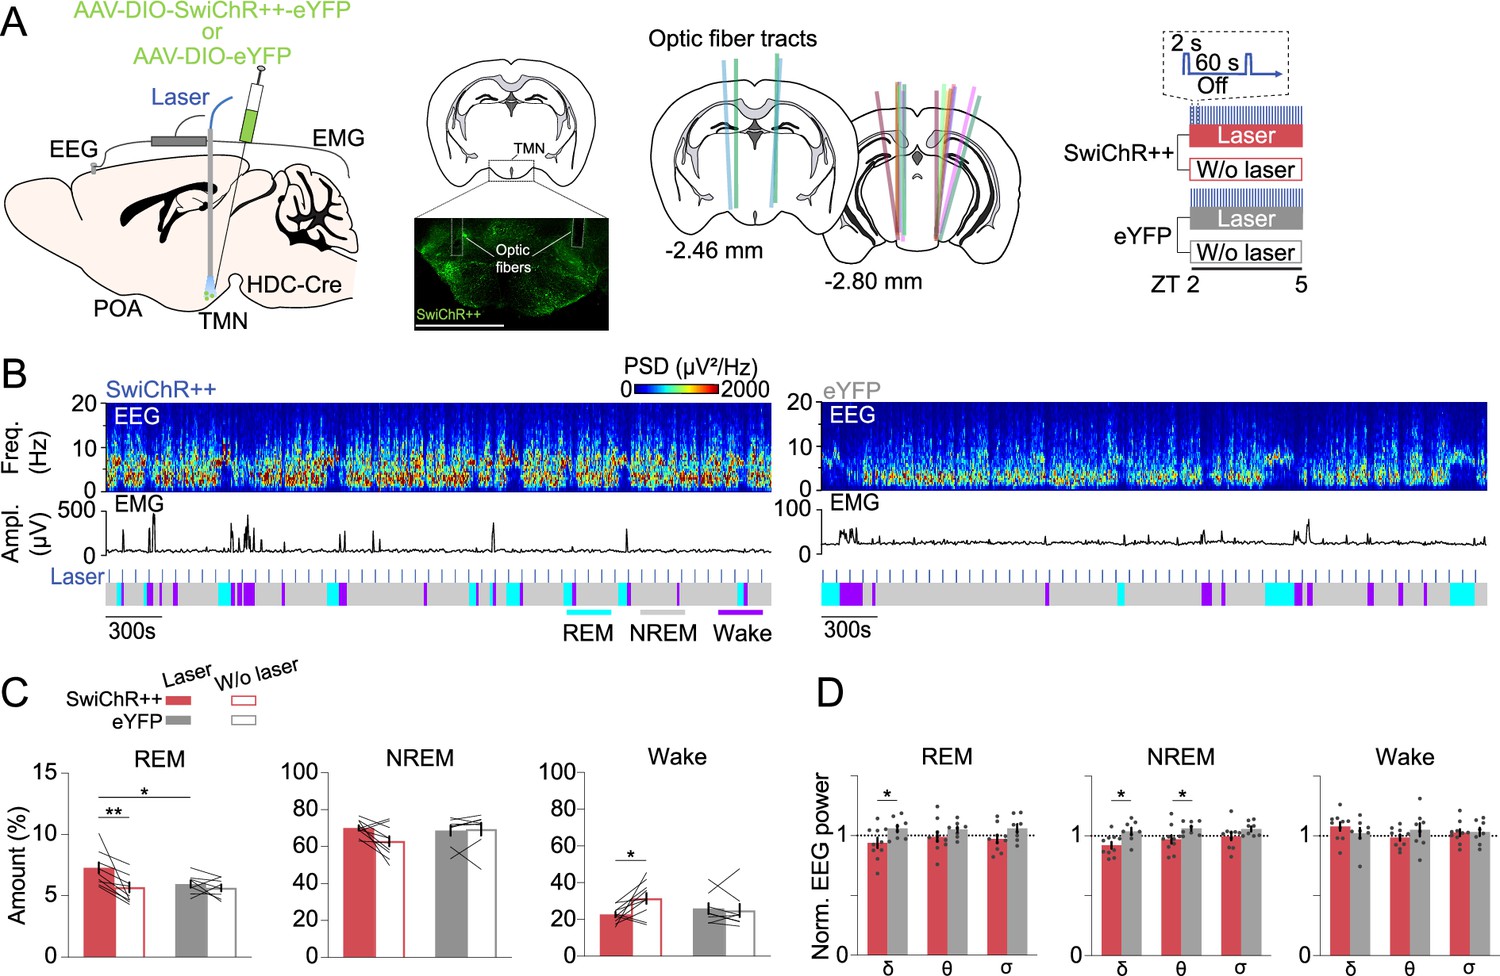
(A) Left, schematic of optogenetic inhibition experiments. Center left, fluorescence image of POA in a GAD2-CRE mouse injected with AAVretro-DIO-SwiChR++-eYFP into the TMN. Scale bar, 1 mm. Center right, location of optic fiber tracts. Each colored bar represents the location of an optic fiber. Right, experimental paradigm for laser stimulation (2 s step pulses at 60 s intervals) in SwiChR++ and eYFP-expressing mice. Mouse brain figure adapted from the Allen Reference Atlas - Mouse Brain. (B) Example recording of a SwiChR++ (left) and eYFP mouse (right) with laser stimulation. Shown are electroencephalogram (EEG) power spectra, EMG amplitude, and color-coded brain states. (C) Percentage of time spent in REMs, non-rapid eye movement sleep (NREMs), and wakefulness with and without laser in SwiChR++ and eYFP mice. Mixed ANOVA, virus p=0.0629, laser p=0.0003, interaction p=0.0064; t-tests with Bonferroni correction, SwiChR-laser vs. SwiChR-w/o laser p=3.00e-5, SwiChR-laser vs. eYFP-laser p=0.0058. (D) Normalized EEG δ, θ, and σ power during REMs in SwiChR++ and eYFP mice with laser. Unpaired t-tests, SwiChR vs. eYFP p=0.0432, 0.0099 for δ and σ. (E) Percentage of time spent in REMs, NREMs, and wakefulness during post-laser sessions. (C) Bars, averages across mice; lines, individual mice; error bars, ± s.e.m. (D, E) Bars, averages across mice; dots, individual mice; error bars, ± s.e.m. SwiChR++: n=12 mice; eYFP: n=9 mice.
Figure 2—figure supplement 1
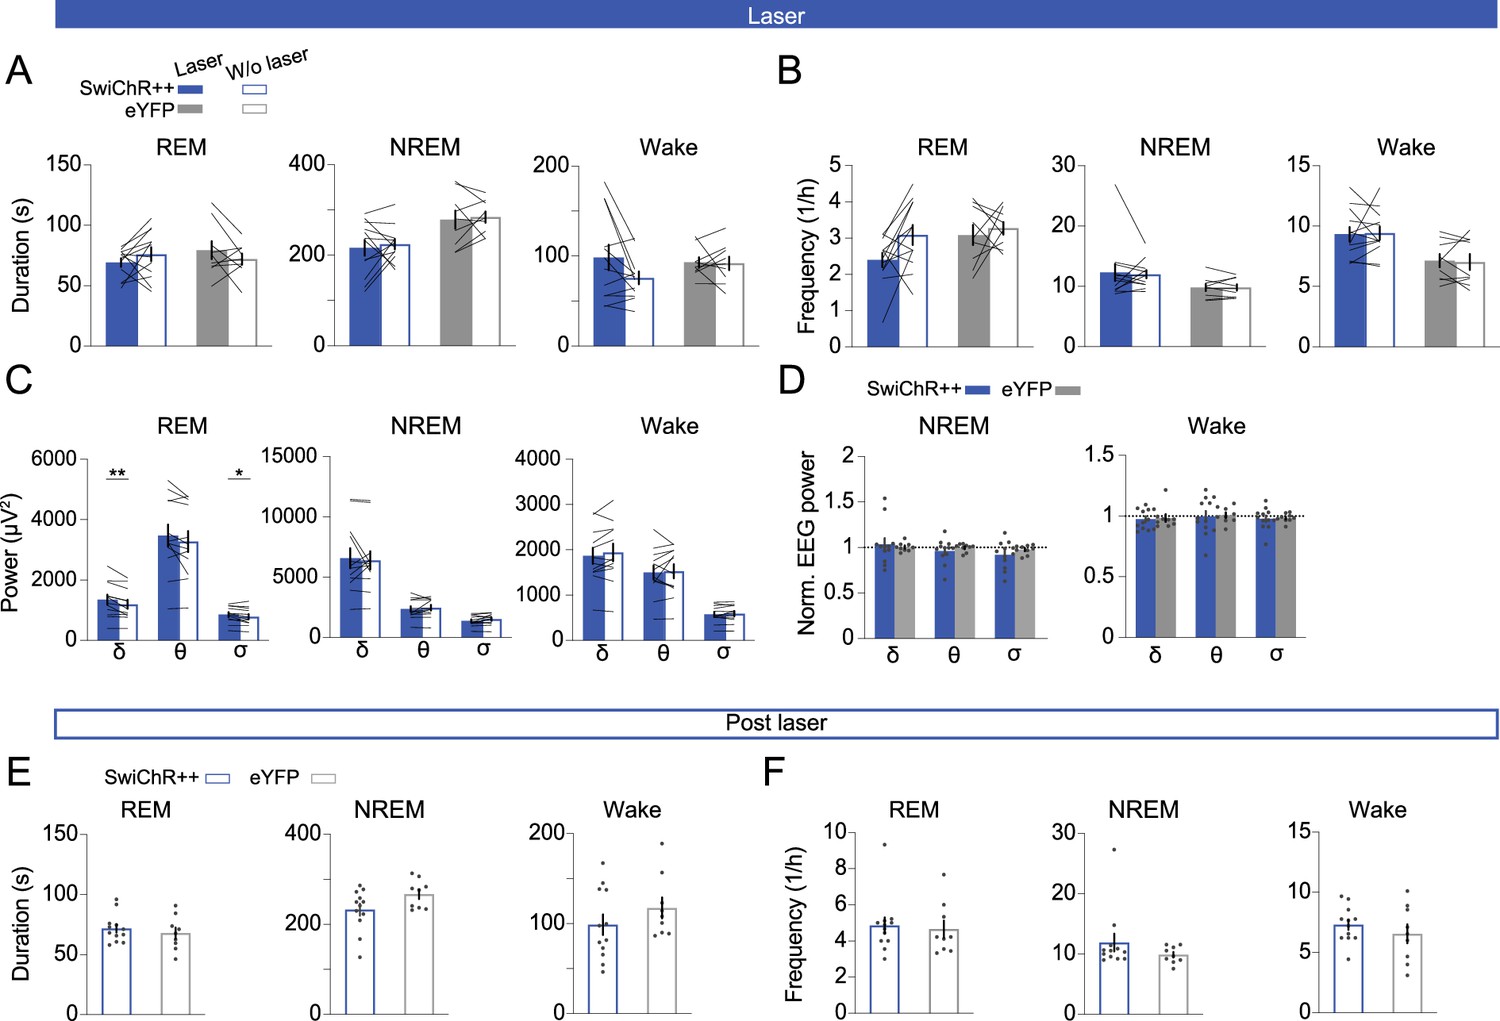
Effects of inhibiting POAGAD2→TMN neurons on brain states and electroencephalogram (EEG).
Related to Figure 2. (A) Duration of rapid eye movement sleep (REMs), non-rapid eye movement sleep (NREMs), and wake episodes with and without laser stimulation in SwiChR++ and eYFP mice. (B) Frequency of REMs, NREMs, and wake episodes with and without laser stimulation in SwiChR++ and eYFP mice. (C) Comparison of EEG δ, θ, and σ power during REMs, NREMs, and wakefulness with and without laser stimulation in SwiChR++ mice. Paired t-tests, SwiChR-laser vs. SwiChR-w/o laser p=0.0048, 0.0158 for δ and σ during REM. (D) Normalized EEG δ, θ, and σ power during NREMs, and wakefulness in SwiChR++ and eYFP mice. (E) Duration of REMs, NREMs, and wake episodes during 3 hr recordings directly following the laser stimulation interval (post laser) in SwiChR++ and eYFP mice. (F) Frequency of REMs, NREMs, and wake episodes during post-laser recordings in SwiChR++ and eYFP mice. (A–C) Bars, averages across mice; lines, individual mice; error bars, ± s.e.m. (D–F) Bars, averages across mice; dots, individual mice, error bars, ± s.e.m. SwiChR++: n=12 mice; eYFP: n=9 mice.
Figure 2—figure supplement 2
Effects of inhibiting TMNHIS neurons on brain states and electroencephalogram (EEG).
Related to Figure 2. (A) Left, schematic of optogenetic inhibition experiments. Center left, fluorescence image of TMN in HDC-Cre mouse injected with AAV2-EF1a-DIO-SwiChR++-eYFP into the TMN. Scale bar, 1 mm. Center right, location of optic fiber tracts. Each colored bar represents the location of an optic fiber. Right, experimental paradigm for laser stimulation (2 s step pulses at 60 s intervals) in SwiChR++ and eYFP-expressing mice. Mouse brain figure adapted from the Allen Reference Atlas - Mouse Brain. (B) Example recording of a SwiChR++ (left) and eYFP mouse (right) with laser stimulation. Shown are EEG power spectra, electromyogram (EMG) amplitude, and color-coded brain states. (C) Percentage of time spent in rapid eye movement sleep (REMs), non-rapid eye movement sleep (NREMs), and wakefulness with and without laser in SwiChR++ and eYFP mice. REMs: mixed ANOVA, virus p=0.1470, laser p=0.0054, interaction p=0.0455; t-tests with Bonferroni correction, SwiChR-laser vs. SwiChR-w/o laser p=0.0019, SwiChR-laser vs. eYFP-laser p=0.0384. Wake: mixed ANOVA, virus p=0.6180, laser p=0.0909, interaction p=0.0378; t-tests with Bonferroni correction, SwiChR-laser vs. SwiChR-w/o laser p=0.0154. (D) Normalized EEG δ, θ, and σ power during REMs, NREMs, and wake in SwiChR++ and eYFP mice with laser. Unpaired t-tests, REMs: SwiChR vs. eYFP p=0.0498 for δ; NREMs: SwiChR vs. eYFP p=0.0123, 0.0474 for δ and θ. (C) Bars, averages across mice; lines, individual mice; error bars, ± s.e.m. (D) Bars, averages across mice; dots, individual mice; error bars, ± s.e.m. SwiChR++: n=10 mice; eYFP: n=8 mice.
Figure 3 with 2 supplements
POAGAD2→TMN neurons exhibit an increased number of calcium transients during rapid eye movement sleep (REMs) restriction.
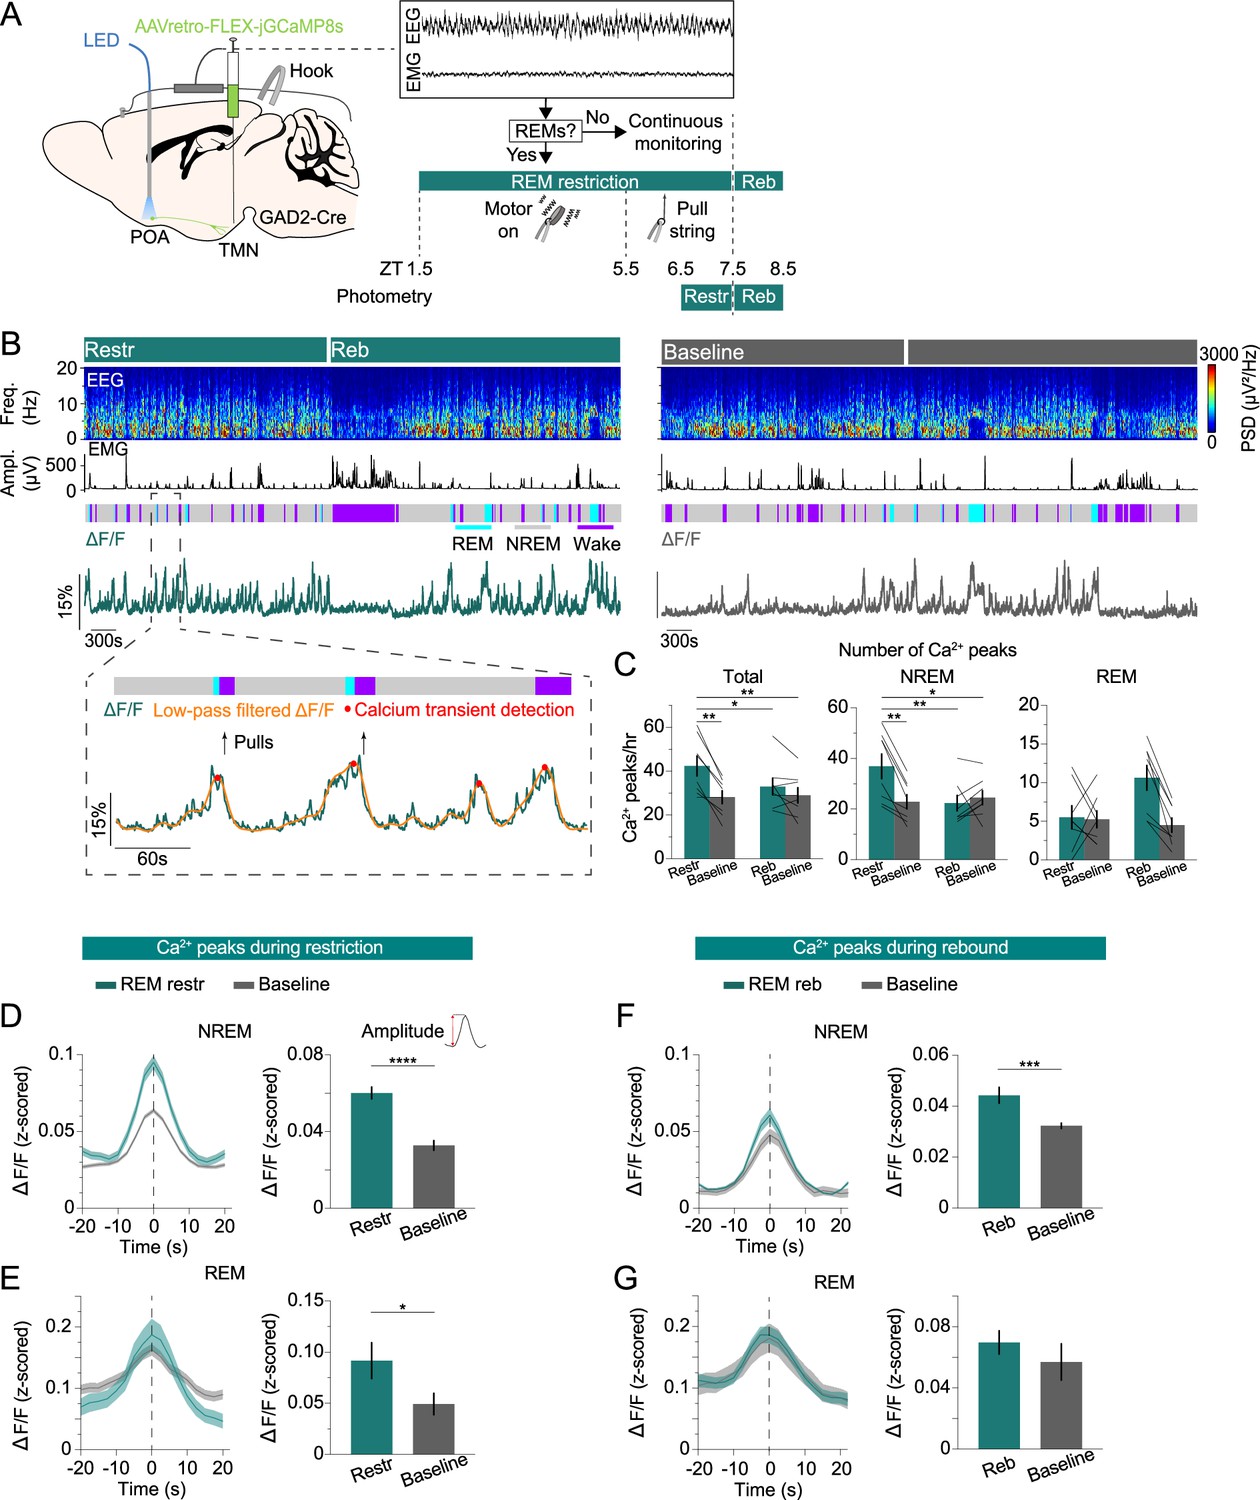
(A) Schematic of REMs restriction/rebound and photometry recording experiments. The brain state was continuously monitored; once a REMs episode was detected, we used a vibrating motor (zeitgeber time [ZT] 1.5–5.5) or pulled a string (ZT 5.5–7.5) attached to the mouse head to terminate REMs. Fiber photometry recordings were performed during REMs restriction (ZT 6.5–7.5) and rebound (ZT 7.5–8.5). Mouse brain figure adapted from the Allen Reference Atlas - Mouse Brain. (B) Top, example fiber photometry recording. Shown are electroencephalogram (EEG) spectrogram, electromyogram (EMG) amplitude, color-coded brain states, and ΔF/F signal. Bottom, brain states, ΔF/F signal (green), low-pass filtered ΔF/F signal (orange), detected peaks (red), and pulls (arrows) during a selected interval (dashed box) at an expanded timescale. (C) Number of calcium peaks during all states (left), non-rapid eye movement sleep (NREMs) (middle), and REMs (right). Bars, averages across mice; lines, individual mice; error bars, ± s.e.m. n=8 mice. Total: two-way repeated measures (rm) ANOVA, treatment (baseline vs. manipulation) p=0.0031, time p=0.0613, interaction p=0.0189; t-tests with Bonferroni correction, REM restriction (restr.) vs. baseline (ZT 6.5–7.5) p=0.0033, restr. vs. REM rebound (reb.) p=0.0341, restr. vs. baseline (ZT 7.5–8.5) p=0.0049. NREMs: two-way rm ANOVA, treatment p=0.0233, time p=0.0363, interaction p=0.003; t-tests with Bonferroni correction, restr. vs. baseline (ZT 6.5–7.5) p=0.0057, restr. vs. reb. p=0.0046, restr. vs. baseline (ZT 7.5–8.5) p=0.0115. (D) Left, average NREMs calcium peaks during REMs restriction and baseline recordings. Right, average amplitude of the NREMs calcium peaks. The amplitude was calculated by subtracting the ΔF/F value 10 s before the peak from its value at the peak. Unpaired t-tests, p=6.30e-10. n=295 and 196 peaks during restriction and baseline recordings. (E) Left, average REMs calcium peaks during REMs restriction and baseline recordings. Right, average amplitude of the REMs calcium peaks. Unpaired t-tests, p=0.0437. n=44 and 42 peaks during restriction and baseline recordings. (F) Left, average NREMs calcium peaks during REMs rebound and baseline recordings. Right, average amplitude of the NREMs calcium peaks. Unpaired t-tests, p=0.0002. n=180 and 196 peaks during rebound and baseline recordings. (G) Left, average REMs calcium peaks during REMs rebound and baseline recordings. Right, average amplitude of the REMs calcium peaks. n=84 and 36 peaks during rebound and baseline recordings. (D–G) Bars, averages across trials; error bars, ± s.e.m; shadings, ± s.e.m.
Figure 3—figure supplement 1
Effects of rapid eye movement sleep (REMs) restriction on brain states and electroencephalogram (EEG).
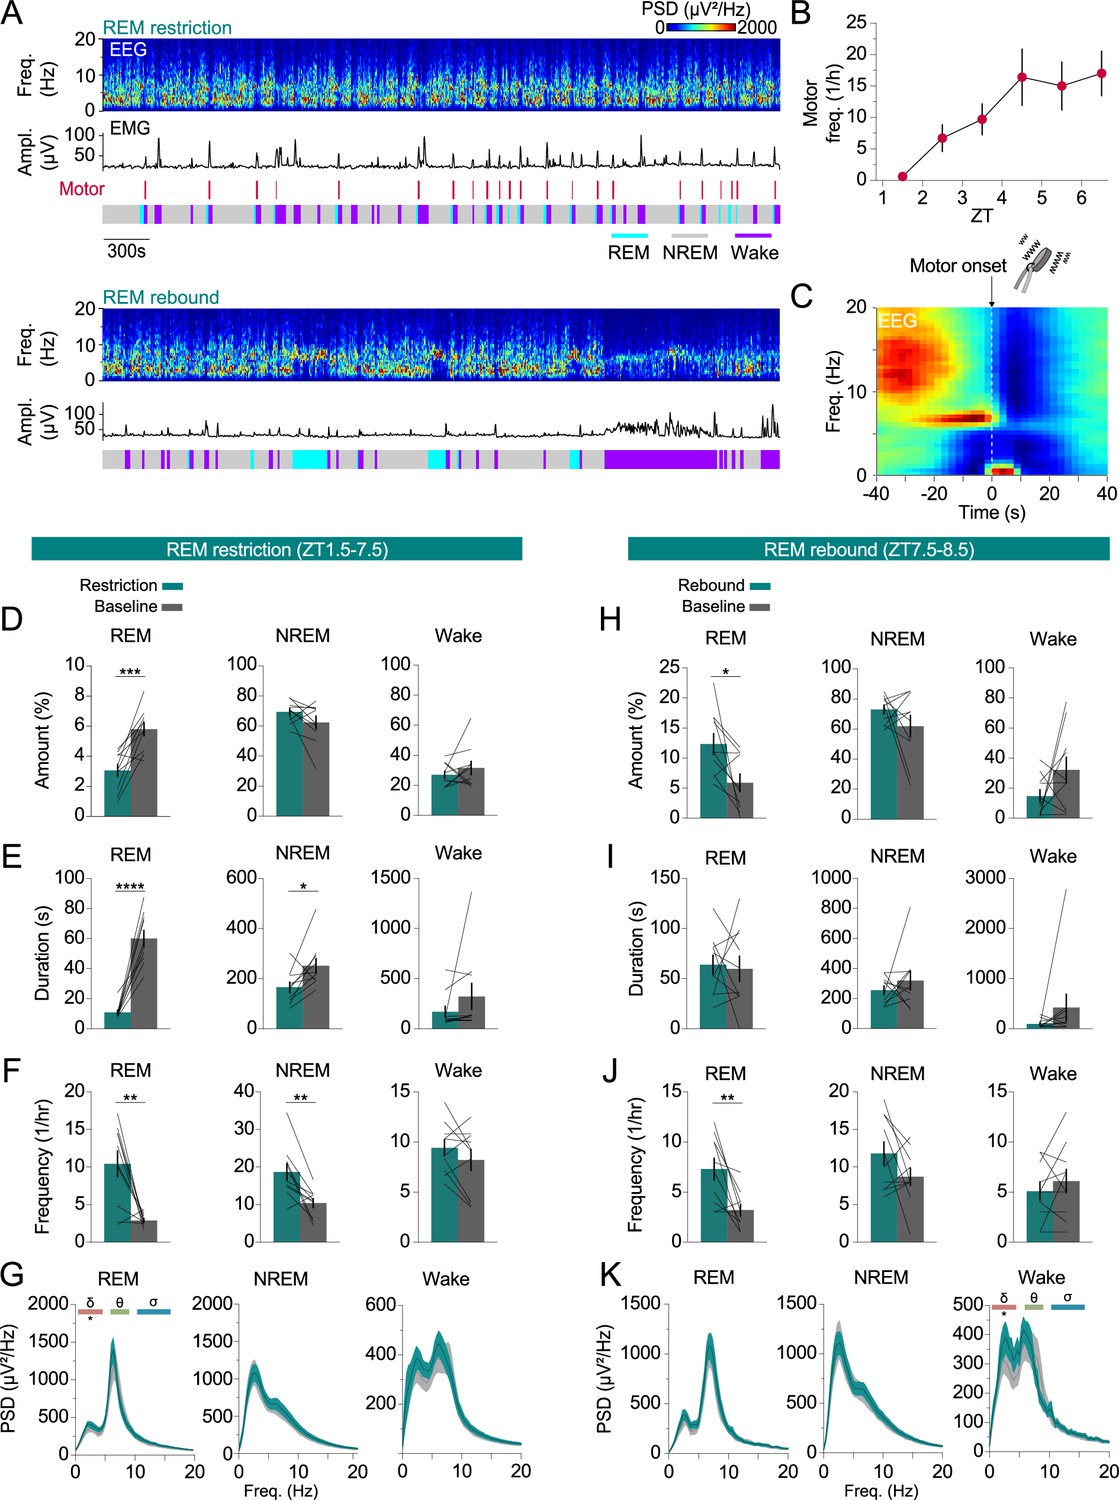
Related to Figure 3. (A) Example session during REMs restriction (top) and REMs rebound (bottom) from the same mouse. Shown are EEG spectrogram, electromyogram (EMG) amplitude, motor vibration events, and color-coded brain states. (B) Frequency of motor vibration events throughout REMs restriction (zeitgeber time [ZT] 1.5–7.5). Error bars, ± s.e.m. One-way ANOVA p=0.0061. (C) Average normalized EEG spectrogram preceding motor vibration onset. (D) Percentage of time spent in REMs, non-rapid eye movement sleep (NREMs), and wakefulness during 6 hr of REMs restriction (green, ZT 1.5–7.5) and baseline recordings (gray, ZT 1.5–7.5). Paired t-test, p=0.0006 for REMs amount. (E) Duration of REMs, NREMs, and wake episodes during 6 hr of REMs restriction (green) and baseline recordings (gray) (ZT 1.5–7.5). Paired t-tests, p=1.44e-5, 0.0276 for the duration of REMs and NREMs episodes. (F) Frequency of REMs, NREMs, and wake episodes during 6 hr of REMs restriction (green) and baseline recordings (gray) (ZT 1.5–7.5). Paired t-tests, p=0.0027 and 0.0043 for the frequency of REMs and NREMs episodes. (G) Power spectral density (PSD) of EEG during REMs, NREMs, and wakefulness during 6 hr of REMs restriction (green) and baseline recordings (gray) (ZT 1.5–7.5). Paired t-tests, p=0.0293 for REMs δ power. (H) Percentage of time spent in REMs, NREMs, and wakefulness during 1 hr of REMs rebound (green, ZT 7.5–8.5) and baseline sleep (gray, ZT 7.5–8.5). Paired t-tests, p=0.0226 for REMs amount. (I) Duration of REMs, NREMs, and wake episodes during 1 hr of REMs rebound (green) and baseline recordings (gray) (ZT 7.5–8.5). (J) Frequency of REMs, NREMs, and wake episodes during 1 hr of REMs rebound (green) and baseline recordings (gray). Paired t-tests, p=0.0055 for the frequency of REMs episodes (ZT 7.5–8.5). (K) PSD of EEG during REMs, NREMs, and wakefulness during 1 hr of REMs rebound (green) and baseline recordings (gray). Paired t-tests, p=0.0164 for wake δ power (ZT 7.5–8.5). (D–F, H–J) Bars, averages across mice; lines, individual mice; error bars, ± s.e.m. n=10 mice. (G, K) Shadings, ± s.e.m. n=10 mice in G; n=9 mice in K, 1 mouse was excluded for REMs because there was no REMs during baseline recordings.
Figure 3—figure supplement 2
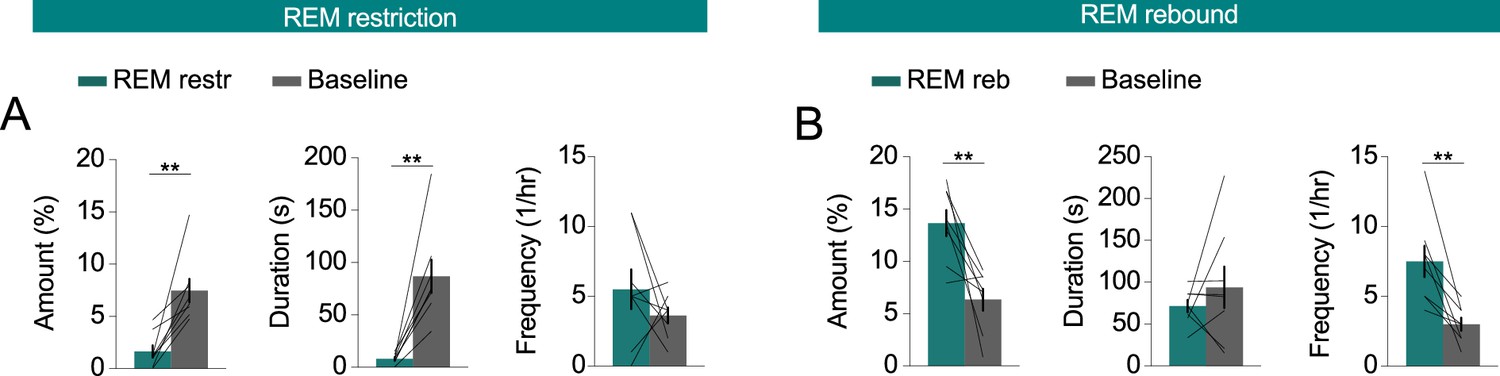
Rapid eye movement sleep (REMs) amount, duration, and frequency of episodes during photometry recordings combined with REMs restriction and rebound.
Related to Figure 3. (A) Percentage of REMs, duration, and frequency of REMs episodes during REMs restriction (green, zeitgeber time [ZT] 6.5–7.5) and baseline recordings (gray, ZT 6.5–7.5). Paired t-tests, p=0.0024, 0.0013 for amount and duration. (B) Percentage of REMs, duration, and frequency of REMs episodes during REMs rebound (green, ZT 7.5–8.5) and baseline recordings (gray, ZT 7.5–8.5). Paired t-tests, p=0.0066, 0.0047 for amount and frequency. Bars, averages across mice; lines, individual mice; error bars, ± s.e.m. n=8 mice.
Figure 4 with 1 supplement
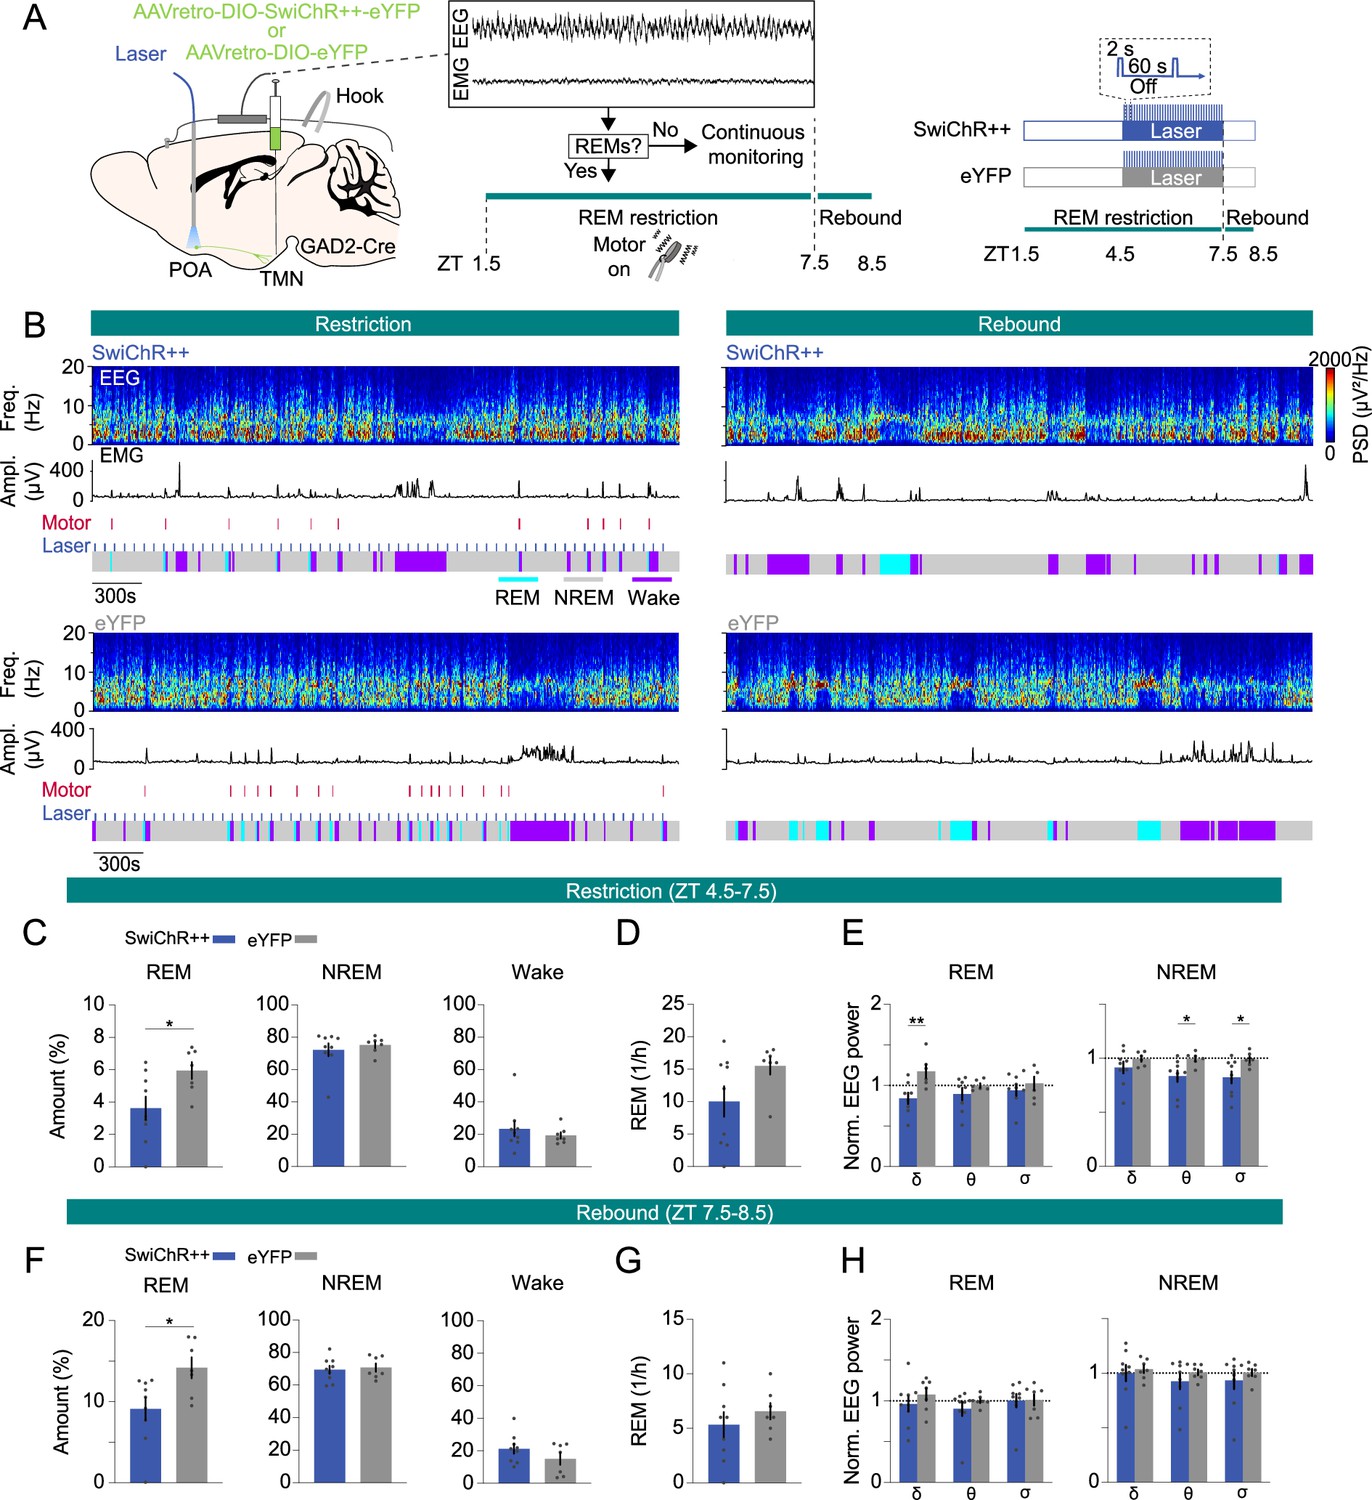
Inhibition of POAGAD2→TMN neurons during rapid eye movement sleep (REMs) restriction attenuates the REMs rebound.
(A) Schematic of REMs restriction/rebound and optogenetic inhibition experiments. During closed-loop REMs restriction (zeitgeber time [ZT] 1.5–7.5), a vibrating motor attached to the mouse head was used to terminate REMs. REMs was restricted for 6 hr (ZT 1.5–7.5). During the last 3 hr of restriction (ZT 4.5–7.5), laser stimulation (2 s step pulses at 60 s intervals) was applied in SwiChR++ and eYFP mice. Mouse brain figure adapted from the Allen Reference Atlas - Mouse Brain. (B) Example sessions from a SwiChR++ (top) and eYFP mouse (bottom) during REMs restriction with laser stimulation (left) and rebound (right). Shown are electroencephalogram (EEG) spectrogram, electromyogram (EMG) amplitude, motor vibration events, laser and color-coded brain states. (C) Percentage of time spent in REMs, non-rapid eye movement sleep (NREMs), and wakefulness during the last 3 hr of REMs restriction with laser stimulation (ZT 4.5–7.5) in mice expressing SwiChR++ and eYFP. Unpaired t-tests, p=0.026 for REMs amount. (D) Frequency of REMs episodes during the last 3 hr of REMs restriction with laser stimulation (ZT 4.5–7.5). Unpaired t-tests, p=0.0821. (E) Normalized EEG δ, θ, and σ power during the last 3 hr of REMs restriction with laser stimulation (ZT 4.5–7.5). Unpaired t-tests, p=0.0091, 0.0332, and 0.038 for REMs δ, NREMs θ and σ power. (F) Percentage of time spent in REMs, NREMs, and wakefulness during REMs rebound (ZT 7.5–8.5) in SwiChR++ and eYFP mice. Unpaired t-tests, p=0.0205 for REMs amount. (G) Frequency of REMs episodes during REMs rebound (ZT 7.5–8.5). (H) Normalized EEG δ, θ, and σ power during REMs rebound (ZT 7.5–8.5). Bars, averages across mice; dots, individual mice; error bars, ± s.e.m. SwiChR++: n=9 mice; eYFP: n=7 mice.
Figure 4—figure supplement 1
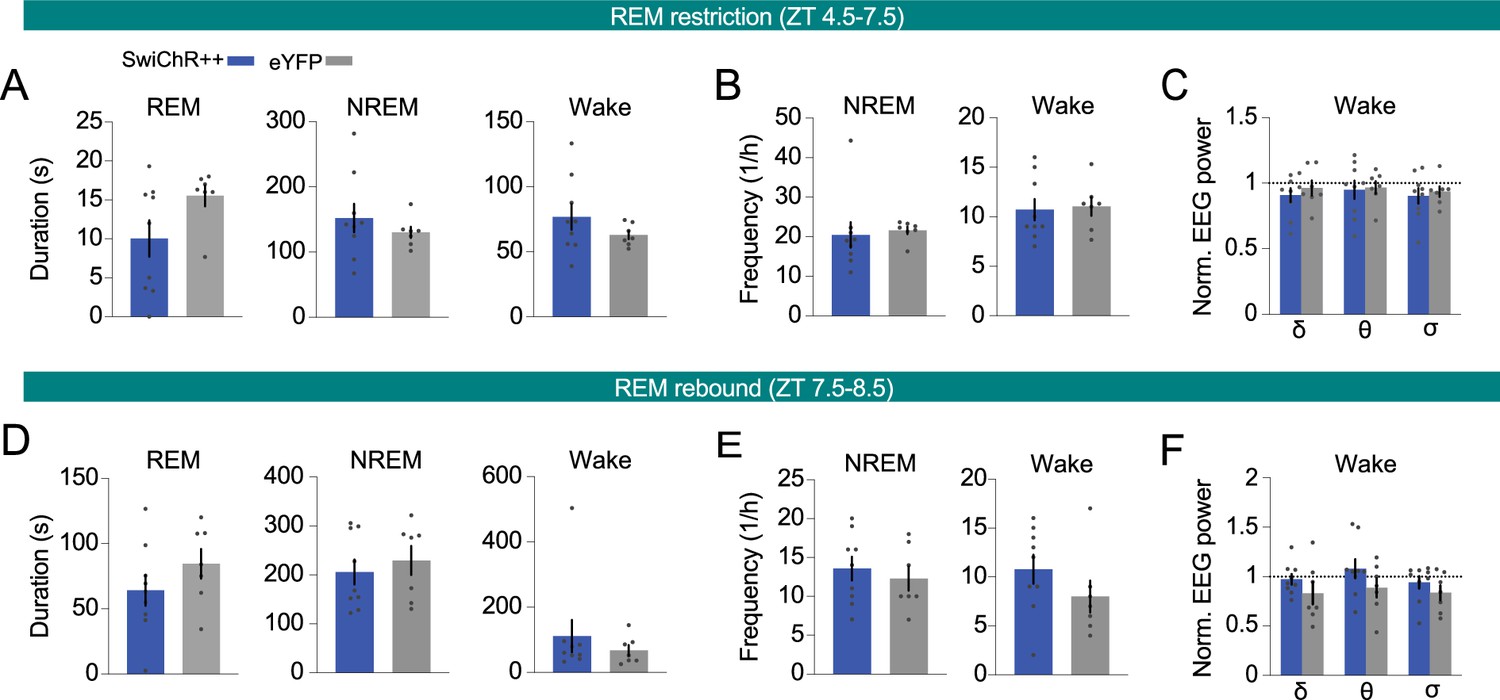
Duration and frequency of rapid eye movement sleep (REMs) episodes and electroencephalogram (EEG) power during SwiChR++-mediated inhibition combined with REMs restriction and rebound.
Related to Figure 4. (A) Duration of REMs, non-rapid eye movement sleep (NREMs), and wake episodes during the last 3 hr of REMs restriction with laser stimulation (zeitgeber time [ZT] 4.5–7.5) in mice expressing SwiChR++ and eYFP. (B) Frequency of REMs, NREMs, and wake episodes during the last 3 hr of REMs restriction with laser stimulation in mice expressing SwiChR++ and eYFP. (C) Normalized EEG δ, θ, and σ power during the last 3 hr of REMs restriction with laser stimulation in eYFP and SwiChR++ mice. (D) Duration of REMs, NREMs, and wake episodes during REMs rebound (ZT 7.5–8.5) in mice expressing SwiChR++ and eYFP. (E) Frequency of REMs, NREMs, and wake episodes during REMs rebound (ZT 7.5–8.5) in mice expressing SwiChR++ and eYFP. (F) Normalized EEG δ, θ, and σ power during REMs rebound in eYFP and SwiChR++ mice. Bars, averages across mice; dots, individual mice; error bars, ± s.e.m. SwiChR++: n=9 mice; eYFP: n=7 mice.
Author response image 1
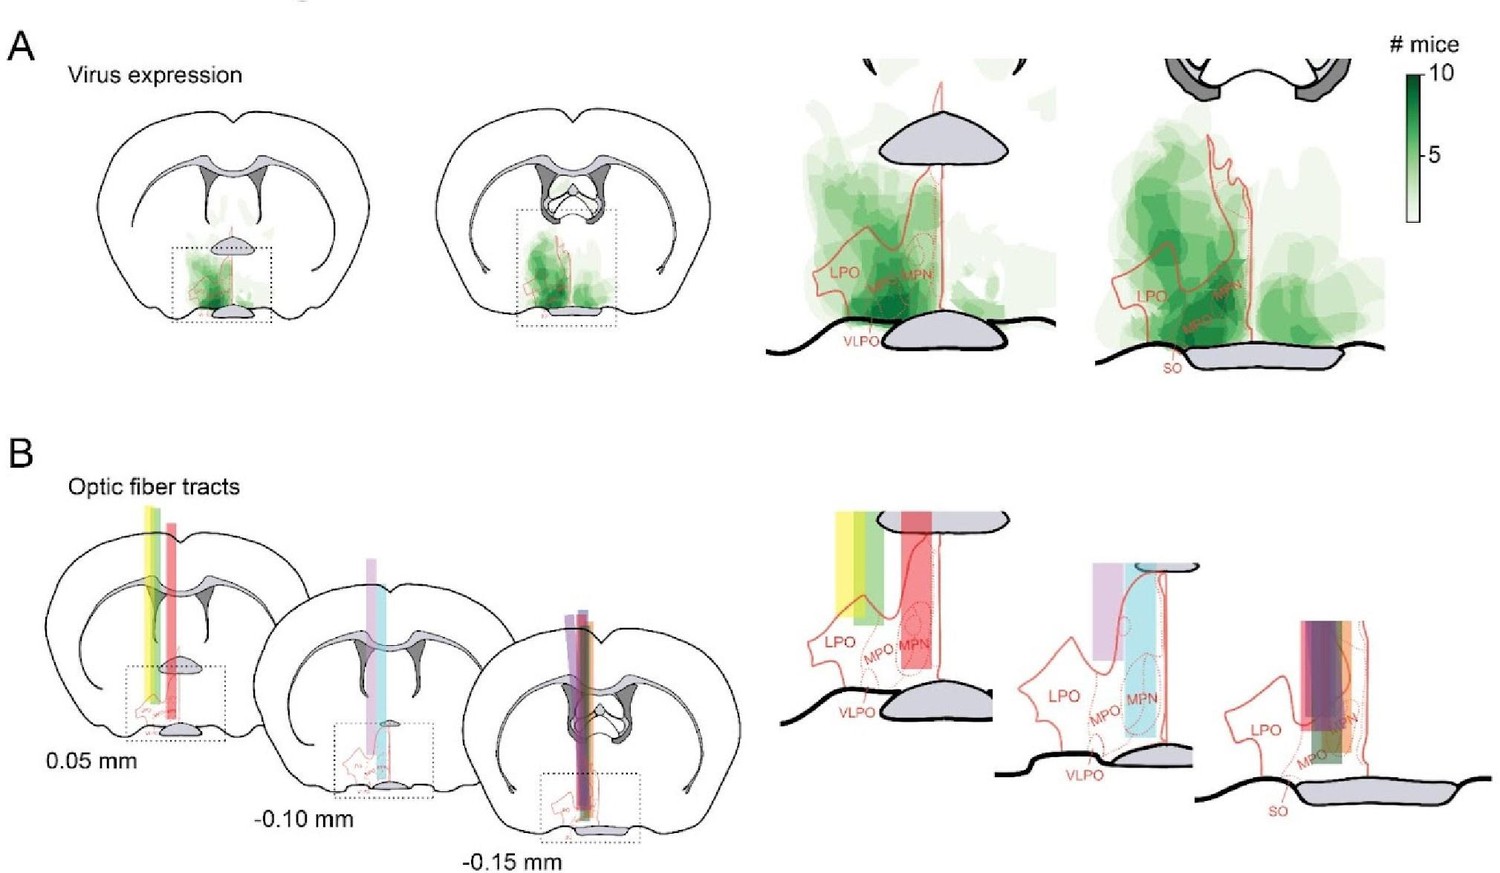
Location of virus expression (A) and optic fiber placement (B) within subregions of POA.
Mouse brain figure adapted from the Allen Reference Atlas - Mouse Brain.
Author response image 2
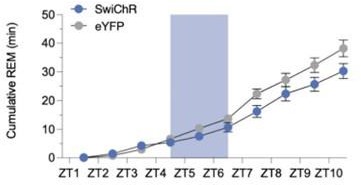
Cumulative amount of REMs during REMs deprivation and rebound combined with optogenetic stimulation in eYFP and SwiChR groups.
This data is shown as bar graphs in Figure 4.
Author response image 3
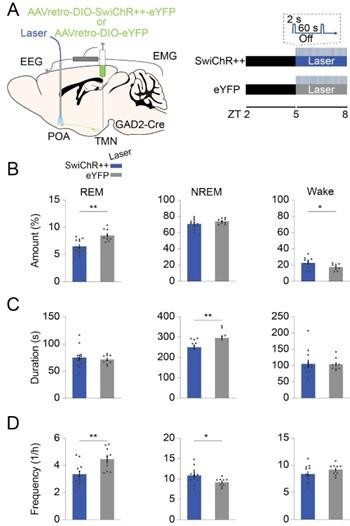
Inhibiting POA GAD2→ TMN neurons at ZT5-8 reduces REMs.
(A) Schematic of optogenetic inhibition experiments. Mouse brain figure adapted from the Allen Reference Atlas - Mouse Brain. (B) Percentage of time spent in REMs, NREMs and wakefulness with laser in SwiChR++ and eYFP mice. Unpaired t-tests, p = 0.0013, 0.0469 for REMs and wakeamount. (C) Duration of REMs, NREMs, and wake episodes. Unpaired t-tests, p = 0.0113 for NREMs duration. (D) Frequency of REMs, NREMs, and wake episodes. Unpaired t-tests, p = 0.0063, 0.0382 for REMs and NREMs frequency.
Author response image 4
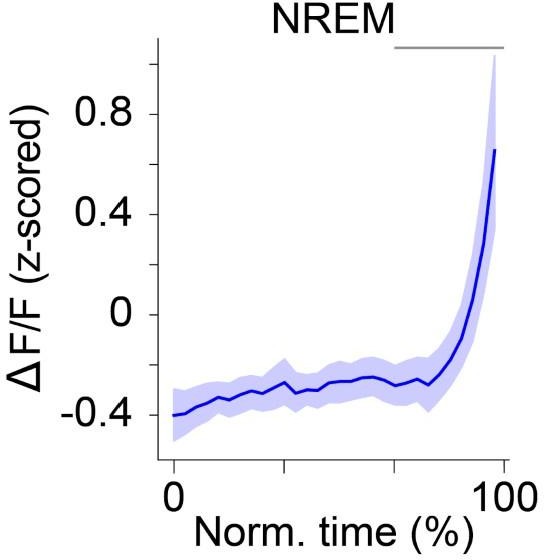
ΔF/Factivity of POA GAD2→TMN neurons during NREMs.
The duration of NREMs episodes was normalized in time, ranging from 0 to 100%. Shading, ± s.e.m. Pairwise t-tests with Holm-Bonferroni correctionp = 5.34 e-4 between80 and100. Graybar, intervals where ΔF/F activity was significantly different from baseline (0 to 20%, the first time bin). n = 10 mice. In Fig. 1E , we ran stats based on the recordings. In this data set, we ran stats based on the individual mice, and found that the activity also gradually increased throughout NREMs episodes.
Additional files
-
MDAR checklist
- https://cdn.elifesciences.org/articles/92095/elife-92095-mdarchecklist1-v1.docx
-
Supplementary file 1
Statistical Analysis Table.
- https://cdn.elifesciences.org/articles/92095/elife-92095-supp1-v1.docx
Download links
A two-part list of links to download the article, or parts of the article, in various formats.
Downloads (link to download the article as PDF)
Open citations (links to open the citations from this article in various online reference manager services)
Cite this article (links to download the citations from this article in formats compatible with various reference manager tools)
Homeostatic regulation of rapid eye movement sleep by the preoptic area of the hypothalamus
eLife 12:RP92095.
https://doi.org/10.7554/eLife.92095.3


