Comparative neuroimaging of sex differences in human and mouse brain anatomy
- Section on Developmental Neurogenomics, Human Genetics Branch, National Institute of Mental Health, United States
- Mouse Imaging Centre, Canada
- The Hospital for Sick Children, Canada
- Department of Medical Biophysics, University of Toronto, Canada
- Wellcome Centre for Integrative Neuroimaging, Nuffield Department of Clinical 15 Neurosciences, University of Oxford, United Kingdom
- Donders Institute for Brain, Cognition and Behaviour, Radboud University Nijmegen, Netherlands
Figures
Figure 1 with 1 supplement
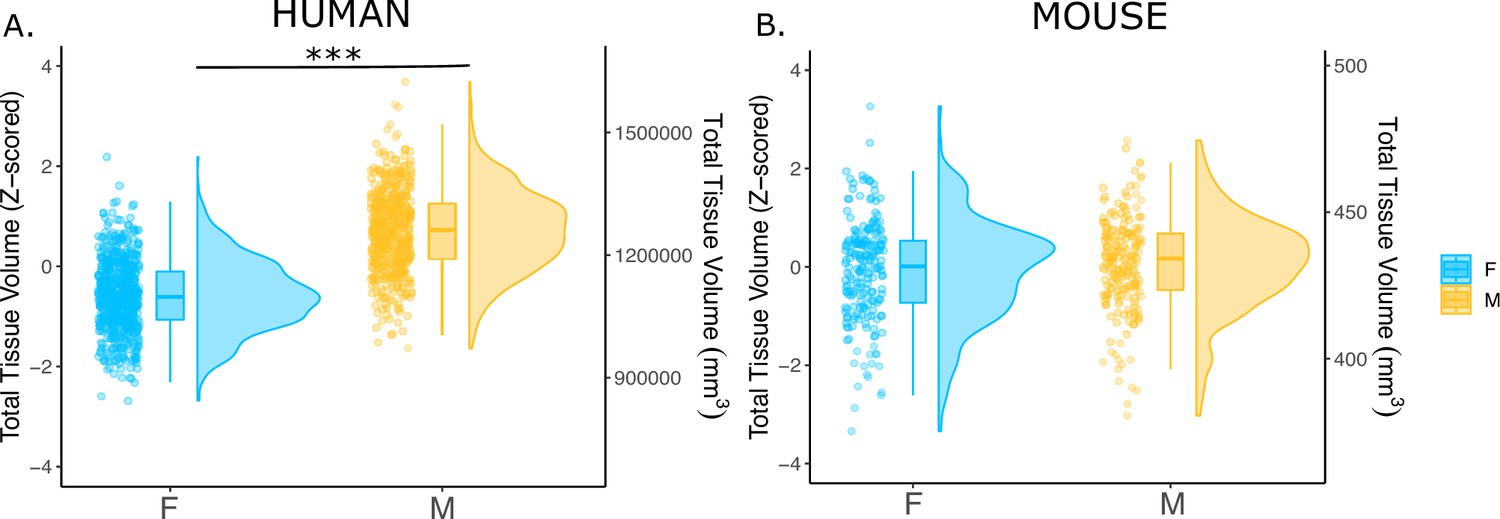
Effects of sex on total tissue volume (TTV) in humans and mice.
Distributions of TTV are shown for the effects of sex in humans (A) and mice (B). Data are represented using individual points, boxplot, and half-violin plot. Linear model used to test for sex differences in each species (correcting for age in both species, Euler number in humans, and background strain in mice) ***p<0.0001 . M=male, F=female.
Figure 1—figure supplement 1
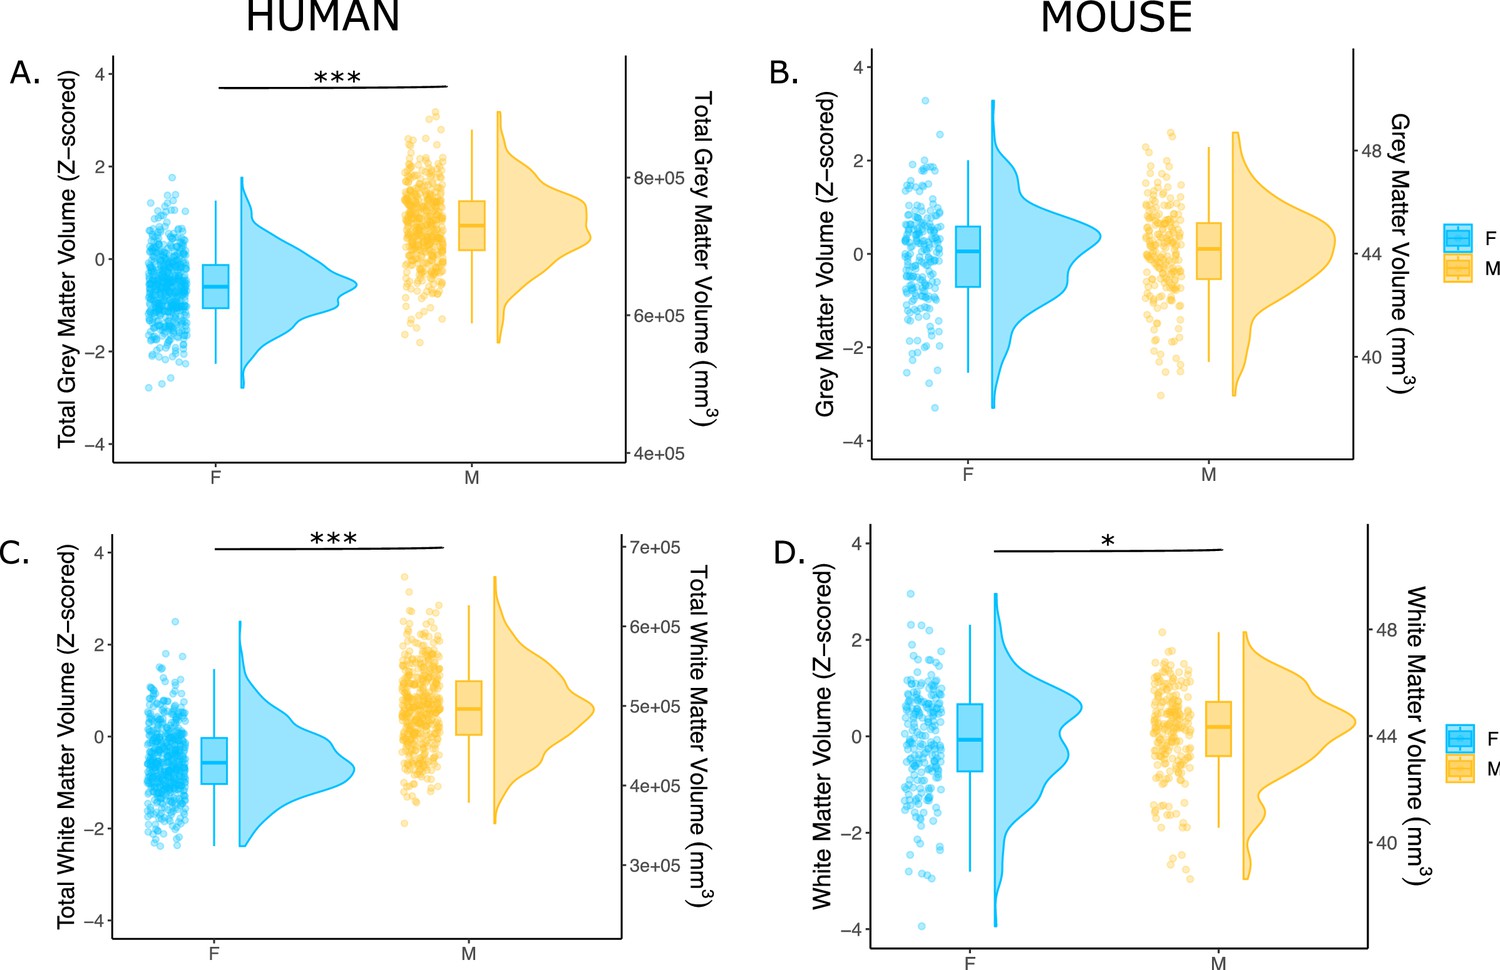
Sex differences in total gray and white matter volume in humans and mice.
Sex differences in total gray matter and total white matter volumes are shown for the humans (A: gray; C: white) and mice (B: gray; D: white). Data are represented using individual points, boxplot, and half-violin plot (raincloud plot). Boxplot midline represents the median, the box represents the first and third quaritles, and the vertical line represent the range of the data. Linear model used to test for sex differences in each species (correcting for age in both species, Euler number in humans, and background strain in mice); ***p<0.001; *p< 0.05; n for humans = 516F/454M, n for mice = 213F/216M.
Figure 2 with 1 supplement

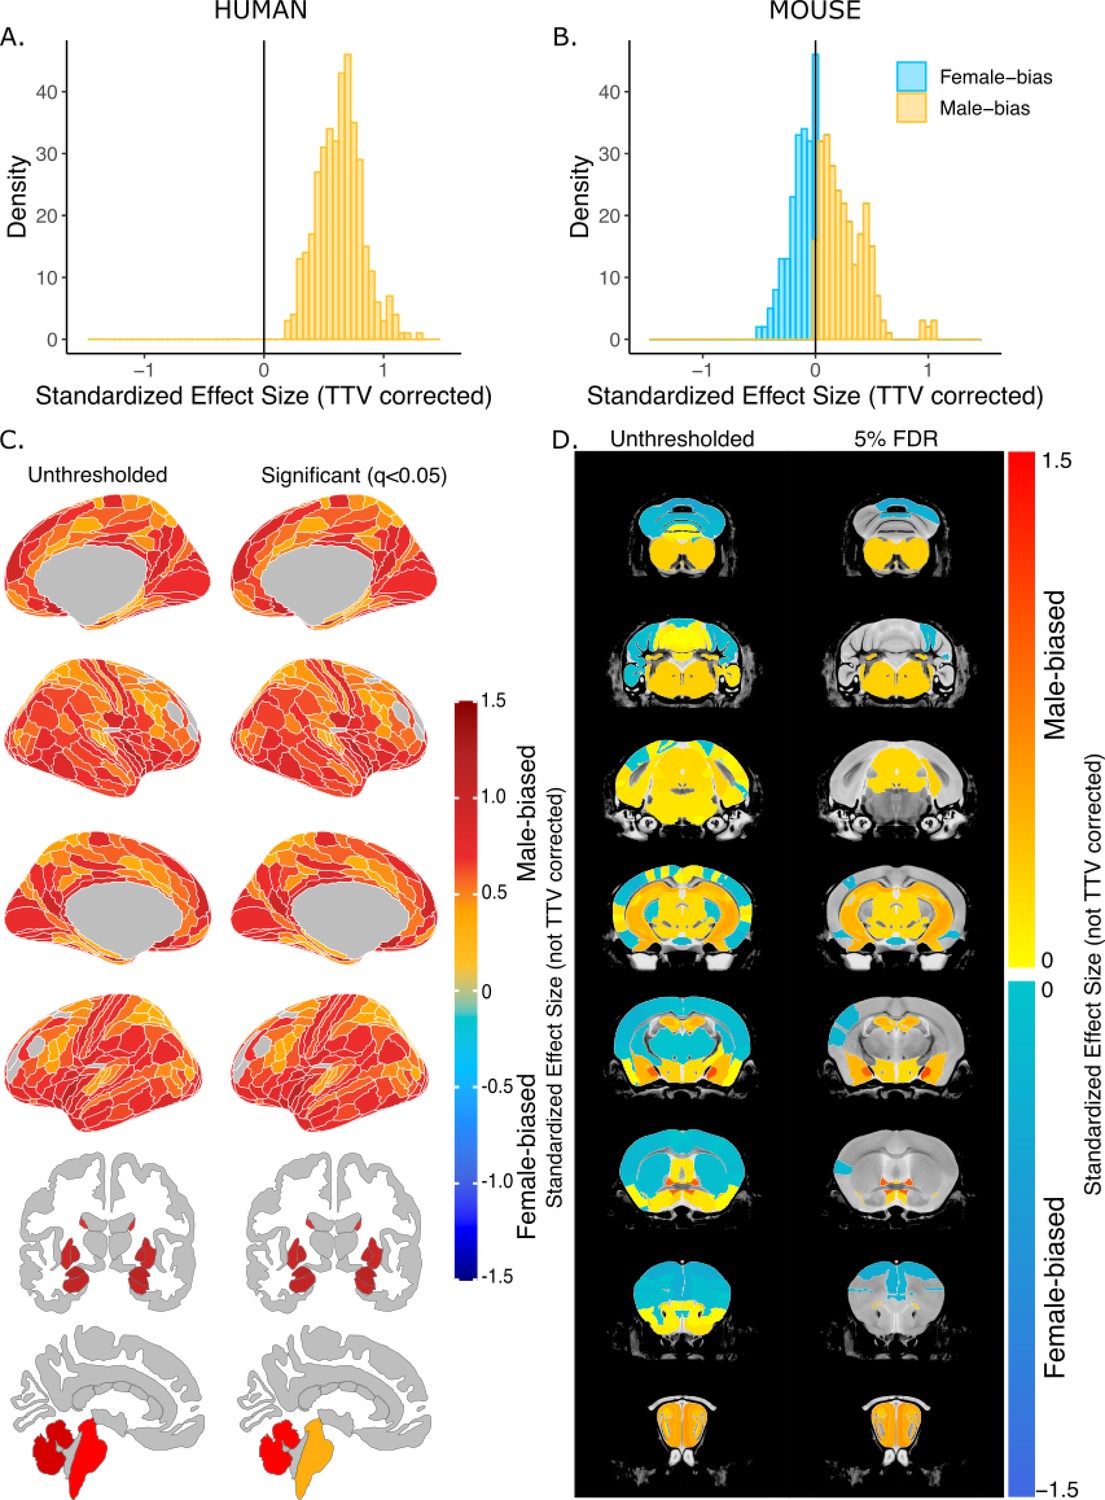
Effect of sex on regional brain volume in humans and mice.
(A, B) Distribution of sex-specific standardized effect sizes across anatomical regions for humans (A) and mice (B). (C, D) Unthresholded (left) and significant (q<0.05; right) standardized effect sizes for the effect of sex displayed on the human (C) and mouse (D) brains. Regions in yellow-red are larger in males and regions in blue are larger in females; n for humans = 516F/454M, n for mice = 213F/216M. Linear model used to test for sex differences in each species across all regions (correcting for age and TTV in both species, Euler number in humans, and background strain in mice). FDR correction used to identify regions with q<0.05.
-
Figure 2—source data 1
Summary of volumetric sex differences across all regions of the human brain.
The table includes the effect size (positive for male-biased and negative for female-biased), the t-value, p-value, and q-value (from false discovery rate, FDR correction).
- https://cdn.elifesciences.org/articles/92200/elife-92200-fig2-data1-v1.xlsx
-
Figure 2—source data 2
Summary of volumetric sex differences across all regions of the mouse brain.
The table includes the effect size (positive for male-biased and negative for female-biased), the t-value, p-value, and q-value (from false discovery rate, FDR correction).
- https://cdn.elifesciences.org/articles/92200/elife-92200-fig2-data2-v1.xlsx
Figure 2—figure supplement 1
Effect of sex on regional brain volume in humans and mice without total tissue volume (TTV) correction.
Distribution of sex-biased standardized effect sizes for humans (A) and mice (B). Unthresholded (left) and significant (q<0.05; right) standardized effect sizes for the effect of sex displayed on the human (C) and mouse (D) brains. Regions in yellow-red are larger in males and regions in blue are larger in females; n for humans = 516F/454M, n for mice = 213F/216M. Linear model used to test for sex differences in each species across all regions (correcting for age in both species, Euler number in humans, and background strain in mice). FDR correction used to identify regions with q<0.05.
Figure 3 with 1 supplement
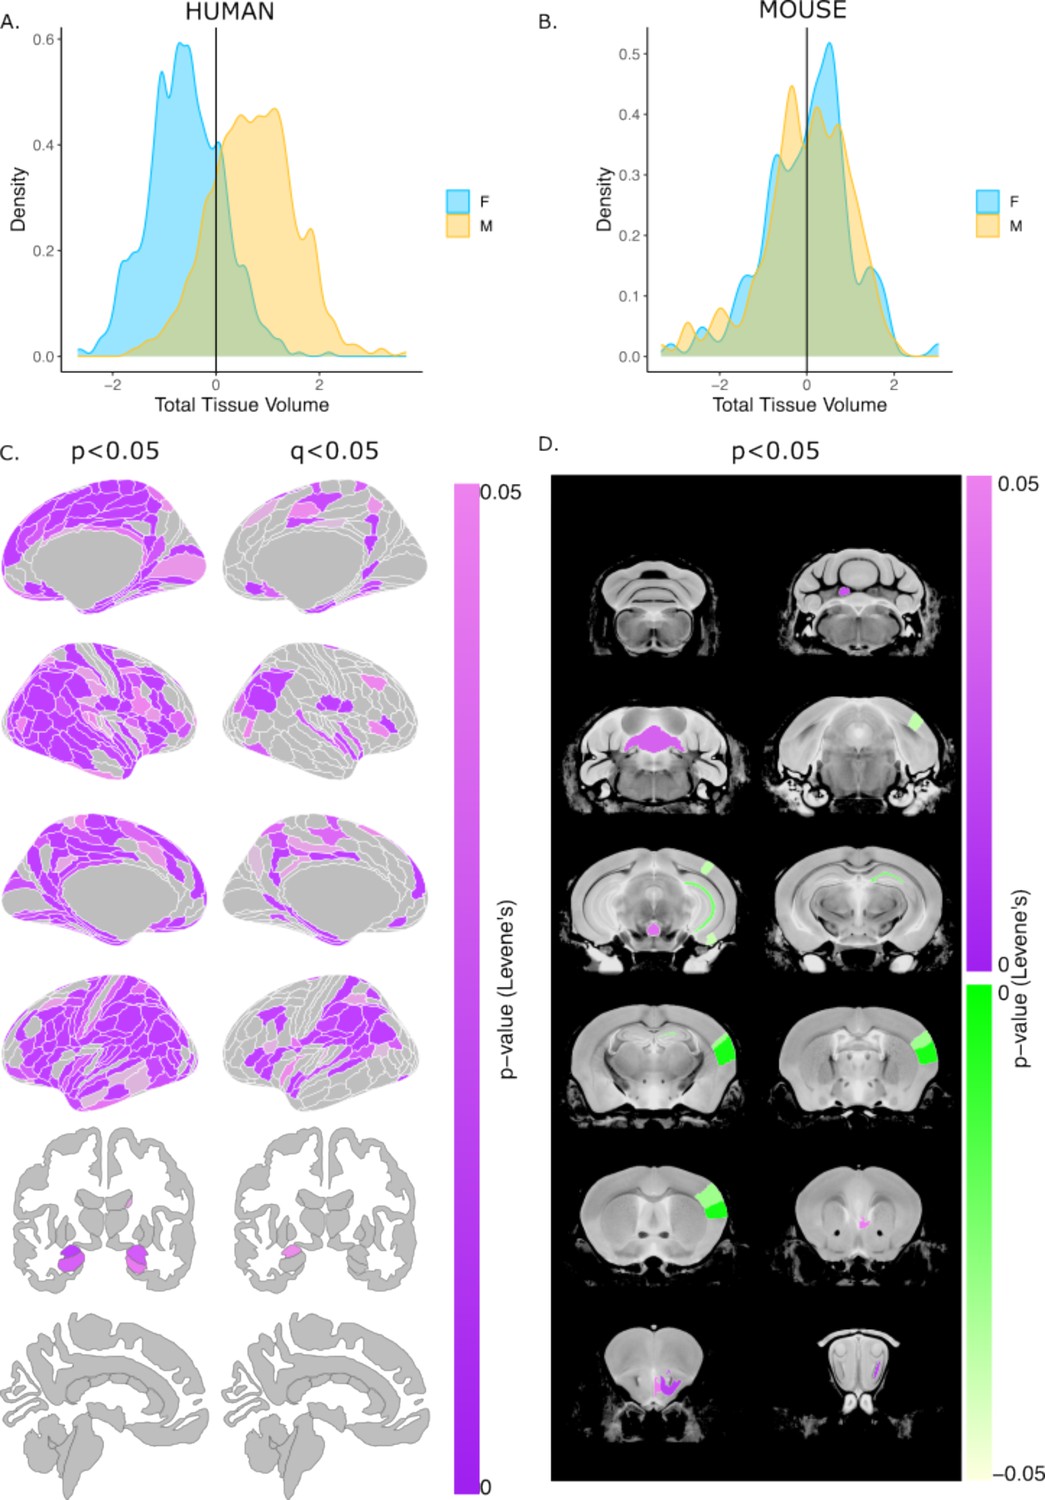
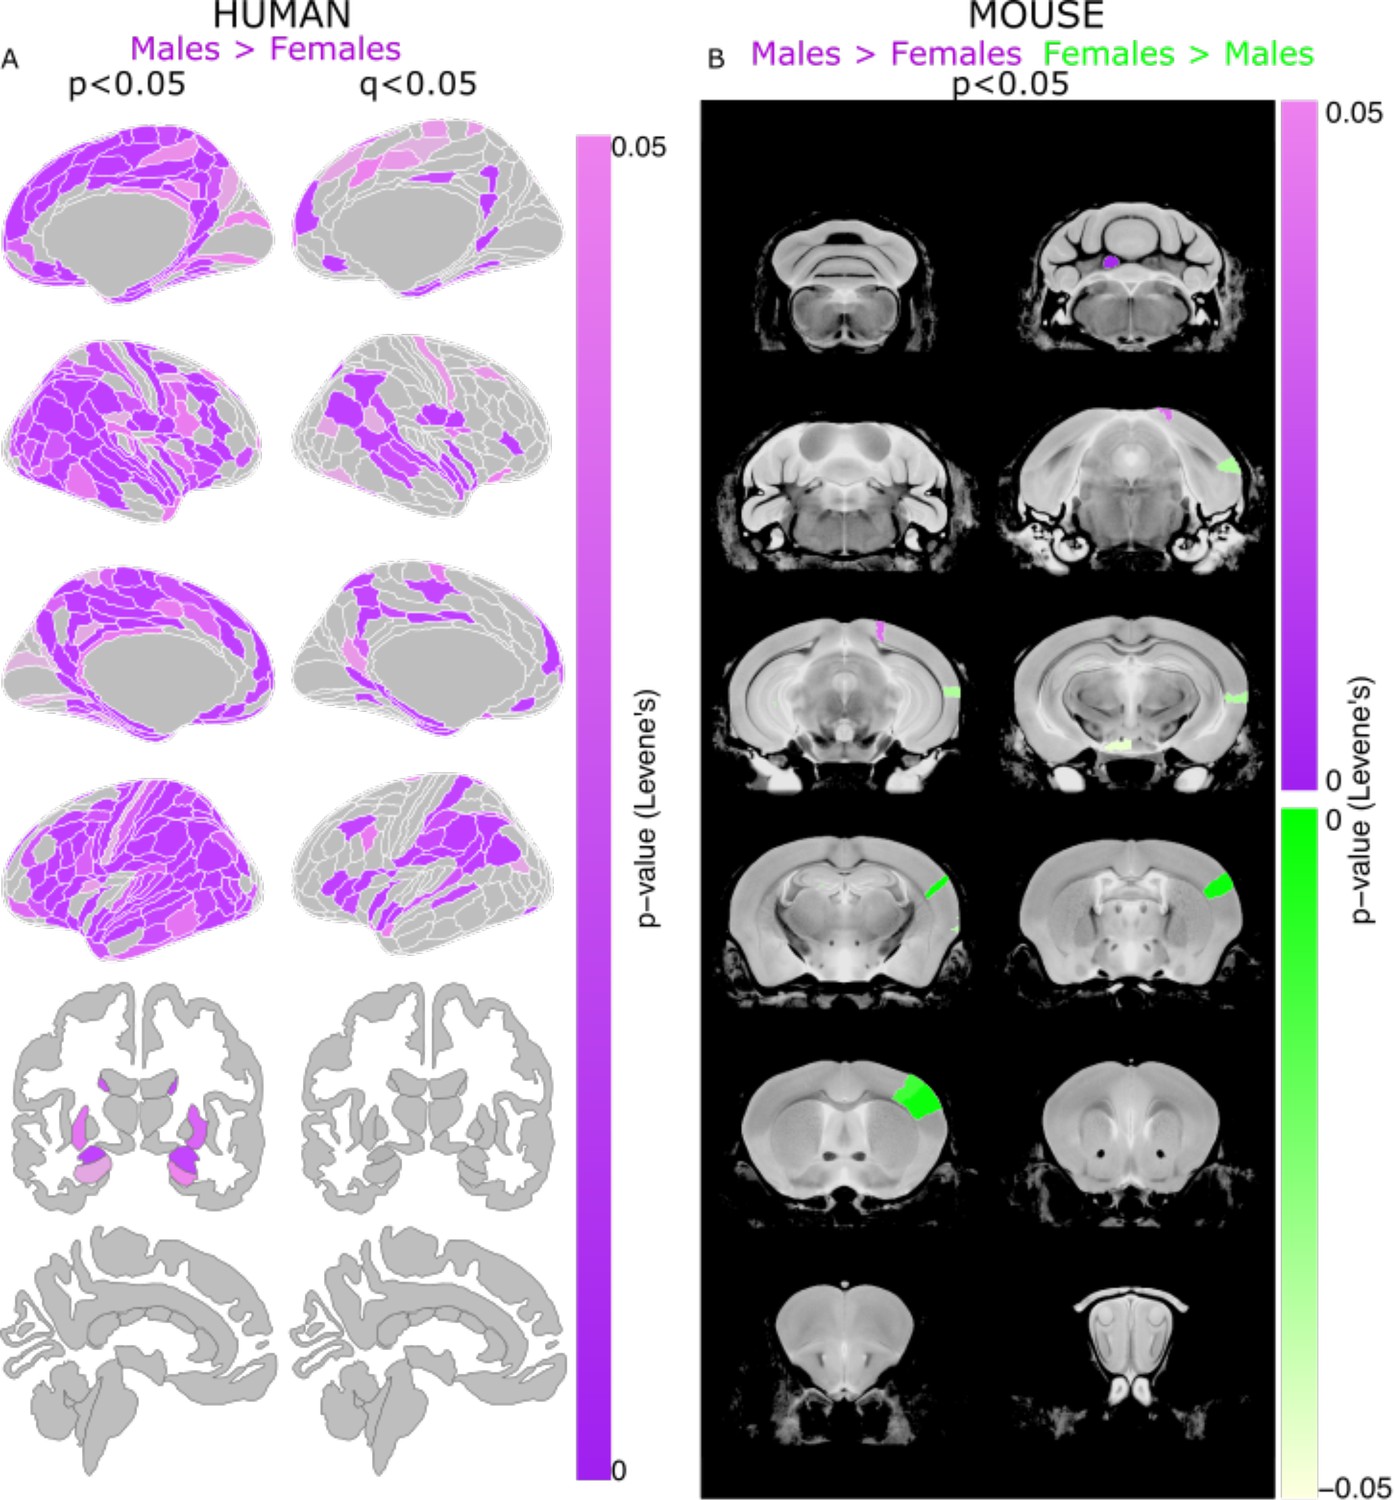
Sex differences in the variability of regional brain volumes (accounting for TTV differences) in humans and mice.
Distribution of z-scored total brain volume measures across all humans (A) and mouse subjects (B). Uncorrected (P<0.05; left) and significant (q<0.05; right) sex differences in variability (based on Levene’s test) shown on the human brain. Uncorrected (P<0.05) sex differences in variability in the mouse brain (purple = more variable in males; green = more variable in females). Note: all regional human volumes were residualized for TTV, age, and Euler, while regional mouse volumes were residualized for TTV, age, and background strain; n for humans = 516F/454M, n for mice = 213F/216M. Levene’s test for equality of variances used to test for sex differences in variance (corrected for age and TTV in both species, Euler number in humans, and background strain in mice). P-values were corrected with FDR to derive q-values.
Figure 3—figure supplement 1
Sex differences in the variability of regional brain volumes (not accounting for TTV differences) in humans and mice.
Uncorrected (P<0.05; left) and significant (q<0.05; right) sex differences in variability (based on Levene’s test) shown on the human brain (A) Uncorrected (P<0.05) sex differences in variability in the mouse brain (purple = more variable in males; green = more variable in females) (B). Note: all regional human volumes were residualized for age and Euler, while regional mouse volumes were residualized for age and background strain; n for humans = 516F/454M, n for mice = 213F/216M. Levene’s test for equality of variances used to test for sex differences in variance (corrected for age in both species, Euler number in humans, and background strain in mice). P-values were corrected with FDR to derive q-values.
Figure 4 with 1 supplement
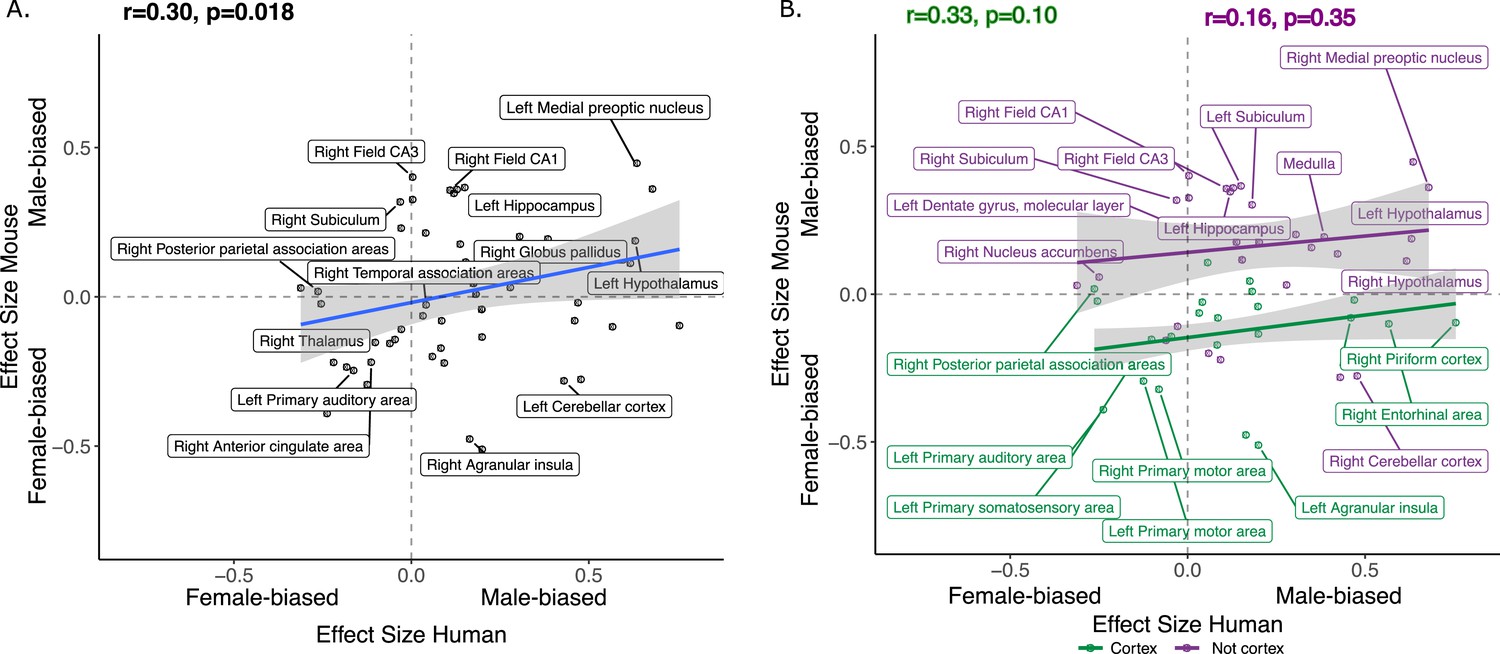
Correlation of sex effects on regional volume in homologous regions of the human and murine brain.
(A) Standardized effect size correlation for the effect of sex in humans (x-axis) and mice (y-axis) (robust correlation coefficient, r=0.30). (B) Correlation of standardized effect sizes for the effect of sex across species for cortical regions (green, r=0.31), and non-cortical regions (purple, r=0.16); n for humans = 516F/454M, n for mice = 213F/216M. Robust correlation used to assess correlation between human and mouse sex effect sizes (corrected for TTV and age in both species, Euler number in humans and background strain in mice) yeild r and p values.
Figure 4—figure supplement 1
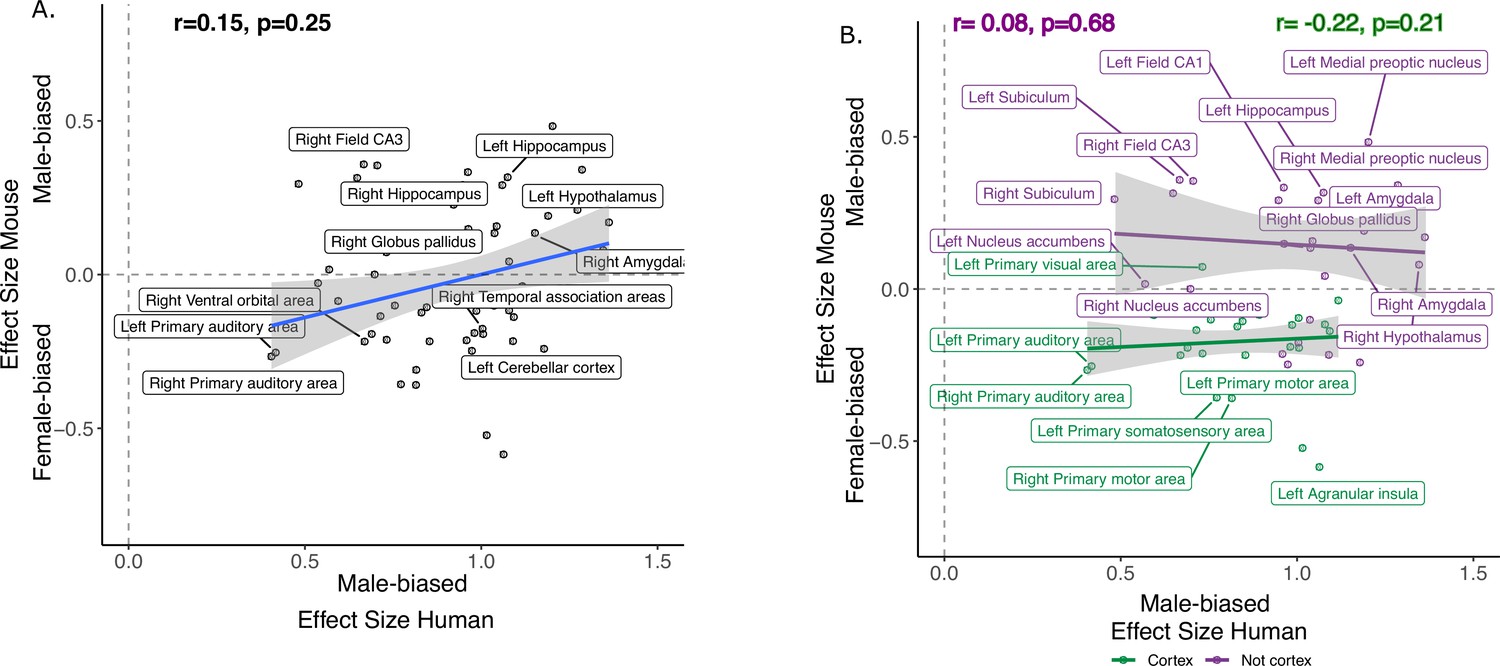
Correlation of effects of sex in human and mouse homologous brain regions without total tissue volume (TTV) correction.
A. Standardized effect size correlation for the effect of sex in humans (x-axis) and mice (y-axis) (r=0.09). (B). Correlation of standardized effect sizes for the effect of sex across species for cortical regions (green, r=−0.09), and non-cortical regions (purple, r=0.20); n for humans = 516F/454M, n for mice = 213F/216M. Robust correlation used to assess relationship between human and mouse sex effect sizes (corrected for age in both species, Euler number in humans and background strain in mice) yeild r and p values.
Figure 5
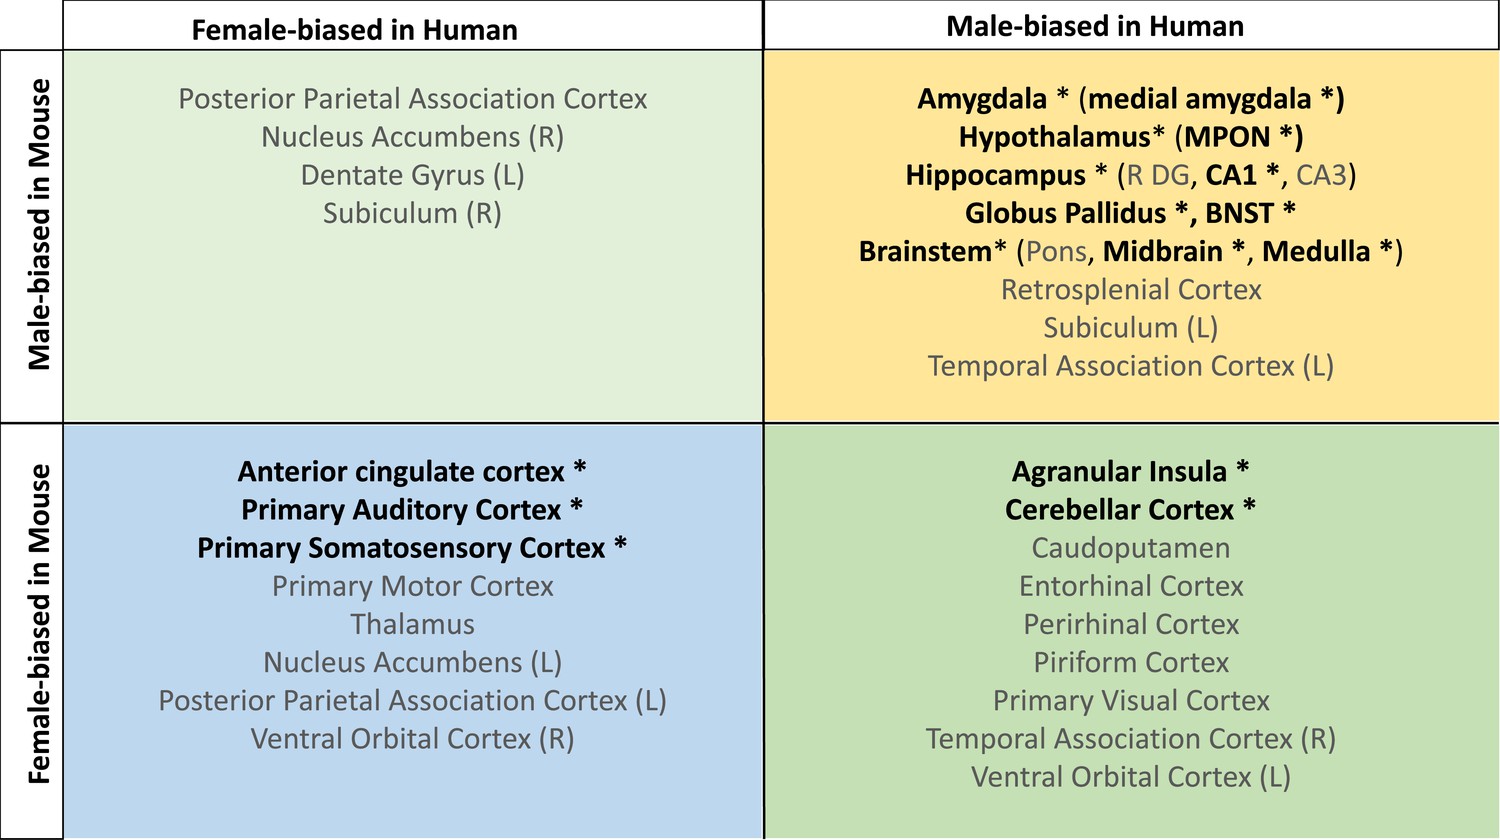
Homologous brain regions show either congruent or divergent sex bias across species.
There are no regions that are larger in human females and mouse males (top left quadrant, light green). Several regions show male-bias (i.e., larger volume in males; top right quadrant in yellow) and female-bias (i.e., larger volume in males; females; bottom left quadrant in blue) across species. A subset of regions shows male-bias in humans but female-bias in mice (bottom right quadrant in green). * denotes significant sex effect in both species; n for humans = 516F/454M, n for mice = 213F/216M. Ordering of quadrants matches the quadrants of the scatter plots in Figure 3 and Figure 5.
Figure 6 with 2 supplements
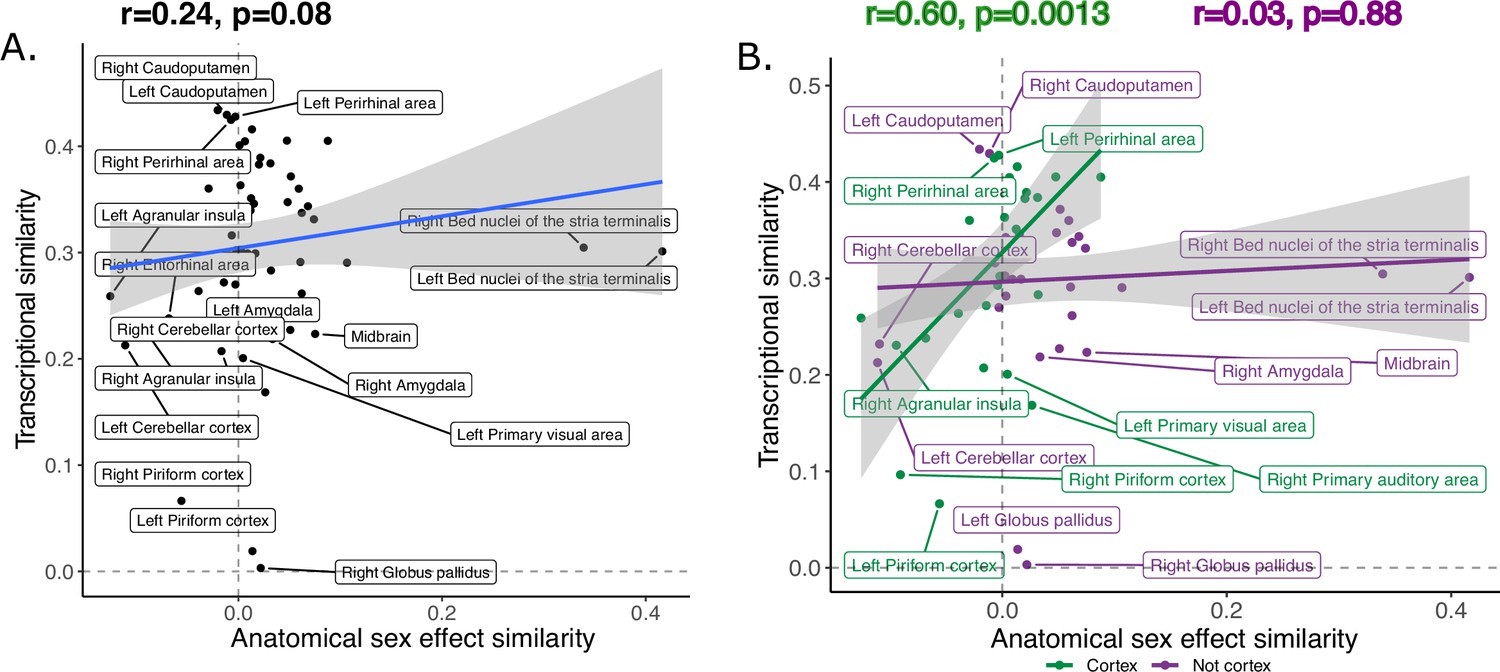
Inter-species anatomical sex congruence and gene expression shows modest correlation across homologous brain regions.
Correlation between similarity in volumetric sex differences and similarity in transcriptional profile using all homologous genes across all homologous regions is modest (A).There was a stronger correlation across cortical (green) compared to non-cortical (purple) regions (B). Robust correlation used to assess correlation between anatomical sex effect similarity and transcriptional similarity yeild r and p values.
Figure 6—figure supplement 1
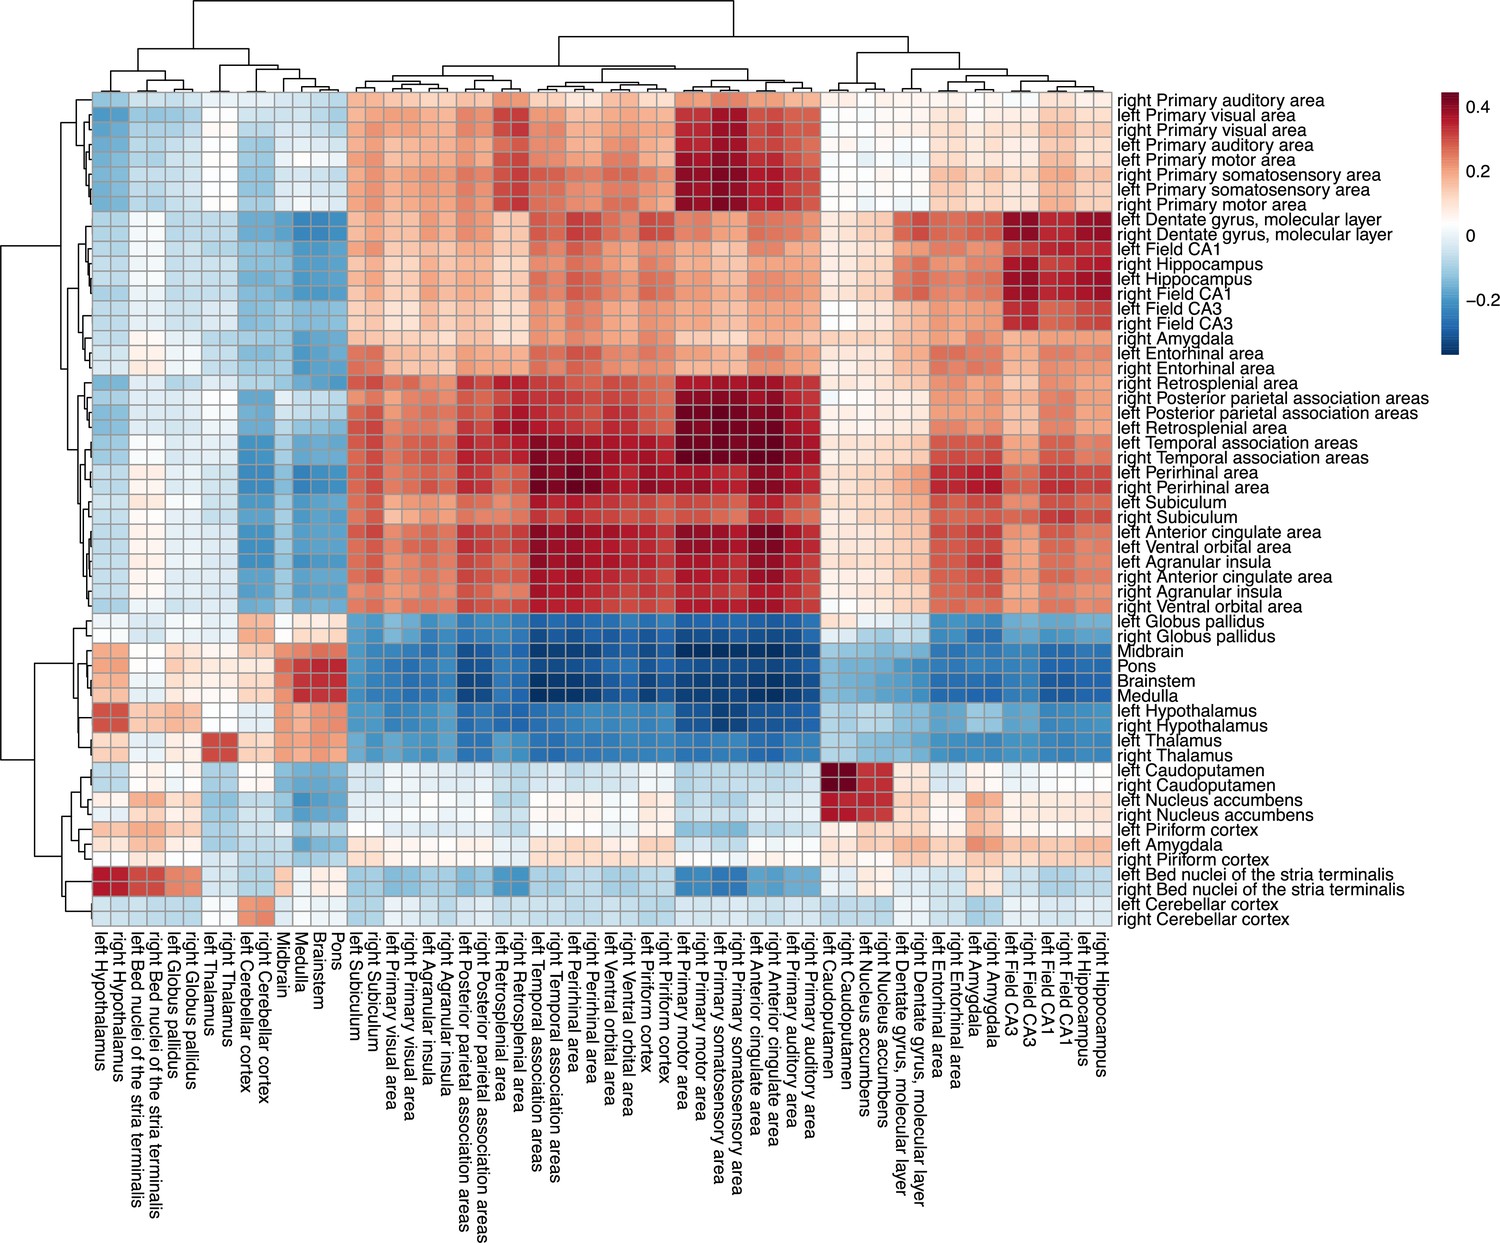
Similarity matrix for cross-species homologous gene expression.
The matrix displays the correlation between 56 homologous human (x-axis) and mouse (y-axis) brain regions based on the expression of 2835 homologous genes. Hierarchical clustering was used to order the rows and columns using the R function pheatmap; n for humans = 516F/454M, n for mice = 213F/216M. Pearson correlation was used to generate the similarity matrix between all pairs of human and mouse regions; colors denote strenght of pearson correlation coefficient (warm for positive r value, cool for negative r value).
Figure 6—figure supplement 2
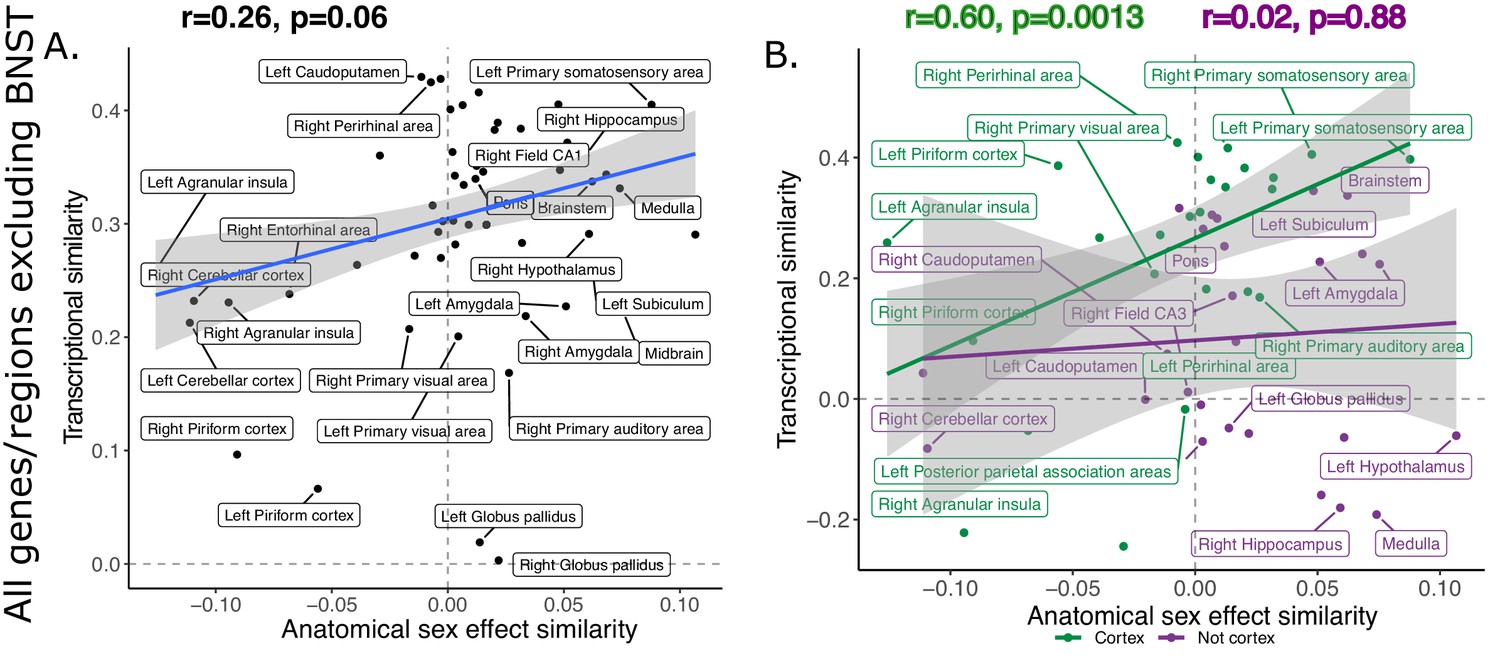
Recomputing inter-species anatomical sex congruence and gene expression exlcuding BNST shows similar correlation to analysis including all homologous brain regions.
Correlation between similarity in volumetric sex differences and similarity in transcriptional profile using all homologous genes across but exlcuding the BNST from homologous regions list (A). There was a stronger correlation across cortical (green) compared to non-cortical (purple) regions (B). Robust correlation used to assess correlation between anatomical sex effect similarity and transcriptional similarity yeild r and p values.
Appendix 1—figure 1
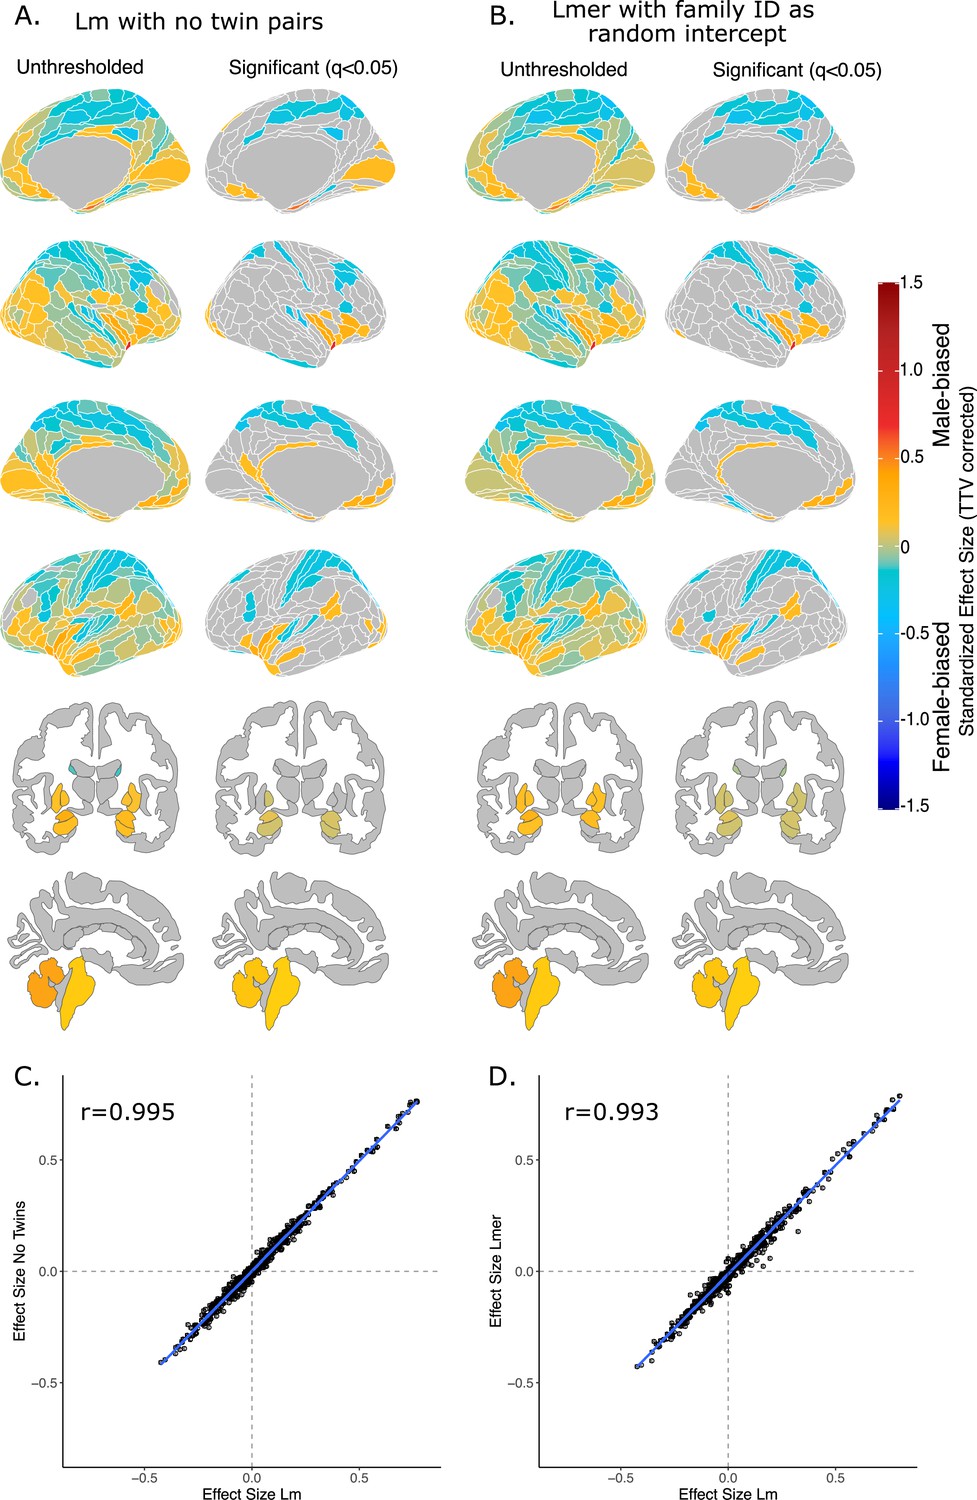
Effect of sex on regional brain volume in humans when accounting for relatedness.
Distribution of sex-biased standardized effect sizes for humans when one twin-pair is excluded (A) or when relatedness is accounted for using linear mixed-effects modeling (B). Unthresholded (left) and significant (q<0.05; right) standardized effect sizes for the effect of sex displayed on the human brains. Regions in yellow-red are male-biased and regions in blue are female-biased. (C) Pearson correlation of standardized effect size for sex generated from a linear model with no twin pairs with effect size for sex generated from linear model with twin pairs included (r=0.995). (C) Pearson correlation of standardized effect size for sex generated from a linear model including twin pairs with effect size for sex generated from a the linear mixed-effects model which included twin pairs, but accounting for relatedness by using a family ID as a random effect. Human sample size excluding twin pairs: n=412F/403M; sample size including twin pairs: n=516F/454M.
Appendix 3—figure 1
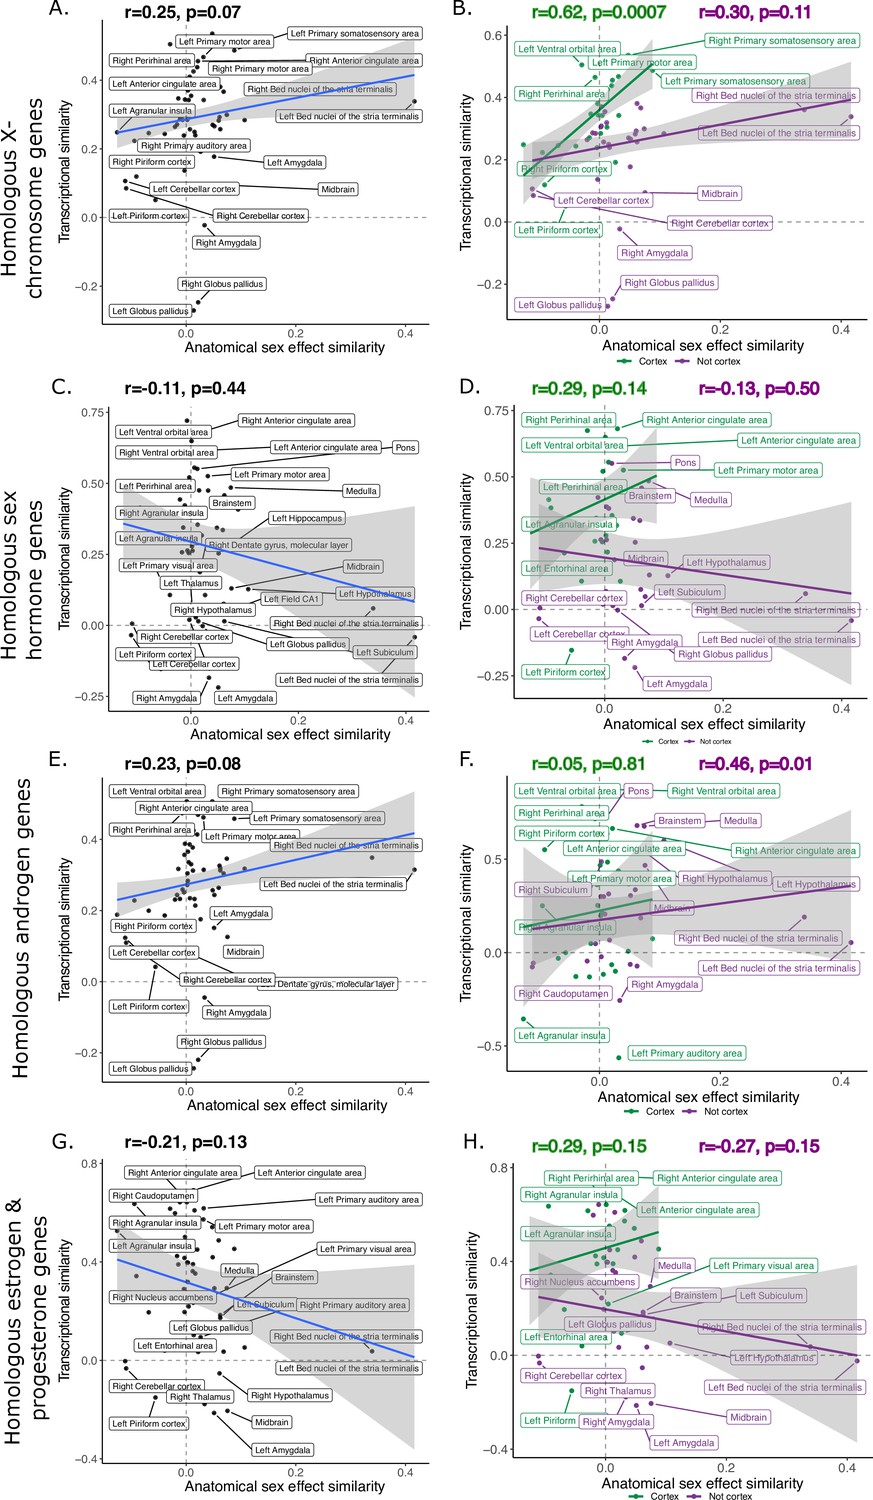
Robust correlation of anatomical similarity of sex effects and transcriptional similarity of homologous brain regions across species.
Robust correlation of anatomical similarity and transcriptional similarity using only X-chromosome homologous genes (n=91; A, B), using only sex hormone genes androgen, estrogen, progesterone genes (n=30; C, D), just androgen genes (E, F), or just estrogen and progesterone genes (G, H) across all homologous regions or split into cortical and non-cortical.
Appendix 3—figure 2
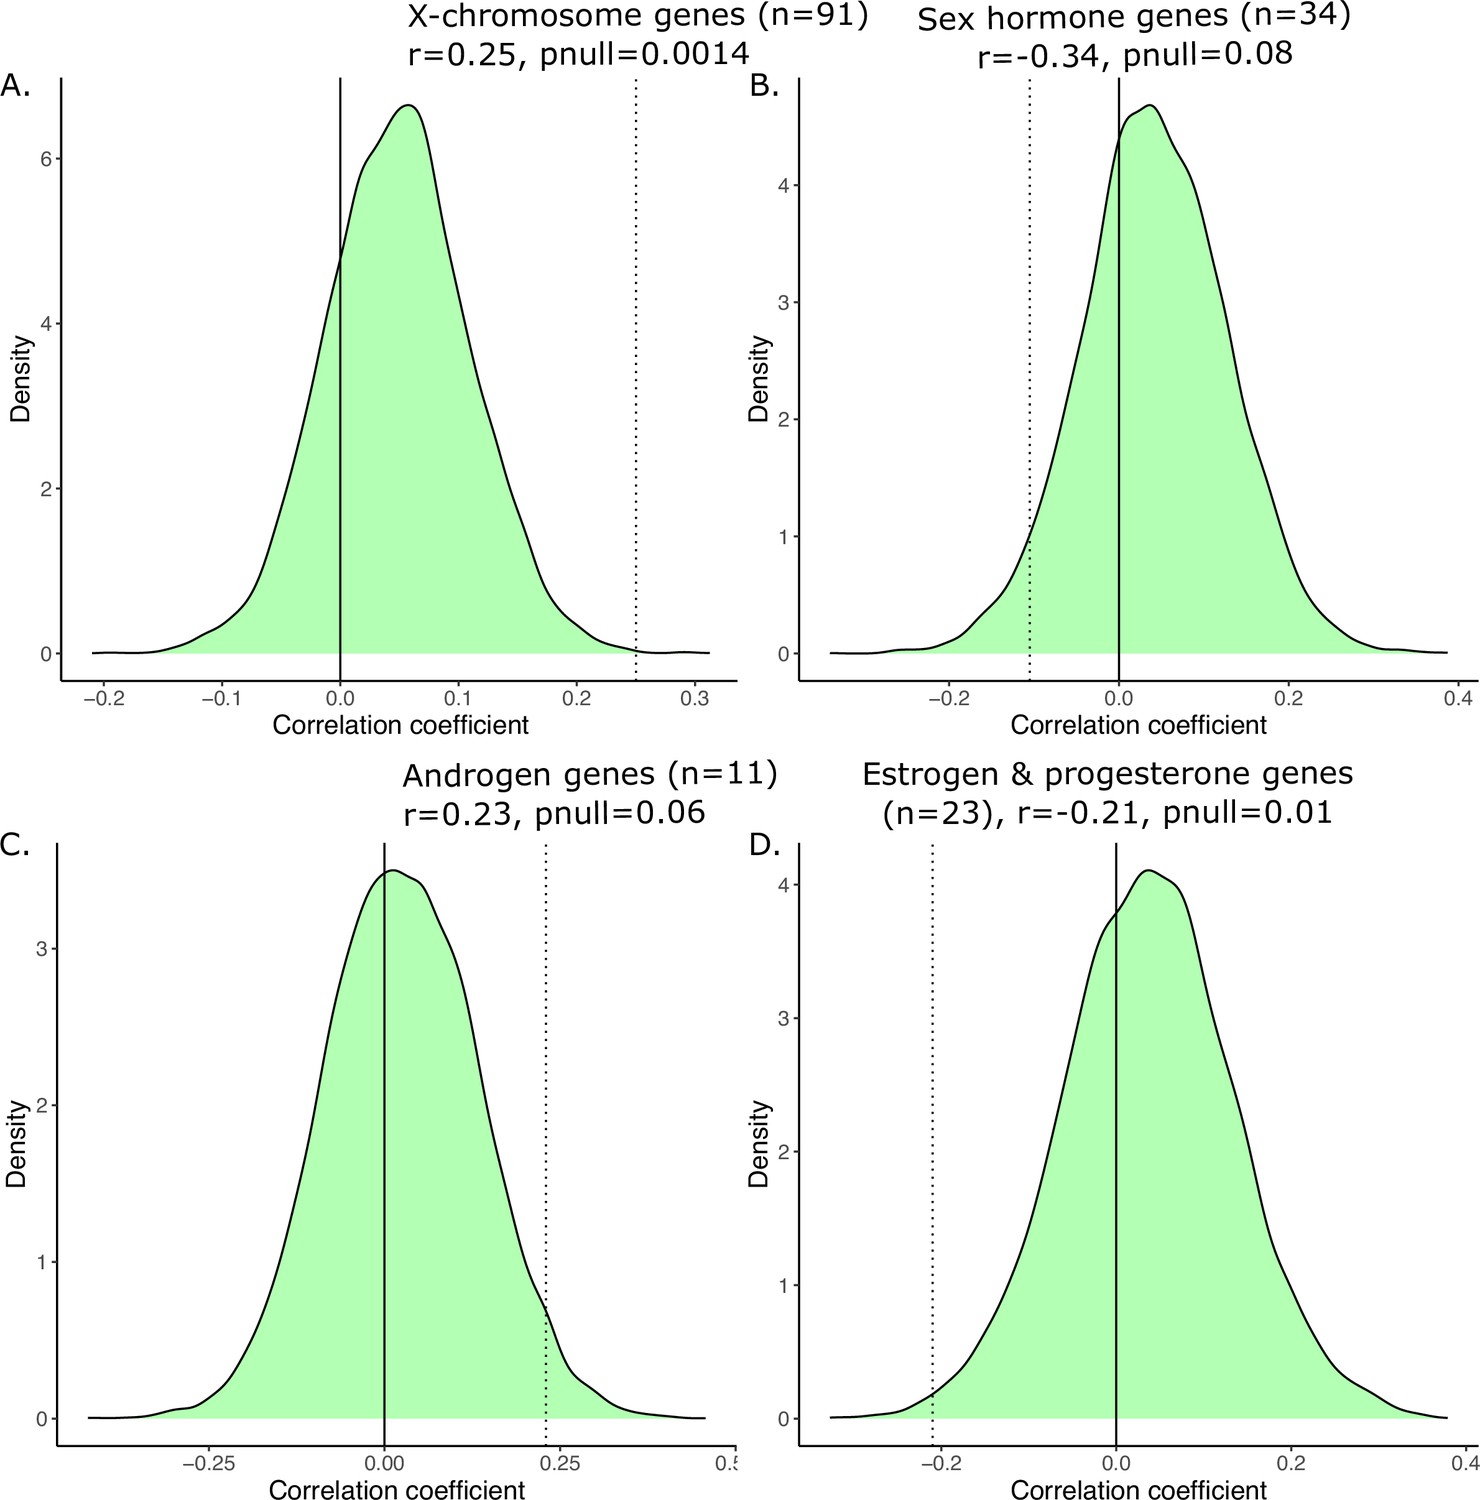
Generating a null distribution of correlation coefficients for the anatomical vs. transcriptional similarity.
Correlations are significant relative to null distribution (shown in green) generated by randomly sampling subsets of 2835 homologous genes corresponding to the biologically informed subsets, recomputing the transcriptional similarity, and correlating that with the anatomical similarity 10,000 times. We have subsets of 91 genes in (A) corresponding to X-linked genes, 34 genes in (B) corresponding to sex hormone genes, 11 genes in (C) corresponding to androgen games, and 23 genes in (D) corresponding to estrogen and progesterone genes. For each, the observed correlation was compared to the null correlation to generate a p-value, displayed on the graph.
Tables
Table 1
Species-specific effect sizes for volumetric sex differences for 60 homologous brain regions.
Effect sizes are color-coded (blue: larger in males/yellow: larger in females) and asterisk/bold text denotes statistical significance. All results are from analyses covarying for total tissue volume (TTV).
| Label | Glasser/Freesurfer# names | Mouse atlas | Hemisphere | Human effect size (β) | Mouse effect size (β) |
|---|---|---|---|---|---|
| Agranular insula | AVI, AAIC, MI | Agranular insular area | L | 0.200 * | –0.558 * |
| R | 0.164 * | –0.522 * | |||
| Amygdala | Amygdala# | Cortical subplate | L | 0.305 * | 0.163 * |
| R | 0.201 * | 0.151 * | |||
| Anterior cingulate area | A24pr, a24, p24pr, p24, 24dd, 24dv, p32pr, d32, a32pr, p32, s32 | Anterior cingulate area | L | –0.102 * | –0.198 |
| R | –0.113 * | –0.267 * | |||
| Bed nucleus of stria terminalis | Bed nucleus of stria terminalis | Bed nucleus of stria terminalis | L | 0.466 * | 0.918 * |
| R | 0.360 * | 0.971 * | |||
| Caudoputamen | Caudate#, Putamen# | Caudoputamen | L | 0.093 | –0.224 * |
| R | 0.059 | –0.188 * | |||
| Cerebellar cortex | Cerebellar cortex# | Cerebellar cortex | L | 0.430 * | –0.268 * |
| R | 0.478 * | –0.250 * | |||
| Dentate gyrus, molecular layer | Dentate gyrus, molecular layer | Dentate gyrus, molecular layer | L | –0.029 | 0.247 * |
| R | 0.041 | 0.232 * | |||
| CA1 | CA1 | CA1 | L | 0.151 * | 0.385 * |
| R | 0.109 | 0.377 * | |||
| CA3 | CA3 | CA3 | L | 0.004 | 0.307 * |
| R | 0.004 | 0.411 * | |||
| Entorhinal cortex | EC | Entorhinal area | L | 0.470 * | –0.090 |
| R | 0.567 * | –0.138 | |||
| Globus pallidus | Globus Pallidus# | Pallidum | L | 0.154 * | 0.112 * |
| R | 0.138 * | 0.180 * | |||
| Hippocampus | Hippocampus# | Hippocampal region | L | 0.120 * | 0.353 * |
| R | 0.129 * | 0.379 * | |||
| Hypothalamus | Hypothalamus | Hypothalamus | L | 0.631 * | 0.185 * |
| R | 0.617 * | 0.109 * | |||
| Medial amygdalar nucleus | Medial amygdalar nucleus | Medial amygdalar nucleus | L | 0.253 * | 0.906 * |
| R | 0.183 * | 1.034 * | |||
| Medial preoptic area | Medial preoptic area | Medial preoptic area | L | 0.636 * | 0.435 * |
| R | 0.680 * | 0.367 * | |||
| Nucleus accumbens | Nucleus accumbens# | Striatum ventral region | L | –0.311 * | –0.005 |
| R | –0.249 * | 0.032 | |||
| Perirhinal area | PeEc, TF, PHA2, PHA3 | Perirhinal area | L | 0.033 | –0.120 |
| R | 0.086 | –0.108 | |||
| Piriform cortex | Pir | Piriform cortex | L | 0.460 | –0.131 |
| R | 0.756 * | –0.151 | |||
| Posterior parietal association areas | 5 m, 5 mv, 5 L | Posterior parietal association areas | L | –0.254 * | 0.016 |
| R | –0.263 * | 0.039 | |||
| Primary auditory area | A1 | Primary auditory area | L | –0.163 | –0.256 * |
| R | –0.182 * | –0.209 * | |||
| Primary motor area | 4 | Primary motor area | L | –0.124 | –0.329 * |
| R | –0.081 | –0.357 * | |||
| Primary somatosensory area | 1, 2, 3 a, 3b | Primary somatosensory area | L | –0.237 * | –0.419 * |
| R | –0.219 * | –0.241 * | |||
| Primary visual area | V1 | Primary visual area | L | 0.175 * | 0.029 |
| R | 0.199 * | –0.102 | |||
| Retrosplenial area | RSC | Retrosplenial area | L | 0.198 * | 0.004 |
| R | 0.182 * | 0.035 | |||
| Subiculum | PreS | Subiculum | L | 0.182 * | 0.317 * |
| R | –0.031 | 0.338 * | |||
| Temporal association areas | FFC, PIT, TE1a, TE1p, TE2a, TF, STV, STSvp, STSva | Temporal association areas | L | 0.057 | 0.085 |
| R | 0.042 | –0.004 | |||
| Thalamus | Thalamus# | Thalamus | L | –0.028 | –0.098 |
| R | –0.060 | –0.139 * | |||
| Ventral orbital area | 10 r, 10 v | Ventral orbital area | L | 0.083 | –0.209 * |
| R | –0.046 | –0.171 | |||
| Brain stem (midline) | Brainstem# | Midbrain, Hindbrain | M | 0.349 * | 0.200 * |
| Medulla (midline) | Medulla | Medulla | M | 0.385 * | 0.204 * |
| Midbrain (midline) | Midbrain | Midbrain | M | 0.423 * | 0.191 * |
| Pons (midline) | Pons | Pons | M | 0.279 * | 0.065 |
Table 2
Demographics for human sample.
| Females | Males | Statistics | ||
|---|---|---|---|---|
| Sample size | 516 | 454 | ||
| Age | Mean | 29.41 | 27.9 | F(1,1082)=57.13, p=8.67e-14 *** |
| SD | 3.68 | 3.61 | ||
| Range | 22–36 | 22–37 | ||
| Education (in years) | Mean | 14.96 | 14.84 | F(1,1082)=1.465, p=0.226 |
| SD | 1.83 | 1.77 | ||
| Range | 11–17 | 11–17 | ||
| Euler number | Mean | –52.47 | –58.26 | F(1,1082)=25.72, p=4.65e-07 *** |
| SD | 17.66 | 19.25 | ||
| Range | –126 to –16 | –136 to –16 | ||
| Zygosity | Monozygotic | 102 | 49 | X2=26.281, p=8.33e-06 |
| Dizygotic | 163 | 131 | ||
| Not Twin | 251 | 274 |
-
*p<0.01 **p<0.001 for ANOVA test of significant difference between groups (males vs. females). SD=standard deviation.
Table 3
Demographics for mouse sample.
For details regarding the origin of each mouse cohort refer to Appendix 5—table 1.
| Female | Male | Statistics | |
|---|---|---|---|
| Sample size | 213 | 216 | |
| Age | |||
| Mean | 62.0 | 62.8 | F(1,70)=0.78, p=0.38 |
| SD | 7.5 | 8.6 | |
| Range | 56–90 | 56–90 | |
| Background Strain | |||
| C57BL-6J | 134 | 141 | |
| C57BL-6N | 79 | 75 | |
| Mouse Cohort for C57BL6J | |||
| A | 10 | 12 | X2=5.46, p=0.91 |
| B | 15 | 15 | |
| C | 27 | 29 | |
| D | 13 | 7 | |
| E | 8 | 11 | |
| F | 9 | 10 | |
| G | 7 | 9 | |
| H | 10 | 10 | |
| I | 7 | 9 | |
| J | 10 | 6 | |
| K | 9 | 8 | |
| L | 9 | 15 | |
| Mouse Cohort for C57BL6N | |||
| M | 13 | 19 | X2=5.745, p=0.332 |
| N | 10 | 8 | |
| O | 25 | 13 | |
| P | 9 | 9 | |
| Q | 9 | 13 | |
| R | 13 | 12 | |
Appendix 2—table 1
Mapping of homologous human-mouse brain regions (not TTV-corrected standardized effect sizes).
Blue shade highlights female-biased regions, while yellow shade highlights male-biased regions. In humans, the subset of homologous regions was all male-biased due to the larger overall brain size in males. In mice, we observed the same patterns of sex-bias as we did in the analyses which contrived for total tissue volume (TTV) except for the right nucleus accumbens showing no sex bias and a male-bias in the pons (both female-biased in the TTV controlled analysis).
| Label | Glasser/Freesurfer# names | Mouse atlas | Hemisphere | Human effect size | Mouse effect size |
|---|---|---|---|---|---|
| Agranular insula | AVI, AAIC, MI | Agranular insular area | L | 1.025 * | –0.484 * |
| R | 0.985 * | –0.453 * | |||
| Amygdala | Amygdala# | Cortical subplate | L | 1.194 * | 0.265 * |
| R | 1.135 * | 0.240 * | |||
| Anterior cingulate area | A24pr, a24, p24pr, p24, 24dd, 24dv, p32pr, d32, a32pr, p32, s32 | Anterior cingulate area | L | 0.946 * | –0.107 |
| R | 0.958 * | –0.173 | |||
| Bed nucleus of stria terminalis | Bed nucleus of stria terminalis | Bed nucleus of stria terminalis | L | 1.160 * | 0.937 * |
| R | 1.131 * | 0.959 * | |||
| Caudoputamen | Caudate#, Putamen# | Caudoputamen | L | 0.986 * | –0.158 |
| R | 0.993 * | –0.132 | |||
| Cerebellar cortex | Cerebellar cortex# | Cerebellar cortex | L | 1.123 * | –0.220 * |
| R | 1.192 * | –0.218 | |||
| Dentate gyrus, molecular layer | Dentate gyrus, molecular layer | Dentate gyrus, molecular layer | L | 0.885 * | 0.292 * |
| R | 0.935 * | 0.275 * | |||
| CA1 | CA1 | CA1 | L | 0.936 * | 0.427 * |
| R | 0.925 * | 0.417 * | |||
| CA3 | CA3 | CA3 | L | 0.593 * | 0.382 * |
| R | 0.663 * | 0.460 * | |||
| Entorhinal cortex | EC | Entorhinal area | L | 0.925 * | 0.038 |
| R | 0.984 * | –0.047 | |||
| Globus pallidus | Globus Pallidus# | Pallidum | L | 1.040 * | 0.167 * |
| R | 1.049 * | 0.229 * | |||
| Hippocampus | Hippocampus# | Hippocampal region | L | 1.045 * | 0.414 * |
| R | 1.033 * | 0.426 * | |||
| Hypothalamus | Hypothalamus | Hypothalamus | L | 1.374 * | 0.245 * |
| R | 1.354 * | 0.170 | |||
| Medial amygdalar nucleus | Medial amygdalar nucleus | Medial amygdalar nucleus | L | 0.547 * | 0.926 * |
| R | 0.654 * | 1.057 * | |||
| Medial preoptic area | Medial preoptic area | Medial preoptic area | L | 1.205 * | 0.472 * |
| R | 1.275 * | 0.388 * | |||
| Nucleus accumbens | Nucleus accumbens# | Striatum ventral region | L | 0.596 * | 0.079 |
| R | 0.709 * | 0.106 | |||
| Perirhinal area | PeEc, TF, PHA2, PHA3 | Perirhinal area | L | 0.839 * | –0.014 |
| R | 0.821 * | –0.029 | |||
| Piriform cortex | Pir | Piriform cortex | L | 0.988 * | –0.020 |
| R | 1.076 * | –0.039 | |||
| Posterior parietal association areas | 5 m, 5 mv, 5 L | Posterior parietal association areas | L | 0.519 * | 0.028 |
| R | 0.554 * | 0.066 | |||
| Primary auditory area | A1 | Primary auditory area | L | 0.352 * | –0.192 |
| R | 0.357 * | –0.183 | |||
| Primary motor area | 4 | Primary motor area | L | 0.785 * | –0.237 * |
| R | 0.795 * | –0.269 * | |||
| Primary somatosensory area | 1, 2, 3 a, 3b | Primary somatosensory area | L | 0.743 * | –0.332 * |
| R | 0.671 * | –0.162 | |||
| Primary visual area | V1 | Primary visual area | L | 0.729 * | 0.098 |
| R | 0.703 * | –0.085 | |||
| Retrosplenial area | RSC | Retrosplenial area | L | 0.838 * | 0.010 |
| R | 0.770 * | 0.062 | |||
| Subiculum | PreS | Subiculum | L | 0.643 * | 0.370 * |
| R | 0.433 * | 0.382 * | |||
| Temporal association areas | FFC, PIT, TE1a, TE1p, TE2a, TF, STV, STSvp, STSva | Temporal association areas | L | 1.084 * | 0.159 |
| R | 1.060 * | 0.024 | |||
| Thalamus | Thalamus# | Thalamus | L | 1.019 * | –0.040 |
| R | 0.994 * | –0.087 | |||
| Ventral orbital area | 10 r, 10 v | Ventral orbital area | L | 0.666 * | –0.121 |
| R | 0.605 * | –0.093 | |||
| Brain stem (midline) | Brainstem# | Midbrain, Hindbrain | M | 1.209 * | 0.226 * |
| Medulla (midline) | Medulla | Medulla | M | 1.111 * | 0.255 * |
| Midbrain (midline) | Midbrain | Midbrain | M | 1.280 * | 0.194 * |
| Pons (midline) | Pons | Pons | M | 1.101 * | 0.101 |
Appendix 5—table 1
Information about the origin laboratory of wild-type (WT) mice was included in the study.
| Background strain | Study cohort key | Origin laboratory |
|---|---|---|
| C57BL6J | A | University of Michigan; Dr. Diane Robinson |
| B | KAIST; Dr. Eunjoon Kim | |
| C | University of Western Ontario; Dr. Nathalie Berube | |
| D | UT Southwestern; Dr. Genevieve Konopka | |
| E | Duke University; Dr. Christelle Golzio | |
| F | Duke University; Dr. Christelle Golzio | |
| G | Lost Angeles Children’s Hospital; Dr. Pat Levitt | |
| H | Columbia University; Dr. Jeremy Veenstra-VenderWeele | |
| I | Scripps Research Institute; Dr. Gavin Rumbaugh | |
| J | McMaster University; Dr. Karun Singh | |
| K | McMaster University; Dr. Jane Foster | |
| L | University of Toronto Center for Phenogenomics | |
| C57BL6N | M | The Hospital for Sick Children; Dr. Lauryl Nutter |
| N | UC Davis - MIND Institute; Dr. Alex Nord | |
| O | The Hospital for Sick Children; Dr. Lauryl Nutter | |
| P | UCSD; Dr. Lilia Iakoucheva | |
| Q | UT Southwestern; Dr. Graig Powell | |
| R | UC Davis; Dr. Alexander Nord |
Additional files
-
MDAR checklist
- https://cdn.elifesciences.org/articles/92200/elife-92200-mdarchecklist1-v1.docx
-
Source data 1
Sex hormone gene and sex chromosome lists for both species.
Gene list based on gene ontology search terms (from Bader Lab) used to identify genes associated with sex hormones including androgen, estrogen, and progesterone, as well as X-chromosome genes.
- https://cdn.elifesciences.org/articles/92200/elife-92200-data1-v1.xlsx
-
Source data 2
Homologous sex hormone and sex chromosome genes.
Genes identified in Source data 1 were filtered to only include homologous genes to allow for cross-species comparison.
- https://cdn.elifesciences.org/articles/92200/elife-92200-data2-v1.xlsx
Download links
A two-part list of links to download the article, or parts of the article, in various formats.
Downloads (link to download the article as PDF)
Open citations (links to open the citations from this article in various online reference manager services)
Cite this article (links to download the citations from this article in formats compatible with various reference manager tools)
Comparative neuroimaging of sex differences in human and mouse brain anatomy
eLife 13:RP92200.
https://doi.org/10.7554/eLife.92200.2


