Gene expression mapping of the neuroectoderm across phyla – conservation and divergence of early brain anlagen between insects and vertebrates
- Department of Developmental Biology, Johann-Friedrich-Blumenbach Institute, University Goettingen, Germany
- Department of Evolutionary Developmental Genetics, Johann-Friedrich-Blumenbach Institute, University of Göttingen, Germany
Figures
Figure 1
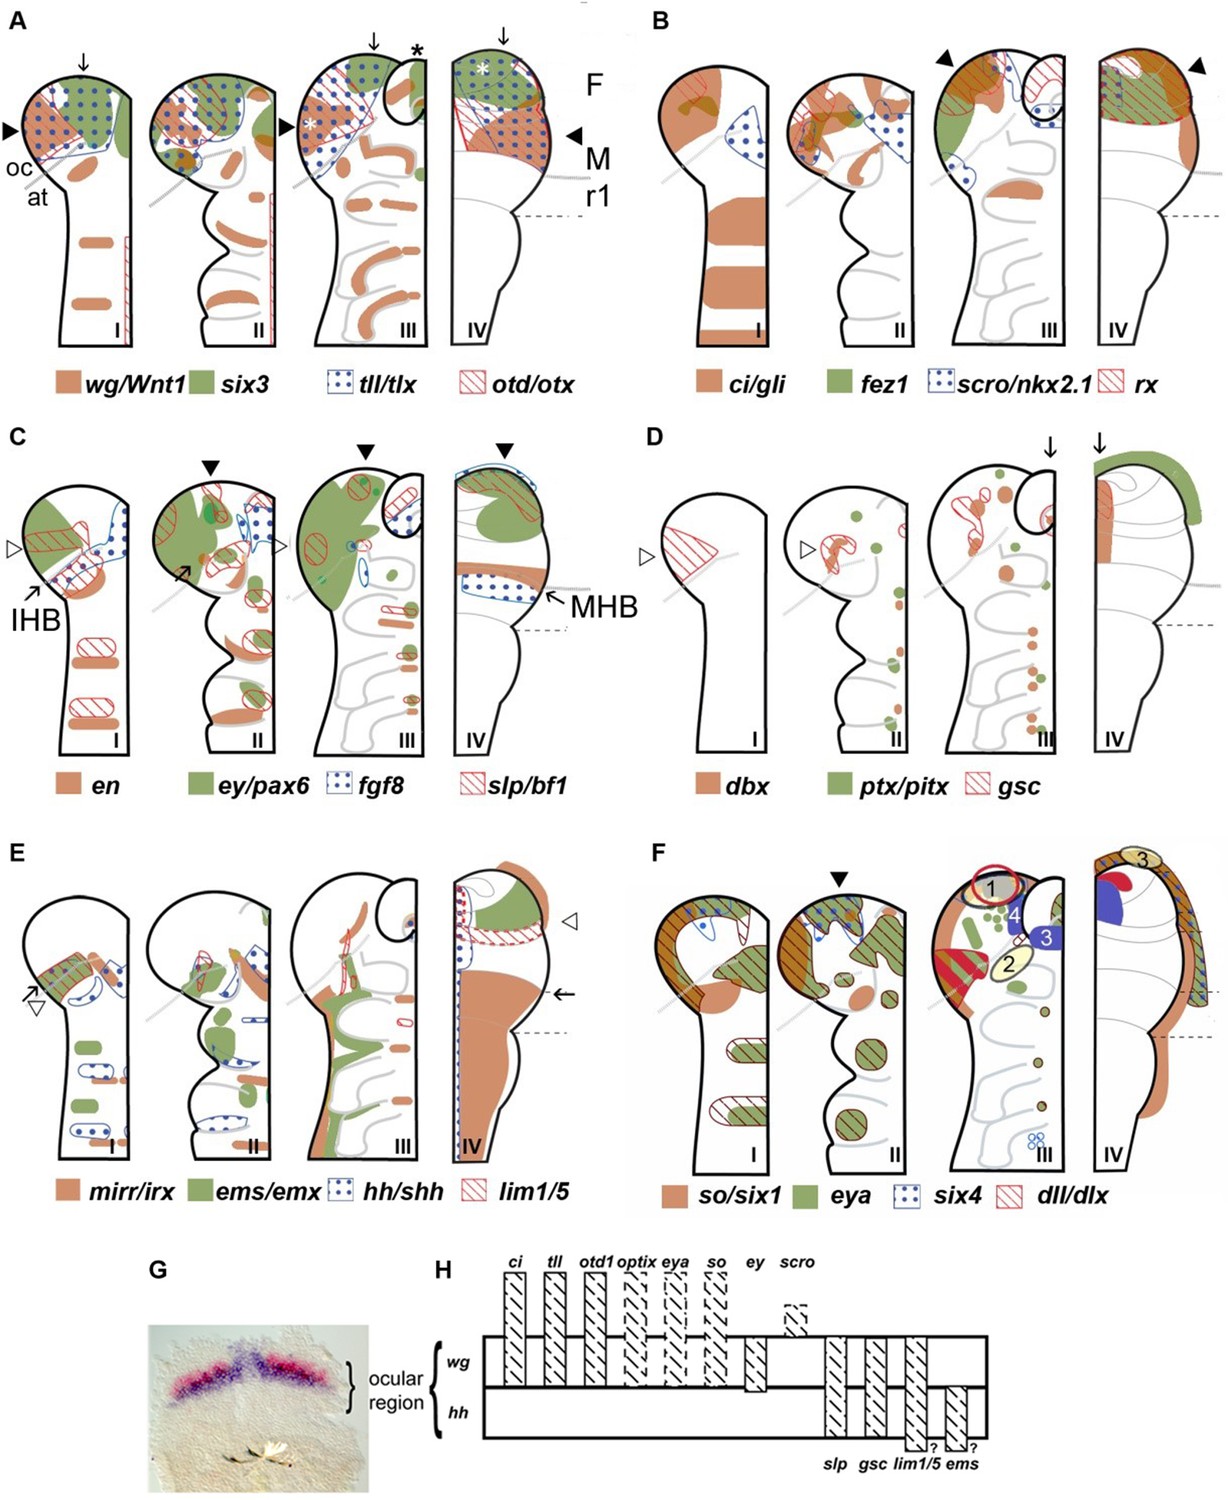
Neuroectodermal gene expression in a beetle and vertebrates.
(A–F) Expression patterns of orthologous genes are shown for T. castaneum (I–III) and vertebrates (IV). The beetle data are based on Posnien et al., 2011b while the vertebrate data were compiled from several species and publications and plotted onto the schematic of a mouse late neural plate (see details below). Hence, expression boundaries are less precise for vertebrates compared to the beetle data. The stages shown for T. castaneum correspond to elongating germband with five trunk stripes of Tc-wingless (I), elongated germband (II), and retracting germband (III) – stage II was used for comparison with vertebrates. The changes of expression patterns reflect pattern formation processes while cell division and/or migration play a minor role if any. (A–C) Twelve genes show a similar arrangement of expression patterns in the anterior neuroectoderm of vertebrates and insects. Some of them are expressed almost exclusively in the anterior brain neuroectoderm in both clades while others show additionally segmental expression in insects. It seems unlikely that such a degree of similarity would arise by convergent evolution especially when considering the genes with an almost exclusive anterior expression. Together with similar findings from other animal clades we take these data as strong confirmation for the homology of the anterior neuroectoderm. However, we do not claim that homology on the level of neuroectoderm patterning will necessarily translate into clear homologies of the specific neural structures that develop from those domains. Arrowheads and arrows point to homologous regions, respectively. White stars in A depict eye anlagen. (D, E) Some orthologs show clearly diverged patterns. Compare posterior boundary of ems expression (white arrowhead) with location of mid-hindbrain boundary (MHB) region (arrow). (D) Coexpression of dbx and gsc in the stomodeum and an anterior expression of ptx/pitx (anteriormost green dot in II and III) is found in vertebrates and beetles (arrows in III and IV). Other aspects of co-expression (open arrowhead in II) and additional expression domains (e.g. ocular domain in I) have not counterpart. (E) Coexpression and adjacent expression of mirr/irx and ems/emx are found posterior to the insect head boundary (IHB) in insects but anterior to the MHB in vertebrates (compare open arrowheads relative to the arrow which marks the IHB/MHB in I and IV). Hence, the position of these domains is fundamentally different. The canonical hedgehog expression along the midline of the CNS in vertebrates has no correlate in insects, but medial hedgehog expression is found in the stomodeum. (F) The expression of the panplacodal genes eya, so/six1 and six4 at the outer rim of the anterior neuroectoderm in insects and vertebrates adds further molecular similarity of bilaterian anterior patterning. Neuroendocrine tissues are marked in blue (two insect tissues are marked – PI anlagen: 4 and stomatogastric sytem: 3). The eye Anlagen in vertebrates (red) and compound eyes of insects (red hatched area) do not correspond. However, there is an anterior region which expresses many eye patterning genes and from which ocelli are likely to develop (red circle; see text and Figure 3 for more details). The Anlagen of the olfactory placode (yellow circle 3) is located at a different location than the olfactory lobes of the insect brain (yellow circle 2) but has similarity to a region, which we term insect head placode (blue circle 1). See text and Figure 3 for further details and discussion on homology of visual and olfactory systems. (G, H) The parasegment boundary separating the antennal segment from the ocular region (the insect head boundary, IHB) seems to be an important developmental boundary expressing the hedgehog and wingless morphogens (G) and marking the anterior or posterior expression boundaries of a number of patterning genes (H). See Supplementary file 1 for references and explanations with respect to the depiction of expression patterns. The gray dashed lines in the T. castaneum head indicate roughly the location of the IHB, that is the border between the ocular region (future protocerebrum) and the antennal segment (future deutocerebrum) (based on posterior border of hh expression – see text and Figure 2 for more details on the location of IHB). F: forebrain; M: midbrain; r1: rhombomere 1 of the hindbrain; open arrowhead in C I: ocular slp/bf1 domain; arrow in C II: anterior-median slp/bf1 domain; black arrowhead in C II and III: anterior-median ey/pax6 domain.
Figure 2
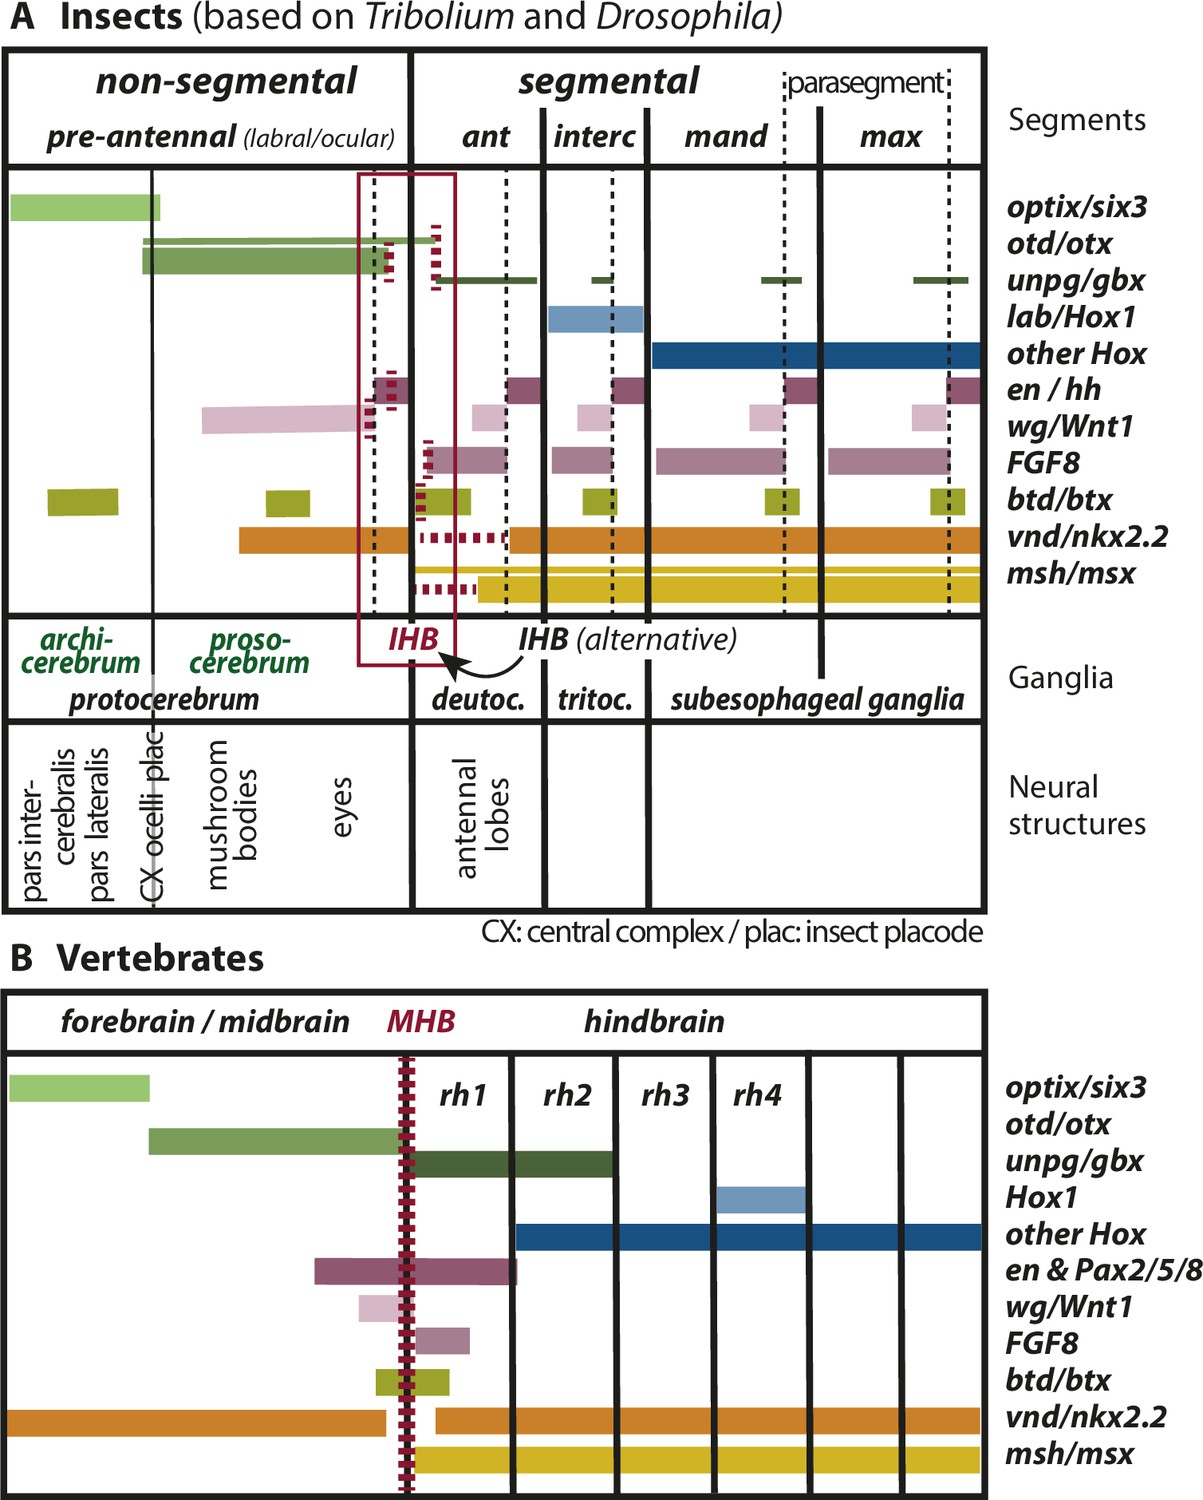
Mapping the insect head boundary (IHB) based on expression patterns of mid-hindbrain boundary (MHB) marker gene orthologs.
Comparison of gene expression patterns between insects (A) and vertebrates (B) along the anterior–posterior axis. The insect data are based on patterns found in both T. castaneum and D. melanogaster in the early neuroectoderm around the time of delamination of neuroblasts (i.e. the endpoint of neuroectoderm patterning), which is comparable to the late neural plate stage shown in B. (A) Expression in the insect neuroectoderm is based on T. castaneum and D. melanogaster data. Where the data diverge or are not available for T. castaneum, the D. melanogaster pattern is indicated by thin lines (adopted from Urbach, 2007). For each gene, we indicated at what position (vertical red broken lines) or in what region the IHB would be located (horizontal red broken lines) when using only that gene as marker. Considering all the evidence (i.e. the location of all red broken lines) the data place the IHB to an area covering the interface of ocular region and antennal segment (see red box). We find no support for the alternative hypothesis that puts the IHB to the deutocerebral/tritocerebral boundary (Hirth, 2010), that is one segment more posterior (see text for discussion). Ganglia are depicted as segmental structures (see Supplementary file 1 for arguments). The segment boundaries (bold black lines) are offset relative to the embryonic parasegmental units (broken black lines shown for the subesophageal ganglia). For simplicity of the schematic, the parasegment boundaries are not marked in the more anterior segments but they are defined by adjacent non-overlapping wg/hh expression, respectively. We propose that the classic concept of protocerebral subdivision into an anterior archicerebrum and posteriorly adjacent prosocerebrum can be re-defined by optix/six3 and otd/otx expression, respectively (green font). The more posterior trunk ganglia are similar to the subesophageal ganglia. Based on six3 and otd expression, we assign the neuroendocrine pars intercerebralis and pars lateralis (PI/PL) to the archicerebrum and the eyes to the prosocerebrum. The mushroom bodies (MB) are likely part of the prosocerebrum while we tentatively assign the central complex (Cx), the ocelli and the insect head placode (plac) to a mixed origin. The data are combined from single and double stainings of different sources (Beermann and Schröder, 2008; Posnien et al., 2011b; Schinko et al., 2008; Steinmetz et al., 2011; Urbach, 2007; Wheeler et al., 2005) such that not all data (e.g. of FGF8, vnd, and msh) are based on a precise mapping at the same stage. Hence, the locations of some expression boundaries are approximations. See Supplementary file 1 for more details on the reasons for the mapping. Expression of genes involved in MHB formation and function in vertebrates (redrawn from Urbach, 2007). Given the difference of the gene regulatory networks subdividing insect segments and vertebrate rhombomeres, respectively, we hesitate to claim homology of antennal segment with rhombomere 1 despite the fact that both are devoid of otd and Hox gene expression (see text for discussion on the tripartite brain). More generally, we do not homologize segments and rhombomers.
Figure 3
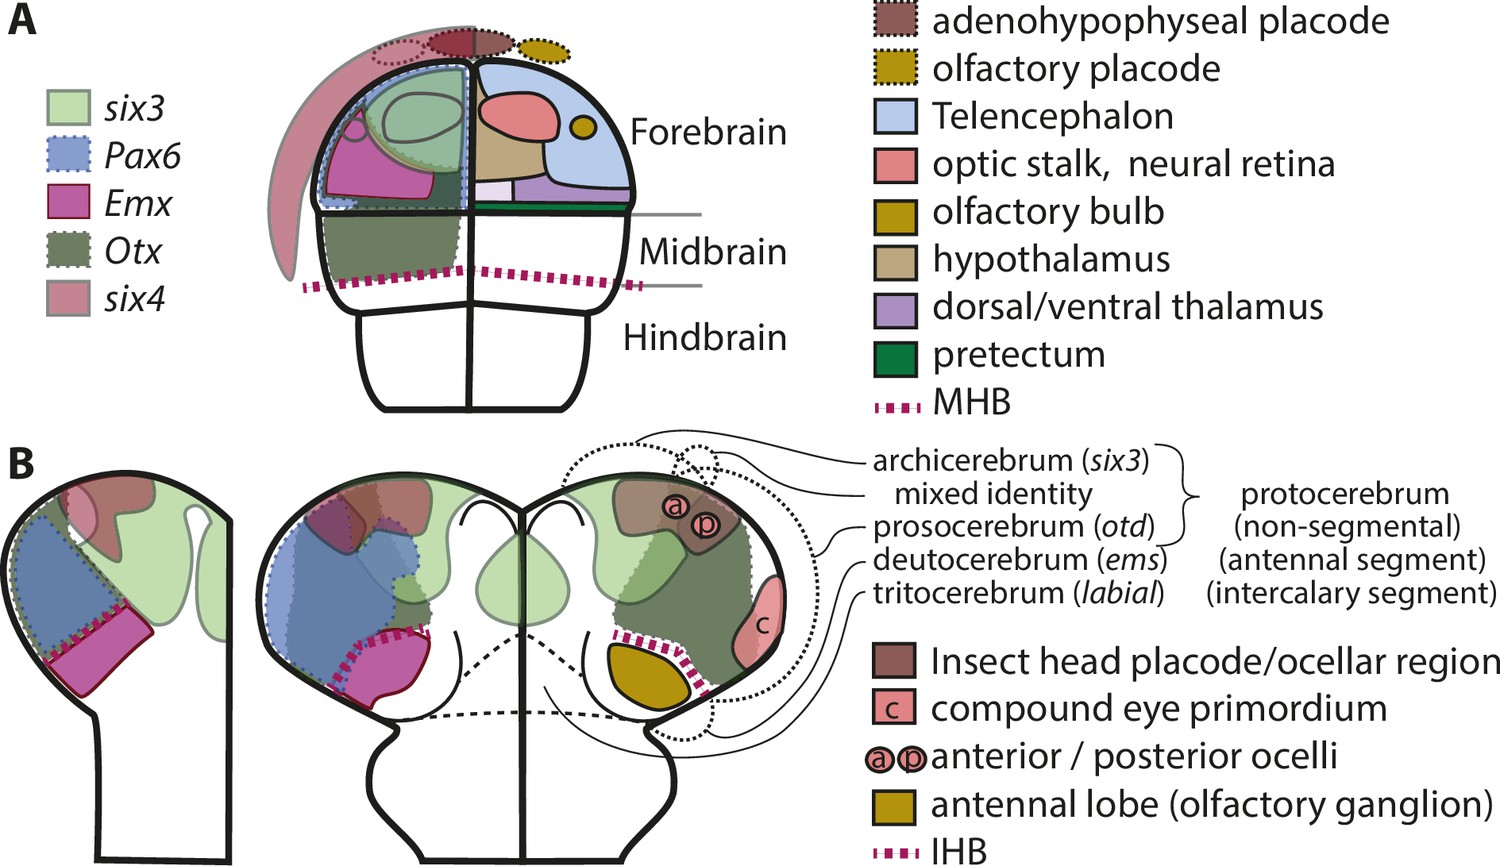
Molecular fate maps of insect and vertebrate neuroectoderm questions simple homology of eye and olfactory organs The expression domains of selected patterning genes are depicted in the left halves of a schematic mouse neural plate (A) and in beetles (B).
The beetle data represent two different stages of development corresponding to I and II of Figure 1B. A simplified fate map of the anterior neural plate is shown in the right half in A (for optic and olfactory parts, the positions are outlined in the left half as well). The right half shown in B depicts the expression of the markers of archi- and prosocerebrum six3 and otd (identical to left half) in addition to the approximate position of the anlagen of visual and olfactory neuropils. This molecular mapping shows that brain parts used for olfaction do not derive from the same region of the neuroectoderm in vertebrates and insects (compare yellowish shapes in A with B). Likewise, the larval insect eyes (which will develop into the adult compound eyes) do not derive from a region corresponding to the vertebrate eye anlagen (compare red shapes in A with red shape marked with c in B). Hence, for both olfaction and compound eye, the homology hypothesis is strongly questioned based on the criterion of position. Intriguingly, the ocelli emerge at positions much more similar to the vertebrate situation. This opens the possibility of homology of vertebrate eyes with ocelli (especially the six3 positive anterior ones) but a claim of homology would need further testing. The similarity of gene regulatory networks that have been found between vertebrates and insects may be based on either co-option of networks or on conserved cell types that were assembled independently to form organs with similar function. The patterns are approximations and the exact location of expression domain boundaries or tissue anlagen remain to be determined by dedicated experiments (see details below and in the text).
Figure 4
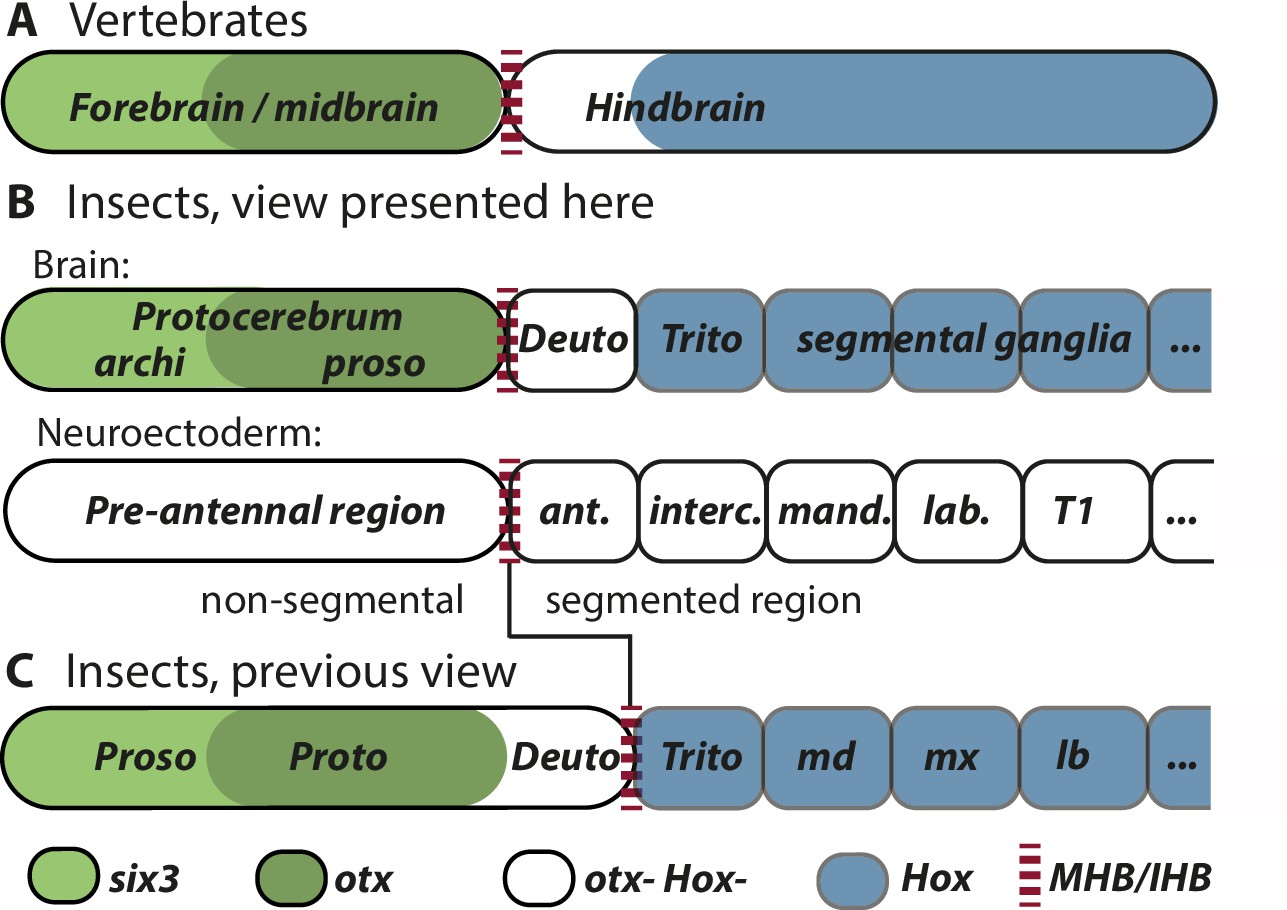
Alternative views on the subdivisions of the brain anlagen.
Mapping of brain regions by using expression patterns at the neuroectodermal stage from vertebrates (neural plate) (A) and insects (elongated germband stage) (B, C). For insects, alternative interpretations are shown (B versus C). In both clades, the anterior expression of six3/optix is followed by a domain with otx/otd expression while the posterior is marked by the expression of Hox-cluster genes. A region expressing neither otx/otd nor Hox genes is separating these domains. (A) In vertebrates, the mid-hindbrain boundary (MHB) emerges at the interface between otx positive and Hox gene negative cells. Note that the six3 expression limit does not reflect the boundary between fore- and midbrain anlagen. (B) View presented in this paper partially based on Urbach, 2007. Both, the subdivisions of the brain (top row) and the subdivisions of the neuroectoderm (lower row) are shown. In line with classic literature comparing insect and annelid brains, the protocerebrum is suggested to be subdivided into an anterior archicerebrum and a posteriorly adjacent prosocerebrum. We suggest six3/optix and otd to be markers for these regions, respectively. The antennal segment is considered serially homologous to trunk segments. Being the anterior-most segment and being the only segment free of Hox gene expression, it might have distinctive properties. The parasegment boundary separating the non-segmental pre-antennal (or ocular) region from the antennal segment represents the insect head boundary (IHB). Its location matches the one of the MHB of vertebrates (red broken lines). We hesitate to make strong statements of homology between vertebrates and insects for the region posterior to the IHB/MHB anlagen. The data supporting this view are combined from flies and beetles. (C) Alternative view based on Hirth et al., 2003, which was recently updated by Bridi et al., 2020 and Strausfeld et al., 2022. In this view, the antennal region is not a segment – the intercalary segment is the anterior-most serially homologous trunk segment. The region corresponding to the MHB is located at the boundary between antennal region and the intercalary segment. See text for arguments supporting the view shown in B and Supplementary file 1 for discussion on possible reasons for diverging interpretation.
Additional files
-
Supplementary file 1
Discussion of additional aspects and explanations for the data shown in the schematics.
- https://cdn.elifesciences.org/articles/92242/elife-92242-supp1-v1.pdf
Download links
A two-part list of links to download the article, or parts of the article, in various formats.
Downloads (link to download the article as PDF)
Open citations (links to open the citations from this article in various online reference manager services)
Cite this article (links to download the citations from this article in formats compatible with various reference manager tools)
Gene expression mapping of the neuroectoderm across phyla – conservation and divergence of early brain anlagen between insects and vertebrates
eLife 12:e92242.
https://doi.org/10.7554/eLife.92242


