Activity-dependent mitochondrial ROS signaling regulates recruitment of glutamate receptors to synapses
- Department of Biomedical Science, Colorado State University, United States
- Department of Health and Exercise Sciences, Colorado State University, United States
- Cellular and Molecular Biology Graduate Program, Colorado State University, United States
Figures
Figure 1 with 1 supplement
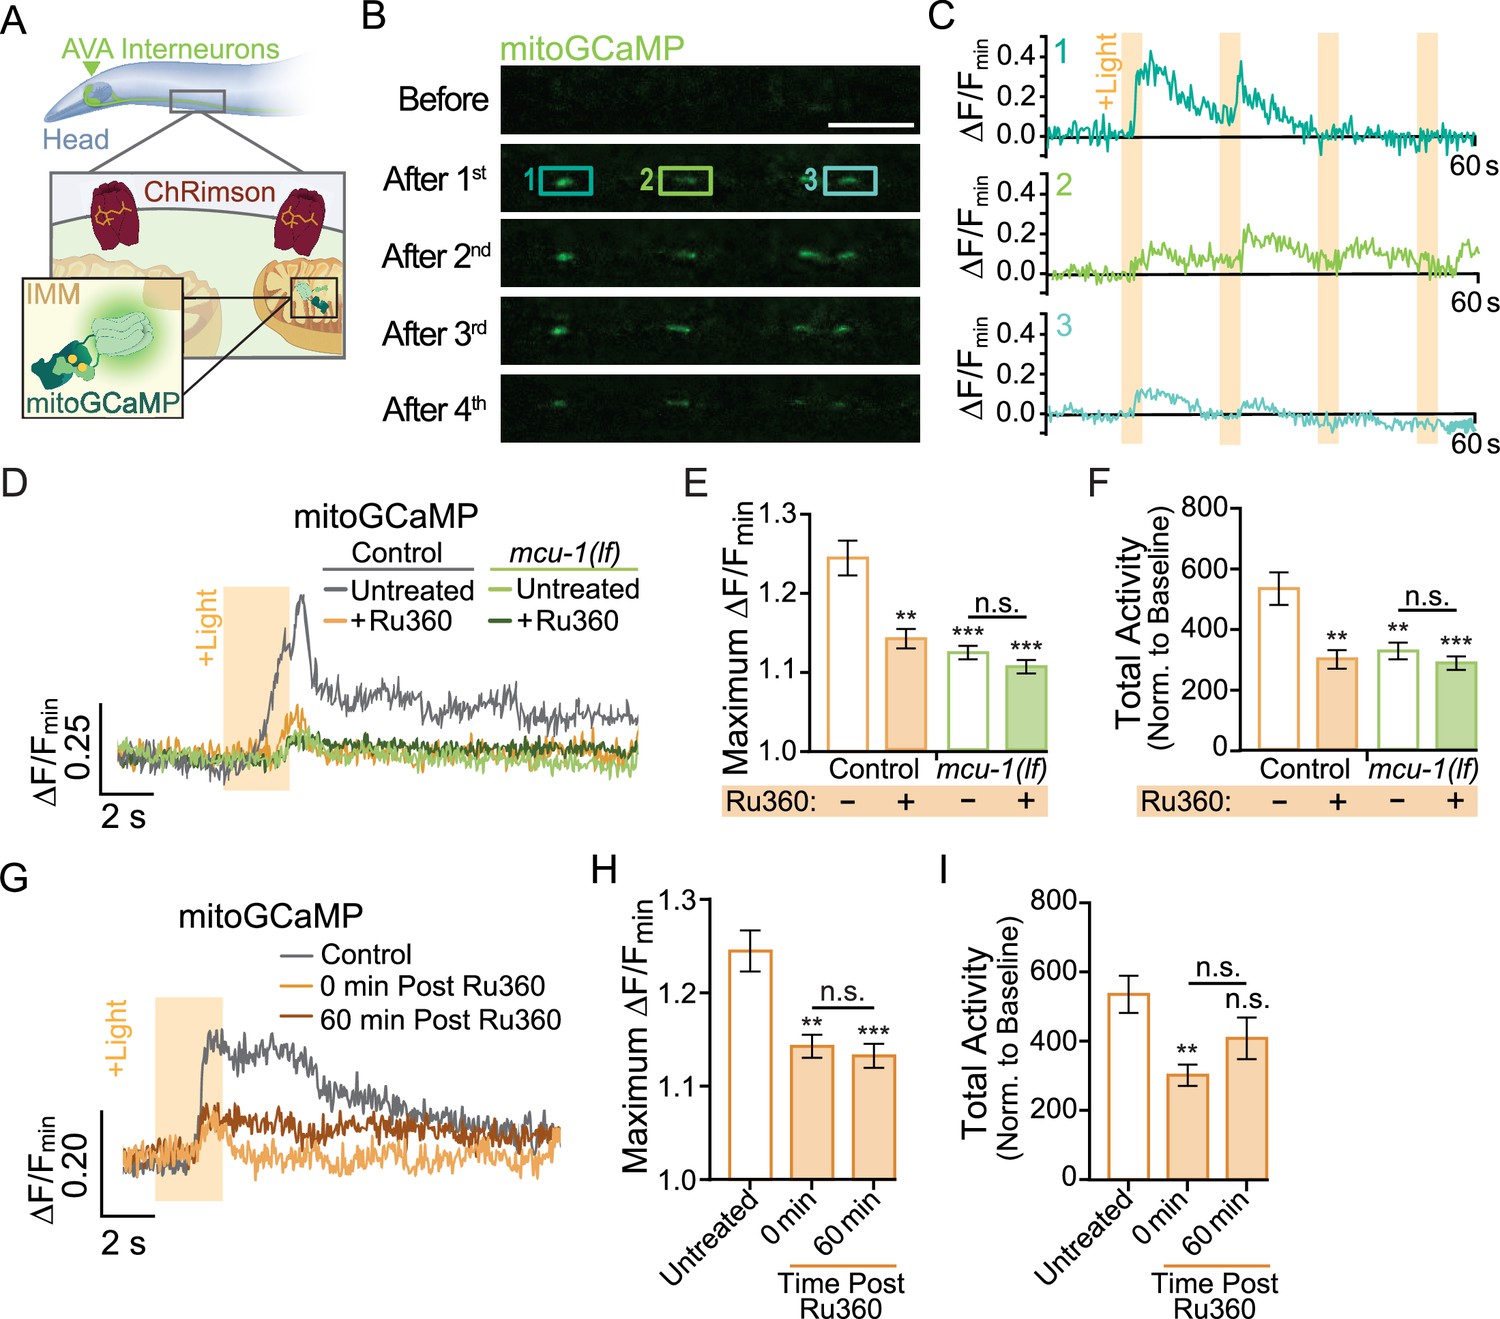
Neuronal activity causes mitochondrial Ca2+ uptake via MCU-1.
(A) Illustration depicting transgenic expression and subcellular location of ChRimson and mitoGCaMP in the AVA neurons. (B) Representative images of mitoGCaMP fluorescence in a single Z-plane before and after four optical activations (strain: FJH 644). Scale bar = 5 µm. (C) Normalized mitoGCaMP fluorescence for the regions of interest in (B) during repetitive optical activation (+Light, 5 µW at 33.3 mHz). (D) Representative normalized mitoGCaMP traces (30 s) following optical stimulation (+Light) of the AVA neurons in worms pretreated with Ru360 and in untreated controls (strain: FJH 644) or mcu-1(lf) (strain: FJH 647). (E) Quantification of the maximum ∆F/Fmin of mitoGCaMP events and (F) total mitoGCaMP activity during a 2.5 min recording of AVA neurons optically activated every 30 s (n ≥ 20 mitochondria from 5 to 8 animals per group). (G) Normalized mitoGCaMP fluorescence following optical stimulation (+Light) of the AVA neuron in untreated controls as well as Ru360-treated worms at 0 or 60 min post treatment. (H) Quantification of the average maximum ∆F/Fmin of mitoGCaMP and (I) normalized total mitoGCaMP activity during a 2.5 min recording of AVA neurons optically activated every 30 s (n ≥ 20 mitochondria from 4 to 5 animals per group). Data is represented as mean ± s.e.m.; n.s., not significant, **p<0.005, ***p<0.0005 compared to controls using a one-way ANOVA with a Dunnett’s test. Source data is available at https://doi.org/10.5061/dryad.0gb5mkm71.
Figure 1—video 1
MitoGCaMP fluorescence in the AVA neurites.
AVA neurons expressing ChRimson and mitoGCAMP were optically activated every 15 s (see ‘Localized ChRimson activation’). The video shows changes in mitoGCaMP fluorescence following optical activation at frame 30, 67, 105, and 142.5 (+Optical Activ. label in the video), as well as the region (white box) from where single-frame representative images in Figure 1B originated. The video was acquired at five frames per second but is rendered at 2× speed, scale bar = 5 μm. The raw, unannotated video (Video1_RAW.avi) can be found in theVideo 1—source data 1 folder located at https://doi.org/10.5061/dryad.0gb5mkm71.
Figure 2 with 2 supplements
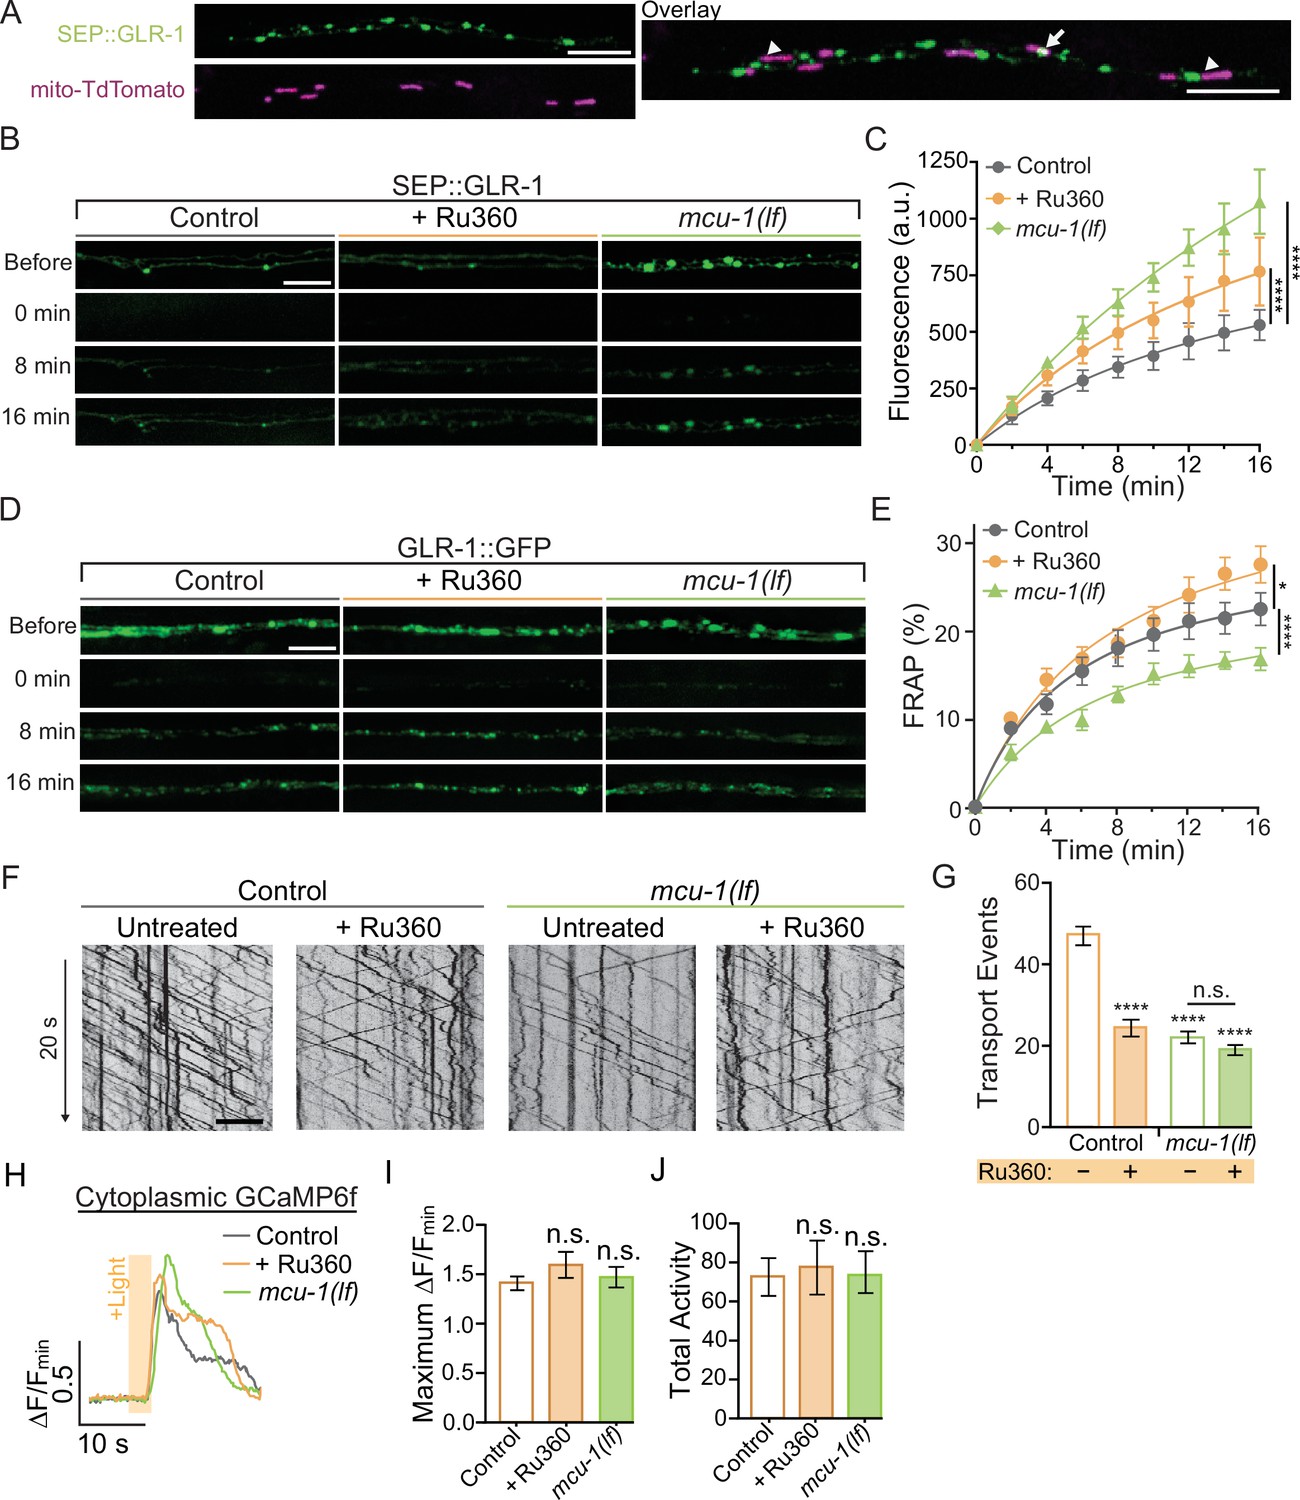
Decreased mitochondrial Ca2+ uptake affects transport and recruitment of GLR-1 to synapses.
(A) Single Z-plane fluorescent images of mitochondria (mito-TdTomato) and surface-localized GLR-1 (SEP::GLR-1) showing mitochondria localized at (arrows) or adjacent to (arrowheads) SEP::GLR-1 puncta. (B, D) Representative images of (B) SEP::GLR-1 (strains: FJH 214 and FJH 638) or (D) GLR-1::GFP (strains: FJH 18 and FJH 576) fluorescence before, immediately after, 8, and 16 min post photobleach (PB). (C) Fluorescence (arbitrary units = a.u.) of SEP over 16 min post PB (n = 8 animals per group). (E) Percent GFP fluorescence recovery after PB (FRAP) over 16 min (n ≥ 9 animals per group). *p<0.01, ****p<0.0001 using an extra sum-of-squares F-test with a Bonferroni correction. (F) 20 s representative kymographs of GLR-1::GFP movement in AVA neurite in controls (strain: FJH 18) and mcu-1(lf) (strain: FJH 576) with or without Ru360 pretreatment. Time is represented on the y-axis and distance on the x-axis. (G) Total transport events quantified from kymographs in all conditions (n > 10 animals per group). (H) Representative traces of ∆F/Fmin of cytoplasmic GCaMP6f following optical stimulation. (I) The maximum ∆F/Fmin of cytoplasmic GCaMP6f events and (J) normalized total GCaMP6f activity during a 1.5 min recording with optical activation of AVA neurons every 30 s (n ≥ 10 animals per group). All scale bars = 5 µm. Data is represented as mean ± s.e.m.; n.s, not significant, ****p<0.0001 compared to controls or indicated experimental group using a one-way ANOVA with a Dunnett’s test. Source data is available at https://doi.org/10.5061/dryad.0gb5mkm71.
Figure 2—figure supplement 1
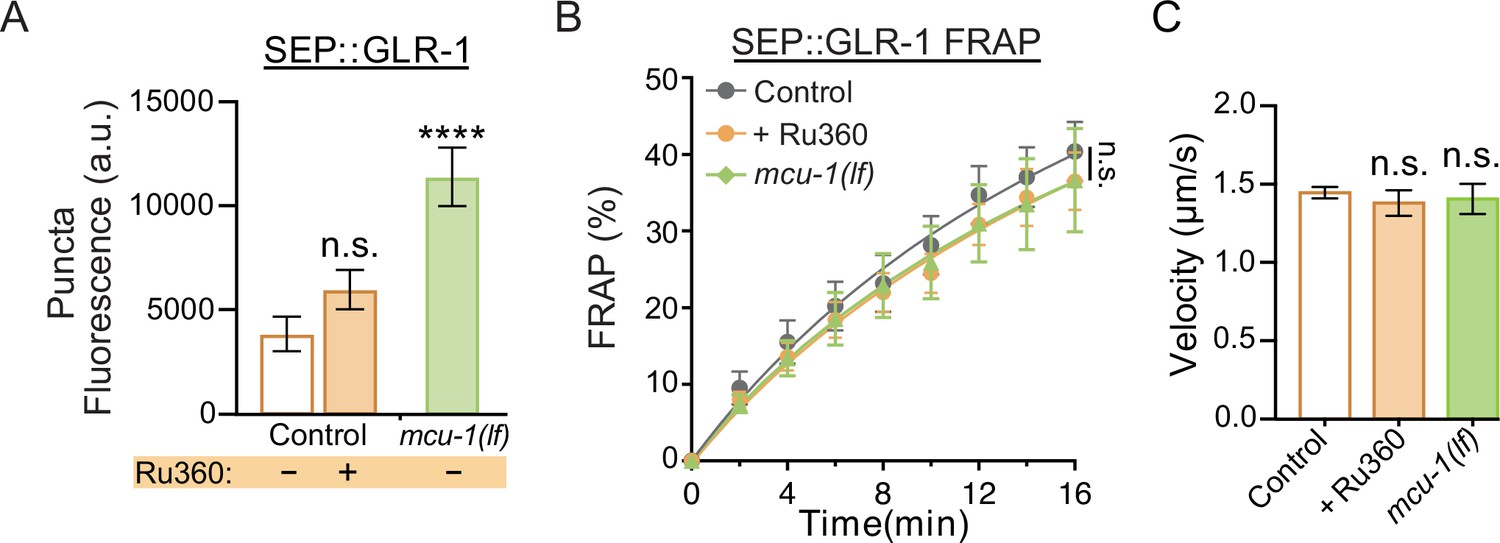
Additional analysis of SEP::GLR-1 fluorescence and fluorescence recovery after photobleaching (FRAP), and velocity analysis of GLR-1 transport.
(A) SEP puncta fluorescence (a.u. = arbitrary units) in control, Ru360-treated, and mcu-1(lf) animals prior to FRAP (n ≥ 8 animals per group). (B) Percent of SEP recovery after photobleaching (FRAP) over 16 min post photobleaching in each experimental group (n ≥ 8 animals per group) from the same dataset as Figure 2C. n.s., not significant as determined by comparing the fitted curves using an extra sum-of-squares F-test with Bonferroni correction. (C) Average transport velocity of GLR-1 transport quantified from the same kymographs as in Figure 2F and G (n >10 animals per group). Data is represented as mean ± s.e.m.; n.s., not significant compared to control, ****p<0.0001 compared to controls or indicated experimental group using a one-way ANOVA with a Dunnett’s test.
Figure 2—video 1
GLR-1::GFP transport in AVA neurons.
This video shows GFP-tagged GLR-1 in the AVA neurites before photobleaching, then following photobleaching (white box shows photobleaching region; see ‘Transport imaging and analysis’) rendered to reveal GLR-1 transport, with the soma of the AVA neurons on the left and scale bar = 5 μm. The video was taken at 10 frames per second but is rendered at 60 frames per second. The raw image stream used to make this video (Video2_RAW.tif) and an annotated version showing the ROI used for cropping and rendering (white box, Video2_ROI.tif) can be found in the zipped folder Video 2—source data 1 located at https://doi.org/10.5061/dryad.0gb5mkm71.
Figure 3 with 1 supplement

Mitochondrial reactive oxygen species (mitoROS) production is upregulated by neuronal activity and dependent on mitochondrial Ca2+ uptake via MCU-1.
(A) Illustration showing transgenic expression and subcellular localization of ChRimson and mito-roGFP in the AVA neurons. (B) Representative images of mito-roGFP fluorescence in a single Z-plane when excited with 488 nm or 405 nm light following optogenetic stimulation with or without all-trans-Retinal (strain: FJH 402). (C) Mito-roGFP fluorescence ratio (405/488 nm) following 0, 5, 20, or 60 min of repetitive optical stimulation (40 μW/mm2 at 33.3 mHz) with Retinal pretreatment and 60 min of repetitive optical stimulation without Retinal pretreatment (n > 30 mitochondria from eight animals per group). (D, F) Representative images of mito-roGFP fluorescence in a single Z-plane when excited by 488 nm or 405 nm light following 0 or 60 min of repetitive optical stimulation with Retinal pretreatment. (E) Mito-roGFP Fratio following 0 or 60 min of repetitive optical stimulation in mcu-1(lf) (strain: FJH 706) and controls (strain: FJH 402), as well as non-Retinal-treated controls that underwent 60 min of stimulation (n ≥ 32 mitochondria from eight animals per group). Statistical comparisons are between groups and the 0 min control unless indicated by horizontal bar. (G) Mito-roGFP Fratio at 0 and 60 min following repeated optical stimulation with or without Ru360 treatment (n ≥ 38 mitochondria from eight animals per group; strain FJH 402). All scale bars = 5 µm. Data is represented as mean ± s.e.m.; n.s., not significant, ****p<0.0001 compared to controls or indicated experimental group using a one-way ANOVA with a Dunnett’s test. Source data is available at https://doi.org/10.5061/dryad.0gb5mkm71.
Figure 3—figure supplement 1
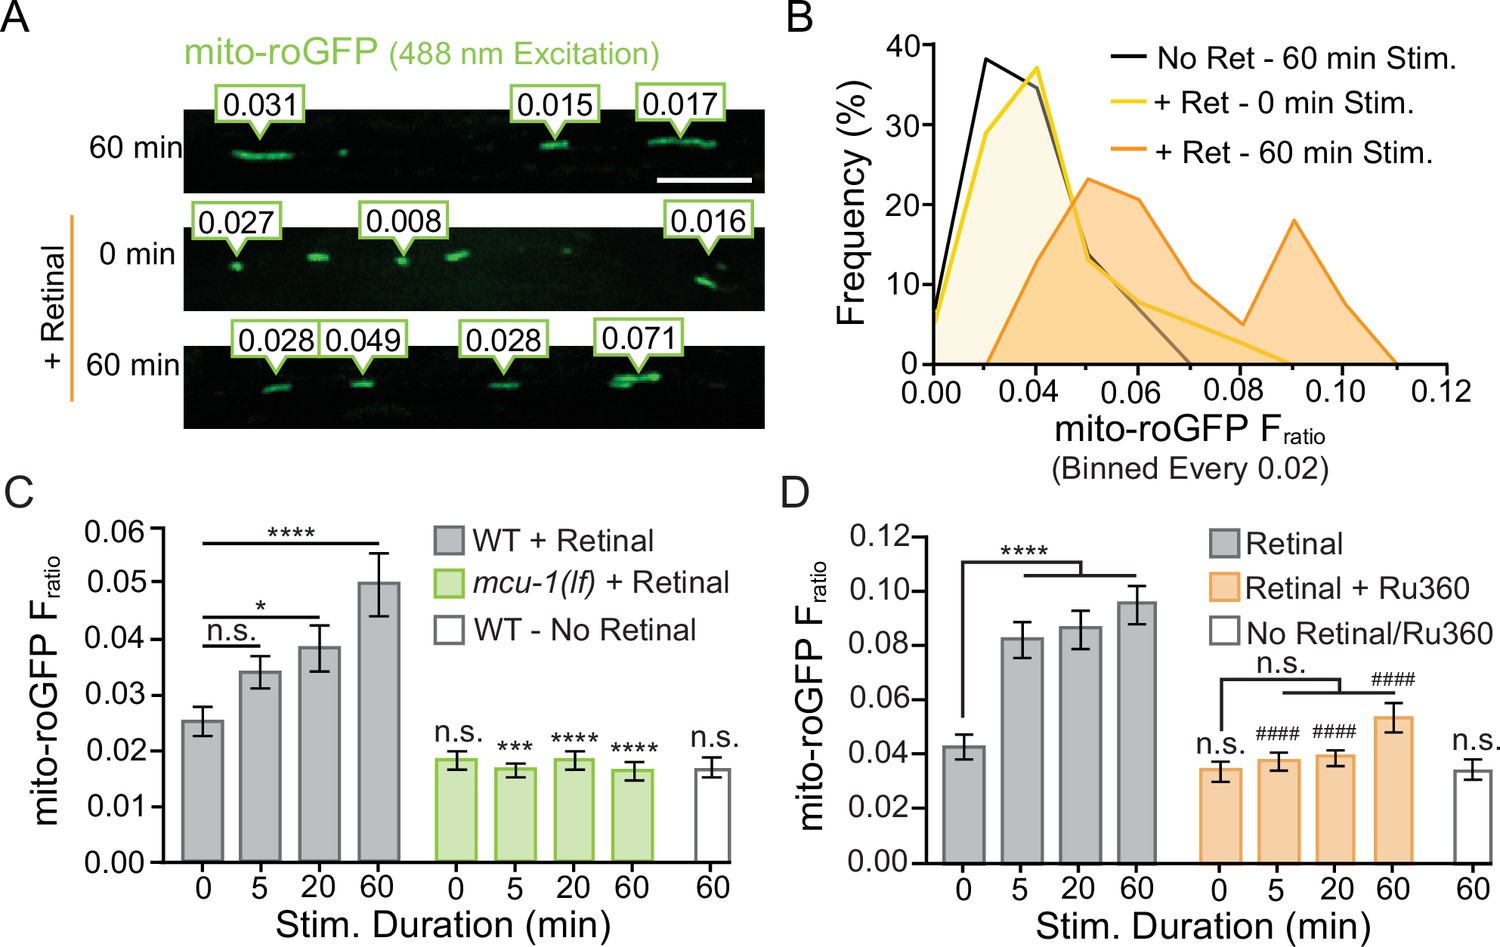
Additional analysis of mito-roGFP reveals differential activity-induced reactive oxygen species (ROS) production at dendritic mitochondria.
(A) Representative image of the diversity observed in mito-roGFP Fratios (emission due to 405 nm excitation/emission due to 488 nm excitation) in a portion of the AVA following repetitive optical activation. (B) The frequency of observed mito-roGFP Fratios expressed as a percent of the total observed Fratios (binned every 0.02) from the same dataset as Figure 3C. (C) The complete dataset from Figure 3E showing mito-roGFP Fratio (Ex405/Ex488) observed following 0, 5, 20, or 60 min of repetitive optical stimulation in controls and mcu-1(lf) (n > 34 mitochondria from eight animals per group). (D) The complete dataset from Figure 3G mito-roGFP Fratios observed at 0, 5, 20, or 60 min of repetitive light stimulation in Ru360-treated animals compared to controls (n > 38 mitochondria from eight animals per group). Data is represented as mean ± s.e.m.; n.s., not significant, **p<0.005, ***P<0.0005, ****p<0.0001 compared to non-activated controls or indicated experimental group using a one-way ANOVA with a Dunnett’s test.
Figure 4

Photoactivation (PA) of mitochondria localized KillerRed results in physiological elevations in mitochondrial reactive oxygen species (mitoROS).
(A) Representative images of mito-roGFP fluorescence in a single Z-plane when excited with 488 nm or 405 nm light following 0, 5, or 10 min of repetitive mechano-stimulation (strain: FJH 402). (B) Quantification of the average mito-roGFP Fratio following 0, 5, or 10 min of repetitive mechano-stimulation (n > 50 mitochondria from eight animals per condition). (C) Illustration depicting subcellular localization of mitoKR and mito-roGFP within the AVA neurites. (D) Representative fluorescent images demonstrating the co-localization of mitoKR and mito-roGFP within the AVA neurite (strain: FJH 416). (E) Representative fluorescent images of mito-roGFP when excited by 405 nm or 488 nm light following 0, 15, or 30 s of PA directed at 1–3 mitochondria (green box). Localization of PA was considered to be spatially specific enough that neighboring mitochondria (gray box) were not exposed to the PA stimulus. (F) The mito-roGFP Fratio in mitochondria that were (green bars; n = 8 mitochondria from eight worms per group) or were not (white bars; n > 15 mitochondria from eight worms) targeted for PA as well as in worms without any additional optical activation (gray bars). n > 20 mitochondria from eight worms per group; *p<0.05, **p<0.005 using a paired t-test. No significant difference between the no light controls and the neighboring mitochondria (one-way ANOVA with Dunnett’s test). (G) Representative fluorescent images of mito-roGFP excited by 488 nm or 405 nm light with 0, 5, or 10 min of consistent light (567 nm; 0.025 mW/mm2) for global PA of mitoKR. (H) Quantification of mito-roGFP fluorescence ratio (Fratio, Ex405/Ex488nm) for each group (n > 32 mitochondria from eight animals per group). All scale bars = 5 µm. Data is represented as mean ± s.e.m.; *p<0.05, n.s., not significant using a one-way ANOVA with a Dunnett’s test. Source data is available at https://doi.org/10.5061/dryad.0gb5mkm71.
Figure 5 with 1 supplement
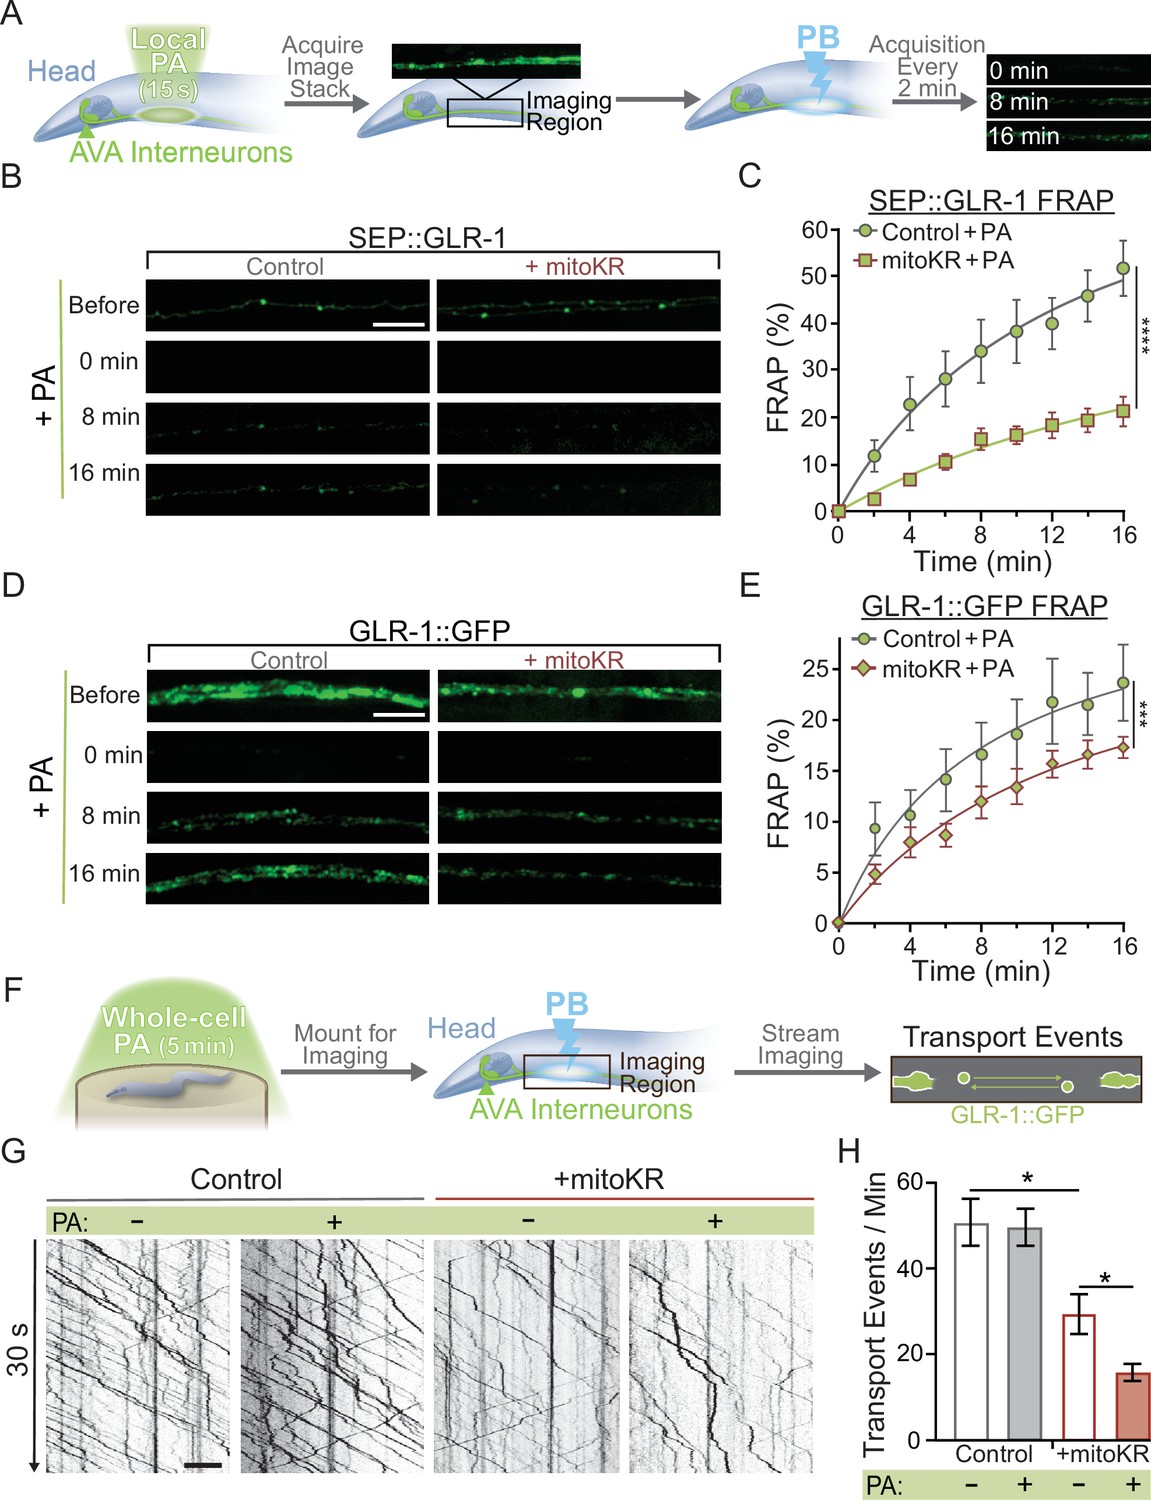
Mitochondrial reactive oxygen species (mitoROS) downregulates the recruitment of GLR-1 to synapses.
(A) Diagram of experimental procedure followed for (B–D) (see ‘Materials and methods’). (B, D) Representative images of (B) SEP::GLR-1 (strains: FJH 635 and FJH 582) or (D) GLR-1::GFP (strains: FJH 18 and FJH 555) fluorescence before, immediately after, 8, and 16 min after local photoactivation (PA) and photobleach (PB). (C, E) Percent SEP (C) or GFP (E) fluorescence recovery after PB (FRAP) over 16 min after local PA and PB (n ≥ 7 animals per group). ***p<0.0005, ****p<0.0001 using an extra sum-of-squares F-test with a Bonferroni correction. (F) Diagram of experimental procedure followed for (G, H) (see ‘Materials and methods’). (G) 30 s representative kymographs of GLR-1::GFP movement in the AVA with or without global PA. (H) Total number of transport events per minute quantified from 50-s-long kymographs (n = 8 animals per +mitoKR group, and n = 4 per control group). All scale bars = 5 µm. Data is represented as mean ± s.e.m.; *p<0.05 compared to controls or indicated experimental group using a one-way ANOVA. Source data is available at https://doi.org/10.5061/dryad.0gb5mkm71.
Figure 5—figure supplement 1

Post hoc velocity analyses of GLR-1 transport with mitoKR activation and non-photoactivation (non-PA) fluorescence recovery after photobleaching (FRAP) controls.
(A, B) Average transport velocity of GLR-1 transport (A) within (+Local PA) or outside (-Local PA) of mitoKR PA region (n = 8 animals for +mitoKR group, and n = 4 for controls) or (B) from the same kymographs as in Figure 5G and H (n = 8 animals per +mitoKR group, and n = 4 per control group). Each comparison is nonsignificant using a one-way ANOVA with a Dunnett’s correction for multiple comparisons. All data is represented as mean ± s.e.m. (C, D) Percent SEP (C) or GFP (D) FRAP over 16 min post-photobleaching and without PA in controls or worms expressing mitoKR in the AVA neurons (n ≥ 7 animals per group) from the same dataset as Figure 5C and D, respectively. ****p<0.0001, n.s., not significant as determined by comparing the fitted curves using an extra sum-of-squares F-test with a Bonferroni’s correction for multiple comparisons.
Figure 6 with 1 supplement
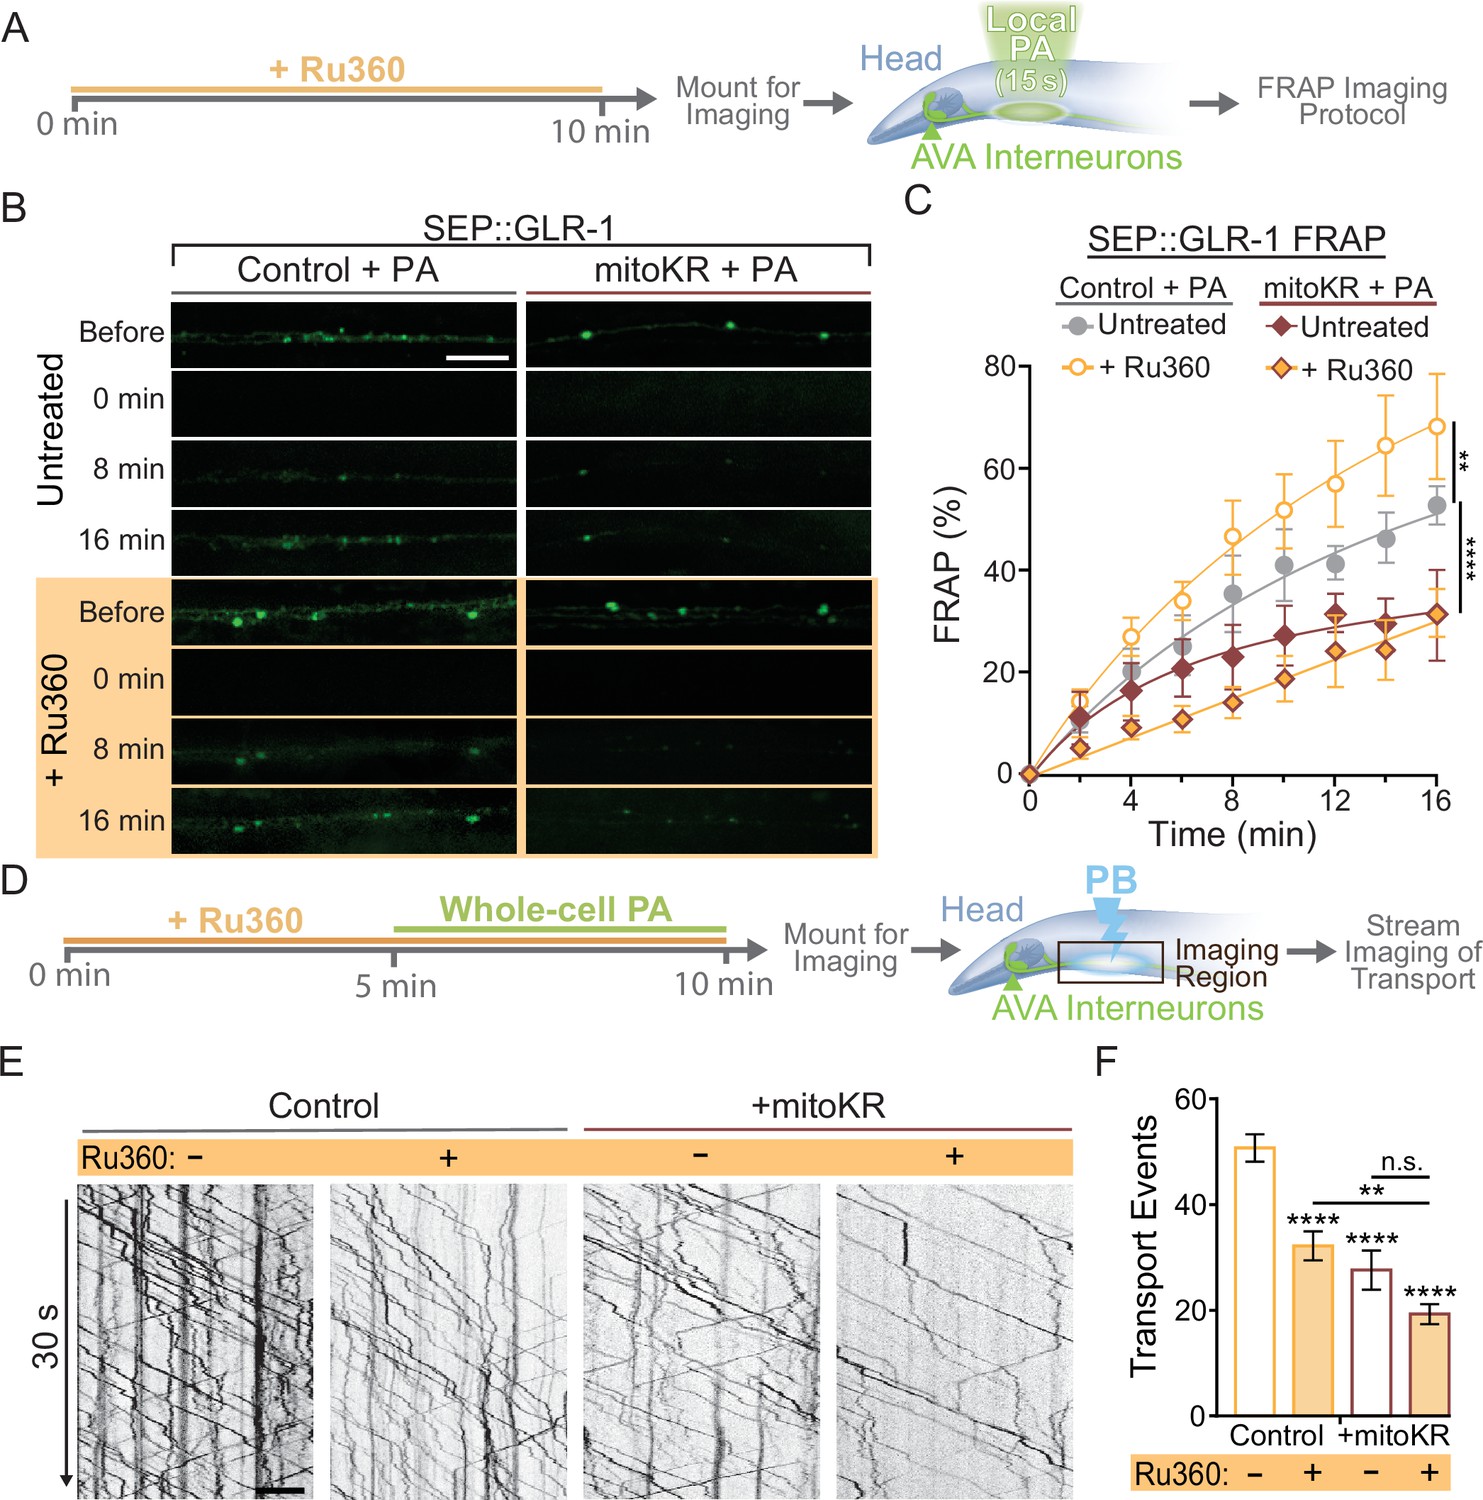
Regulation of synaptic recruitment of GLR-1 by mitochondrial reactive oxygen species (mitoROS) requires Ca2+ uptake via MCU-1.
(A) Diagram of experimental procedure in (B, C) (see ‘Materials and methods’). (B) Representative images of SEP fluorescence prior to, immediately after, and at 8 and 16 min post photobleach (PB). (C) Percent SEP fluorescence recovery after photobleaching (FRAP) throughout 16 min post PB in controls (strain: FJH 635) or mitoKR-expressing animals (strain: FJH 582) ± Ru360 treatment with photoactivation (PA) (n = 6 animals per group). **p<0.005, ****p<0.0001 using an extra sum-of-squares F-test with a Bonferroni correction. (D) Diagram of experimental procedure for (E, F) (see ‘Materials and methods’). (E) 30-s-long representative kymographs of GLR-1 transport in controls (strain: FJH 18) or mitoKR-expressing animals (strain: FJH 555) ± Ru360 treatment with PA. (F) Total number of transport events quantified from 50-s-long kymographs (n ≥ 10 animals per group). All scale bars = 5 µm. Data is represented as mean ± s.e.m.; n.s., not significant, **p<0.005, ****p<0.0001 compared to controls or indicated experimental group using a one-way ANOVA. Source data is available at https://doi.org/10.5061/dryad.0gb5mkm71.
Figure 6—figure supplement 1

Additional non-photoactivation (non-PA) SEP fluorescence recovery after photobleaching (FRAP) and transport controls.
(A) Percent of SEP FRAP in the same experimental groups as in Figure 6C (n ≥ 5 animals per group). (B) Number of GLR-1 transport events quantified from 50-s-long kymographs (from Figure 6E and F) in controls (n = 10 animals per group) with local PA as well as mitoKR-expressing worms with or without Ru360 treatment but without PA (n = 5 animals per group). Data is represented as mean ± s.e.m.; n.s., not significant, ***p<0.0005 compared to controls using a one-way ANOVA with a Dunnett’s test.
Figure 7

Proposed model.
In neurons, increased cytoplasmic Ca2+ due to activity-dependent opening of AMPARs, NMDARs, and voltage-gated calcium channels (VGCCs) results in mitochondrial Ca2+ uptake via voltage-dependent anion channels (VDACs) at the outer mitochondrial membrane and further entry into the mitochondrial matrix via MCU. Once in the matrix, Ca2+ can directly and indirectly upregulate mitochondrial respiration from which reactive oxygen species (ROS) is a by-product. The increased ROS can escape into the cytoplasm in the form of H2O2 and contribute to ROS signaling. This research points toward differential roles for and interactions between MCU and mitochondrial ROS (mitoROS) in regulating the subcellular trafficking of GLR-1. The results presented here indicate that (A) in the neuronal soma, where GLR-1 is synthesized and then exported, MCU-1 function indirectly promotes (dashed orange arrow) GLR-1 export, whereas mitoROS indirectly inhibits (dashed red inhibition arrow) it by acting on undetermined proteins. Alternatively, our data suggest that at postsynaptic sites, (B) ROS signaling resulting from Ca2+ uptake via MCU may target and modulate the function of undetermined proteins (dashed red line) that regulate the recruitment of AMPARs from transport vesicles or intracellular reserves (i.e., synaptic endosomes, left organelle) to the synaptic membrane and/or their synaptic retention.
Appendix 2—figure 1
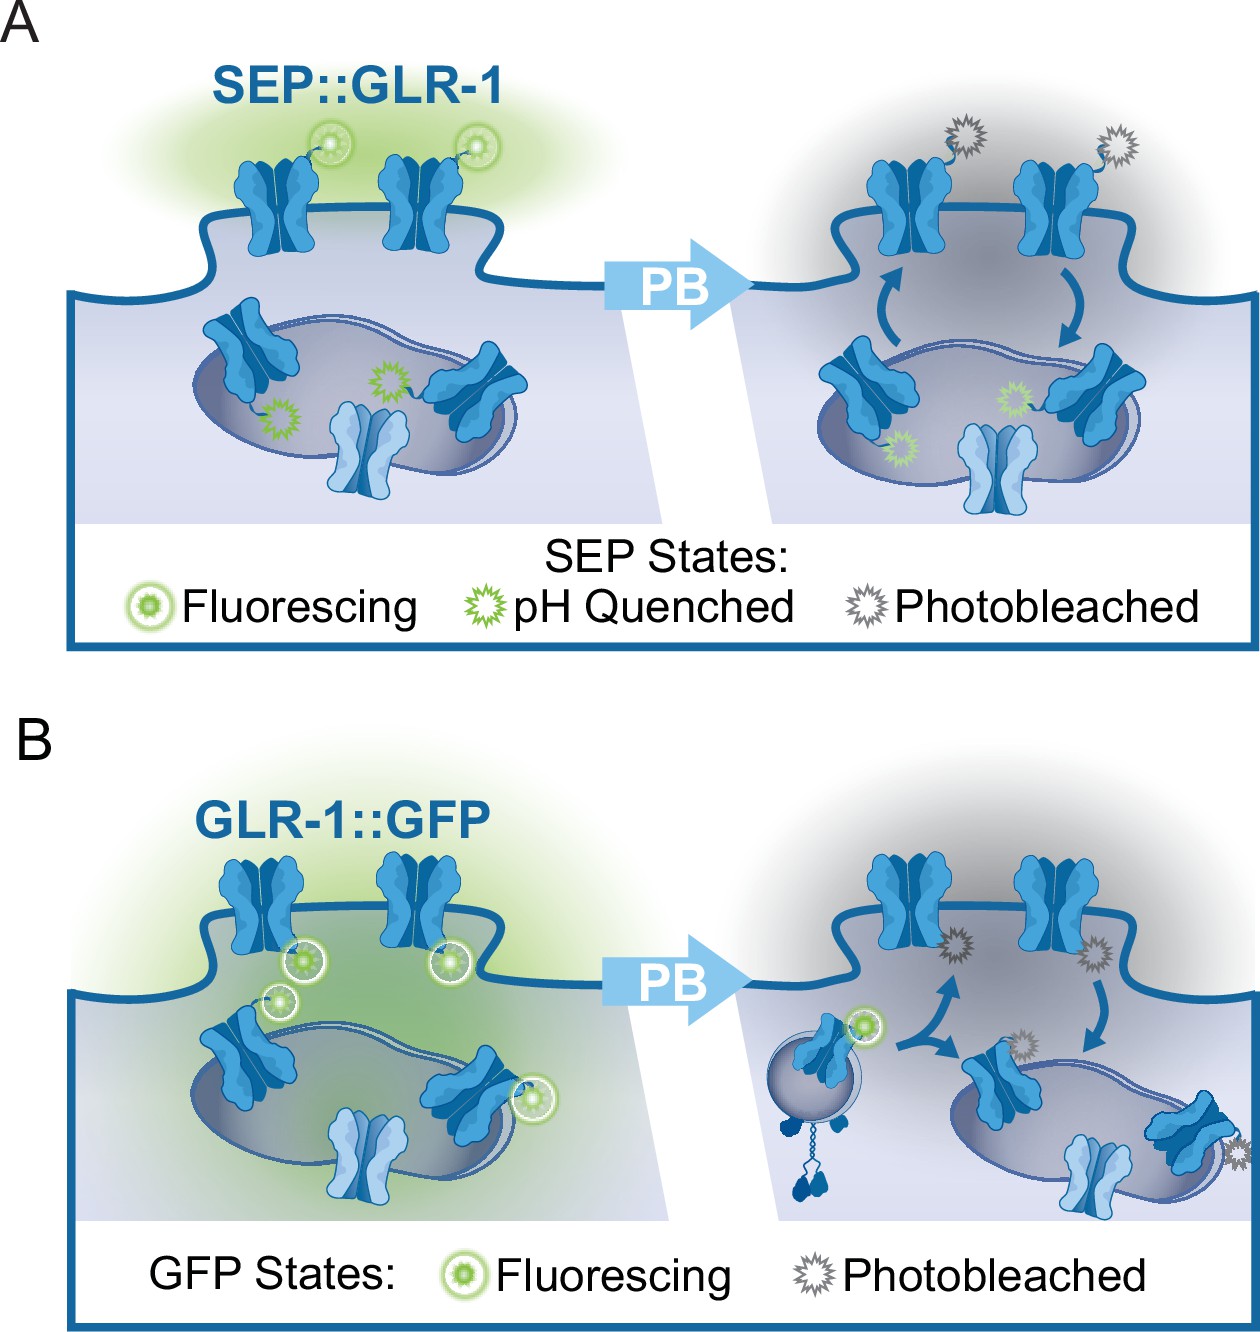
FRAP assays of tagged GLR-1.
(A) Illustration of subcellular SEP::GLR-1 localization. Following photobleaching (PB) of fluorescing SEP (attached to GLR-1 positioned at the synaptic membrane), recovery of SEP fluorescence is indicative of the rate of GLR-1 exocytosis from transport vesicles or synaptic endosomes and receptor endocytosis. (B) Illustration depicting the localization of GLR-1::GFP to the synaptic membrane or in endosomes. Following PB of GFP, the fluorescence recovery indicates that new GLR-1 has been transported and delivered to the synaptic membrane or endosome within the region of interest.
Tables
Appendix 1—key resources table
| Reagent type (species) or resource | Designation | Source or reference | Identifiers | Additional information |
|---|---|---|---|---|
| Strain, strain background (Caenorhabditis elegans) | AVA GLR-1::GFP (transgenic strain) | Hoerndli Lab, CSU | FJH 18 | Genotype: akIs141 II; glr-1(ky176) III akIs141 contents: Prig-3::GLR-1::GFP (integrated) |
| Strain, strain background (C. elegans) | AVA SEP::GLR-1 (transgenic strain) | Hoerndli Lab, CSU | FJH 314 | Genotype: akIs172; glr-1(ky176) III akIs172 contents: Prig-3::SEP::GLR-1 + Peat-4::ChR2::mCherry (integrated) |
| Strain, strain background (C. elegans) | AVA ChRimson and mito-roGFP (transgenic strain) | This paper | FJH 402 | Genotype: lin-15(n765ts) X; lite-1(ok530) X; csfEx160 csfEx160 contents: pRD30 + pRD15 + pJM23 + pCT61 |
| Strain, strain background (C. elegans) | AVA ChRimson and cyto-GCaMP (transgenic strain) | This paper | FJH 412 | Genotype: lin-15(n765ts) X; lite-1(ok530) X; csfEx167 csfEx167 contents: pRD30 + pAS1 + pJM23 |
| Strain, strain background (C. elegans) | AVA mitoKR and mito-roGFP (transgenic strain) | This paper | FJH 416 | Genotype: lin-15(n765ts) X; lite-1(ok530) X; csfEx168 csfEx168 contents: pRD36 + pRD15 + pJM23 |
| Strain, strain background (C. elegans) | AVA GLR-1::GFP and mitoKR (transgenic strain) | This paper | FJH 555 | Genotype: akIs141 II; glr-1(ky176) III; csfEx188 csfEx188 contents: pRD36 + pJM23 + pCT61 |
| Strain, strain background (C. elegans) | AVA GLR-1::GFP in mcu-1(lf) (transgenic strain) | This paper | FJH 576 | Genotype: akIs141 II; glr-1(ky176) III; mcu-1(ju1154) IV |
| Strain, strain background (C. elegans) | AVA SEP::GLR-1 with mitoKR (transgenic strain) | This paper | FJH 582 | Genotype: lin-15(n765ts) X; glr-1(ky176) III csfEx210 csfEx210 contents: pRD36 + pDM1442 + pJM23 |
| Strain, strain background (C. elegans) | AVA SEP::GLR-1 (transgenic strain) | This paper | FJH 635 | Genotype: lin-15(n765ts) X; glr-1(ky176) III csfEx234 csfEx234 contents: pDM1442 + pJM23 + pCT61 |
| Strain, strain background (C. elegans) | AVA SEP::GLR-1 in mcu-1(lf) (transgenic strain) | This paper | FJH 638 | Genotype: akIs172 II; glr-1(ky176) III; mcu-1(ju1154) IV |
| Strain, strain background (C. elegans) | AVA ChRimson and GCaMP in mcu-1(lf) (transgenic strain) | This paper | FJH 641 | Genotype: lin-15(n765ts) X; mcu-1(ju1154) IV; csfEx261 csfEx261 contents: pRD30 + pAS1 + pJM23 + pCT61 |
| Strain, strain background (C. elegans) | AVA ChRimson and mito-GCaMP (transgenic strain) | This paper | FJH 644 | Genotype: lin-15(n765ts), lite-1(ok530) X; csfEx264 csfEx264 contents: pKK01 + pRD30 + pJM23 + pCT61 |
| Strain, strain background (C. elegans) | AVA ChRimson and mito-GCaMP in mcu-1(lf) (transgenic strain) | This paper | FJH 647 | Genotype: lin-15(n765ts), lite-1(ok530) X; mcu-1(ju1154) IV; csfEx264 csfEx264 contents: see above |
| Strain, strain background (C. elegans) | AVA SEP::GLR-1 and mito-TdTom. (transgenic strain) | This paper | FJH 690 | Genotype: glr-1(ky176) III; csfEx268 csfEx268 contents: pKK07 + pDM1442 + pCT61 |
| Strain, strain background (C. elegans) | AVA ChRimson and mito-roGFP (transgenic strain) | This paper | FJH 706 | Genotype: lite-1(ok530) X; mcu-1(ju1154) IV; csfEx160 csfEx160 contents: pRD30 + pRD15 + pJM23 + pCT61 |
| Recombinant DNA reagent | AVA mito-roGFP (plasmid) | This paper | pRD15 | Pflp-18::TOMM-20::roGFP::let-858 5’UTR |
| Recombinant DNA reagent | AVA ChRimson TdTomato (plasmid) | This paper | pRD30 | Pflp-18::ChRimson::tdTomato::let-858 5’UTR |
| Recombinant DNA reagent | AVA mitoKR (plasmid) | This paper | pRD36 | Pflp-18::TOMM-20::KillerRed::let-858 5’UTR |
| Recombinant DNA reagent | AVA mito-GCaMP (plasmid) | This paper | pKK01 | Pflp-18::mito4x-GCaMP6f::let-858 5’UTR |
| Recombinant DNA reagent | AVA mito-TdTomato (plasmid) | This paper | pKK07 | Pflp-18::TOMM-20::tdTomato::let-858 5’UTR |
| Recombinant DNA reagent | AVA ChRimson mCherry (plasmid) | This paper | pED01 | Pflp18::ChRimson::mCherry |
| Recombinant DNA reagent | AVA cytoplasmic GCaMP (plasmid) | Stetak Lab, University of Zurich | pAS1 | Prig-3::GCaMP6f::unc-54 5’UTR |
| Recombinant DNA reagent | AVA SEP-tagged GLR-1 (plasmid) | Maricq Lab, University of Utah | pDM1442 | Prig-3::SEP::GLR-1::unc-54 5’UTR |
| Recombinant DNA reagent | Lin-15 rescue (plasmid) | Maricq Lab, University of Utah | pJM23 | Plin-15::lin-15+ |
| Recombinant DNA reagent | Filler DNA (plasmid) | Stratagene | pBSKS | For plasmid recombination into extrachromosomal array |
| Recombinant DNA reagent | Co-injection marker (plasmid) | Hoerndli Lab, CSU | pCT61 | Pegl-20::nls::DsRed |
| Recombinant DNA reagent | AVA mCherry tagged SOL-1 (plasmid) | Maricq Lab, University.of Utah | pWR38 | Prig-3::sol-2::mCherry |
| Recombinant DNA reagent | AVA Gateway vector (plasmid) | Hoerndli Lab, CSU | pCT22 | Gateway pENTR [4-1] Pflp-18 promoter |
| Recombinant DNA reagent | ChRimson Gateway vector (plasmid) | Hoerndli Lab, CSU | pFH13 | Gateway pENTR12 ChRimson no STOP |
| Recombinant DNA reagent | TdTomato Gateway vector (plasmid) | Hoerndli Lab, CSU | pGH162 | Gateway [2-3] tdTomato_let858UTR |
| Recombinant DNA reagent | Destination Gateway vector (plasmid) | Jorgensen Lab, University of Utah | pCFJ150 | pDEST/expression vector |
| Recombinant DNA reagent | 3’ UTR Gateway vector (plasmid) | Hoerndli Lab, CSU | pFH21 | Gateway pENTR [2-3] 3’UTR (let-858) |
| Recombinant DNA reagent | Mito-roGFP Gateway vector (plasmid) | This paper | pRD02 | Gateway pENTR [2-1] TOMM-20 roGFP |
| Recombinant DNA reagent | AVA cytoplasmic KillerRed (plasmid) | This paper | pRD22 | Pflp-18::KillerRed::let858 |
| Recombinant DNA reagent | Mito-GCaMP Source (plasmid) | Addgene | Addgene plasmid no. 127870 | CMV-Mito4x-GCaMP6f |
| Recombinant DNA reagent | Mito-roGFP Source (plasmid) | De Henau Lab, University Medical Center | pSHD1 | Pfbf1::TOMM20::roGFP2Tsa2::3’UTRtbb2 |
| Sequence-based reagent | PCR primers for cloning pRD15 | This paper | pSDH1_F | ggggacaagtttgtacaaaaaagcaggctGACatgagctccaccggtg |
| Sequence-based reagent | PCR primers for cloning pRD15 | This paper | pSDH1_R | ggggaccactttgtacaagaaagctgggtgcttgaaaggatcttgcattt |
| Sequence-based reagent | PCR primers for cloning pRD36 | This paper | pRD15_F | CTTGTACAAAGTGGTTGGATGATCG |
| Sequence-based reagent | PCR primers for cloning pRD36 | This paper | pRD15_R | TGCTCCAGCCTGGGCACG |
| Sequence-based reagent | PCR primers for cloning pRD36 | This paper | pRD22_F | GCCCAGGCTGGAGCATCCGAGGG AGGCCCAGCC |
| Sequence-based reagent | PCR primers for cloning pRD36 | This paper | pRD22_R | ACCACTTTGTACAAGTTAATCCTCGTCGGATCCGATGG |
| Sequence-based reagent | PCR primers for cloning pKK01 | This paper | pRD15_F2 | CTTGTACAAAGTGGTTGGATGA |
| Sequence-based reagent | PCR primers for cloning pKK01 | This paper | pRD15_R2 | GTCATGTCTAACCCTGAAATT |
| Sequence-based reagent | PCR primers for cloning pKK01 | This paper | AG127870_F | AGGGTTAGACATGACATGAGCGTGCTGACACCTCTG |
| Sequence-based reagent | PCR primers for cloning pKK01 | This paper | AG127870_R | ACCACTTTGTACAAGCTGATCAGCGGGTTTAAACGGG |
| Sequence-based reagent | PCR primers for cloning pKK07 | This paper | pRD15_F3 | CTTGTACAAAGTGGTTGGATGATCG |
| Sequence-based reagent | PCR primers for cloning pKK07 | This paper | pRD15_R3 | TGCTCCAGCCTGGGCACG |
| Sequence-based reagent | PCR primers for cloning pKK07 | This paper | pGH162_F | GCCCAGGCTGGAGCATGGTGAGC AAGGGCGAGG |
| Sequence-based reagent | PCR primers for cloning pKK07 | This paper | pGH162_R | ACCACTTTGTACAAGTTACTTGTACAGCTCGTCCATGCC |
| Sequence-based reagent | PCR primers for cloning pED01 | This paper | pRD30_F | GGATGATCGACGCCAACGT |
| Sequence-based reagent | PCR primers for cloning pED01 | This paper | pRD30_R | CCACTTTGTACAAGAAAGCTGGGT |
| Sequence-based reagent | PCR primers for cloning pED01 | This paper | pWR80_F | TCTTGTACAAAGTGGTGGTCTCAAAGGGTGAAGAAG |
| Sequence-based reagent | PCR primers for cloning pED01 | This paper | pWR80_R | TGGCGTCGATCATCCCACCATATTCCTTATACAATTCATC |
Additional files
Download links
A two-part list of links to download the article, or parts of the article, in various formats.
Downloads (link to download the article as PDF)
Open citations (links to open the citations from this article in various online reference manager services)
Cite this article (links to download the citations from this article in formats compatible with various reference manager tools)
Activity-dependent mitochondrial ROS signaling regulates recruitment of glutamate receptors to synapses
eLife 13:e92376.
https://doi.org/10.7554/eLife.92376


