Human DDX6 regulates translation and decay of inefficiently translated mRNAs
- Department of Biochemistry, Max Planck Institute for Developmental Biology, Germany
- Institute for Regenerative Medicine (IREM), University of Zurich, Switzerland
- Institute of Biochemistry and Molecular Biology, National Yang Ming Chiao Tung University, Taiwan
Figures
Figure 1 with 1 supplement
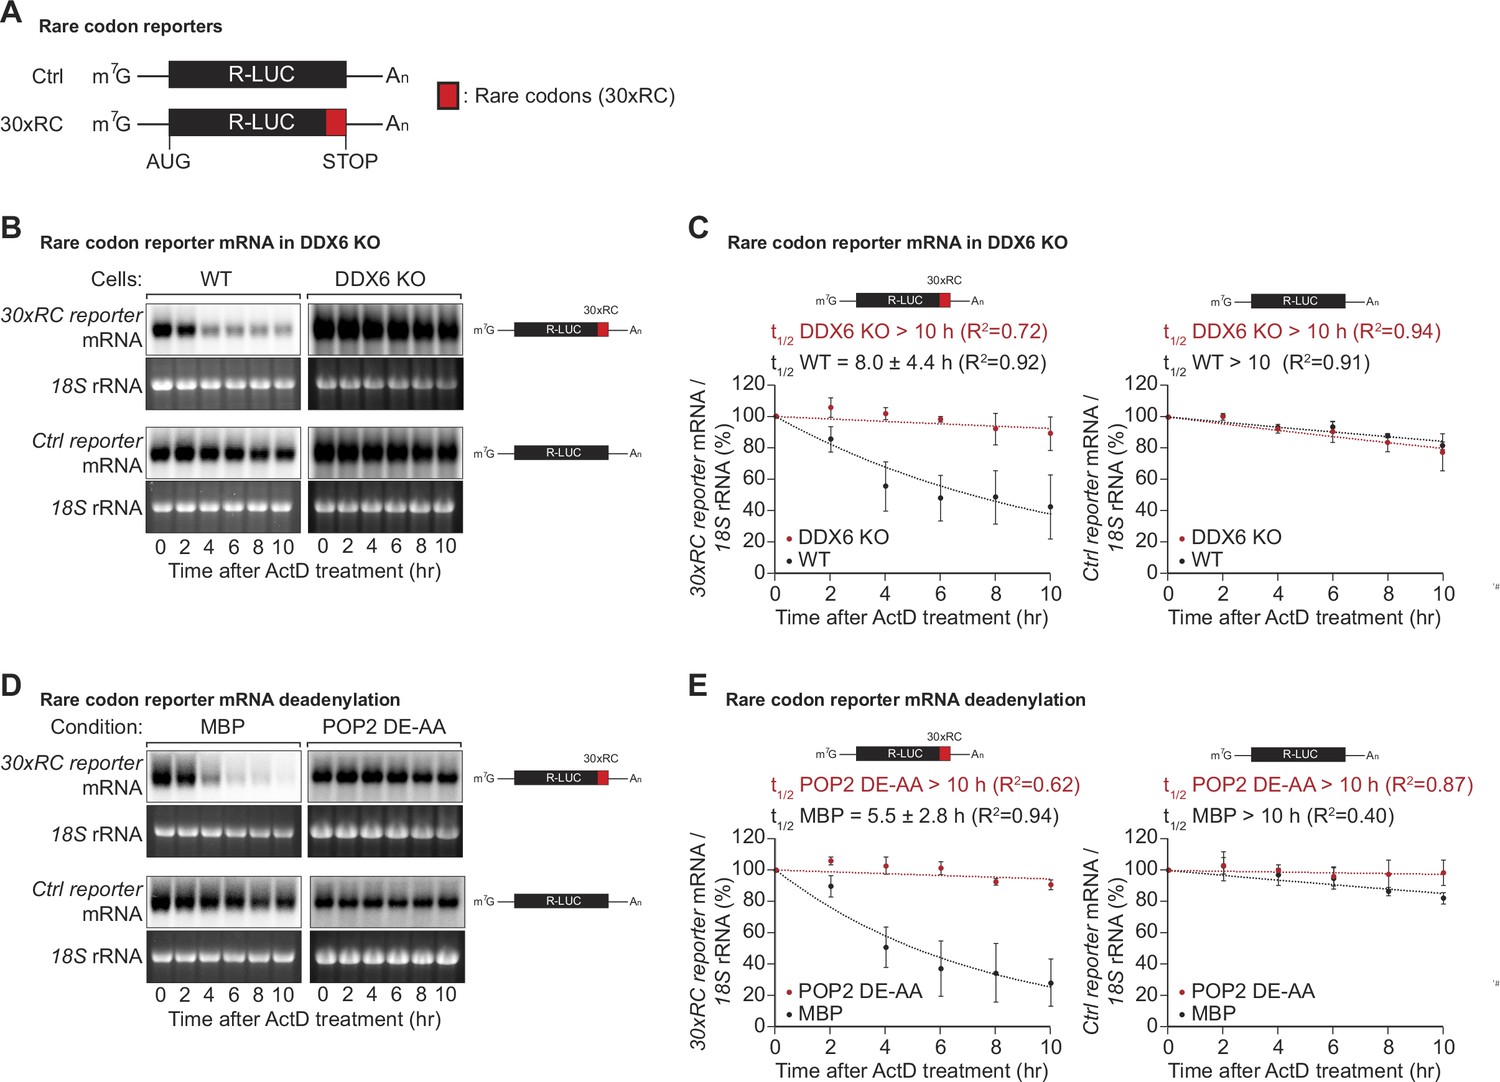
DDX6 functions as a sensor of rare codon-triggered mRNA decay in human cells.
(A) Schematic representation of the reporters used in panels (B, D). (B) Wild-type (WT) and DDX6 KO HEK293T cells were transfected with indicated reporter plasmids. After 48 hr, cells were treated with actinomycin D (ActD) and harvested at the indicated time points. Reporter mRNA levels were analyzed by northern blotting. 18 S rRNA ethidium bromide staining shows equal loading. (C) Relative reporter mRNA levels from panel B at time point zero (before ActD addition) were defined as 100%. Relative reporter mRNA levels were plotted as a function of time. Circles represent the mean value and error bars the standard deviation (SD) (n=3). The decay curves were fitted to an exponential decay with a single component (dotted lines). R2 values are indicated for each curve. The half-life of each mRNA in WT and DDX6 KO cells is represented as the mean ± SD. (D) HEK293T cells were transfected with MBP or POP2 dominant negative mutant (POP2 DE-AA) and indicated reporter plasmids. After 48 hr, cells were treated with ActD and harvested at the indicated time points. Reporter mRNA levels were analyzed by northern blotting. 18 S rRNA ethidium bromide staining shows equal loading. (E) Relative reporter mRNA levels from panel D at time point zero (before ActD addition) were defined as 100%. Relative reporter mRNA levels were plotted as a function of time. Circles represent the mean value and error bars the SD (n=3). The decay curves were fitted to an exponential decay with a single component (dotted lines). R2 values are indicated for each curve. The half-life of each reporter mRNA in WT and POP2 DE-AA overexpressing cells is represented as the mean ± SD.
-
Figure 1—source data 1
Original file for the northern blot analysis in Figure 1B.
- https://cdn.elifesciences.org/articles/92426/elife-92426-fig1-data1-v1.zip
-
Figure 1—source data 2
PDF containing Figure 1B and original scans of the relevant northern blot analysis with highlighted bands and sample labels.
- https://cdn.elifesciences.org/articles/92426/elife-92426-fig1-data2-v1.pdf
-
Figure 1—source data 3
Original file for the northern blot analysis in Figure 1D.
- https://cdn.elifesciences.org/articles/92426/elife-92426-fig1-data3-v1.zip
-
Figure 1—source data 4
PDF containing Figure 1D and original scans of the relevant northern blot analysis with highlighted bands and sample labels.
- https://cdn.elifesciences.org/articles/92426/elife-92426-fig1-data4-v1.pdf
Figure 1—figure supplement 1
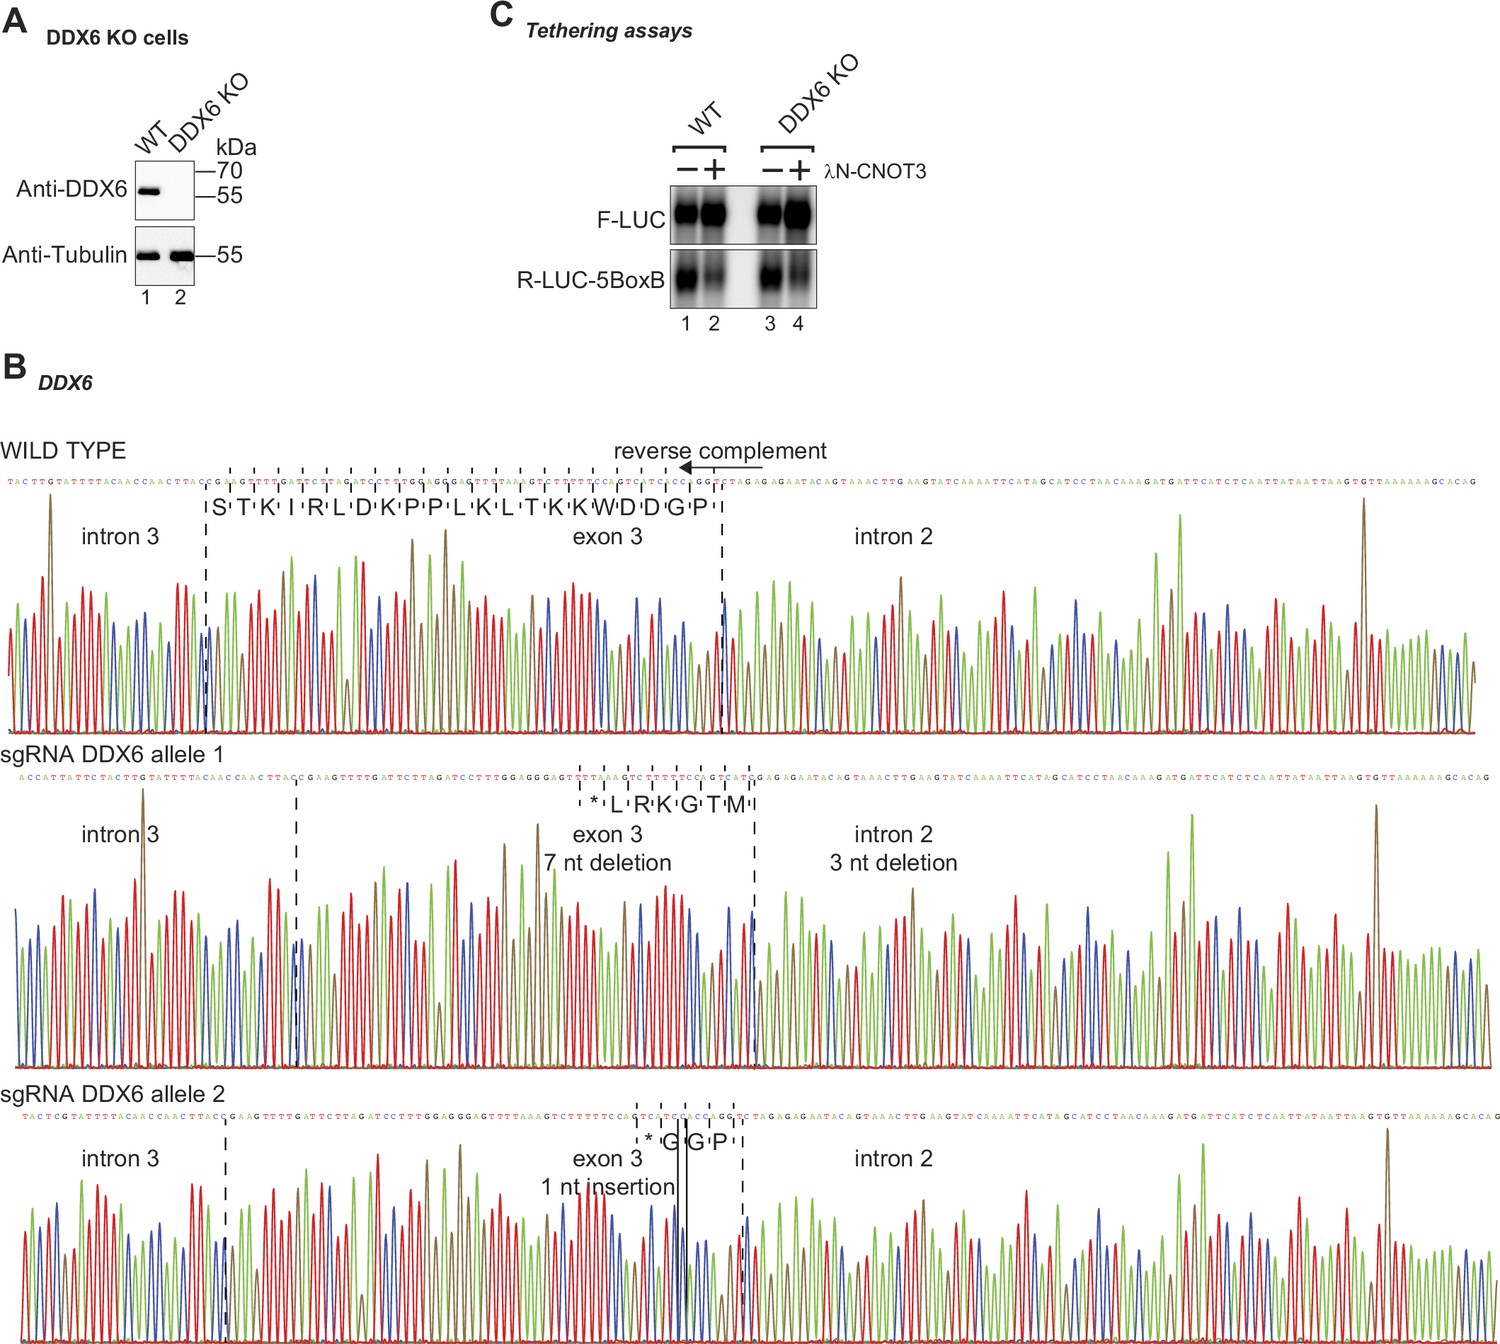
Characterization of HEK293T DDX6 KO cells.
(A) Immunoblots were probed with antibodies recognizing DDX6 and Tubulin. (B) Sanger sequencing of the DDX6 genomic region targeted by the DDX6 sgRNA. Frameshift mutations were detected in exon 3 of both alleles. These generate premature STOP codons (PTC) and deletions in DDX6. (C) Northern blot analysis of CNOT3 tethered to an R-LUC reporter mRNA in HEK293T WT or DDX6 KO cells. Indicated cells were transfected with a mixture of three plasmids: 1. expressing the Renilla luciferase (R-LUC) containing 5BoxB reporter, 2. expressing the Firefly luciferase (F-LUC) as a transfection control, and 3. expressing the λN-HA peptide (−) or λN-HA-CNOT3 (+).
-
Figure 1—figure supplement 1—source data 1
Original file for the western blot analysis in Figure 1—figure supplement 1A.
- https://cdn.elifesciences.org/articles/92426/elife-92426-fig1-figsupp1-data1-v1.zip
-
Figure 1—figure supplement 1—source data 2
PDF containing Figure 1—figure supplement 1A and original scans of the relevant western blot analysis with highlighted bands and sample labels.
- https://cdn.elifesciences.org/articles/92426/elife-92426-fig1-figsupp1-data2-v1.pdf
-
Figure 1—figure supplement 1—source data 3
Original file for the northern blot analysis in Figure 1—figure supplement 1C.
- https://cdn.elifesciences.org/articles/92426/elife-92426-fig1-figsupp1-data3-v1.zip
-
Figure 1—figure supplement 1—source data 4
PDF containing Figure 1—figure supplement 1C and original scans of the relevant northern blot analysis with highlighted bands and sample labels.
- https://cdn.elifesciences.org/articles/92426/elife-92426-fig1-figsupp1-data4-v1.pdf
Figure 2 with 1 supplement
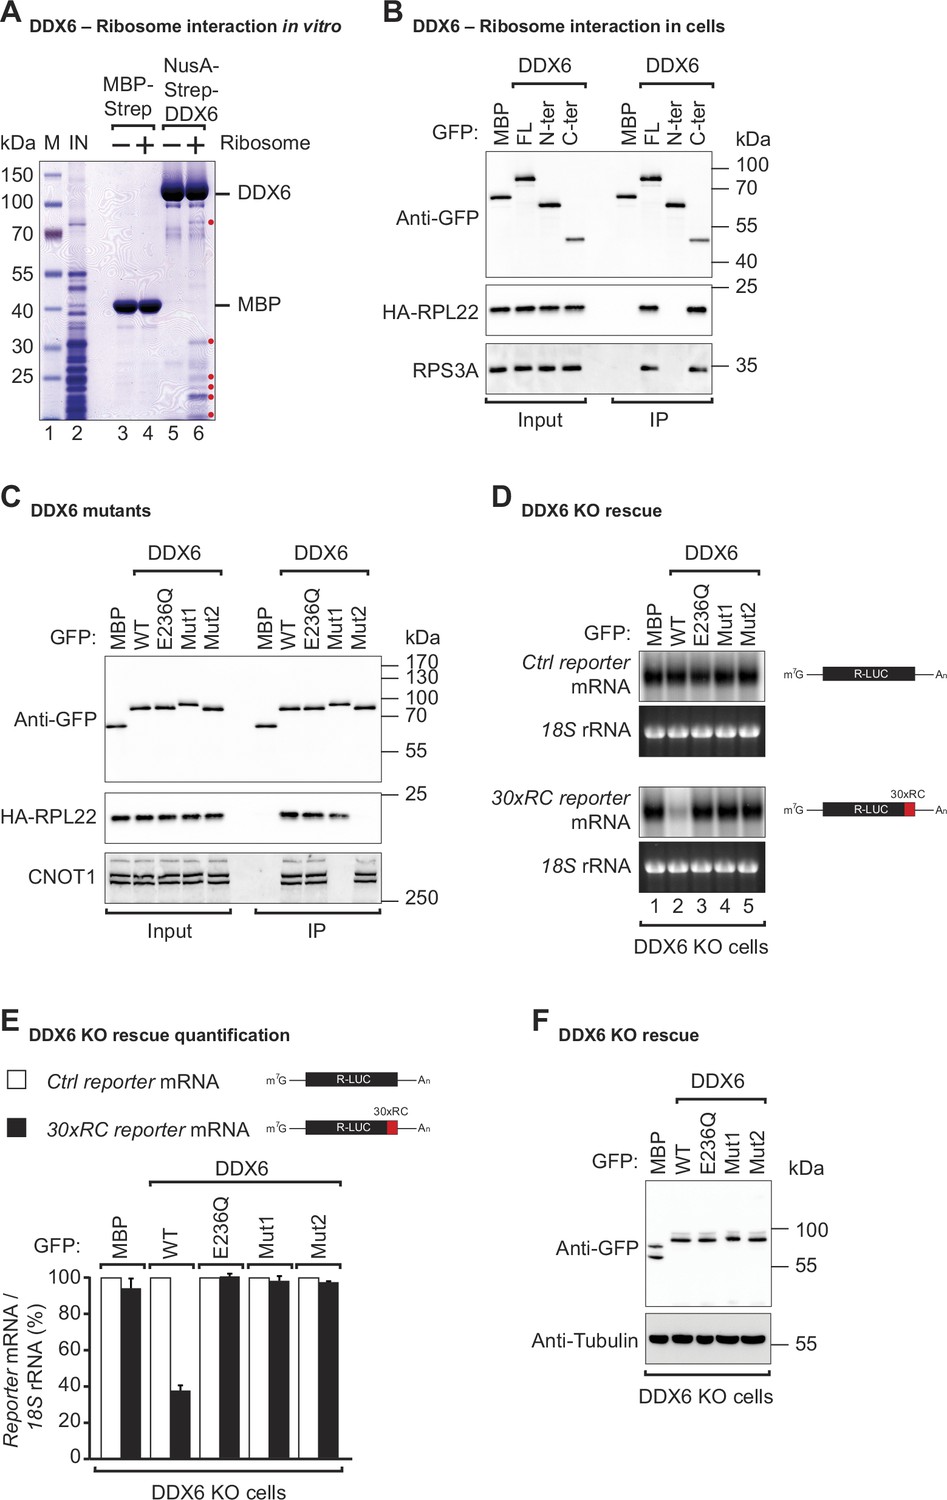
DDX6 interacts with ribosomal proteins in human cells.
(A) The interaction between the recombinant NusA-Strep-DDX6 and purified human ribosomal proteins was analyzed by SDS-PAGE and stained with Coomassie blue. Input lysate (1%) and bound fractions (20%) were loaded. (B) Western blot showing the interaction between GFP-tagged DDX6 full-length/N-ter/C-ter with HA-tagged RPL22 and endogenous RPS3A in human HEK293T cells. GFP-tagged MBP served as a negative control. For the GFP-tagged proteins, the HA-tagged RPL22, and the endogenous RPS3A, 1% of the input and 20% of the immunoprecipitate were loaded. N-ter: N-terminus; C-ter: C-terminus. (C) Immunoprecipitation assay showing the interaction of GFP-tagged DDX6 (wild-type or the indicated mutants) with HA-tagged RPL22 or endogenous CNOT1 in HEK293T cells. Samples were analyzed as described in B. (D) DDX6 KO HEK293T cells were transfected with the control Renilla luciferase (R-LUC) reporter or a reporter containing 30 x rare codons and GFP-tagged DDX6 wild-type or mutants. After treating cells with ActD for 8 hr R-LUC mRNA levels were analyzed by northern blotting. 18 S rRNA ethidium bromide staining shows equal loading. (E) Relative control reporter mRNA levels from panel D were defined as 100%. Relative 30 x rare codon reporter mRNA levels were plotted. Bars represent the mean value and error bars the standard deviation (n=3). (F) Immunoblot illustrating the expression of proteins used in the assay shown in panel D.
-
Figure 2—source data 1
Original file for the SDS-PAGE in Figure 2A.
- https://cdn.elifesciences.org/articles/92426/elife-92426-fig2-data1-v1.zip
-
Figure 2—source data 2
PDF containing Figure 2A and original scans of the relevant SDS-PAGE with highlighted bands and sample labels.
- https://cdn.elifesciences.org/articles/92426/elife-92426-fig2-data2-v1.pdf
-
Figure 2—source data 3
Original file for the western blot in Figure 2B.
- https://cdn.elifesciences.org/articles/92426/elife-92426-fig2-data3-v1.zip
-
Figure 2—source data 4
PDF containing Figure 2B and original scans of the relevant western blot analysis with highlighted bands and sample labels.
- https://cdn.elifesciences.org/articles/92426/elife-92426-fig2-data4-v1.pdf
-
Figure 2—source data 5
Original file for the western blot in Figure 2C.
- https://cdn.elifesciences.org/articles/92426/elife-92426-fig2-data5-v1.zip
-
Figure 2—source data 6
PDF containing Figure 2C and original scans of the relevant western blot analysis with highlighted bands and sample labels.
- https://cdn.elifesciences.org/articles/92426/elife-92426-fig2-data6-v1.pdf
-
Figure 2—source data 7
Original file for the northern blot in Figure 2D.
- https://cdn.elifesciences.org/articles/92426/elife-92426-fig2-data7-v1.zip
-
Figure 2—source data 8
PDF containing Figure 2D and original scans of the relevant northern blot analysis with highlighted bands and sample labels.
- https://cdn.elifesciences.org/articles/92426/elife-92426-fig2-data8-v1.pdf
-
Figure 2—source data 9
Original file for the western blot in Figure 2F.
- https://cdn.elifesciences.org/articles/92426/elife-92426-fig2-data9-v1.zip
-
Figure 2—source data 10
PDF containing Figure 2F and original scans of the relevant western blot analysis with highlighted bands and sample labels.
- https://cdn.elifesciences.org/articles/92426/elife-92426-fig2-data10-v1.pdf
Figure 2—figure supplement 1
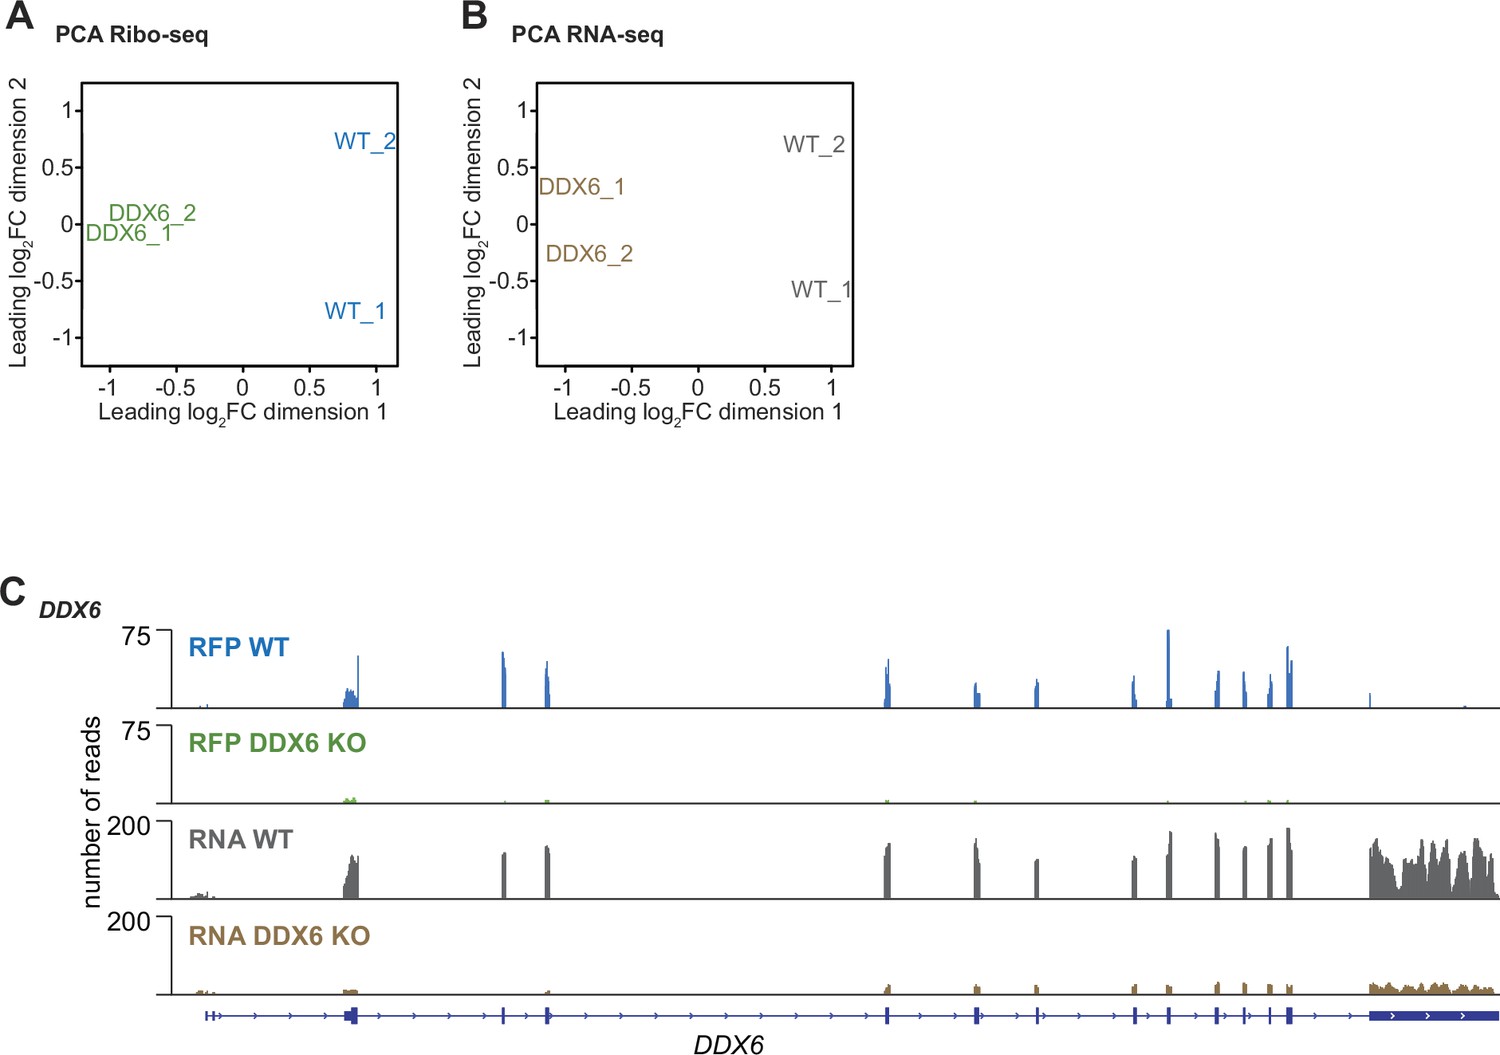
Multidimensional scaling analysis of Ribo-Seq and RNA-Seq and the ribosome footprints on mRNA read distribution in DDX6 KO Cells.
(A, B) Multidimensional scaling (MDS) analysis for the Ribo-Seq (A) and RNA-Seq (B) replicate libraries from HEK293T wild-type (WT) and DDX6 KO cells. The Ribo-Seq and RNA-Seq experiments were reproducible as replicates clustered together. (C) Ribosome footprints (RFP) and total mRNA (RNA) reads distribution along DDX6 mRNA in wild-type (WT) and DDX6 KO cells. Of note, RFP and total RNA counts for DDX6 are drastically reduced in the knockout KO cells.
Figure 3 with 3 supplements
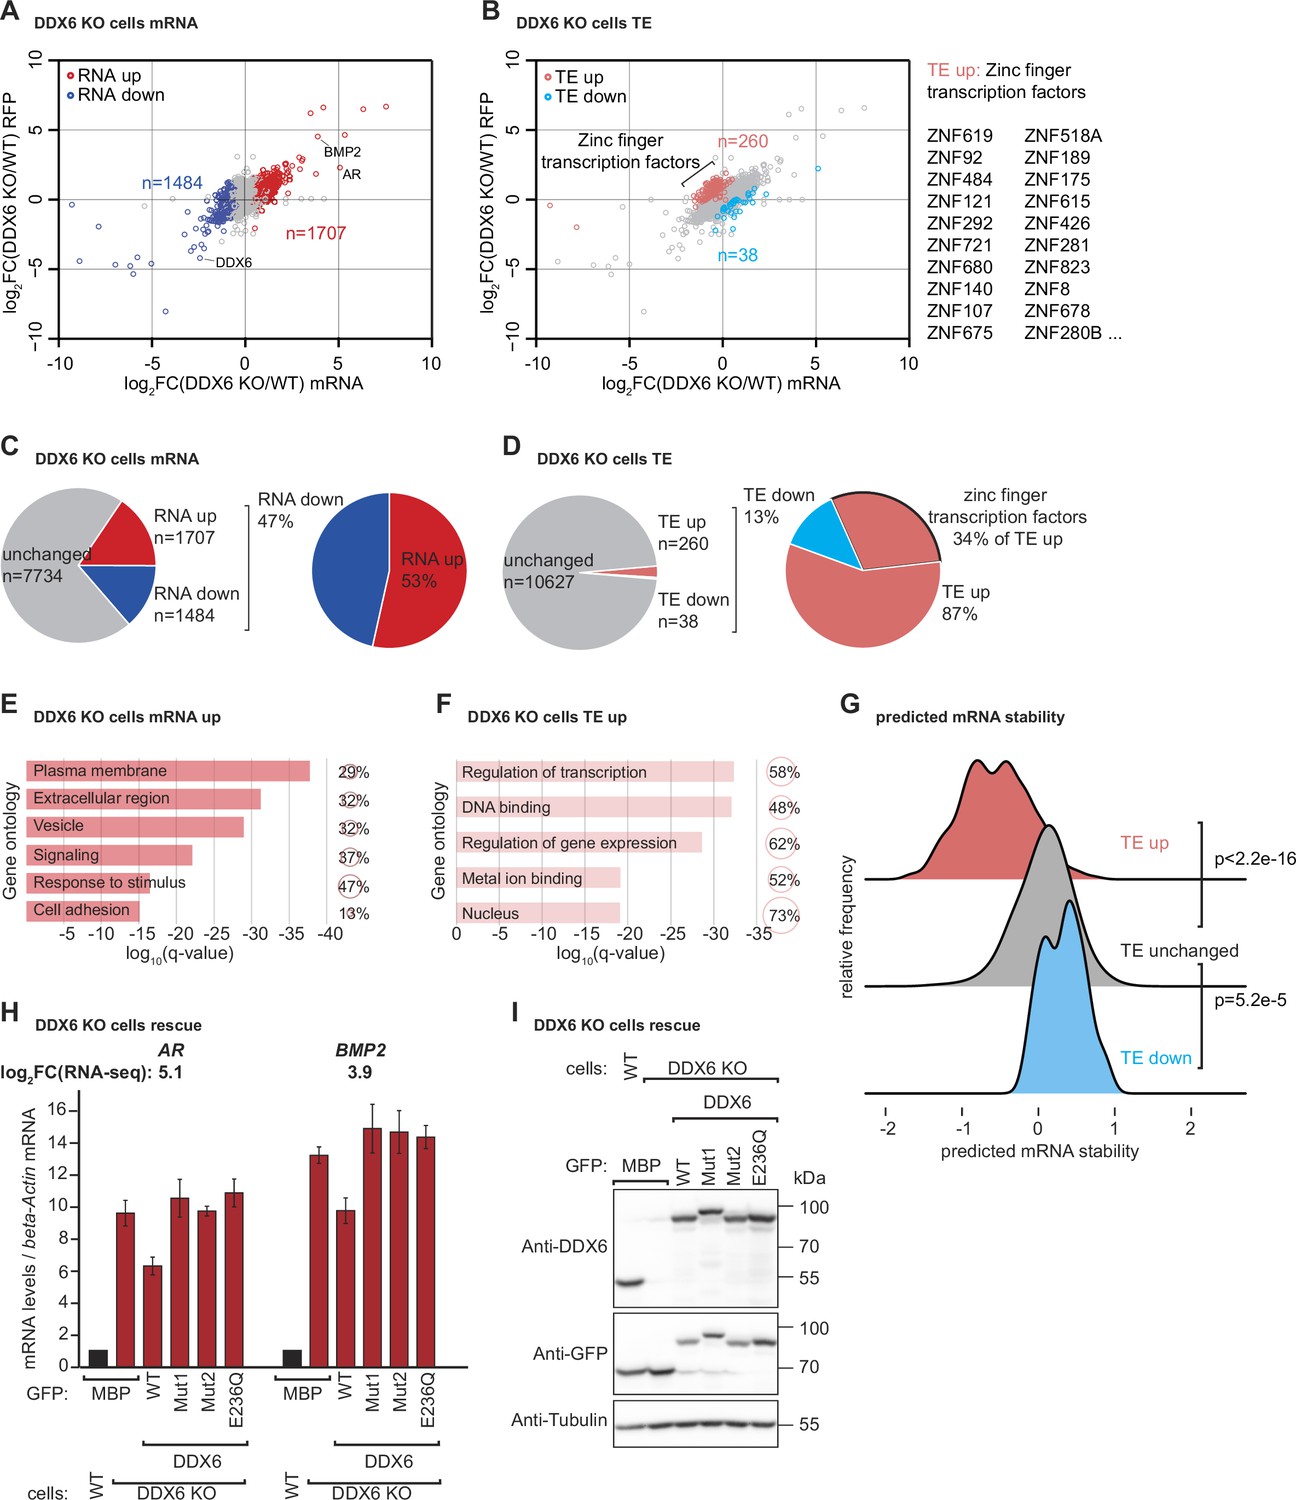
DDX6 controls mRNA abundance and translational efficiency in human cells.
(A) Comparative analysis of translational efficiency (TE) in wild-type (WT) HEK293T and DDX6 KO cells. Genes with significantly (FDR <0.005) increased (n=1707 genes) and decreased (n=1484 genes) mRNA abundance are colored in red and blue, respectively. (B) Comparative analysis of TE in WT HEK293T and DDX6 KO cells. Genes with significantly (FDR <0.005) increased (n=260 genes) and decreased (n=38 genes) TE are highlighted in salmon and cyan, respectively. The top 20 (total 89) of translationally upregulated zinc finger transcription factors in DDX6 KO cells are highlighted. (C) Pie charts indicating the fractions and absolute numbers of significantly (FDR <0.005) differentially expressed mRNAs in HEK293T WT and DDX6 KO cells as determined by RNA-seq. (D) Pie charts indicating the fractions and absolute numbers of significantly (FDR <0.005) differentially translated mRNAs in HEK293T WT and DDX6 KO cells as determined by Ribo-seq/RNA-seq. (E) Gene ontology of the biological processes associated with upregulated transcripts in DDX6 KO cells. Bar graph shows log10 q-values for each overrepresented category. Values and circles indicate the % of genes within each category. (F) Gene ontology of the biological processes associated with translationally upregulated transcripts in DDX6 KO cells. Bar graph shows log10 q-values for each overrepresented category. Values and circles indicate the % of genes within each category. (G) Ridgeline plots of predicted mRNA stability (Diez et al., 2022) of translationally upregulated unchanged/downregulated transcripts in DDX6 KO cells. Statistical significance was calculated with the one-sided Wilcoxon rank sum test. (H) qPCR analysis of AR and BMP2 mRNA levels in HEK293T WT and DDX6 KO and rescued with GFP-tagged DDX6 (wild-type or the indicated mutants). log2FC values for each transcript as determined by the RNA-seq experiments are indicated. (I) Immunoblot depicting the expression of proteins used in the assay shown in panel G.
-
Figure 3—source data 1
Original file for the westhern blot in Figure 3I.
- https://cdn.elifesciences.org/articles/92426/elife-92426-fig3-data1-v1.zip
-
Figure 3—source data 2
PDF containing Figure 3I and original scans of the relevant western blot analysis with highlighted bands and sample labels.
- https://cdn.elifesciences.org/articles/92426/elife-92426-fig3-data2-v1.pdf
Figure 3—figure supplement 1
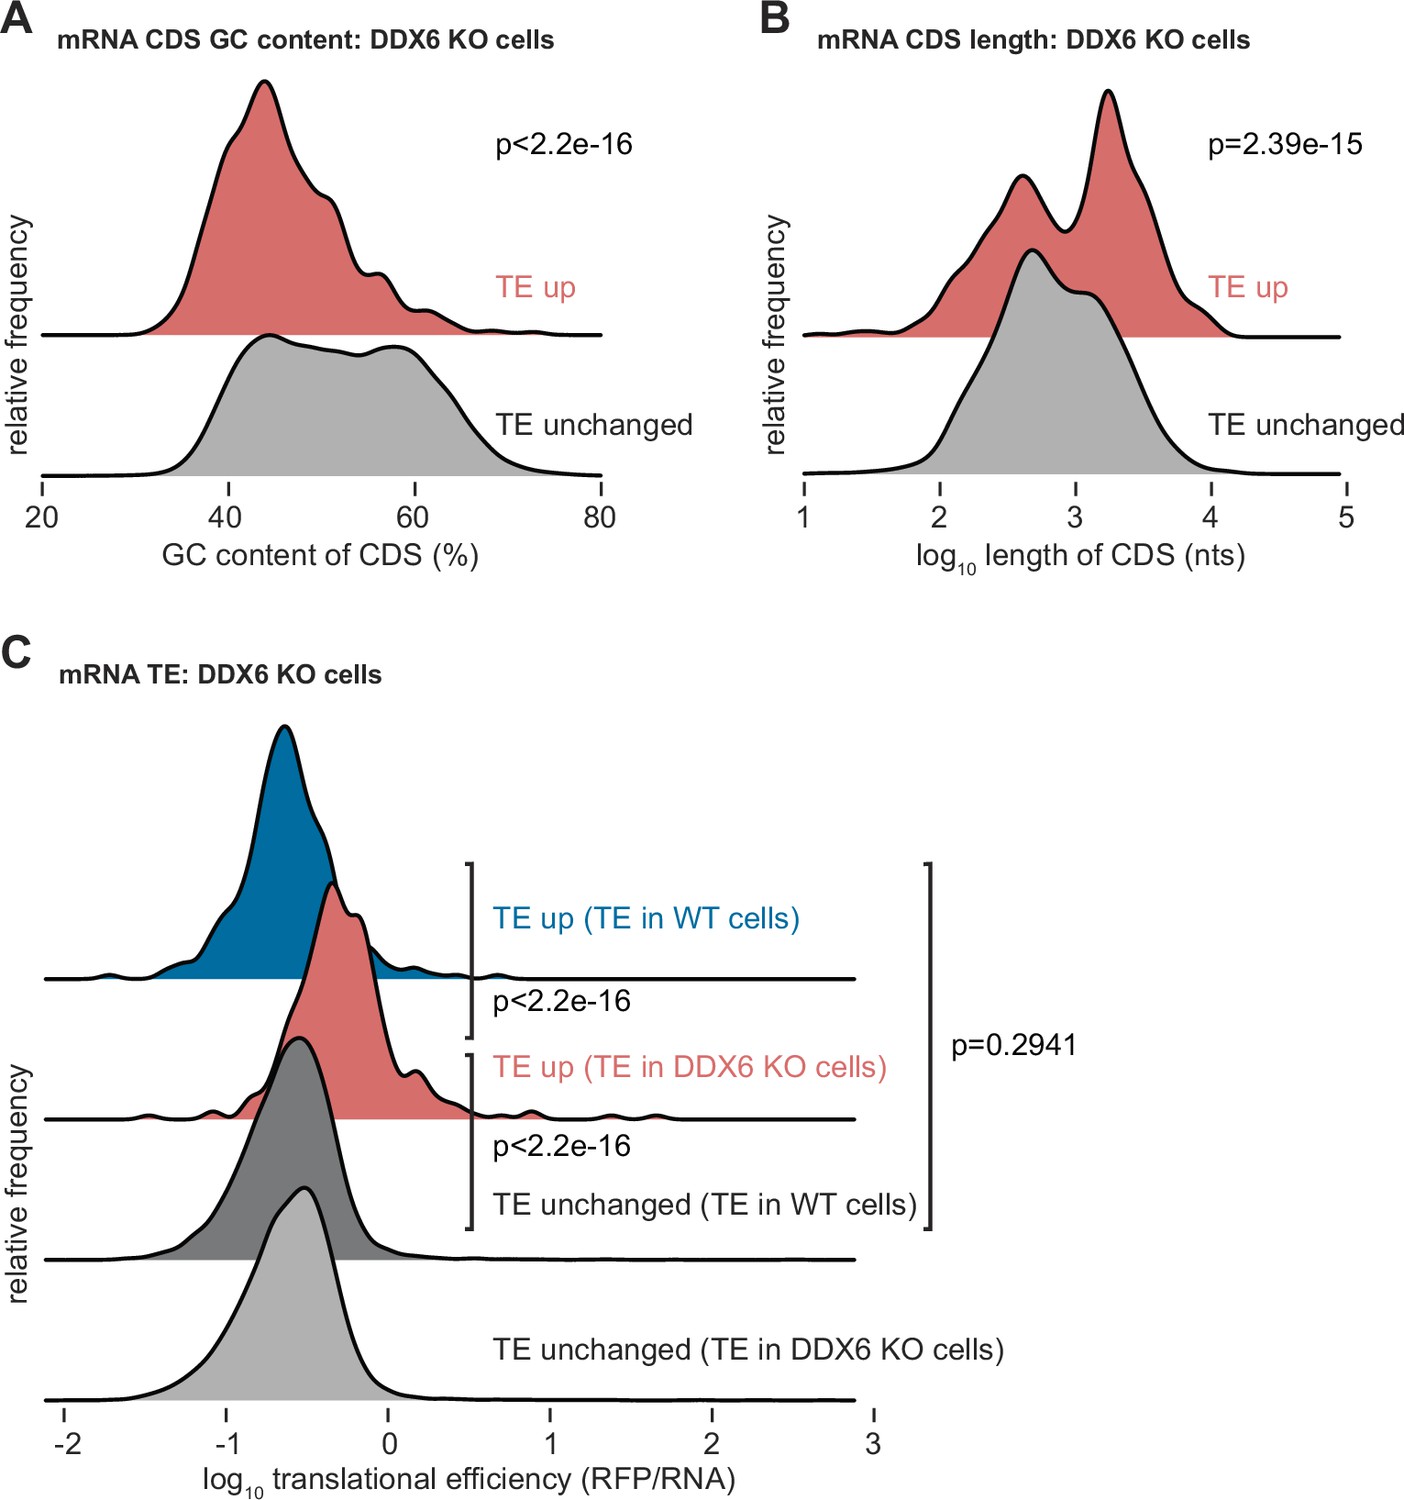
Characterization of DDX6 target mRNAs.
(A–C) Ridgeline plots illustrating the GC content (A), coding sequence (CDS) length (B), and translational efficiency (TE) (C) of translationally regulated DDX6 target mRNAs. Statistical significance was calculated with the one-sided Wilcoxon rank sum test.
Figure 3—figure supplement 2
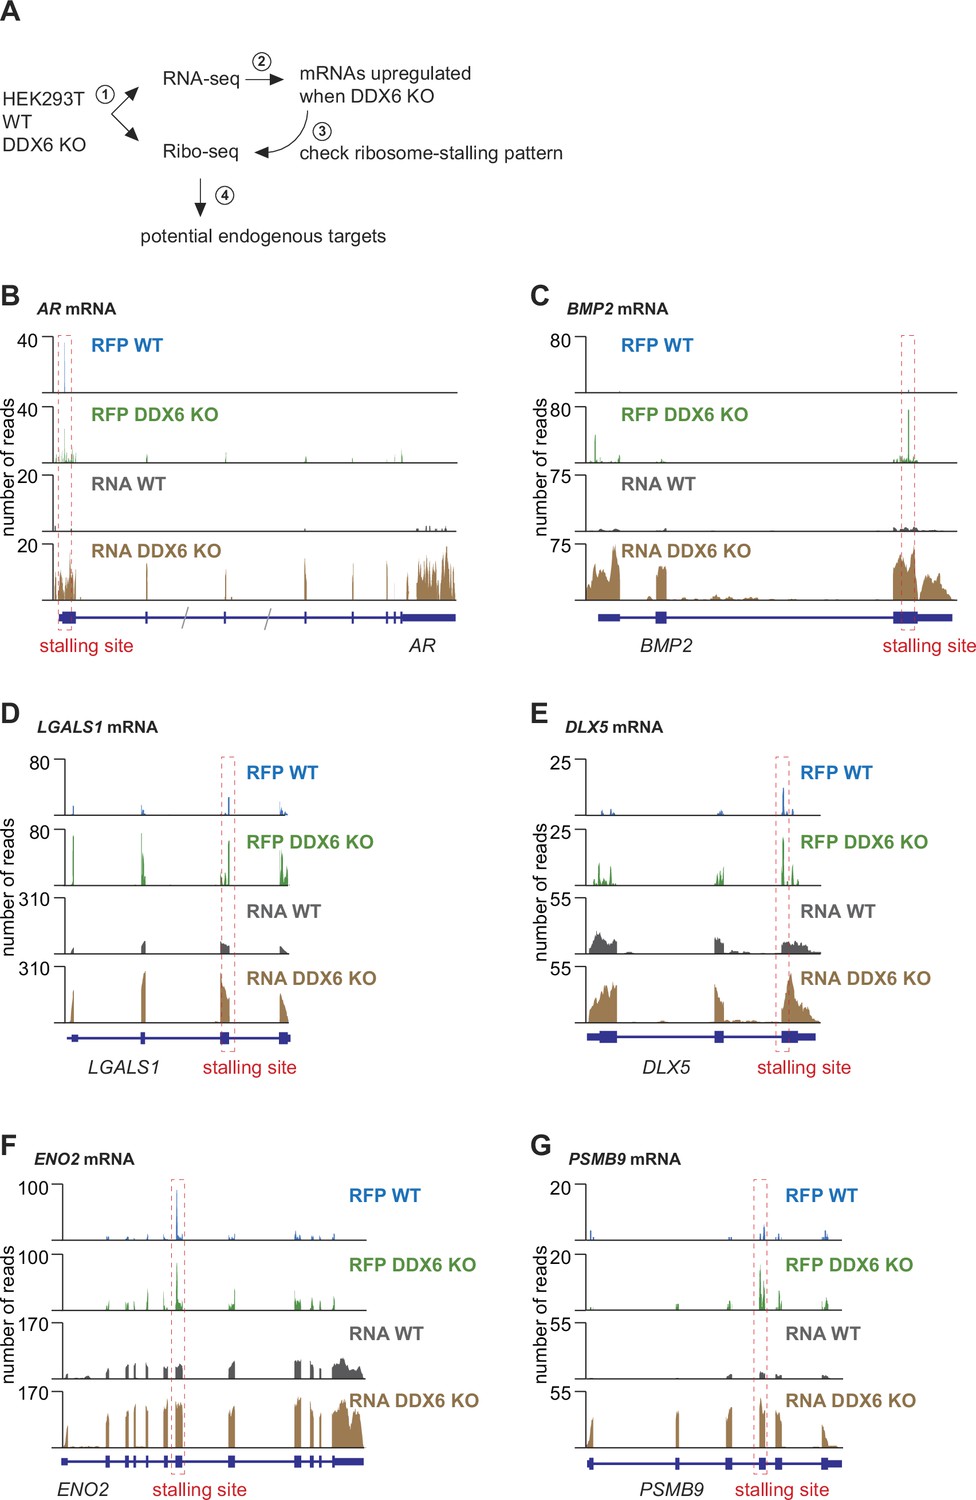
Identification of DDX6 target mRNAs.
(A) Schematic representation of the experimental strategy to identify mRNAs targeted by DDX6 for translational repression and decay. (B–G) Ribosome footprints (RFP) and total mRNA (RNA) reads distribution along DDX6 target mRNAs in wild-type (WT) and DDX6 KO cells. Potential ribosome stalling sites are indicated in red dotted boxes.
Figure 3—figure supplement 3
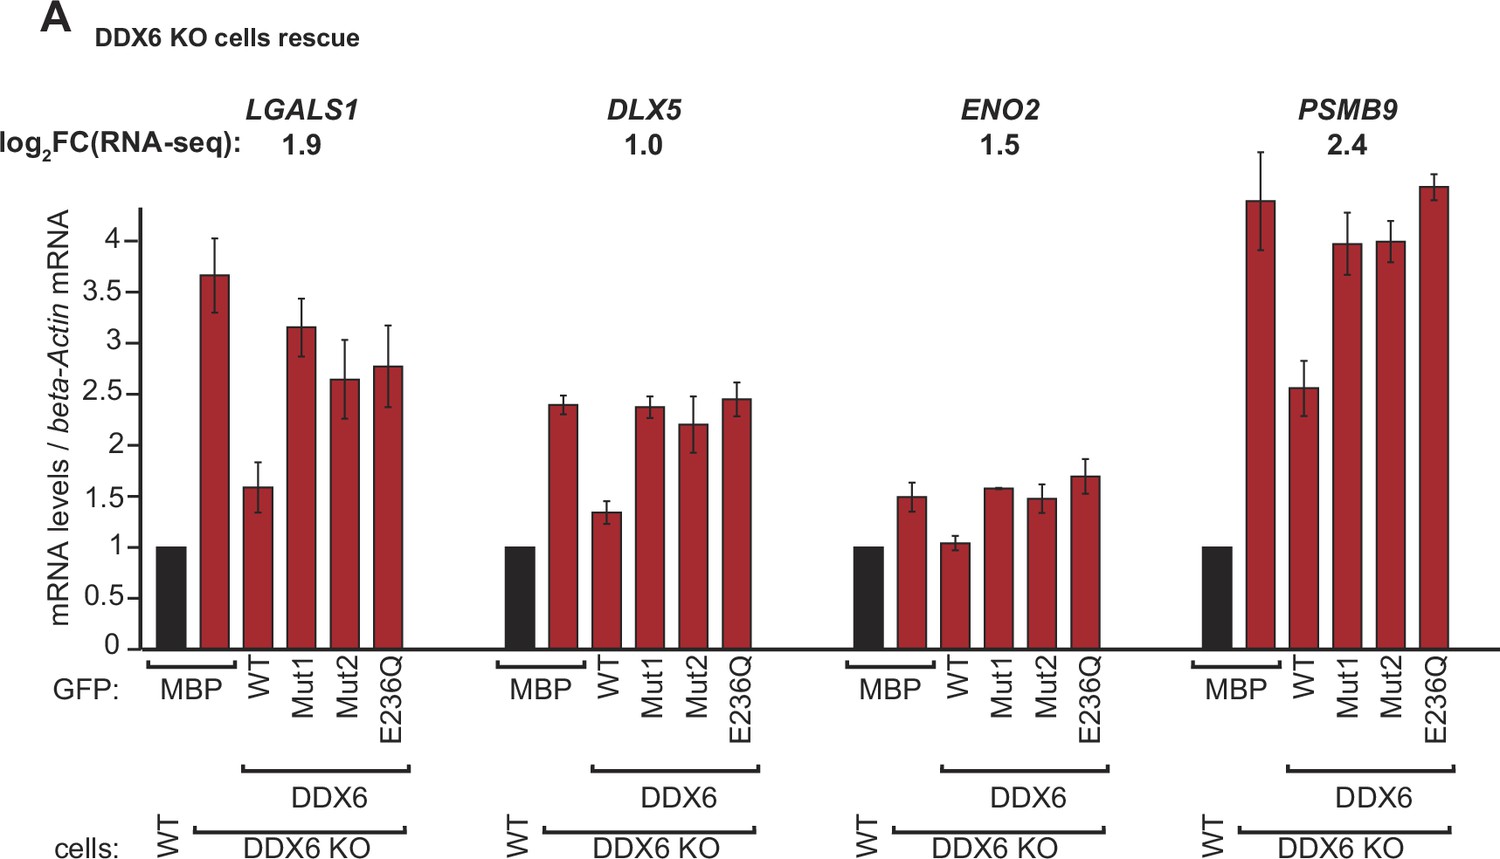
Validation of DDX6 target mRNAs.
(A) qPCR analysis of LGALS1, DLX5, ENO2, and PSMB9 mRNA levels in HEK293T wild-type (WT) and DDX6 KO and rescued with GFP-tagged DDX6 (wild-type or the indicated mutants). log2FC values for each transcript as determined by the RNA-seq experiments are indicated.
Figure 4
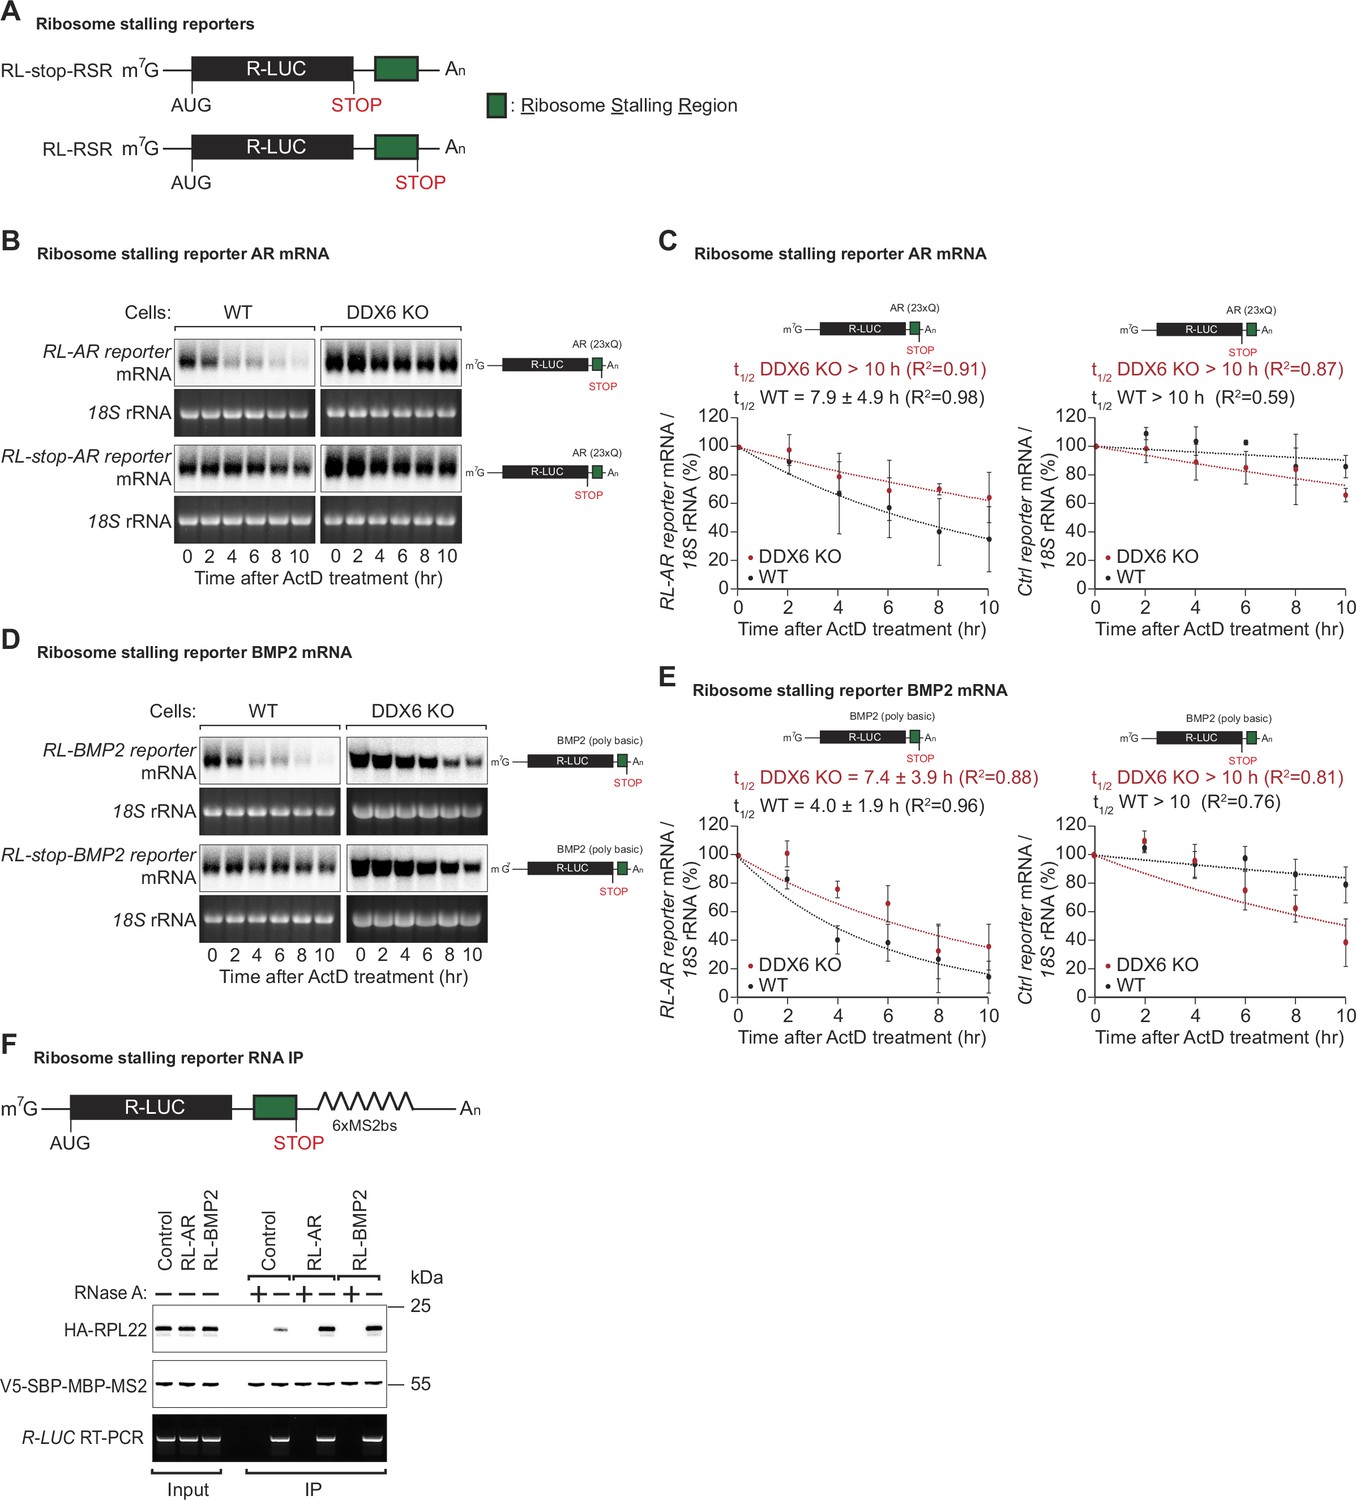
DDX6 is required for ribosome-stalling mRNA degradation.
(A) Schematic representation of the reporters used in panels (B, C). (B) Representative northern blots showing the decay of androgen receptor (AR) reporter mRNAs in HEK293T wild-type (WT) or DDX6 KO cells. Cells were transfected with indicated reporter plasmids and monitored after the inhibition of transcription using actinomycin D (ActD) for the indicated time. 18 S rRNA ethidium bromide staining shows equal loading. (C) Relative reporter mRNA levels from panel B at time point zero (before ActD addition) were defined as 100%. Relative reporter mRNA levels were plotted as a function of time. Circles represent the mean value and error bars the standard deviation (SD) (n=3). The decay curves were fitted to an exponential decay with a single component (dotted lines). R2 values are indicated for each curve. The half-life of each mRNA in WT and DDX6 KO cells is represented as the mean ± SD. (D) Representative northern blots showing the decay of BMP2 reporter mRNAs in HEK293T WT or DDX6 KO cells. Cells were transfected with indicated reporter plasmids and monitored after the inhibition of transcription using ActD for the indicated time. 18 S rRNA ethidium bromide staining shows equal loading. (E) Relative reporter mRNA levels from panel D at time point zero (before ActD addition) were defined as 100%. Relative reporter mRNA levels were plotted as a function of time. Circles represent the mean value and error bars the standard deviation (SD) (n=3). The decay curves were fitted to an exponential decay with a single component (dotted lines). R2 values are indicated for each curve. The half-life of each mRNA in WT and DDX6 KO cells is represented as the mean ± SD. (F) HEK293T cells were transfected with indicated R-LUC reporters containing 6xMS2 binding sites, HA-tagged RPL22, and SBP-tagged MBP-MS2 plasmids. RNA bound to V5-SBP-MBP-MS2 was immunoprecipitated with Streptavidin beads. The presence of HA-tagged RPL22 in the immunoprecipitates was determined by western blotting. V5-SBP-MBP-MS2 protein level and RT-PCR of R-LUC reporter RNA levels served as a loading control.
-
Figure 4—source data 1
Original file for the northern blot in Figure 4B.
- https://cdn.elifesciences.org/articles/92426/elife-92426-fig4-data1-v1.zip
-
Figure 4—source data 2
PDF containing Figure 4B and original scans of the relevant northern blot analysis with highlighted bands and sample labels.
- https://cdn.elifesciences.org/articles/92426/elife-92426-fig4-data2-v1.pdf
-
Figure 4—source data 3
Original file for the northern blot in Figure 4D.
- https://cdn.elifesciences.org/articles/92426/elife-92426-fig4-data3-v1.zip
-
Figure 4—source data 4
PDF containing Figure 4D and original scans of the relevant northern blot analysis with highlighted bands and sample labels.
- https://cdn.elifesciences.org/articles/92426/elife-92426-fig4-data4-v1.pdf
-
Figure 4—source data 5
Original file for the RNA IP analysis in Figure 4D.
- https://cdn.elifesciences.org/articles/92426/elife-92426-fig4-data5-v1.zip
-
Figure 4—source data 6
PDF containing Figure 4F and original scans of the relevant RNA IP analysis with highlighted bands and sample labels.
- https://cdn.elifesciences.org/articles/92426/elife-92426-fig4-data6-v1.pdf
Tables
Appendix 1—key resources table
| Reagent type (species) or resource | Designation | Source or reference | Identifiers | Additional information |
|---|---|---|---|---|
| Gene (Homo sapiens) | DDX6 | GenBank | HGNC:2747 | |
| Strain, strain background (Escherichia coli) | BL21 Star (DE3) | Thermo Fisher | Invitrogen: C601003 | |
| Cell line (H. sapiens) | HEK293T | ATCC | CRL-3216 | Identity authenticated by SRT profiling, negative for mycoplasma. |
| Cell line (H. sapiens) | HEK293T DDX6 KO | Elisa Izaurralde Lab | Hanet et al., 2019 | Developed and maintained by Elisa Izaurralde lab, identity authenticated by SRT profiling, negative for mycoplasma. This material can be obtained from the Elisa Izaurralde Lab. |
| Transfected construct (E. coli) | pnEK-NvHM-Strep-MBP | Elisa Izaurralde Lab | Chang et al., 2019 | This material can be obtained from the Elisa Izaurralde Lab. |
| Transfected construct (E. coli) | pETM-60-NusA-3C-HsRCK_296–472-Strep | Elisa Izaurralde Lab | Addgene #146209 | Addgene #146209 |
| Transfected construct (H. sapiens) | pT7-EGFP-C1-MBP | Elisa Izaurralde Lab | Addgene #146318 | Addgene #146318 |
| Transfected construct (H. sapiens) | pT7-EGFP-C1-HsDDX6 | Elisa Izaurralde Lab | Addgene #25033 | Addgene #25033 |
| Transfected construct (H. sapiens) | pT7-EGFP-C1-HsDDX6_1–295 | Elisa Izaurralde Lab | This paper | This material can be obtained from the Elisa Izaurralde Lab. |
| Transfected construct (H. sapiens) | pT7-EGFP-C1-HsDDX6_296–463 | Elisa Izaurralde Lab | Addgene #145971 | Addgene #145971 |
| Transfected construct (H. sapiens) | pT7-EGFP-C1-HsDDX6_E236Q | Elisa Izaurralde Lab | Addgene #146456 | Addgene #146456 |
| Transfected construct (H. sapiens) | pT7-EGFP-C1-HsDDX6_Mut1 | Elisa Izaurralde Lab | Addgene #147023 | Addgene #147023 |
| Transfected construct (H. sapiens) | pT7-EGFP-C1-HsDDX6_Mut2 | Elisa Izaurralde Lab | Addgene #148452 | Addgene #148452 |
| Transfected construct (H. sapiens) | pCIneo-HA-RPL22 | Elisa Izaurralde Lab | This paper | This material can be obtained from the Elisa Izaurralde Lab. |
| Transfected construct (H. sapiens) | pCIneo-RLuc | Elisa Izaurralde Lab | Addgene #146090 | Addgene #146090 |
| Transfected construct (H. sapiens) | pCIneo-RLuc_ 30xRC | Elisa Izaurralde Lab | This paper | This material can be obtained from the Elisa Izaurralde Lab. |
| Transfected construct (H. sapiens) | pCIneo-RL-AR | Elisa Izaurralde Lab | This paper | This material can be obtained from the Elisa Izaurralde Lab. |
| Transfected construct (H. sapiens) | pCIneo-RL-Stop-AR | Elisa Izaurralde Lab | This paper | This material can be obtained from the Elisa Izaurralde Lab. |
| Transfected construct (H. sapiens) | pCIneo-RL-BMP2 | Elisa Izaurralde Lab | This paper | This material can be obtained from the Elisa Izaurralde Lab. |
| Transfected construct (H. sapiens) | pCIneo-RL-Stop-BMP2 | Elisa Izaurralde Lab | This paper | This material can be obtained from the Elisa Izaurralde Lab. |
| Transfected construct (H. sapiens) | pCIneo-v5-SBP-MBP-MS2 | Elisa Izaurralde Lab | This paper | This material can be obtained from the Elisa Izaurralde Lab. |
| Transfected construct (H. sapiens) | pCIneo-RL-6xMS2bs | Elisa Izaurralde Lab | Addgene #148306 | Addgene #148306 |
| Transfected construct (H. sapiens) | pCIneo-RL-AR-6xMS2bs | Elisa Izaurralde Lab | This paper | This material can be obtained from the Elisa Izaurralde Lab. |
| Transfected construct (H. sapiens) | pCIneo-RL-BMP2-6xMS2bs | Elisa Izaurralde Lab | This paper | This material can be obtained from the Elisa Izaurralde Lab. |
| Antibody | anti-GFP (Rabbit polyclonal) | Elisa Izaurralde Lab | Chen et al., 2014 | IP (This material can be obtained from the Elisa Izaurralde Lab.) |
| Antibody | anti-GFP (Mouse monoclonal) | Roche | Roche #11814460001 | WB(1:2000) |
| Antibody | anti-HA-HRP (Mouse monoclonal) | Roche | Roche #12013819001 | WB(1:5000) |
| Antibody | anti-CNOT1 (Rabbit polyclonal) | Elisa Izaurralde Lab | Chen et al., 2014 | WB(1:1000) |
| Antibody | anti-DDX6 (Rabbit polyclonal) | Bethyl, A300-461Z | Bethyl #A300-461Z | WB(1:1000) |
| Antibody | anti-RPS3A (Rabbit polyclonal) | Abcam | Abcam #ab264368 | WB(1:1000) |
| Antibody | anti-V5 (Mouse monoclonal) | BioRad | BioRad #MCA1360GA | WB(1:5000) |
| Antibody | anti-Tubulin (Mouse monoclonal) | Sigma Aldrich | Sigma Aldrich #T6199 | WB(1:3000) |
| Sequence-based reagent | AR_F | This paper | qPCR primers | gacatgcgtttggagactgcca |
| Sequence-based reagent | AR_R | This paper | qPCR primers | cccagagtcatccctgcttcat |
| Sequence-based reagent | BMP2_F | This paper | qPCR primers | cccagagtcatccctgcttcat |
| Sequence-based reagent | BMP2_R | This paper | qPCR primers | cagcaacgctagaagacagcgg |
| Sequence-based reagent | LGALS1_F | This paper | qPCR primers | ctcaaacctggagagtgccttc |
| Sequence-based reagent | LGALS1_R | This paper | qPCR primers | tcgtatccatctggcagcttga |
| Sequence-based reagent | PSMB9_F | This paper | qPCR primers | cttttgccattggtggctccgg |
| Sequence-based reagent | PSMB9_R | This paper | qPCR primers | ccataccaggttttggccctag |
| Sequence-based reagent | GAPDH_F | This paper | qPCR primers | ctctgctcctcctgttcgacag |
| Sequence-based reagent | GAPDH_R | This paper | qPCR primers | ttcccgttctcagccttgacgg |
| Sequence-based reagent | Beta-Actin_F | This paper | qPCR primers | ccaaaagcatgacaggcagaaa |
| Sequence-based reagent | Beta-Actin_R | This paper | qPCR primers | tcccgtgttcctcaccaatcat |
| Sequence-based reagent | DLX5_F | This paper | qPCR primers | CAGCCATGTCTGCTTAGACCAG |
| Sequence-based reagent | DLX5_R | This paper | qPCR primers | TACTGGTAGGGGTTGAGAGCTT |
| Sequence-based reagent | ENO2_F | This paper | qPCR primers | ATGTGTCACTTGTGCTTTGCTC |
| Sequence-based reagent | ENO2_R | This paper | qPCR primers | ACCCCAGTCATCTTGGGATCTA |
| Commercial assay or kit | RNeasy Mini Kit | Qiagen | Qiagen 74104 | |
| Commercial assay or kit | TruSeq RNA Library Prep Kit v2 | Illumina | Illumina RS-122–2002 | |
| Commercial assay or kit | Ribo-Zero Gold Kit | Illumina | discontinued | |
| Chemical compound, drug | Actinomycin D | Sigma-Aldrich | Sigma-Aldrich #A1410 | |
| Software, algorithm | Bowtie2 | Langmead and Salzberg, 2012 | ||
| Software, algorithm | Tophat2 | Kim et al., 2013 | ||
| Software, algorithm | QuasR | Gaidatzis et al., 2015 | ||
| Software, algorithm | edgeR | Robinson et al., 2010; McCarthy et al., 2012 | ||
| Software, algorithm | RiboDiff | Zhong et al., 2017 | ||
| Software, algorithm | Integrative Genomics Viewer (IGV) | Broad Institute; Robinson et al., 2011; Thorvaldsdóttir et al., 2013 | ||
| Software, algorithm | goseq | Young et al., 2010 |
Additional files
-
MDAR checklist
- https://cdn.elifesciences.org/articles/92426/elife-92426-mdarchecklist1-v1.pdf
-
Supplementary file 1
Constructs and mutants used in this study.
- https://cdn.elifesciences.org/articles/92426/elife-92426-supp1-v1.docx
Download links
A two-part list of links to download the article, or parts of the article, in various formats.
Downloads (link to download the article as PDF)
Open citations (links to open the citations from this article in various online reference manager services)
Cite this article (links to download the citations from this article in formats compatible with various reference manager tools)
Human DDX6 regulates translation and decay of inefficiently translated mRNAs
eLife 13:RP92426.
https://doi.org/10.7554/eLife.92426.3


