Mobile barrier mechanisms for Na+-coupled symport in an MFS sugar transporter
- Department of Cell Physiology and Molecular Biophysics, Center for Membrane Protein Research, Texas Tech University Health Sciences Center, School of Medicine, United States
- Thermo Fisher Scientific, United States
- VIB-VUB Center for Structural Biology, VIB, Pleinlaan 2, Belgium
- Structural Biology Brussels, Vrije Universiteit Brussel, Pleinlaan 2, Belgium
- Division of CryoEM and Bioimaging, Stanford Synchrotron Radiation Light Source, SLAC National Accelerator Laboratory, United States
- Department of Chemistry and Biochemistry, Texas Tech University, United States
- Department of Physiology, University of California, Los Angeles, United States
Figures
Figure 1 with 3 supplements
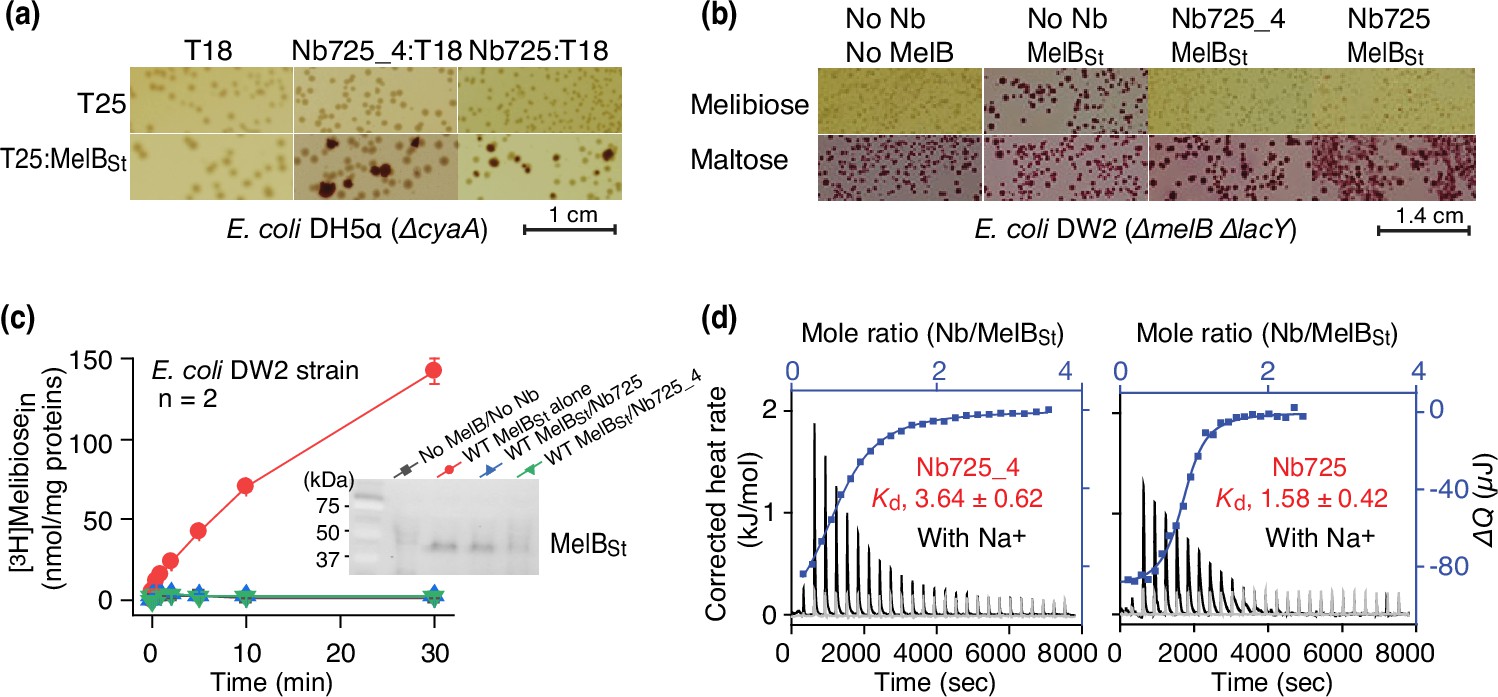
Functional characterizations of the hybrid Nb725_4.
(a) In vivo two-hybrid interaction assay. Two compatible plasmids encoding T25:MelBSt and Nb:T18 were transformed into E. coli DH5α cyaA cells and plated on the maltose-containing MacConkey agar plate as described in ‘Materials and methods’. The irregular red colonies are typical of a positive two-hybrid test indicating the protein-protein interactions. The image for the two hybrids T25:MelBSt and Nb725:T18 was reused from Figure 3a in Katsube et al., 2023 under a Creative Commons Attribution (CC BY 4.0) license. (b) Inhibition of melibiose fermentation by Nbs. Two compatible plasmids encoding MelBSt and Nb725 or Nb725_4 were transformed into E. coli DW2 cells [ΔmelBΔlacYZ] and plated on the MacConkey agar plate containing maltose (as the positive control) and melibiose (for testing transport activity of MelBSt) as the sole carbon source. The image of MelBSt/Nb725 was reused (Katsube et al., 2023). (c) [3H]Melibiose transport assay with E. coli DW2 cells. The cells transformed by two compatible plasmids encoding the MelBSt and Nb725 or Nb725_4 were prepared for [3H]melibiose transport assay at 0.4 mM (specific activity of 10 mCi/mmol) and 20 mM Na+ as described in ‘Materials and methods’. The cells transformed with the two empty plasmids without MelB or Nb were the negative control. Inset, western blot. MelBSt expression under the co-expression system was analyzed by isolating the membrane fractions. An aliquot of 50 μg was loaded on each well and MelBSt protein was probed by the HisProbe-HRP Conjugate. (d) Nb binding to MelBSt by isothermal titration calorimetry (ITC) measurements. As described in ‘Materials and methods’, the thermograms were collected with the Nano-ITC device (TA Instrument) at 25°C. Exothermic thermograms shown as positive peaks were obtained by titrating Nbs (0.3 mM) into the MelBSt-free buffer (gray) or MelBSt (35 μM)-containing buffer (black) in the Sample Cell and plotted using bottom/left (x/y) axes. The binding isotherm and fitting of the mole ratio (Nb/MelBSt) vs. the total heat change (ΔQ) using one-site independent-binding model were presented by top/right (x/y) axes. The dissociation constant Kd was presented at mean ± SEM (number of tests = 6–7).
-
Figure 1—source data 1
Original photographs that were taken from in vivo two-hybrid interaction assay and used to prepare Figure 1a.
- https://cdn.elifesciences.org/articles/92462/elife-92462-fig1-data1-v1.pdf
-
Figure 1—source data 2
Original photographs that were taken from sugar fermentation assay results and used to prepare Figure 1b.
- https://cdn.elifesciences.org/articles/92462/elife-92462-fig1-data2-v1.pdf
-
Figure 1—source data 3
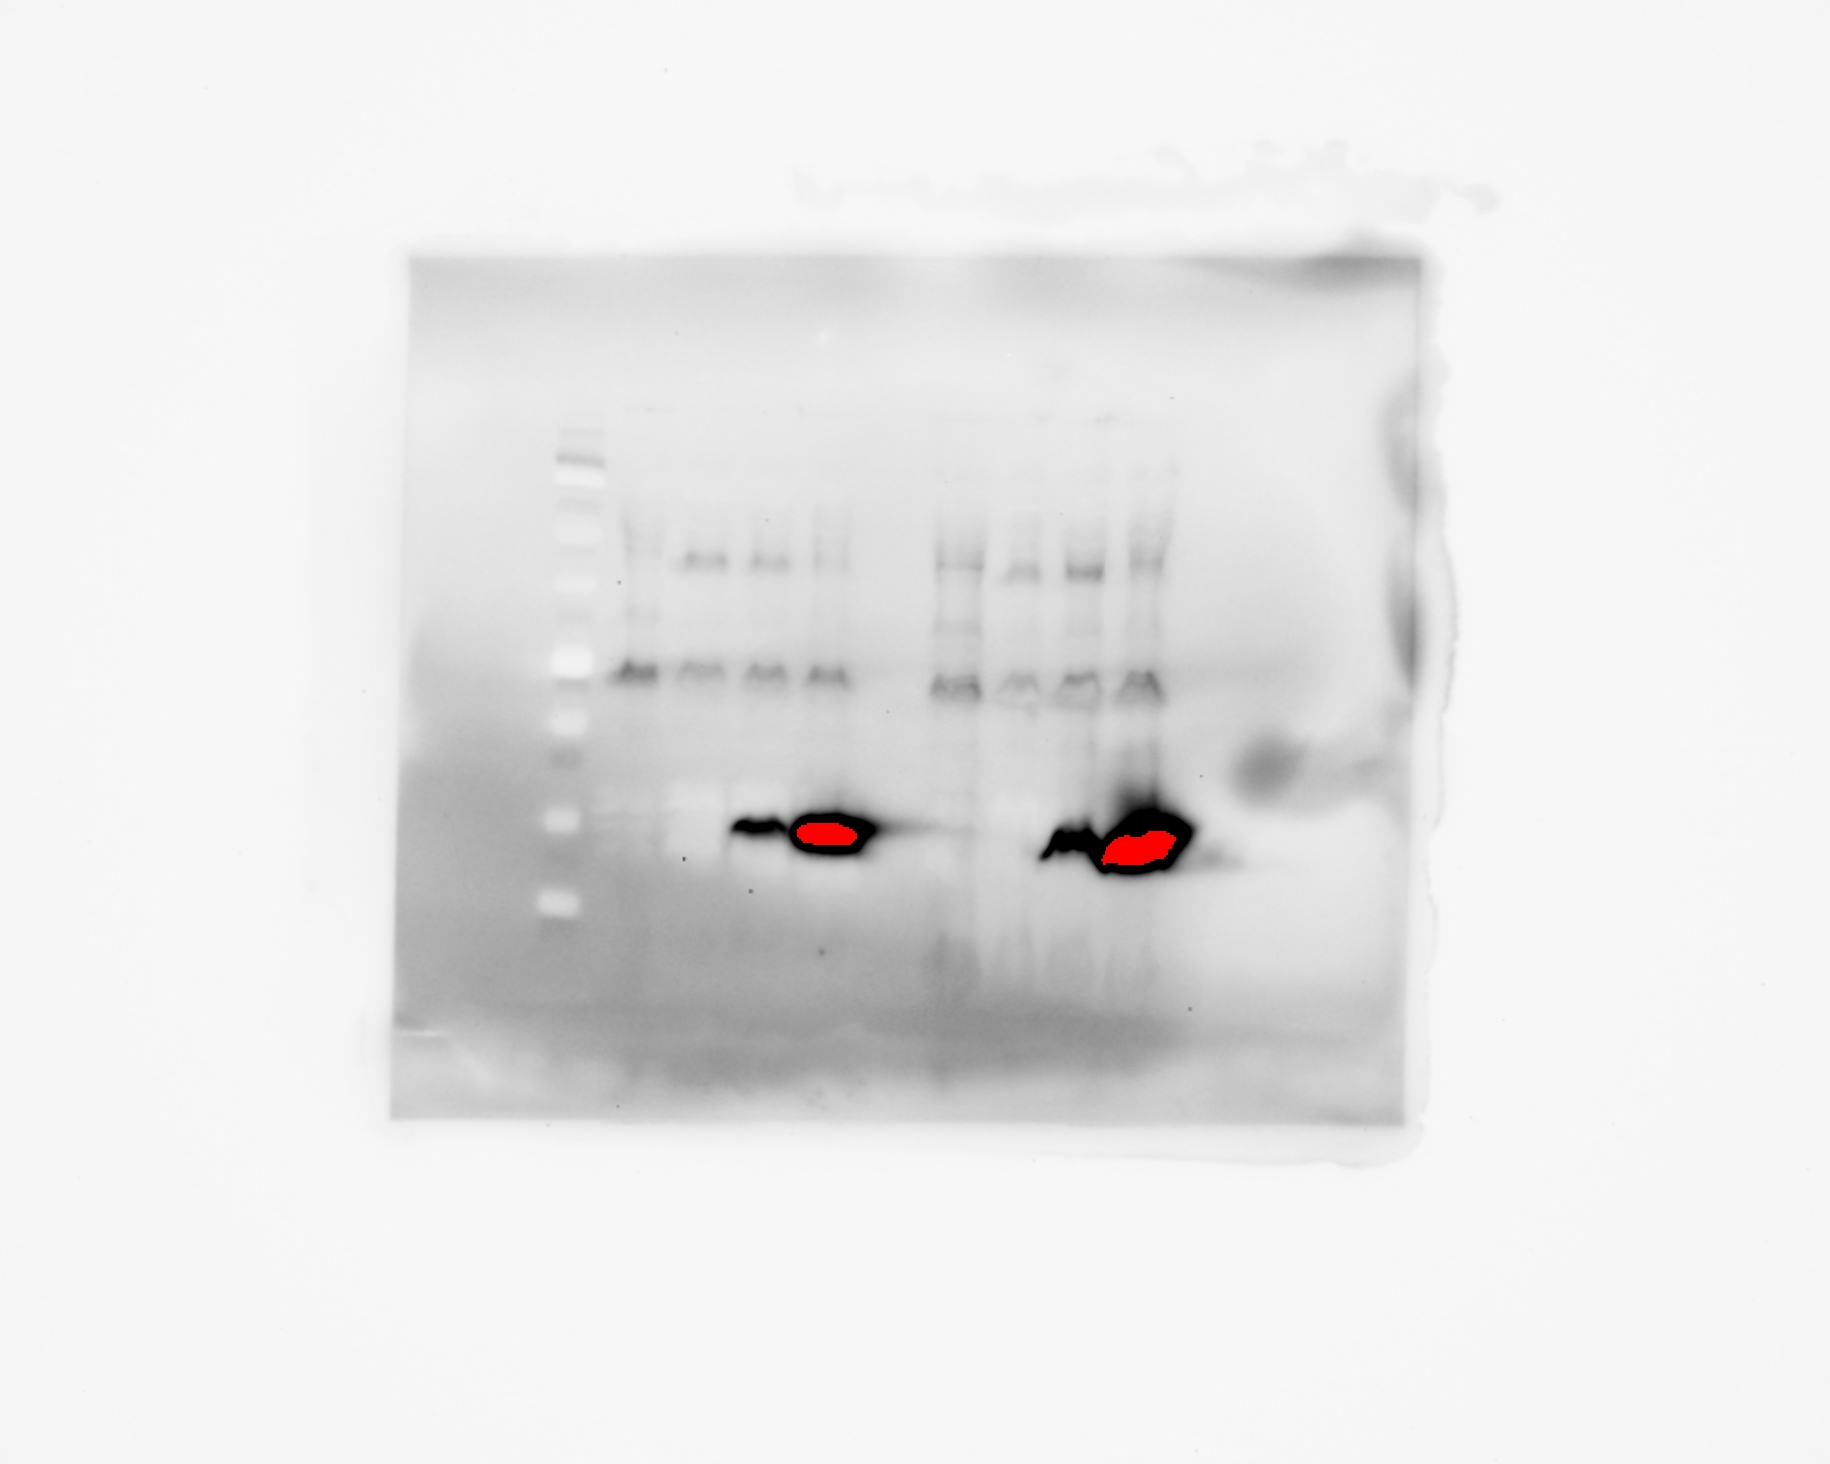
Western blot to detect MelBSt expression when co-expressing with Nb725 or Nb725_4 (unlabelled).
Membranes were prepared from E. coli DW2 cells that were transformed with two compatible plasmids derived from pACYC and pCS19 encoding MelBSt and Nb725_4 or Nb725, respectively, and used for the [3H]melibiose active transport assay. After protein concentration determination, 50 μg of total membrane proteins of each sample was analyzed by SDS-15%PAGE and western blot using anti-His tag antibody (HisProbe-HRP Conjugate) as described in the Materials and methods. The western blot result was imaged by the ChemiDoc MP Imaging System (Bio-Rad). MelBSt protein expression presented as the inset in Figure 1c. The bands migrating near 25 kDa are non-specific and also presented in the membranes with no MelB nor Nb.
- https://cdn.elifesciences.org/articles/92462/elife-92462-fig1-data3-v1.jpg
-
Figure 1—source data 4
Western blot to detect MelBSt expression when co-expressing with Nb725 or Nb725_4 (labelled).
Membranes were prepared from E. coli DW2 cells that were transformed with two compatible plasmids derived from pACYC and pCS19 encoding MelBSt and Nb725_4 or Nb725, respectively, and used for the [3H]melibiose active transport assay. After protein concentration determination, 50 μg of total membrane proteins of each sample was analyzed by SDS-15%PAGE and western blot using anti-His tag antibody (HisProbe-HRP Conjugate) as described in the Materials and methods. The western blot result was imaged by the ChemiDoc MP Imaging System (Bio-Rad). MelBSt protein expression presented as the inset in Figure 1c is highlighted by the box. The bands migrating near 25 kDa are non-specific and also presented in the membranes with no MelB nor Nb.
- https://cdn.elifesciences.org/articles/92462/elife-92462-fig1-data4-v1.pdf
Figure 1—figure supplement 1
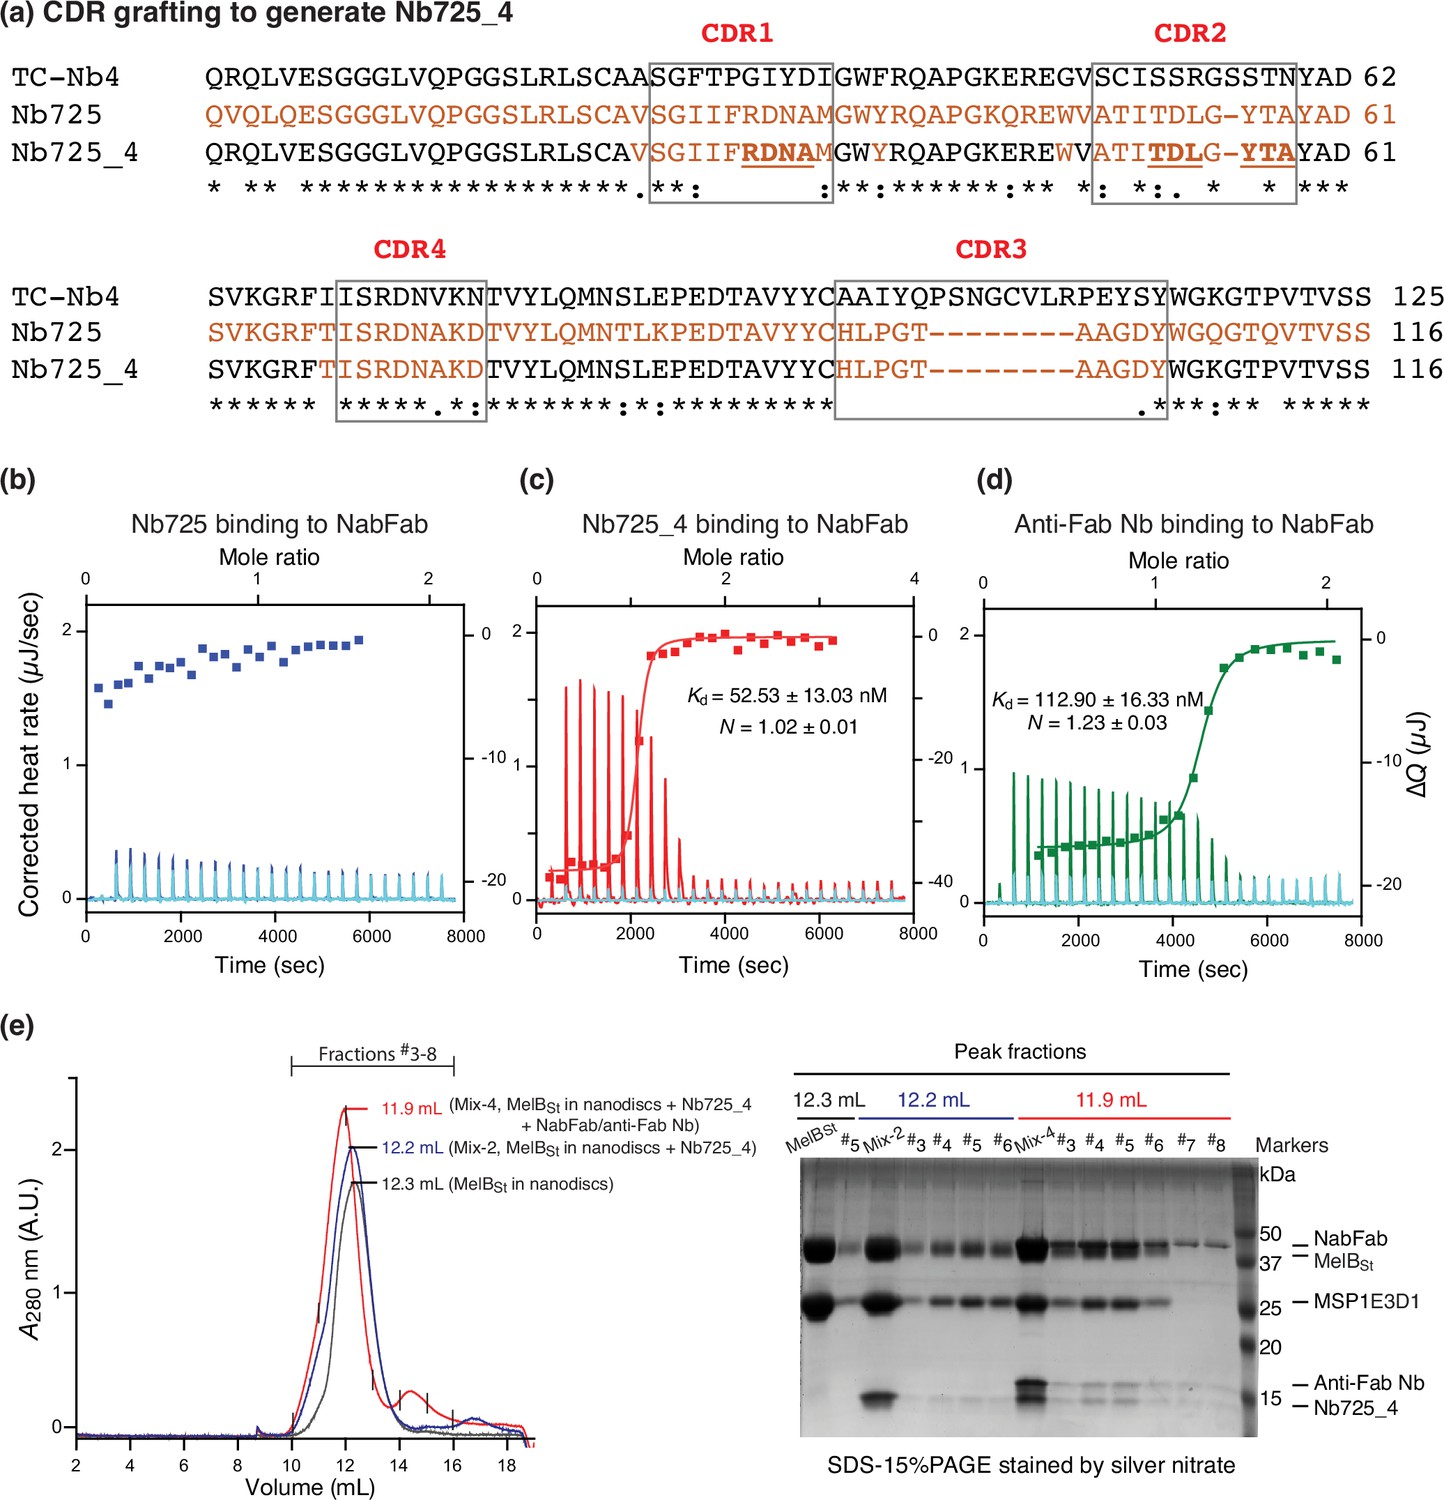
Hybrid Nb725_4 generated by complementarity-determining region (CDR) grafting.
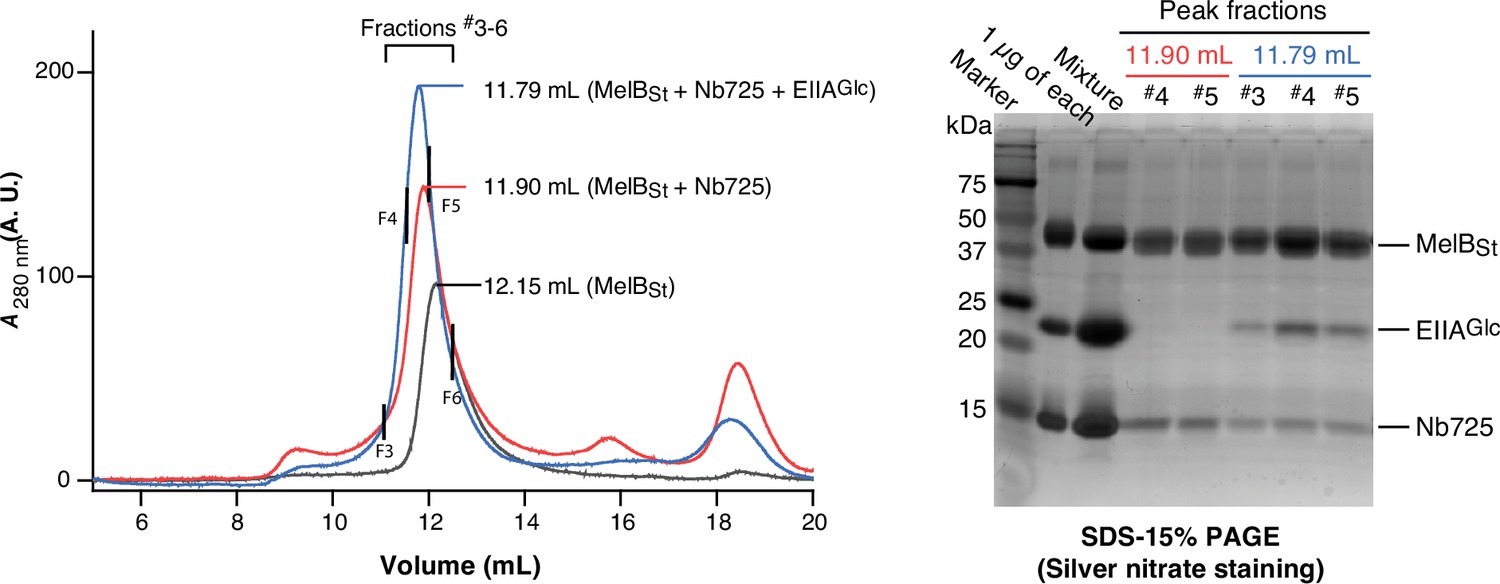
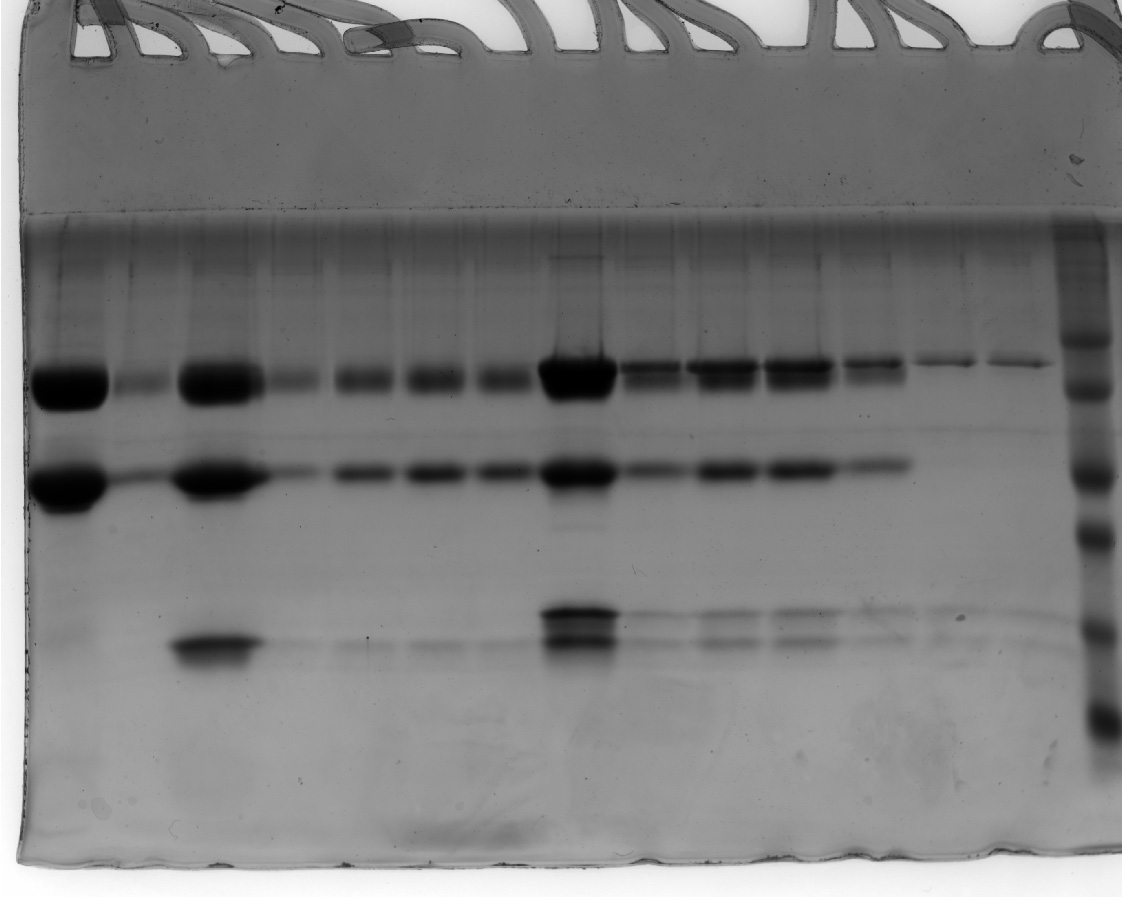
(a) All CDR regions are indicated by boxes. The sequences of TC-Nb4 and MelBSt Nb725 are colored in black and red, respectively. The sequence of hybrid Nb725_4 is colored in black and red from the two parents’ nanobodies (Nbs). The Nb725_4 binding residues are highlighted in underlined bold. (b–d) Isothermal titration calorimetry (ITC) measurements of Nbs binding to the NabFab. The Kd values for Nb725_4 and the anti-Fab Nb binding to NabFab are presented as the mean ± SEM and the number of tests = 2. N, the binding stoichiometry number. The interaction of the parent Nb725 to the NabFab was too weak to be fit accurately. (e) Isolation of the MelBSt/Nb725_4/NabFab/anti-Fab Nb complex. MelBSt proteins were reconstituted into the lipid nanodiscs with the membrane scaffold protein 1E3D1 (MSP1E3D1). Sample containing MelBSt (black curve), MelBSt with Nb725_4 (blue curve), or with Nb725_4, NabFab, and anti-Fab Nb (red curve) was prepared prior to analysis by gel filtration chromatography in a combination of the SDS-15%PAGE. The mix-2 sample, MelBSt with Nb725_4, blue color; mix-4 sample, MelBSt with Nb725_4, NabFab and anti-Fab Nb, red color. The mixture of each protein in the loading buffer does not contain a reducing agent.
-
Figure 1—figure supplement 1—source data 1
Western blot shown in Figure 1—figure supplement 1e (unlabelled).
Fractions collected from gel chromatography were analyzed by SDS-15% PAGE and stained by silver nitrate.
- https://cdn.elifesciences.org/articles/92462/elife-92462-fig1-figsupp1-data1-v1.jpg
-
Figure 1—figure supplement 1—source data 2
Western blot shown in Figure 1—figure supplement 1e (labelled).
Fractions collected from gel chromatography were analyzed by SDS-15% PAGE and stained by silver nitrate.
- https://cdn.elifesciences.org/articles/92462/elife-92462-fig1-figsupp1-data2-v1.pdf
Figure 1—figure supplement 2
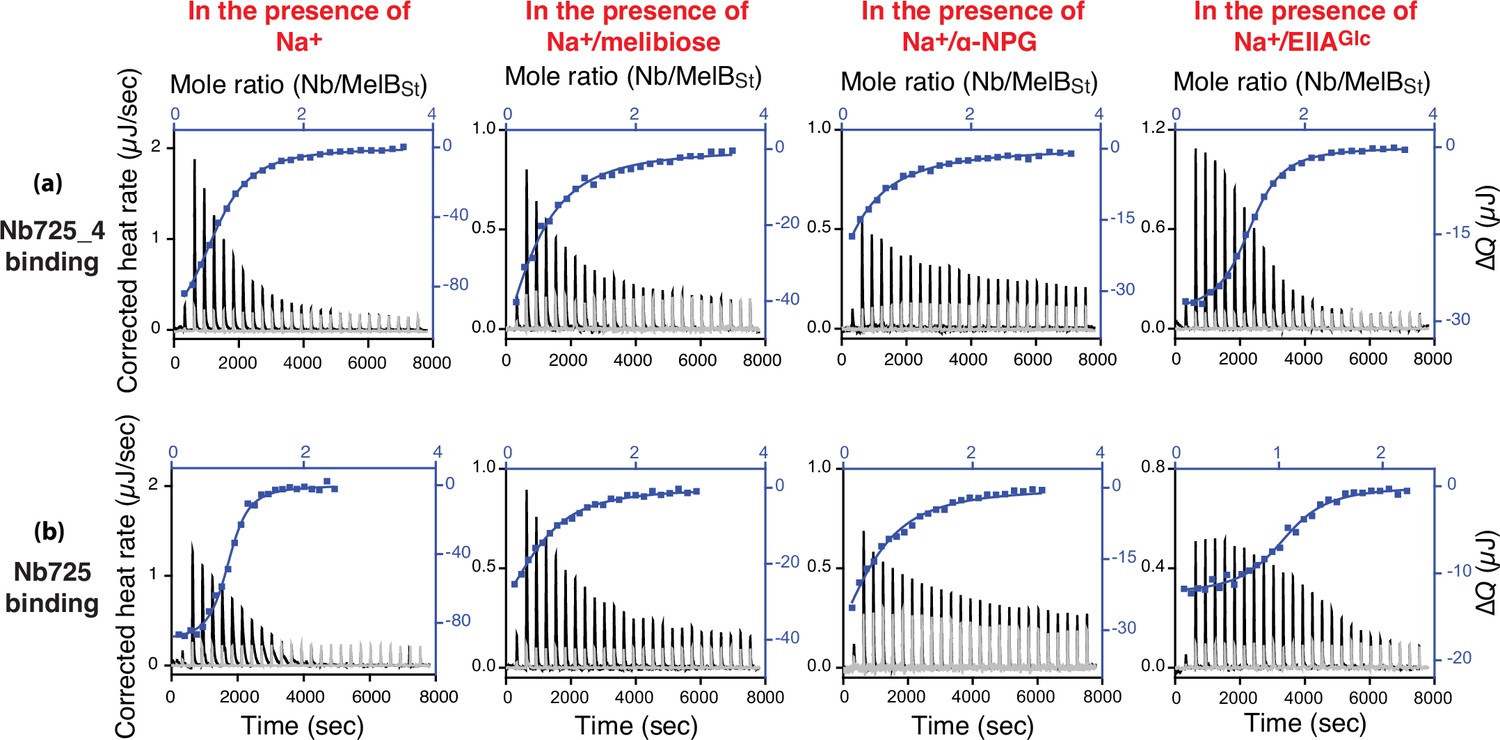
Ligand effects on the nanobodies (Nbs) binding.
All isothermal titration calorimetry (ITC) binding measurements at 25°C and curve fitting are described in ‘Materials and methods’. The purified Nb725_4, Nb725, MelBSt, and EIIAGlc protein samples were dialyzed against an identical buffer containing 100 mM NaCl. MelBSt at a concentration of 35 μM was placed in the sample cells and titrated with Nb725_4 or Nb725, respectively. The thermograms of each titration (black) and the corresponding control by titrating Nbs into the protein-free buffer (light gray) are plotted by the bottom/left (x/y) axes. The binding isotherm and fitting using a one-site independent-binding model presented by top/right (x/y) axes. (a) Binding of Nb725_4 to the Na+-bound MelBSt in the absence or presence of melibiose (80 mM), α-NPG (5 mM), or EIIAGlc (2:1 ratio to MelBSt). (b) Binding of Nb725 to the Na+-bound MelBSt in the absence or presence of melibiose (80 mM), α-NPG (5 mM), or EIIAGlc (2:1 molar ratio to MelBSt).
Figure 1—figure supplement 3
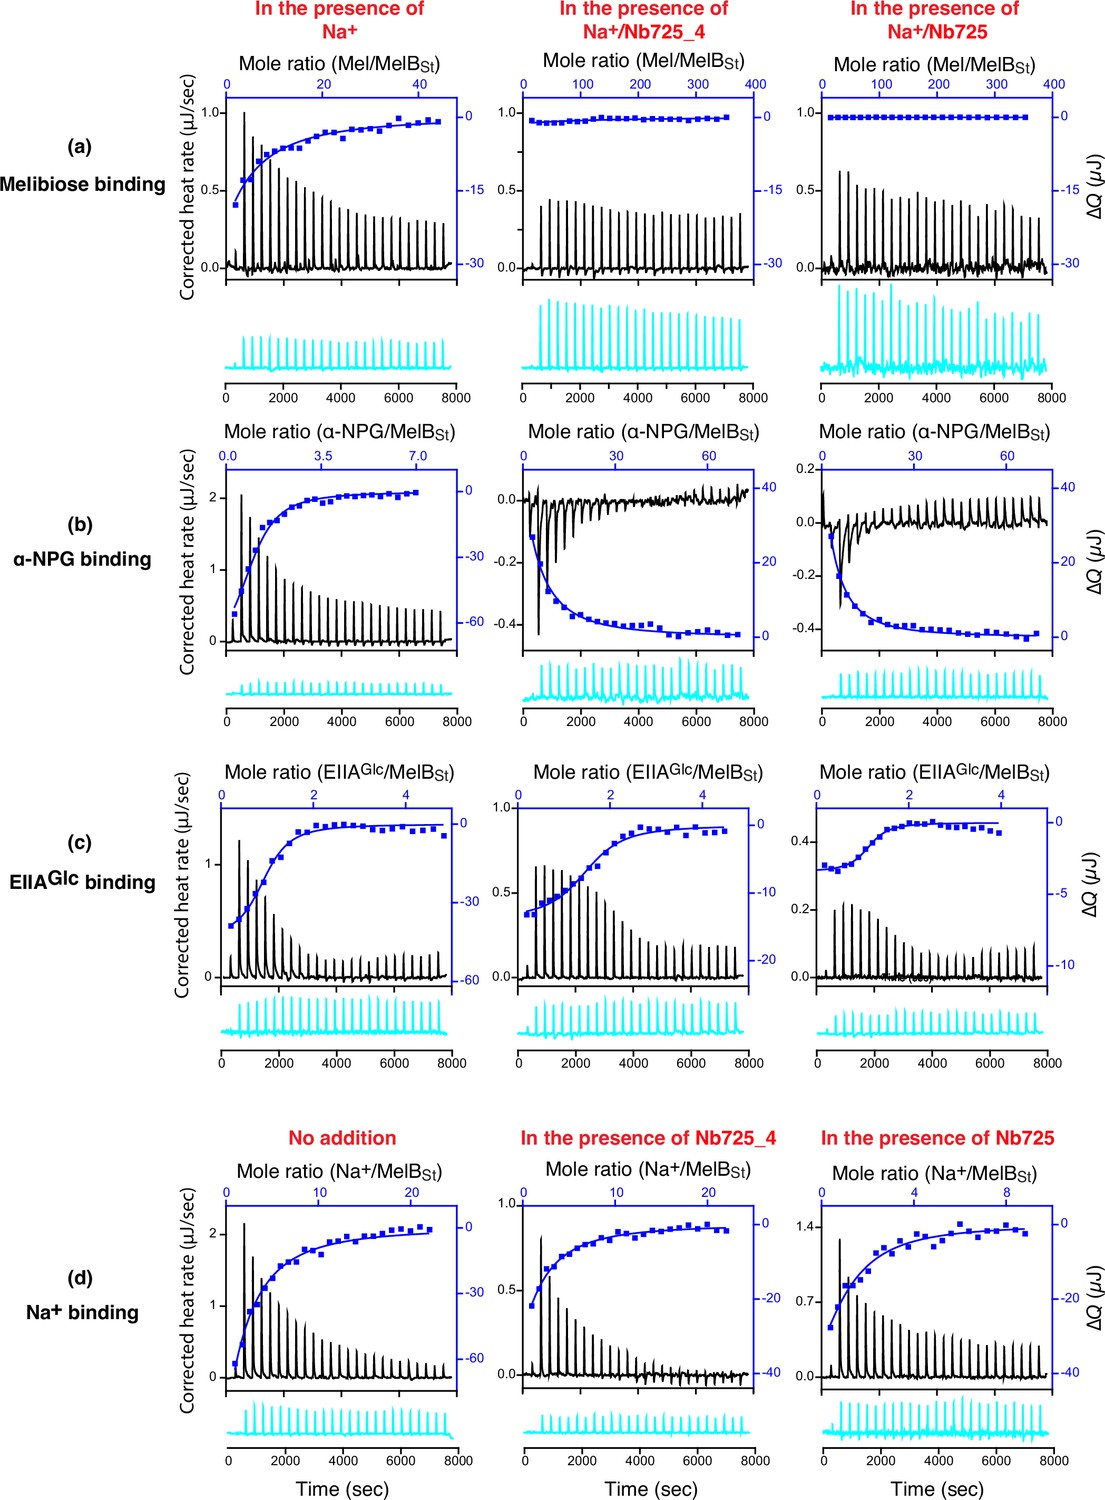
Nanobody (Nb) effects on substrate/ligand binding.
All isothermal titration calorimetry (ITC) binding measurements at 25°C and curve fitting are described in ‘Materials and methods’. The binding measurements of melibiose, α-NPG, and EIIAGlc were conducted in buffer, 20 mM Tris–HCl, pH 7.5, 100 mM NaCl, 0.01% DDM, and 10% glycerol. The Na+ binding measurements were conducted in 20 mM Tris–HCl, pH 7.5, 100 mM choline-Cl, 0.01% DDM, and 10% glycerol as described in Hariharan and Guan, 2017. All proteins and ligand solutions were buffer-matched. MelBSt complexed with Nb725_4 or Nb725 were prepared by mixing them at a 1:2 molar ratio. The thermograms of each titration (black) are plotted by bottom/left (x/y) axes and the binding isotherm and fitting using one-site independent-binding model presented by top/right (x/y) axes. The corresponding controls by titrating each ligand into the protein-free buffer (cyan) are presented below at an identical scale. (a) Titration of melibiose to MelBSt or a given MelBSt/Nb complex at 80 μM for MelBSt. (b) Titration of α-NPG binding to MelBSt a given MelBSt/Nb complex at 50 μM for MelBSt. (c) Titration of Na+ to MelBSt or a given MelBSt/Nb complex at 80 μM for MelBSt. (d) Titration of EIIAGlc to MelBSt or a given MelBSt/Nb complex at 50 μM for MelBSt. For the titration into the MelBSt/Nb complexes, melibiose and α-NPG in the assay solutions were increased from 10 mM to 80 mM or 1 mM to 10 mM. The Na+ at 3 mM and EIIAGlc at 0.5 mM were applied for titrations.
Figure 2 with 8 supplements

CryoEM single-particle analysis (cryoEM-SPA).
The samplecoum containing the wild-type MelBSt in lipids nanodiscs, the MelBSt-specific Nb725_4, NabFab, and anti-Fab Nb at 1.5 mg/mL in 20 mM Tris–HCl, pH 7.5, and 150 mM NaCl was prepared as described in ‘Materials and methods’. Images were collected using Titan Krios TEM with a K3 detector of S2C2, Stanford, CA. The particle reconstructions and modeling were performed as described in ‘Materials and methods’. The final volume did not include the anti-Fab Nb during Local Refinement due to relatively poor densities. (a) The raw image after motion correction. (b) Representative 2D classes generated by CryoSPARC program. MelBSt in nanodiscs, Nb725_4, NabFab, and anti-Fab Nb can be easily recognized. (c) Golden standard Fourier shell correlation (GSFSC) resolution was calculated by cryoSPARC Validation (FSC) using two half maps generated by the CryoSPARC Local Refinement program. The number of particles used for the volume reconstruction is presented. (d) Particle distribution of orientations over azimuth and elevation angles generated by CryoSPARC Local Refinement program. (e, f) The structure of MelBSt/Nb725_4/NaFab complex. The volume (e) and cartoon representation (f) were colored by polypeptide chains as indicated. Nanodiscs were transparent and colored in light gray. Sphere and sticks in panel (f) highlighted Na+ and its ligands.
Figure 2—figure supplement 1
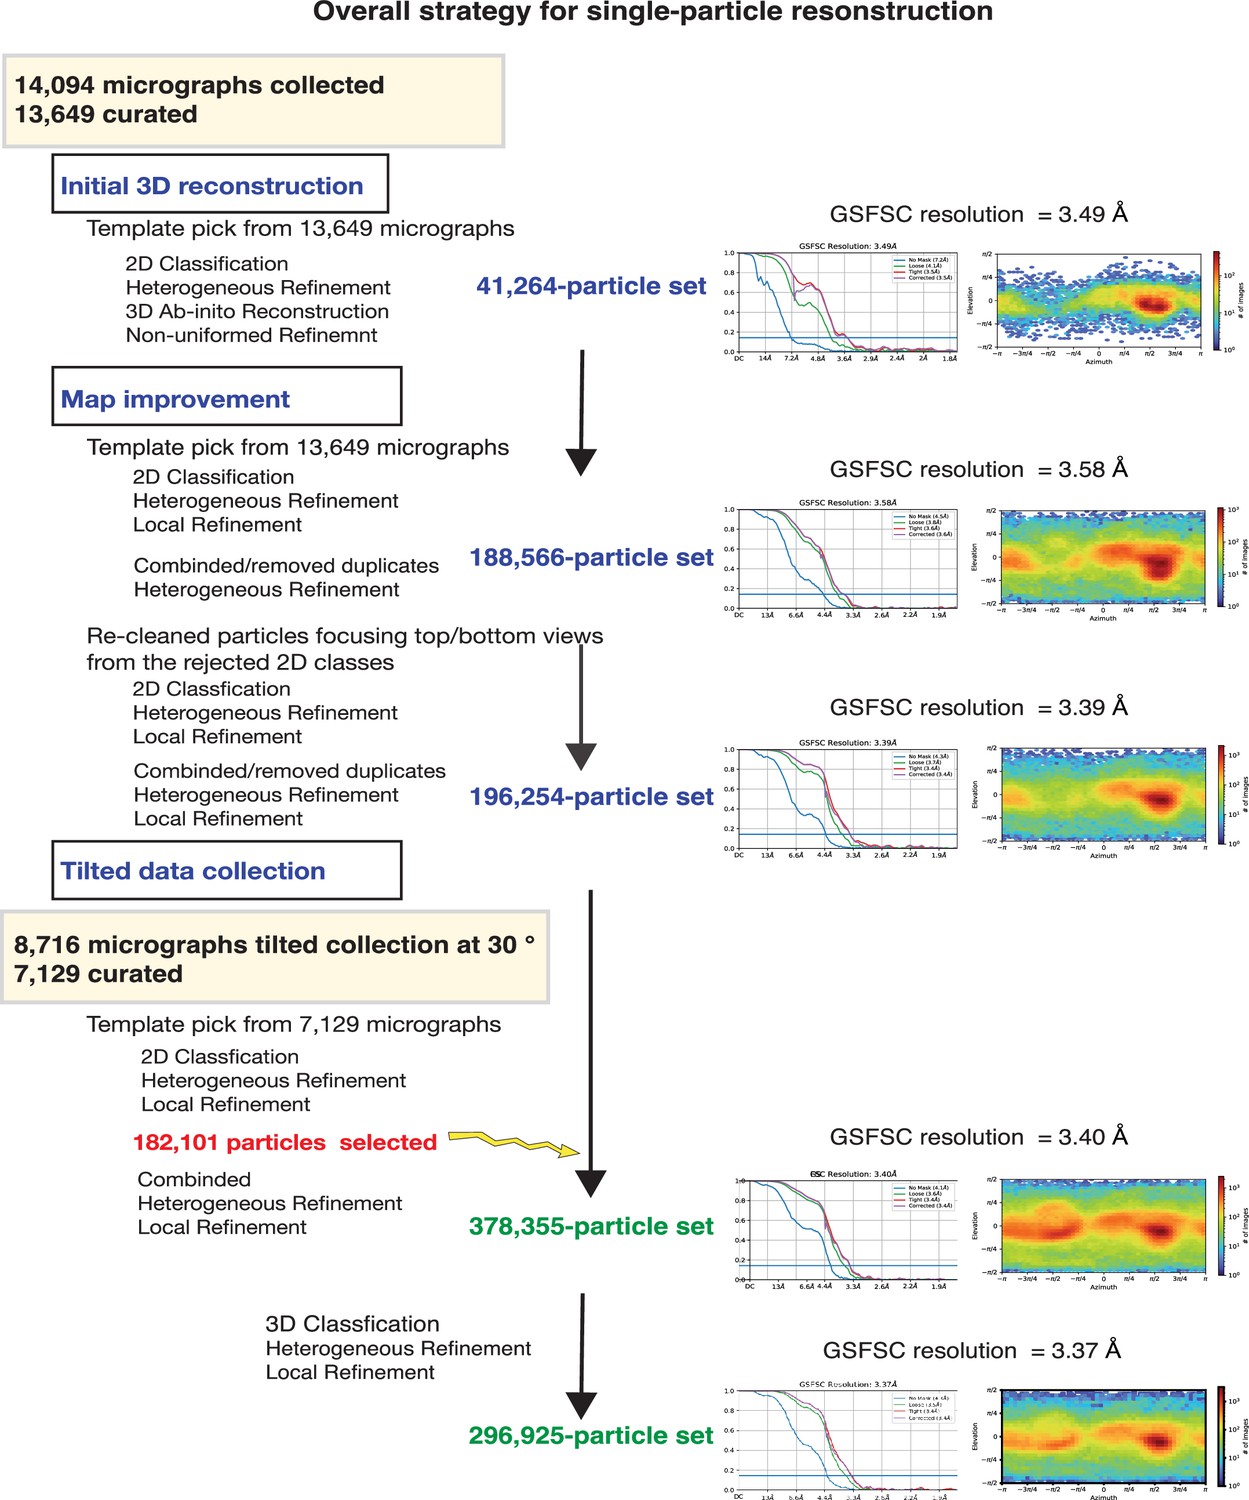
CryoEM data process.
The strategy for the reconstruction and refinement is outlined.
Figure 2—figure supplement 2

Initial 3D reconstruction.
Data were processed in CryoSPARC program.
Figure 2—figure supplement 3
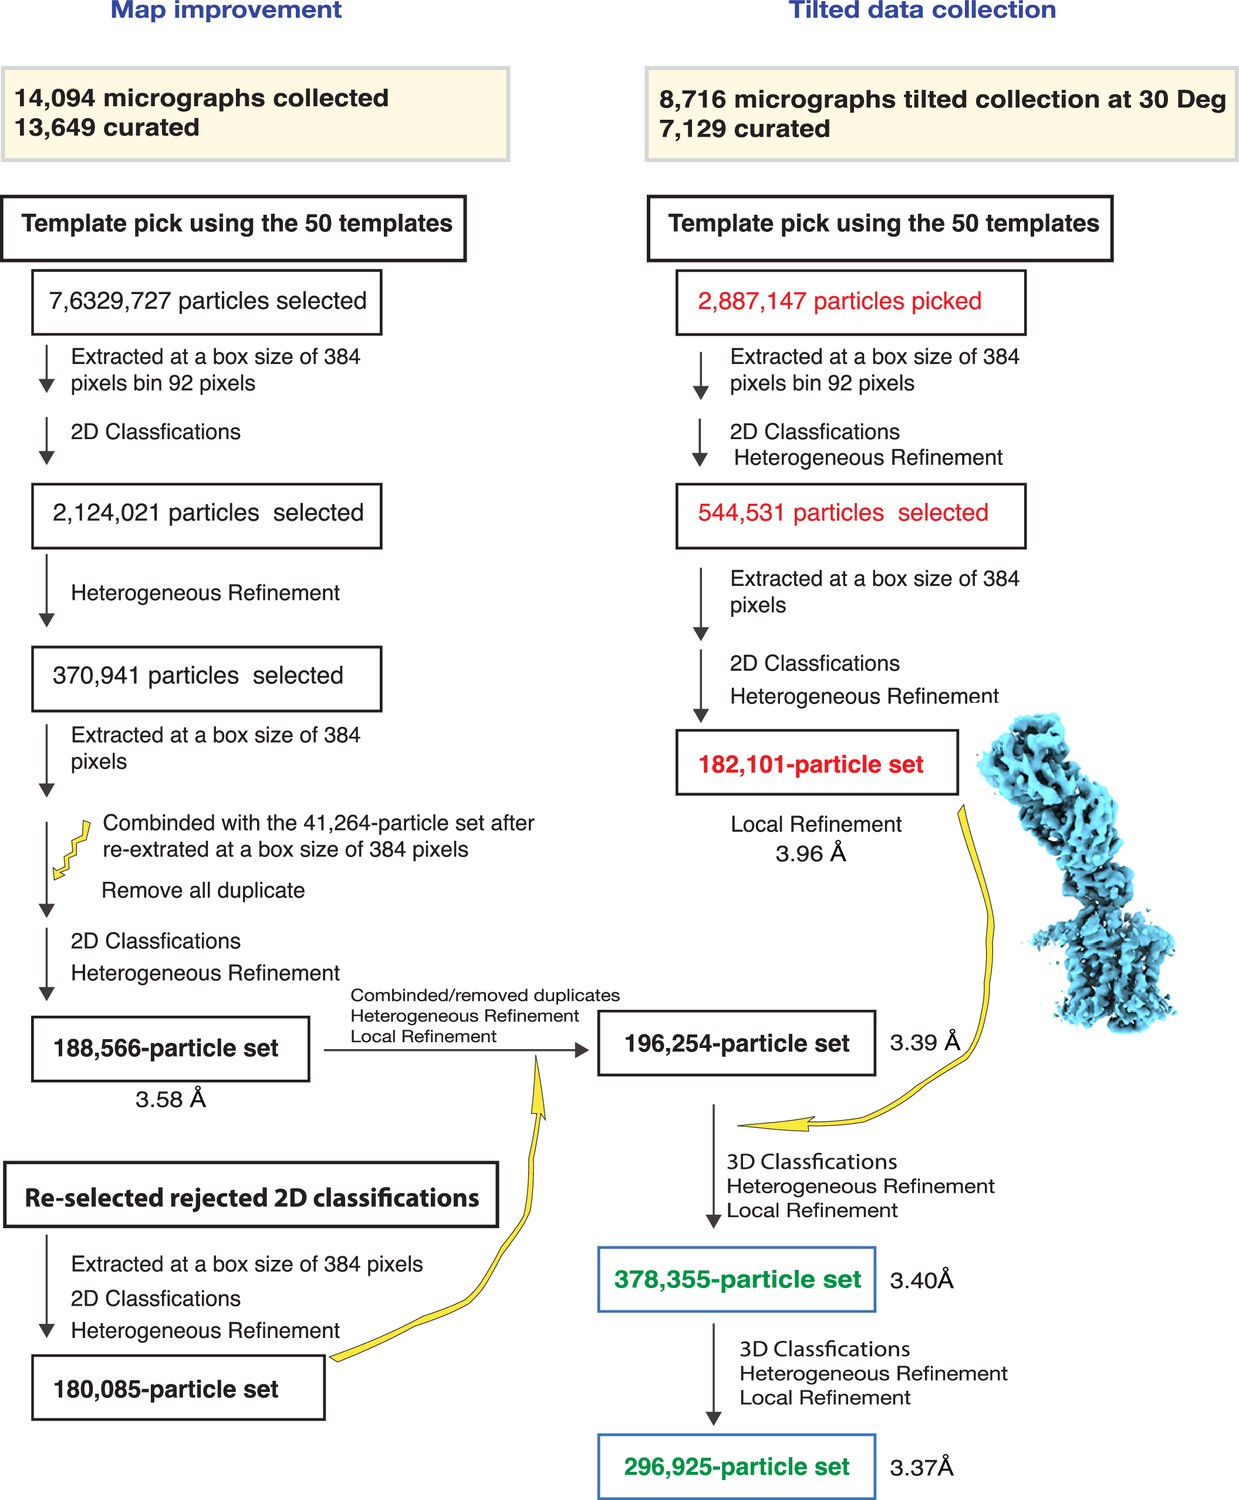
Refinement and map improvement.
A total number of 296,925 polished particles from both non-tilted and 30° tilted data acquisition were used to reconstruct a 3.37 Å volume using Local Refinement.
Figure 2—figure supplement 4
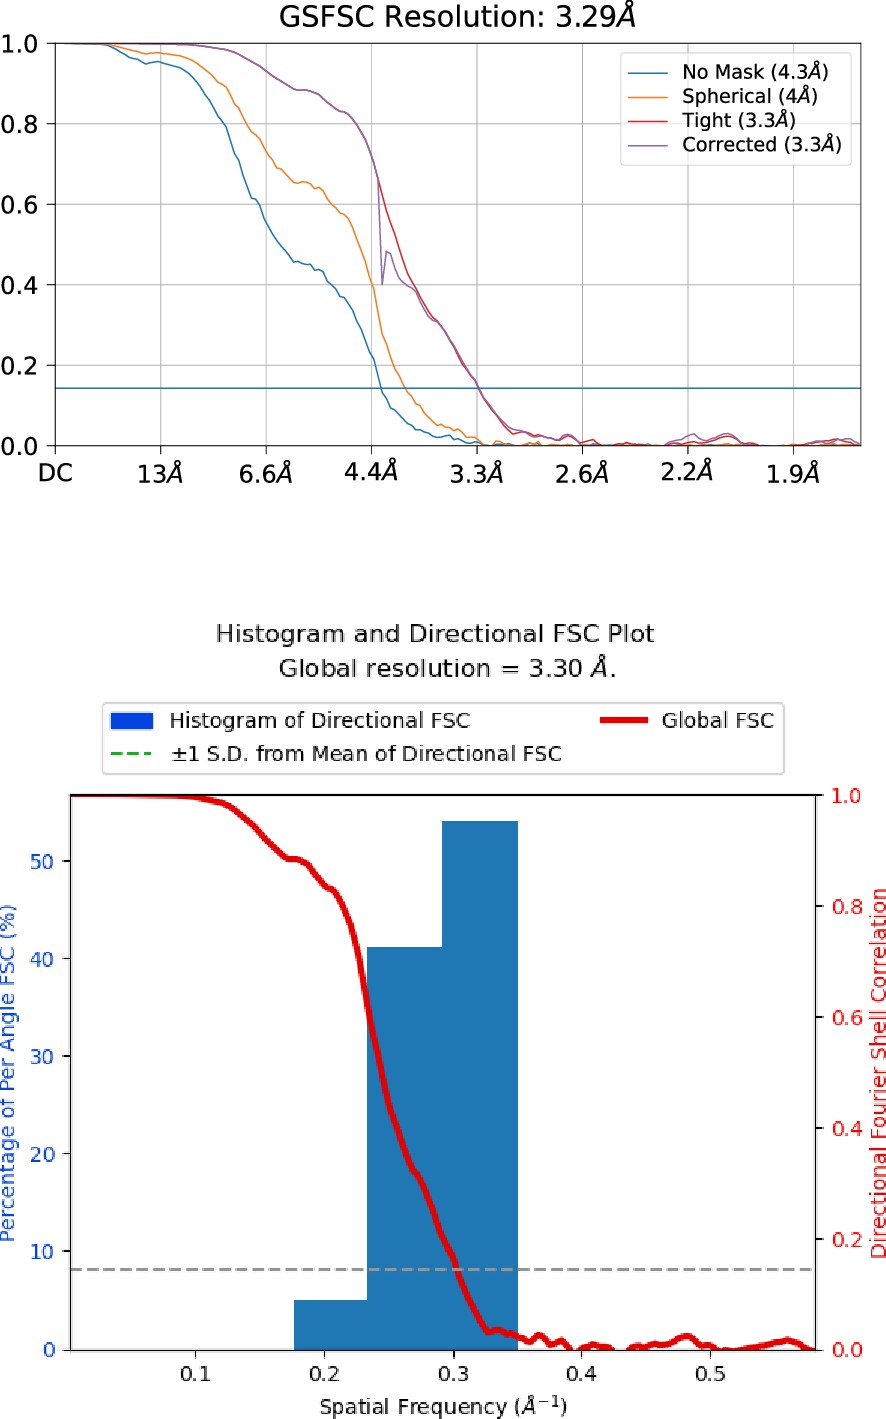
Golden standard Fourier shell correlation (GSFSC) resolution and 3dFSC.
The resolution of map and particle orientation distribution was assessed by cryoSPARC proteins using default setting parameters.
Figure 2—figure supplement 5
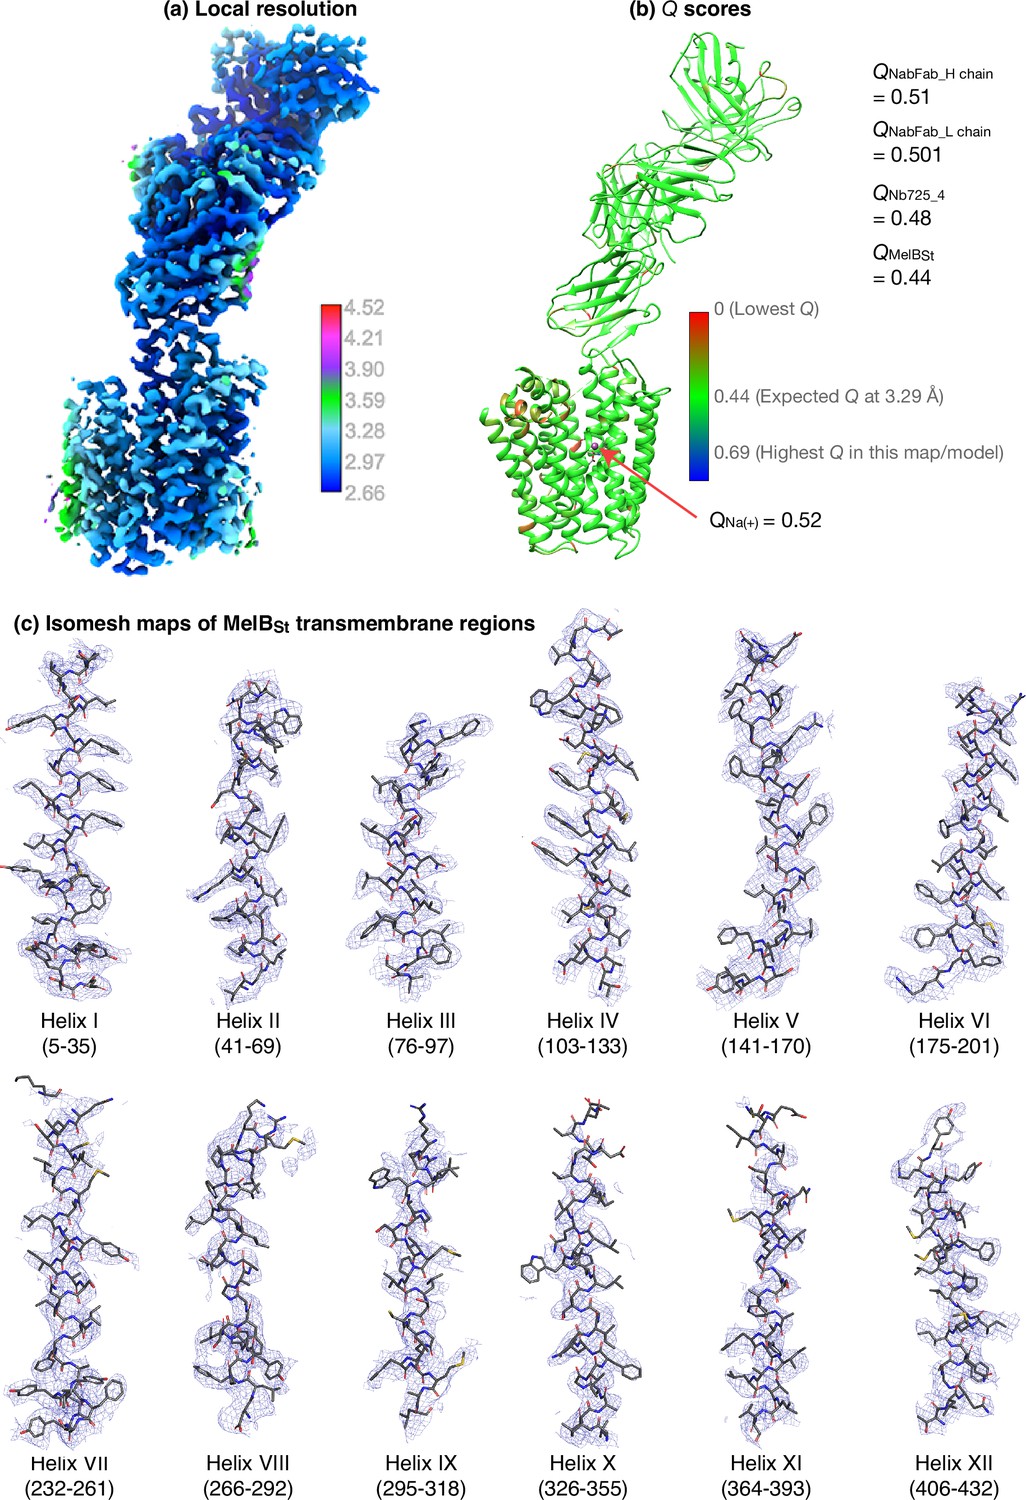
Evaluation of map and models.
(a) The local resolution. The map half_A and half_B files produced by the cryoSPARC Local Refinement program were used to calculate the Local Resolution Map by Phenix and displayed by UCSF ChimeraX using the defined color key. (b) Q scores. The auto-sharpened map generated by Phenix under the default setting was used as the main map for the model building and also for Q-score calculations by MapQ program in UCSF Chimera against the final structure at a sigma level of 0.4. The Q scores for each residue were color-painted on the structure using the given color key. The bound Na+ was shown as a sphere. The expected score at a resolution of 3.29 Å is 0.44. (c) Density mapped on the MelBSt transmembrane helices. The auto-sharped map by Phenix was used to calculate the isomesh maps for each transmembrane helix at a sigma level of 10 and carving of 1.8.
Figure 2—figure supplement 6
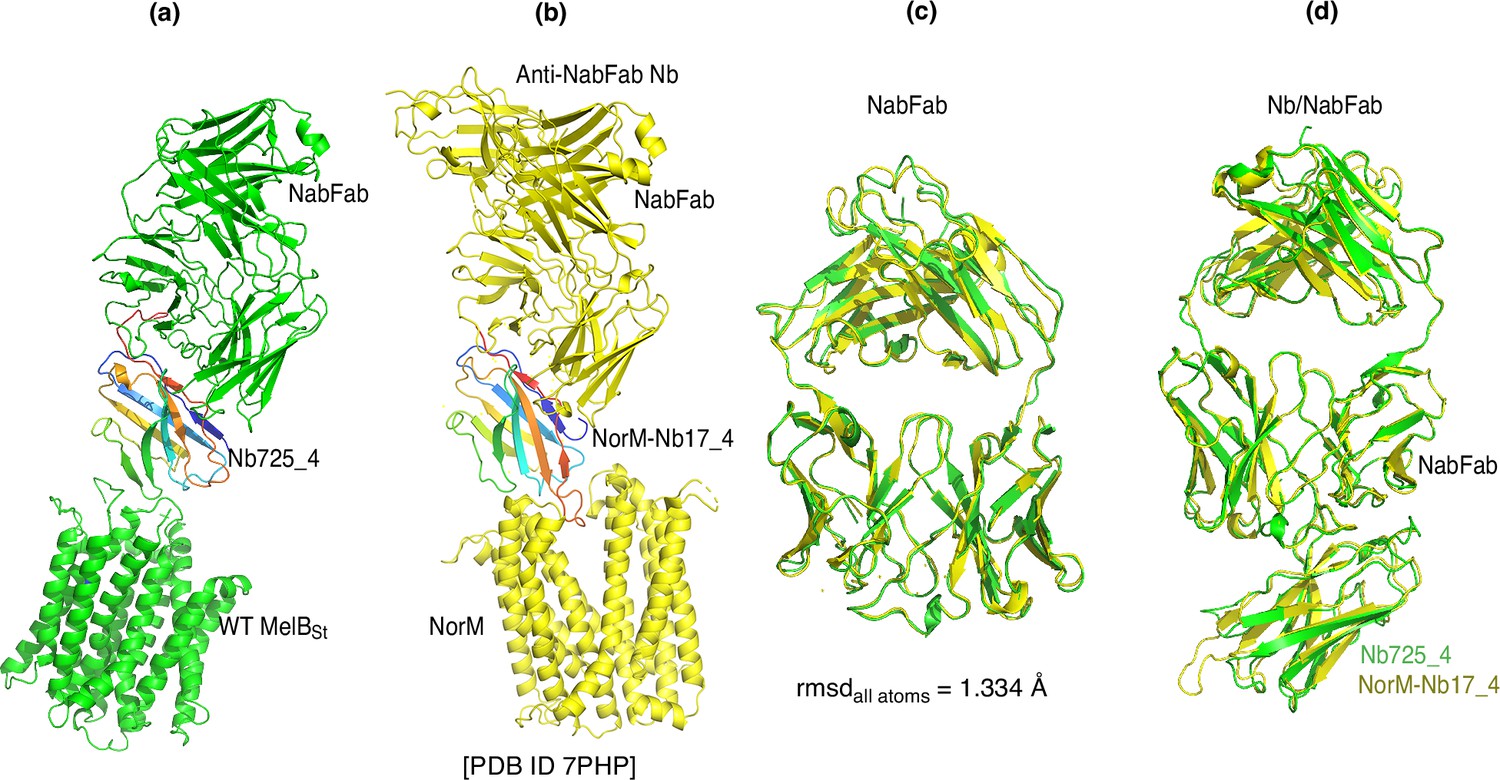
NabFab comparison.
(a, b) NorM complexed with anti-NorM Nb17_4/NabFab/anti-NabFab Nb (PDB ID 7PHP) was superimposed with MelBSt complexed with Nb725-4 and NabFab based on the H chains of NabFab in the two structures. Nb725-4 and NorM-Nb17_4 were colored in the rainbow. (c) The NabFab in the NorM complex (PDB ID 7PHP) was superimposed with that in MelBSt complex. (d) The NabFab/Nb in the NorM complex was superimposed with that in MelBSt complex based on their H chains. Green, MelBSt complex; yellow, NorM complex.
Figure 2—figure supplement 7
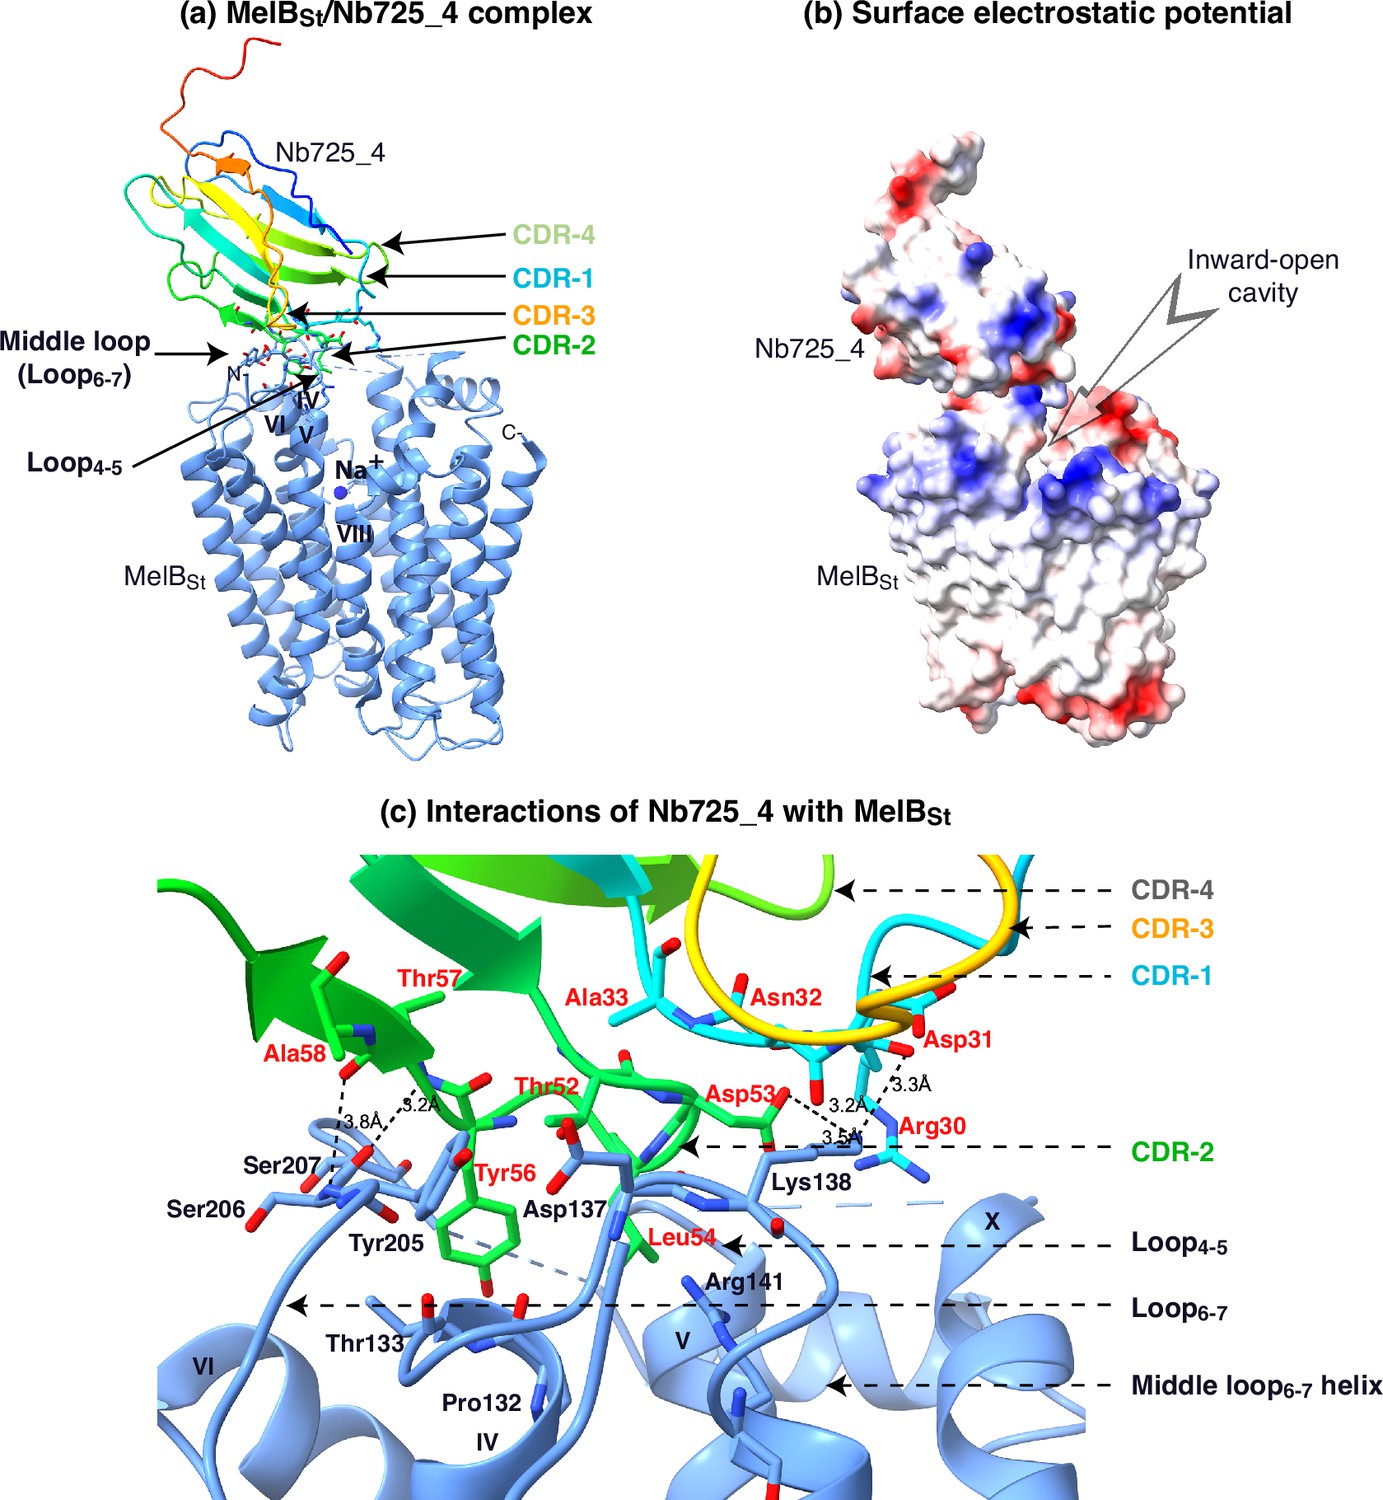
Interactions of Nb725m_4 and MelBSt.
(a) Nb725_4 bound to the N-terminal domain of MelBSt. The contact between Nb CDR-1 and CDR-2 and MelBSt loop4-5, and loop6-7 contributed to the major interactions. (b) The surface electro potential map was generated in the UCSF Chimera X program. The inward-open cavity is indicated. (c) The binding interface. All residues with a buried solvent-accessible surface area > 15 Å (Lin et al., 2015) or polar interaction at a distance <3.5 Å were selected by the UCSF Chimera X program are highlighted in sticks. The salt-bridging and hydrogen-bonding interactions are highlighted by the dashed line. The nanobody (Nb) complementarity-determining region (CDRs) and epitope are indicated.
Figure 2—figure supplement 8
Complex of MelBSt with Nb725 and EIIAGlc.
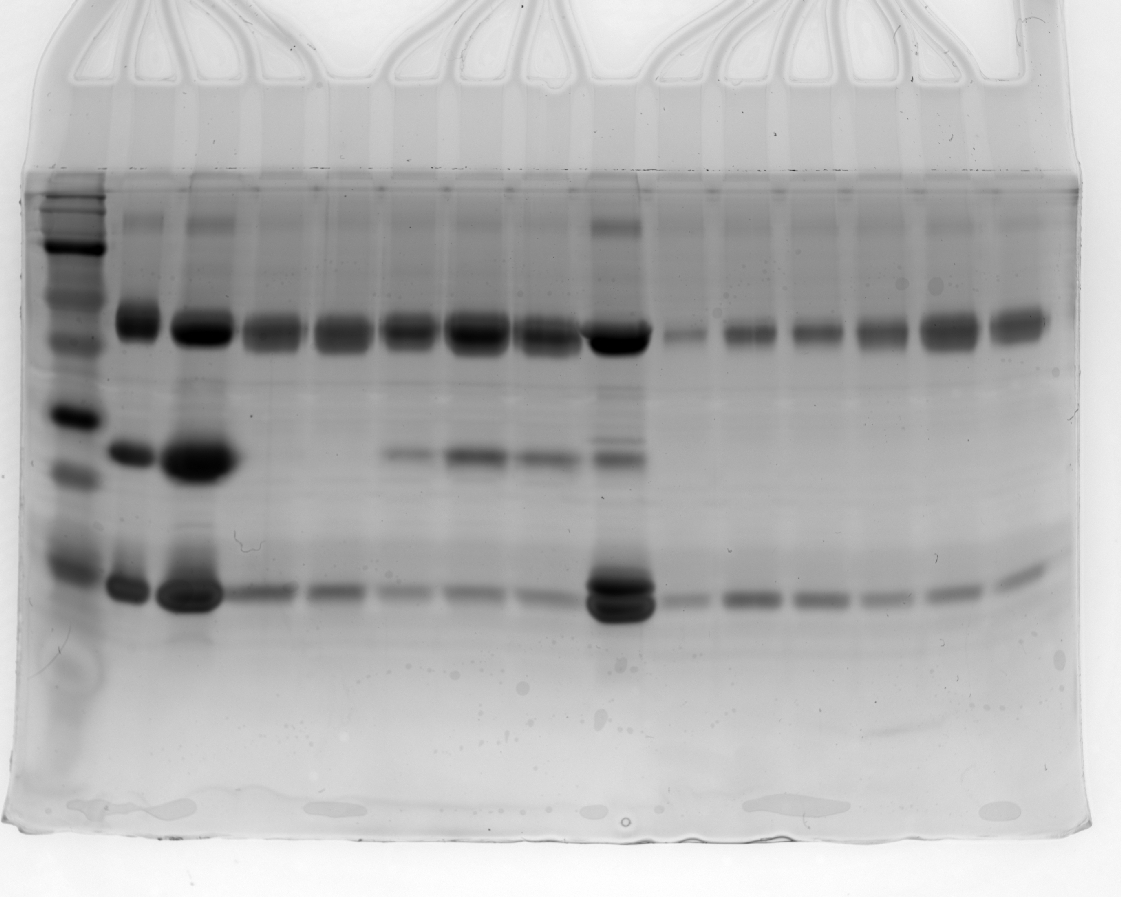
Samples containing MelBSt (black curve), MelBSt with Nb725 (red curve), or with Nb725 and EIIAGlc (blue curve), were prepared and analyzed by gel filtration chromatography in a combination of the SDS-15%PAGE stained by silver nitrate. Mixture, the solution was prepared prior to the gel filtration chromatography containing all three proteins. 1 μg of each protein was loaded as the control.
-
Figure 2—figure supplement 8—source data 1
Western blot shown in Figure 2—figure supplement 8 (unlabelled).
Fractions collected from gel chromatography were analyzed by SDS-15% PAGE and stained by silver nitrate.
- https://cdn.elifesciences.org/articles/92462/elife-92462-fig2-figsupp8-data1-v1.jpg
-
Figure 2—figure supplement 8—source data 2
Western blot shown in Figure 2—figure supplement 8 (labelled).
Fractions collected from gel chromatography were analyzed by SDS-15% PAGE and stained by silver nitrate.
- https://cdn.elifesciences.org/articles/92462/elife-92462-fig2-figsupp8-data2-v1.pdf
Figure 3 with 4 supplements
Na+- and sugar-binding pockets of MelBSt.
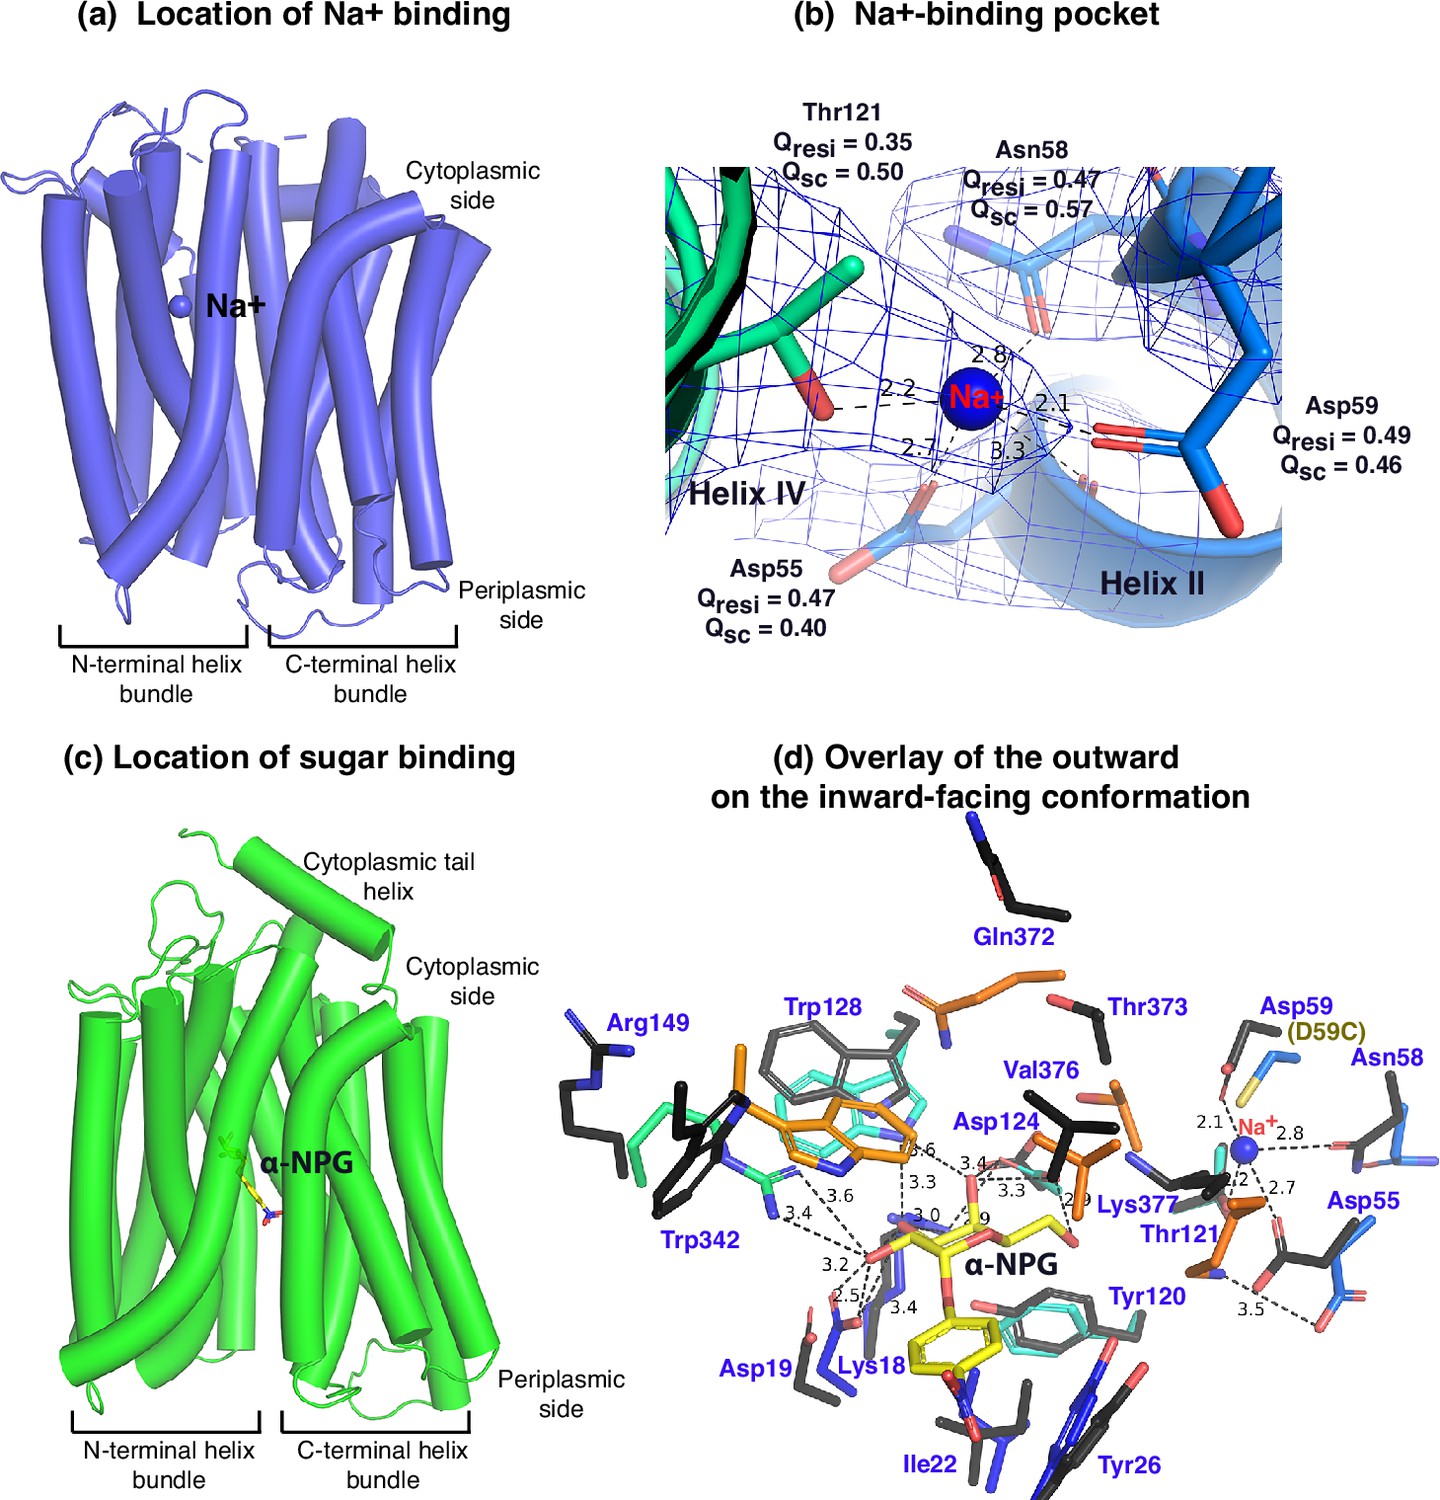
(a) Location of the Na+ binding site. The inward-facing cryoEM structure of the WT MelBSt is displayed in cylindrical helices with the cytoplasmic side on the top. One bound Na+ ion within the N-terminal helix bundle was shown in the blue sphere. (b) Na+-binding pocket. The isomesh map of the inward-facing conformation was created by the Pymol program using level 10 and carve of 1.8. The Na+ coordinates are shown in dashed lines (Å) and interacting residues are shown in sticks. Qres, Q score for residue; Qsc, Q score for side chain. (c) Location of the galactoside-binding stie. The outward-facing x-ray crystal structure of D59C MelBSt mutant is displayed in cylindrical helices with the cytoplasmic side on the top (PDB ID 7L17). One α-nitrophenyl galactoside (α-NPG) molecule is shown in the stick colored in yellow between the N- and C-terminal helix bundles. (d) Superimposed sugar- and cation-binding pockets. The α-NPG-bound outward-facing structure in c was aligned with the inward-facing cryoEM structure based on the 2–200 region. The residues in the sugar- and cation-binding pockets of the inward-facing cryoEM structure are colored in black and labeled in blue. D59C of the α-NPG-bound outward-facing structure is indicated in the parentheses. The α-NPG and Na+ are colored yellow and blue, respectively.
Figure 3—figure supplement 1
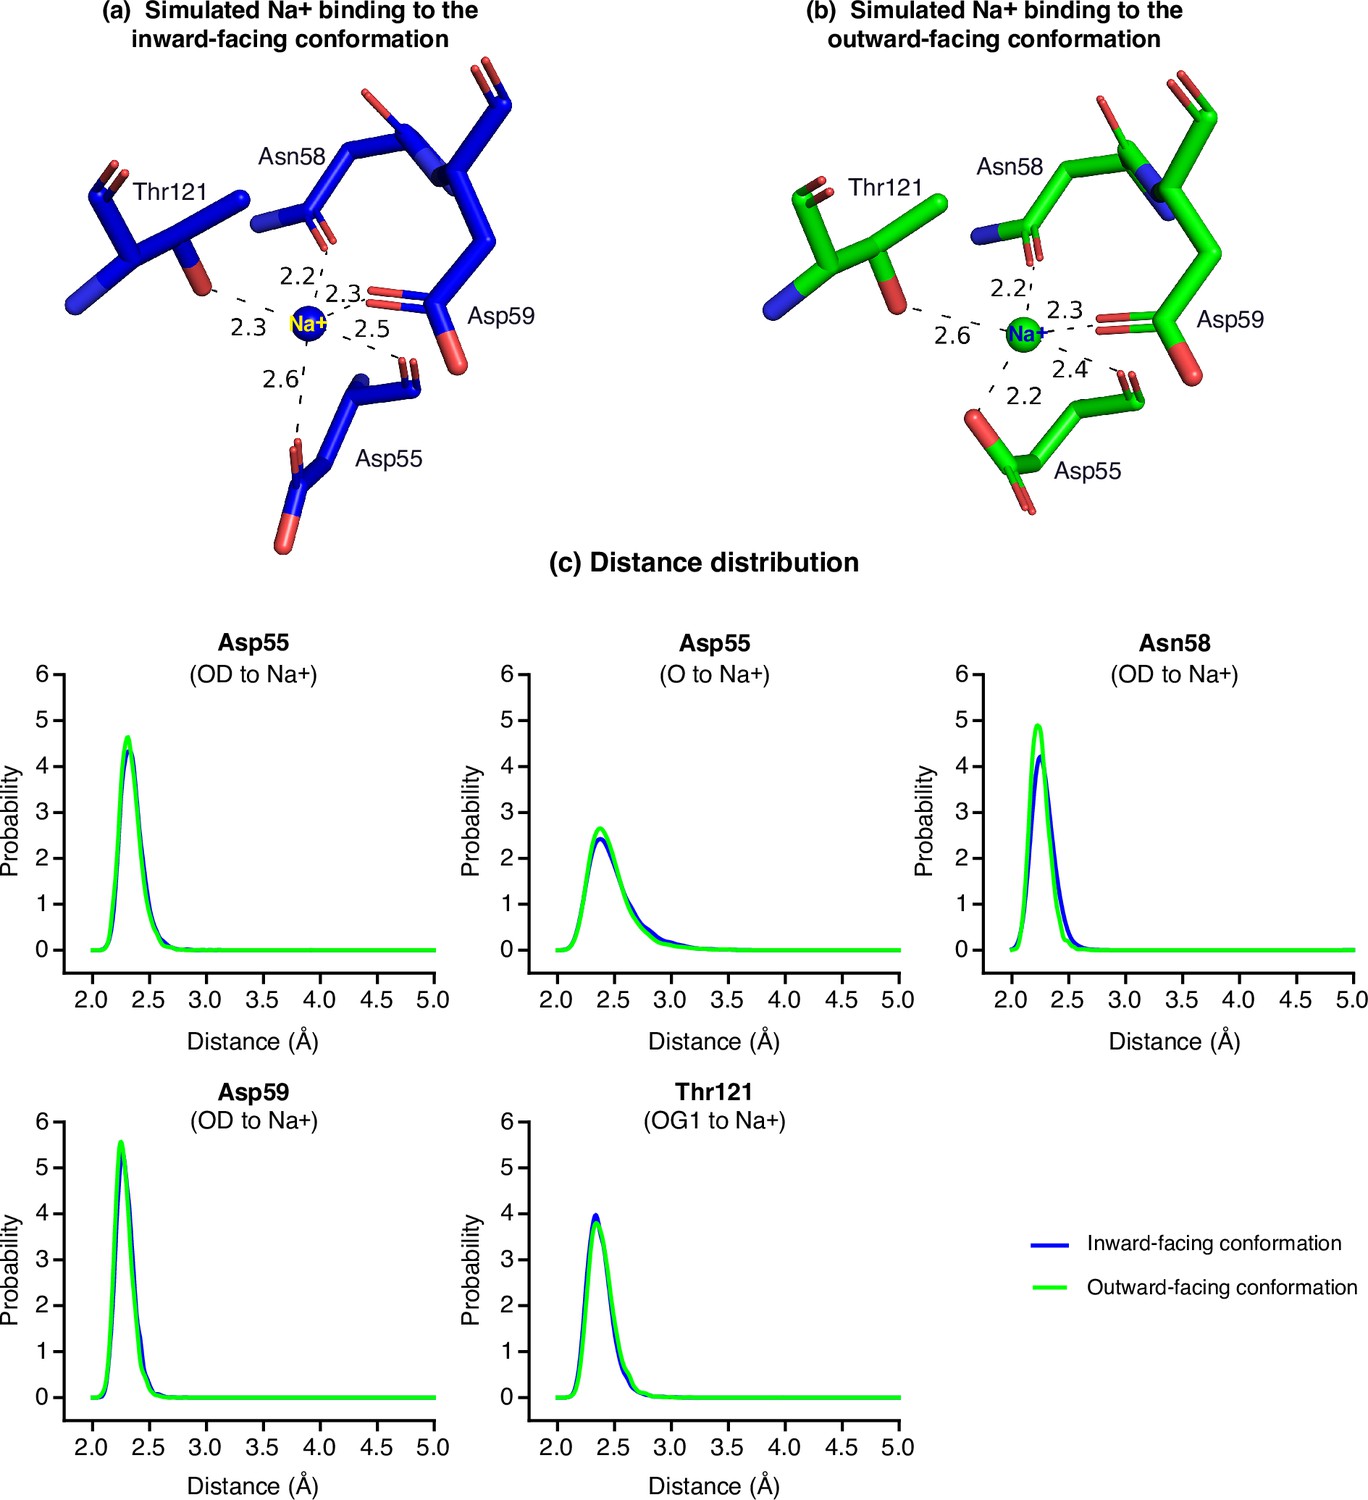
MD simulations of the Na+ binding at both inward- and outward-facing states.
The equilibrated structures of Na+-binding site for the inward- and outward-facing MelBSt in the absence of melibiose. Distances between Na+ and nearby residues' coordinating atoms are labeled in text and dashed lines. (a) Na+ binding in the inward-facing conformation. (b) Na+ binding in the outward-facing conformation. (c) Probability distribution of the distance between the bound Na+ to all ligands. Blue, inward-facing conformation; green, outward-facing conformation.
Figure 3—figure supplement 2
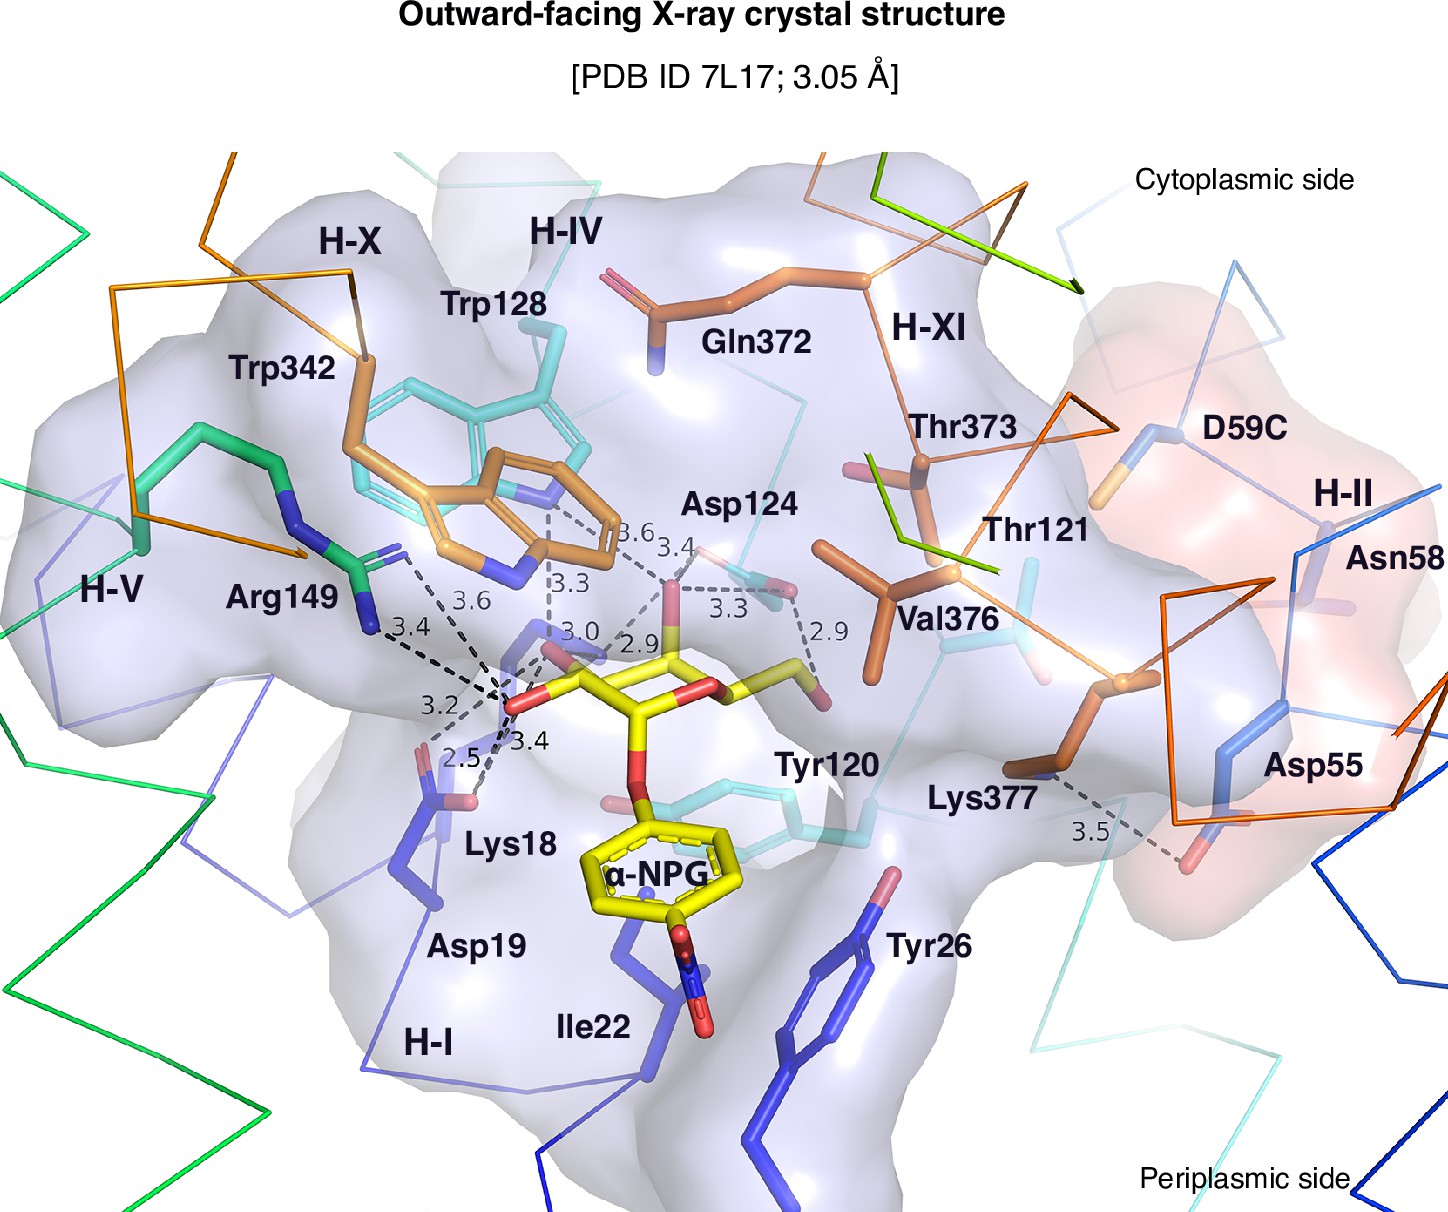
Galactose-binding pocket in the outward-facing crystal structure (PDB ID 7L17).
All polar interactions between the bound α-NPG and D59C MelBSt are indicated by dashed lines (Å) and the pocket is shown in surface representation in blue. The Na+-binding residues are highlighted by sticks and surface representation in pink. The cytoplasmic and periplasmic sides are indicated. Eight N-terminal residues (Lys18, Asp19, Ile22, Tyr26, Tyr120, Asp124, Trp128, and Arg149), especially the four charged residues, form the multiple polar interactions with one surface of the galactopyranosyl moiety. Five C-terminal residues (Trp342, Gln372, Thr373, Val376, and Lys377) form a non-specific barrier without a strong polar interaction.
Figure 3—figure supplement 3
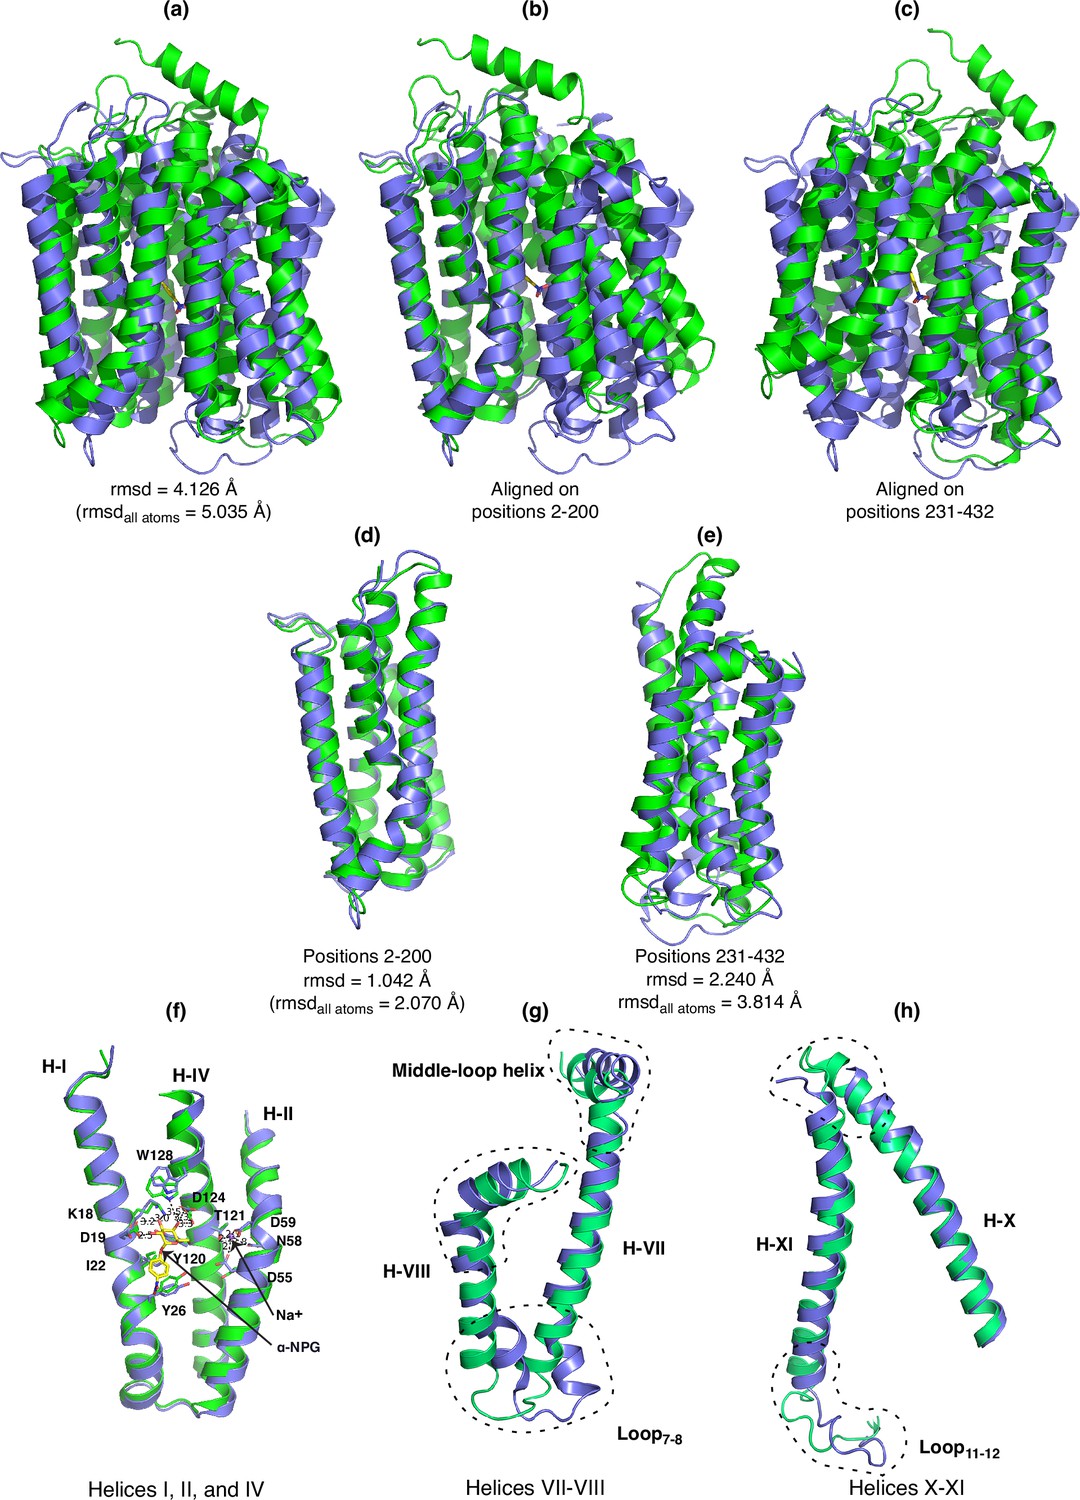
The alignment of the sugar-bound outward-facing structure (7L17, green) with the Na+ -bound inward-facing structure (blue) was carried out in Pymol or Coot programs.
The rmsd values reported from Pymol program were either based on default settings with outlier rejection or using all atoms after removing unmatched residues. (a) Superposition of both structures. (b) Full-length alignment based on positions 2–200. (c) Full-length alignment based on positions 231–332. (d) Focused alignment of positions 2–200. (e) Focused alignment of positions 231–432. (f) Helices I, II, and IV isolated from the focused alignment of positions 2–300 in (d). The major binding residues for Na+ and α-NPG are highlighted. (g) Helices VII–VIII and the extended loops isolated from the focused alignment of positions 219–432. (h) Helices X–XI and the extended loops isolated from the focused alignment of positions 219–432.
Figure 3—figure supplement 4
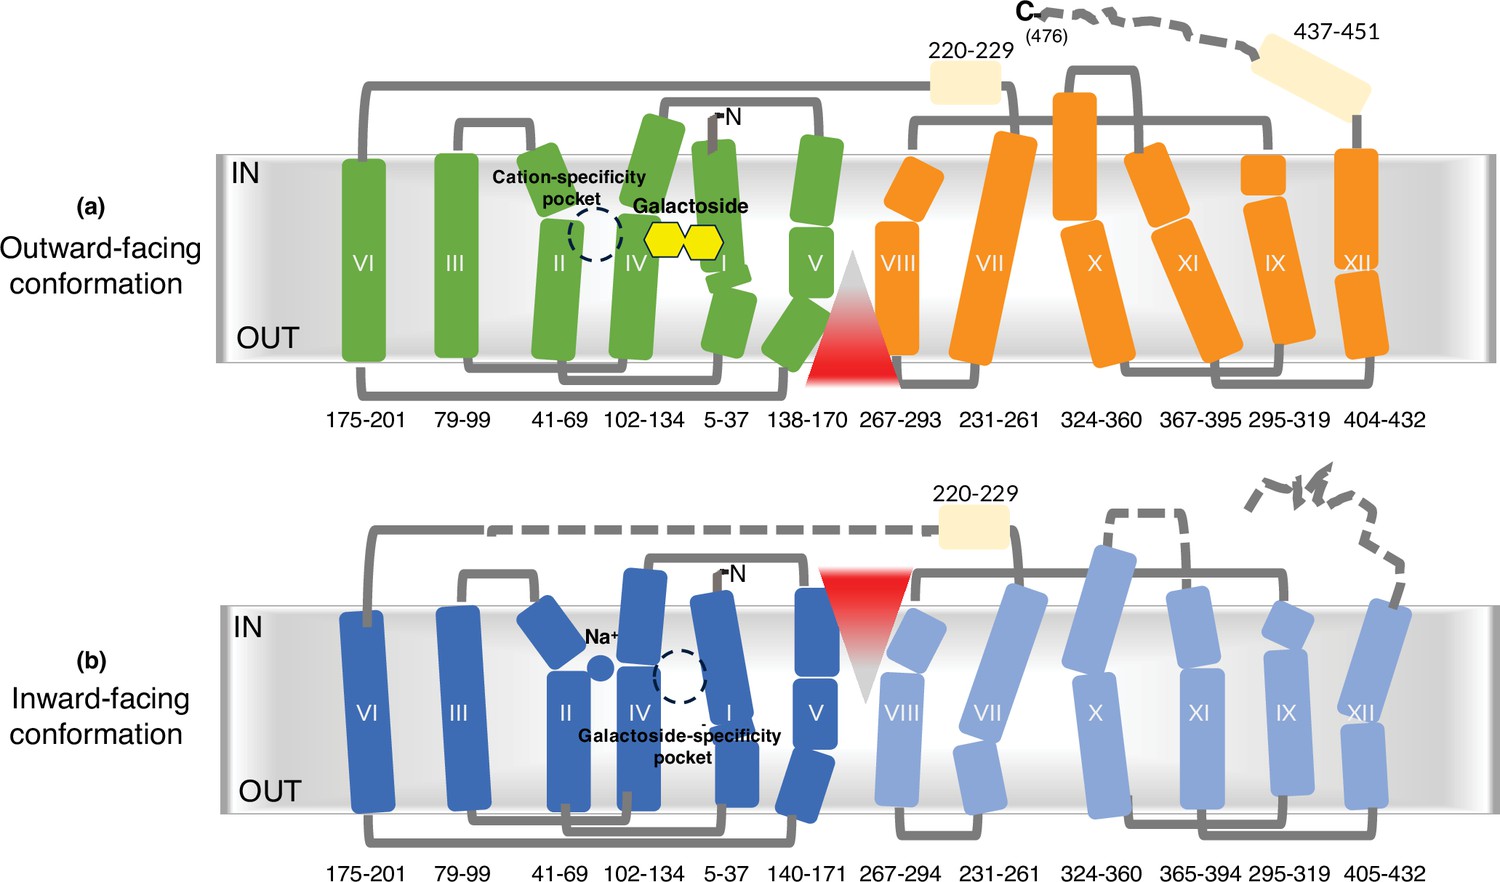
Membrane topology.
(a) The sugar-bound outward-facing structure (PDB ID 7L17). (b) The Na+-bound inward-facing structure. The full-length MelBSt is illustrated by transmembrane topology based on both structures. The residue positions for each helix are indicated. The N- and C-terminal transmembrane helices are colored green and orange for the outward-facing conformation, respectively, as well as blue and light blue for the inward-facing conformation, respectively. The peripheral helices are colored in light yellow. Blue ball, Na+; yellow hexagons, galactoside. The red triangle indicates the solvent-access paths. Gray lines, loops; dashed lines, unresolved loops. Broken circles, either cation-specificity pocket or sugar-specificity pocket.
Figure 4
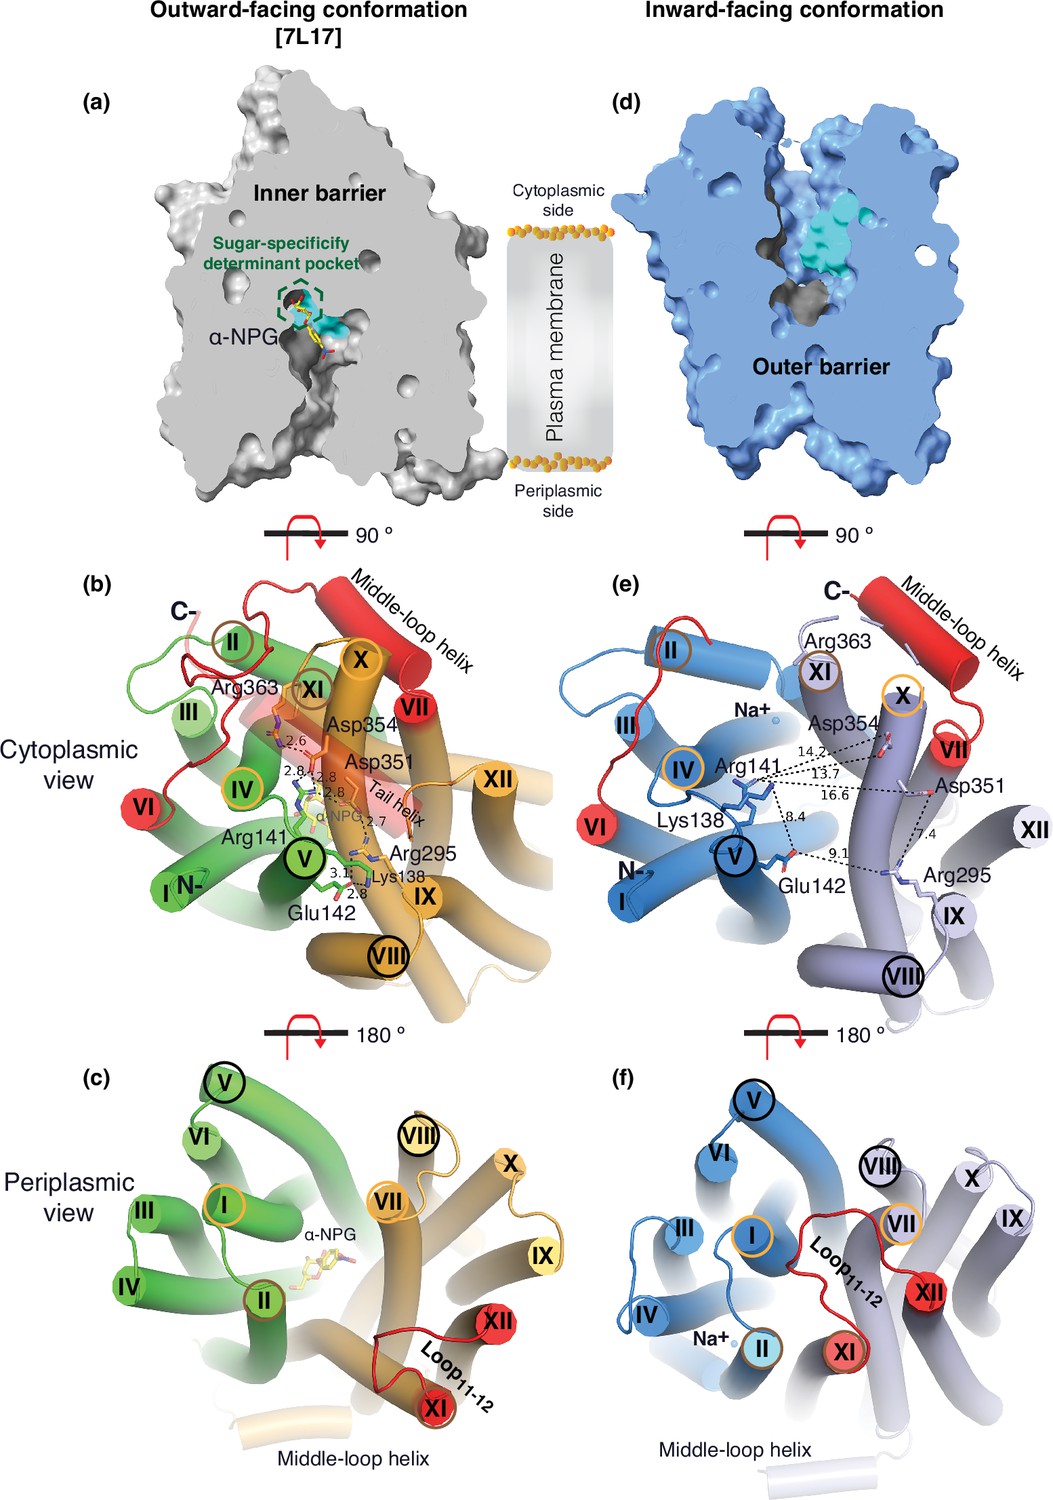
Barriers and sugar-binding pocket.
Outward-facing (PDB ID 7L17; left column) and inward-facing (right column) structures were used to prepare the figures. (a, d) Side view with cytoplasmic side on top. The inner and outer barriers are labeled. The sugar-specificity determinant pocket is highlighted in a dashed hexagon. The residues contributing to the bound α-NPG in N- and C-terminal bundles are colored in dark gray and cyan, respectively. (b, e) Cytoplasmic view. The charged network between the N- and C-terminal bundles is colored in green and bright orange in panel (b), or blue and light blue in panel (e), respectively. The C-terminal tail helix was set in transparent in panel (b) but disordered in the inward-facing conformation in panel (e). The charged residues are highlighted in sticks. Arg363 side chain missed the side chain in the inward-facing structure. (c, f) Periplasmic view. The paired helices involved in either barrier formation are highlighted in the same colored circles. The α-NPG is colored in yellow and Na+ is shown in blue sphere. The cytoplasmic middle loop, the C-terminal tail, and the periplasmic loop11-12 are highlighted in red. Distance between two residues is shown by dashed lines (Å).
Figure 5
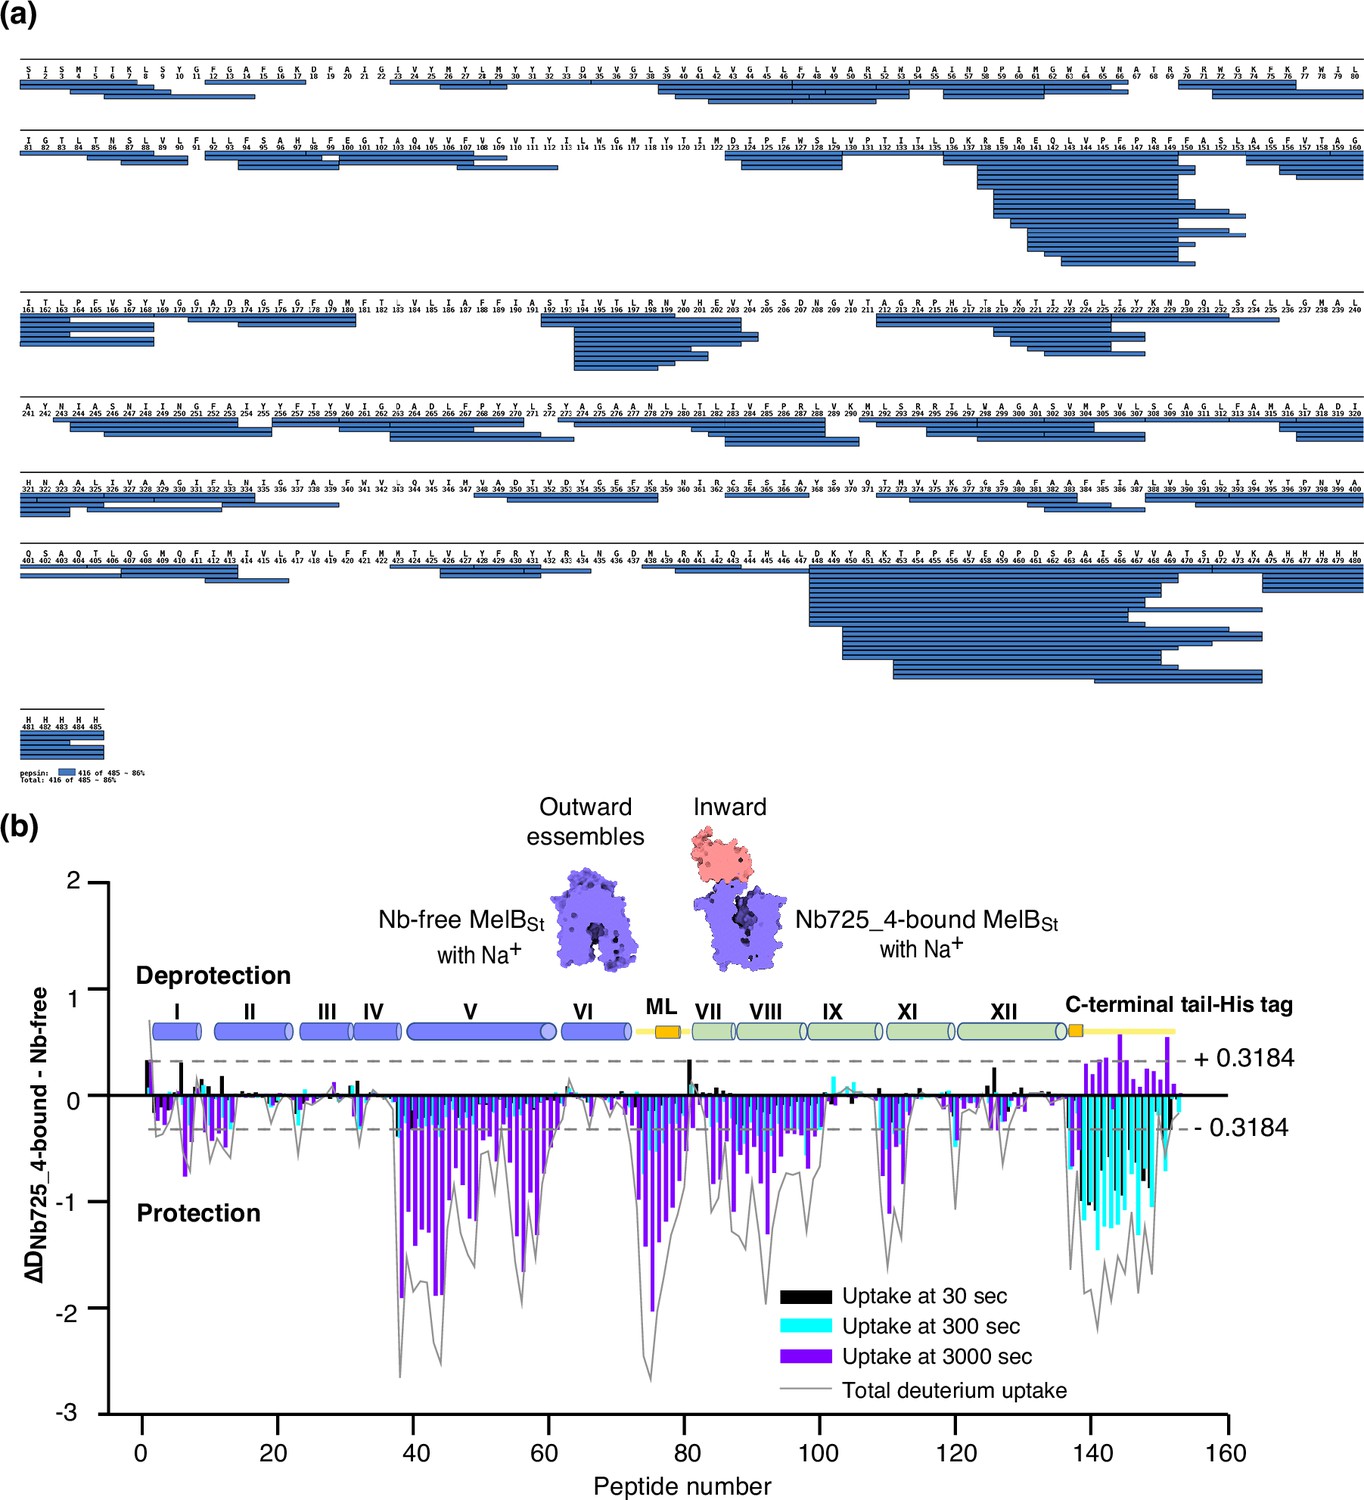
MelBSt dynamics probed by hydrogen/deuterium exchange mass spectrometry (HDX-MS).
(a) MelBSt peptide sequence coverage. The peptides of the deuterated MelBSt were determined based on the MelBSt peptide database that was generated by nonspecific digestions of non-deuterated MelBSt as described in ‘Materials and methods’. Peptides were confirmed in the HDX-MS experiment. Blue bar, the covering of each peptide. The amino-acid sequencing identification number should be –1 for each position due to the processed Met at position 1. The 10xHis Tag was included in the data analysis. (b) Residual plots (DNb725_4-bound - Nb-free) against the overlapping peptide numbers for each time point and the sum of uptake. MelBSt alone or bound with Nb725_4 in the presence of Na+ were used to carry out the HDX reactions as described in ‘Materials and methods’. Black, cyan, and blue bars, the deuterium uptake at 30, 300, and 3000 s, respectively; gray curve, the sum of uptake from all three time points. Deprotection, ΔD (DNb725_4-bound – Nb-free) > 0; protection, ΔD < 0. Each sample was analyzed in triplicates. Cylinders indicate the helices and the transmembrane helices are labeled in Roman numerals. The length of the cylinder does not reflect the length of corresponding helices but is estimated for locations of the deuterium-labeled overlapping peptides. Noteworthy, the uncovered regions were not included. ML (cytoplasmic middle loop) and C-terminal tail including the His tag are colored in yellow. Dashed lines, the threshold.
-
Figure 5—source data 1
Output results of HDExaminer software analysis for Figures 5 and 6.
- https://cdn.elifesciences.org/articles/92462/elife-92462-fig5-data1-v1.csv
Figure 6 with 3 supplements
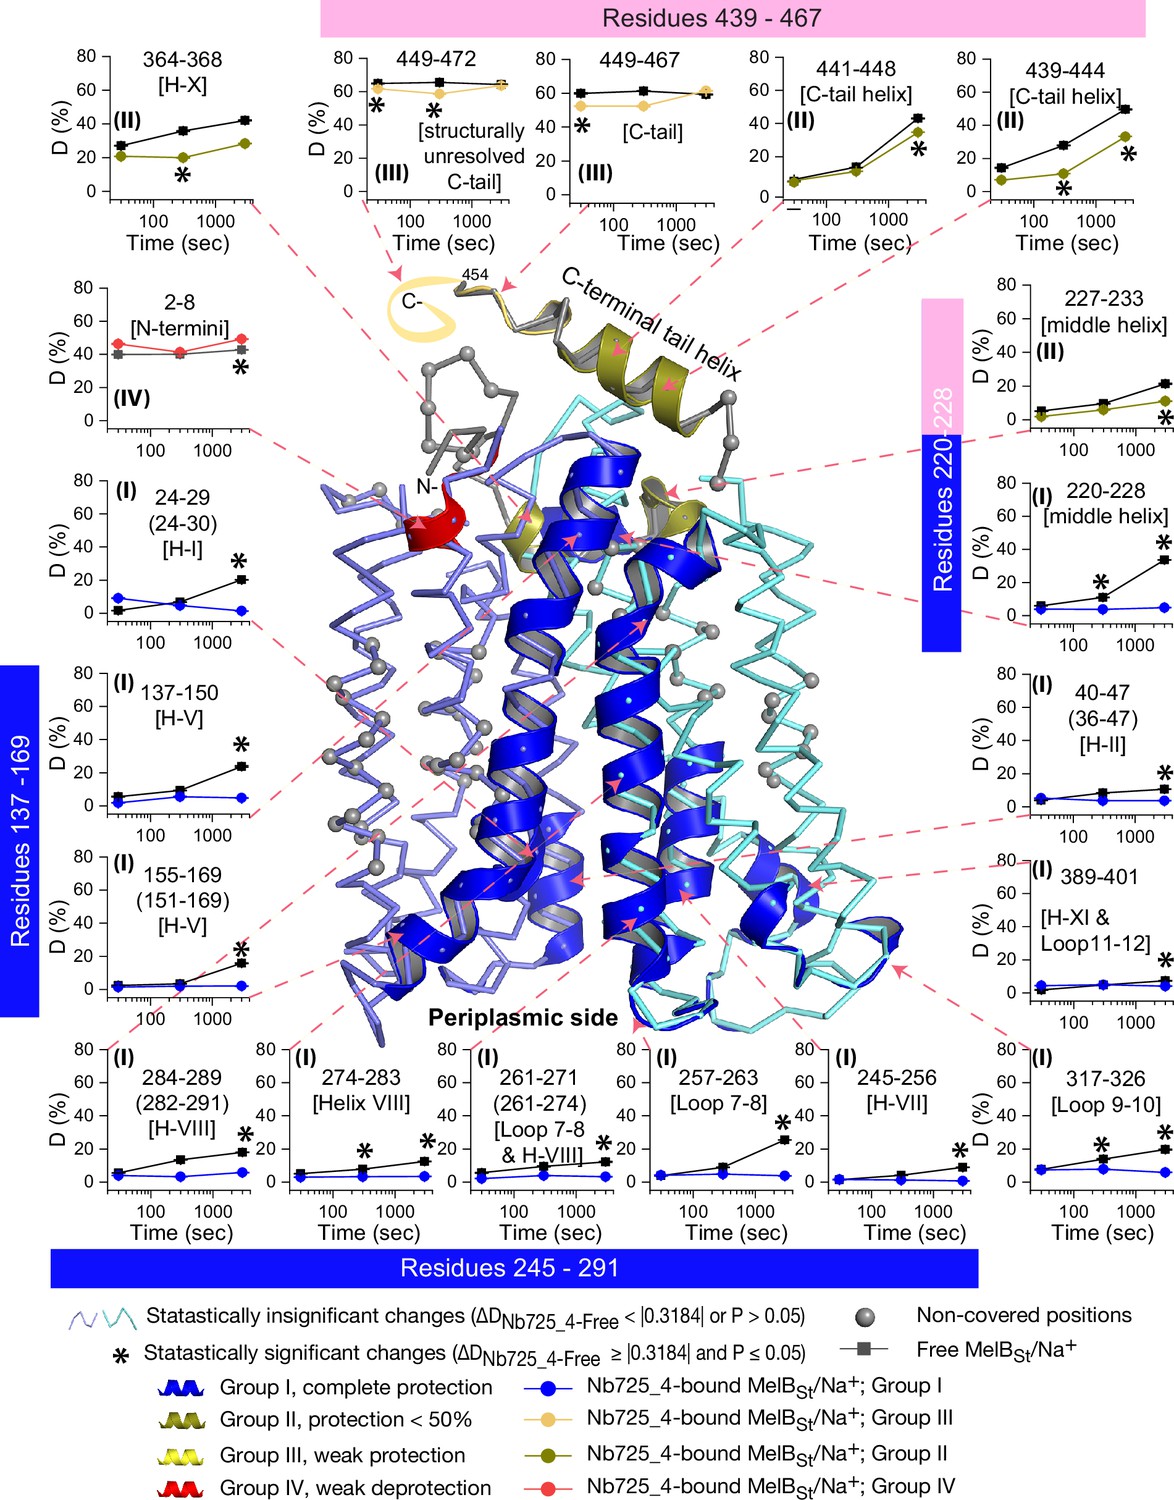
Peptide mapping of hydrogen/deuterium exchange (HDX) results.
HDX results are presented in Figure 5. Any peptide of ΔD with p≤0.05 and ΔD ≥ |0.3184| were treated as significant. The peptides with statistically significant differences at the 3000 s time point were mapped on the outward-facing structure (PDB ID 7L17). Inset, the deuterium uptake time course of representative peptides was plotted as a percentage of deuterium uptake relative to the theoretic maximum number (D%). The peptides, either as a single peptide or a group of overlapping peptides (in the parentheses), are labeled and indicated in the structure by the pink arrow in dashed lines. In the brackets, the corresponding secondary structure or loops. Error bar, SEM; the number of tests, 3. Other symbols are presented within the figure.
Figure 6—figure supplement 1
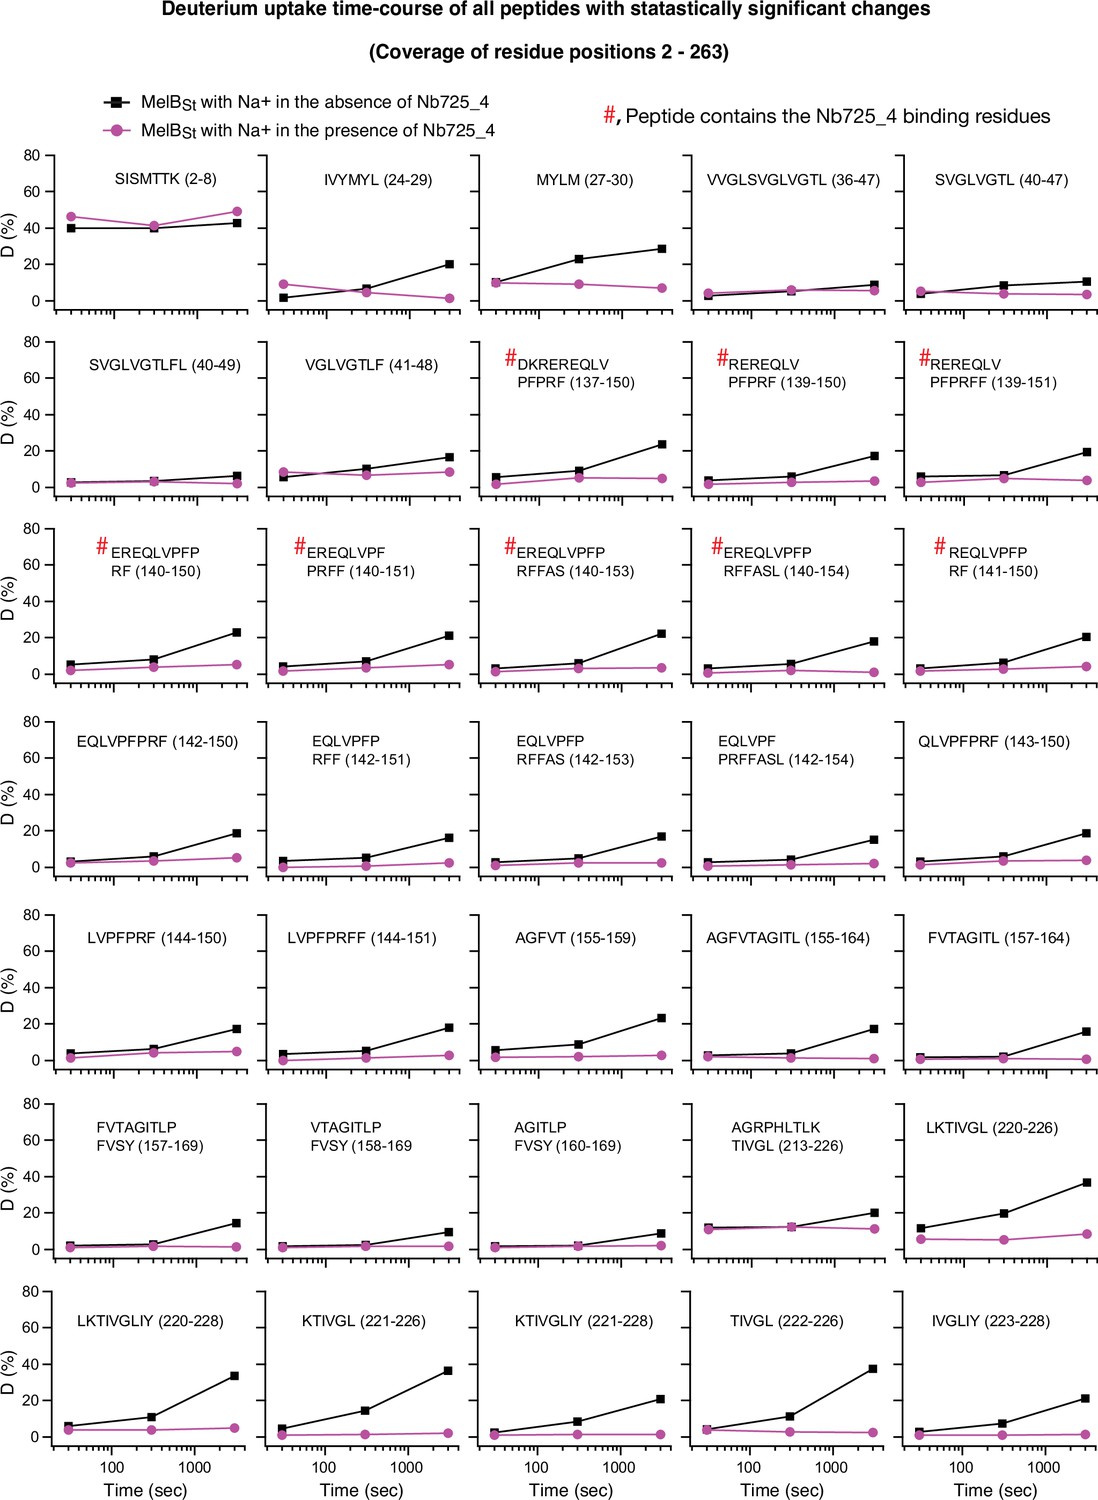
Uptake time course for positions 2–263.
The deuterium uptake time course of peptides covering positions 2–263 is plotted as a percentage of deuterium uptake relative to the theoretic maximum number (D%) in the absence (black square) or presence (red circle) of Nb725_4. #, the peptide contains the Nb725_4 binding residues. The peptide sequence is shown in each plot. labeled Error bar, SEM; the number of tests, 3.
Figure 6—figure supplement 2
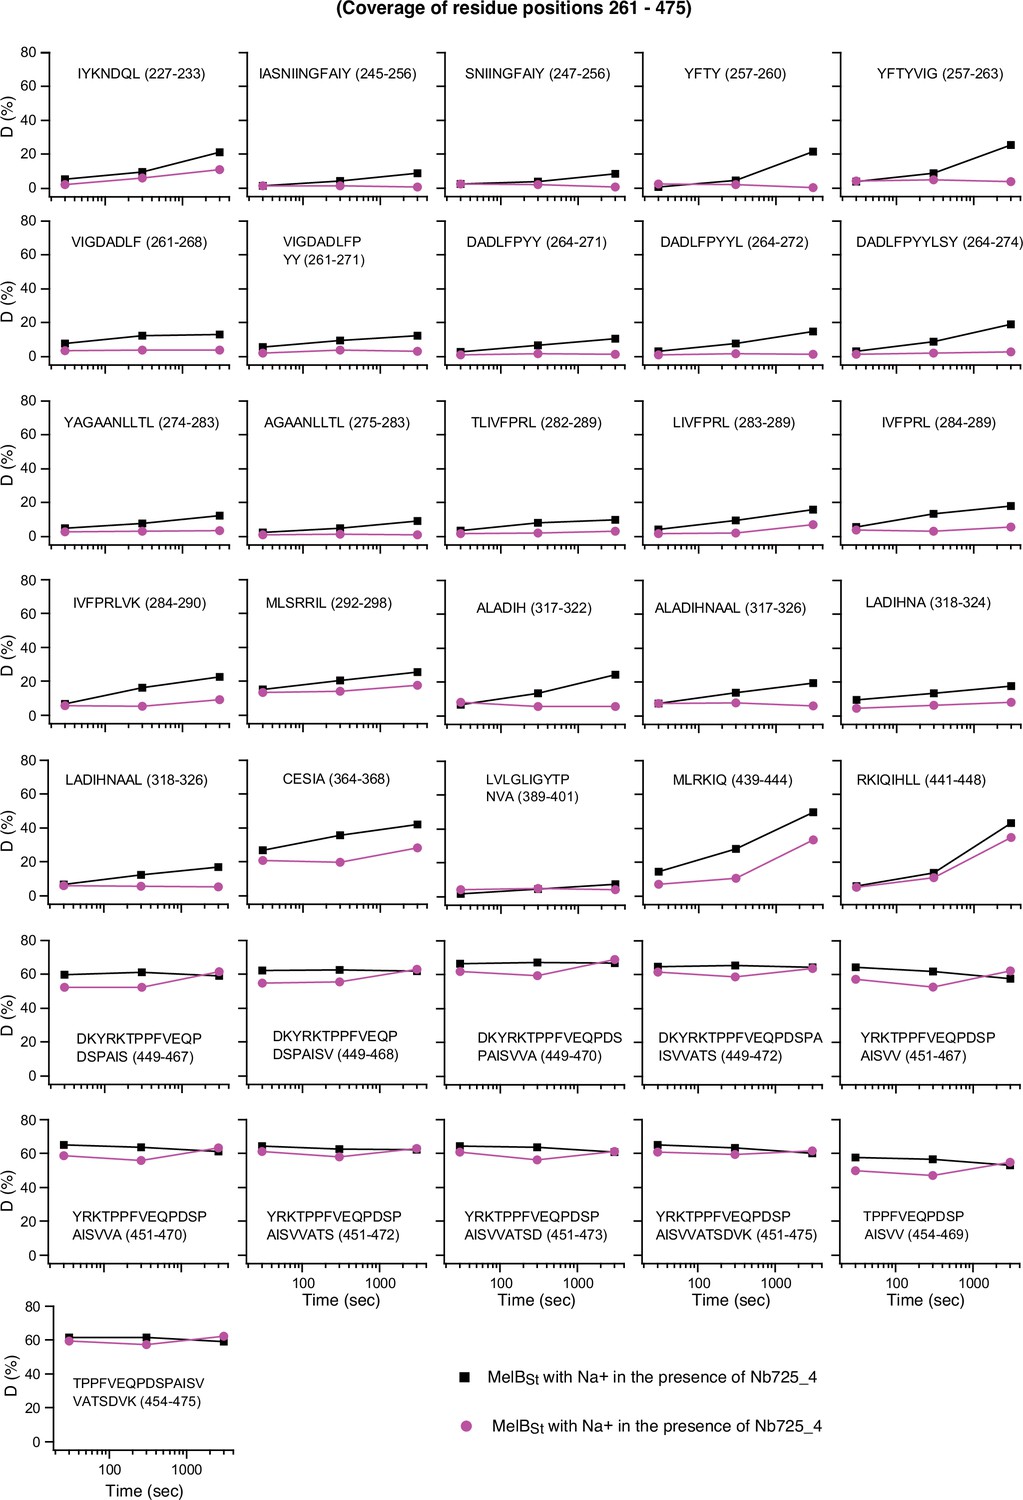
Uptake time course for positions 261–475.
The deuterium uptake time course of peptides covering positions 261–475 is plotted as a percentage of deuterium uptake relative to the theoretic maximum number (D%) in the absence (black square) or presence (red circle) of Nb725_4. The peptide sequence is shown in each plot. labeled Error bar, SEM; the number of tests, 3.
Figure 6—figure supplement 3
Hydrogen/deuterium exchange mass spectrometry (HDX-MS).
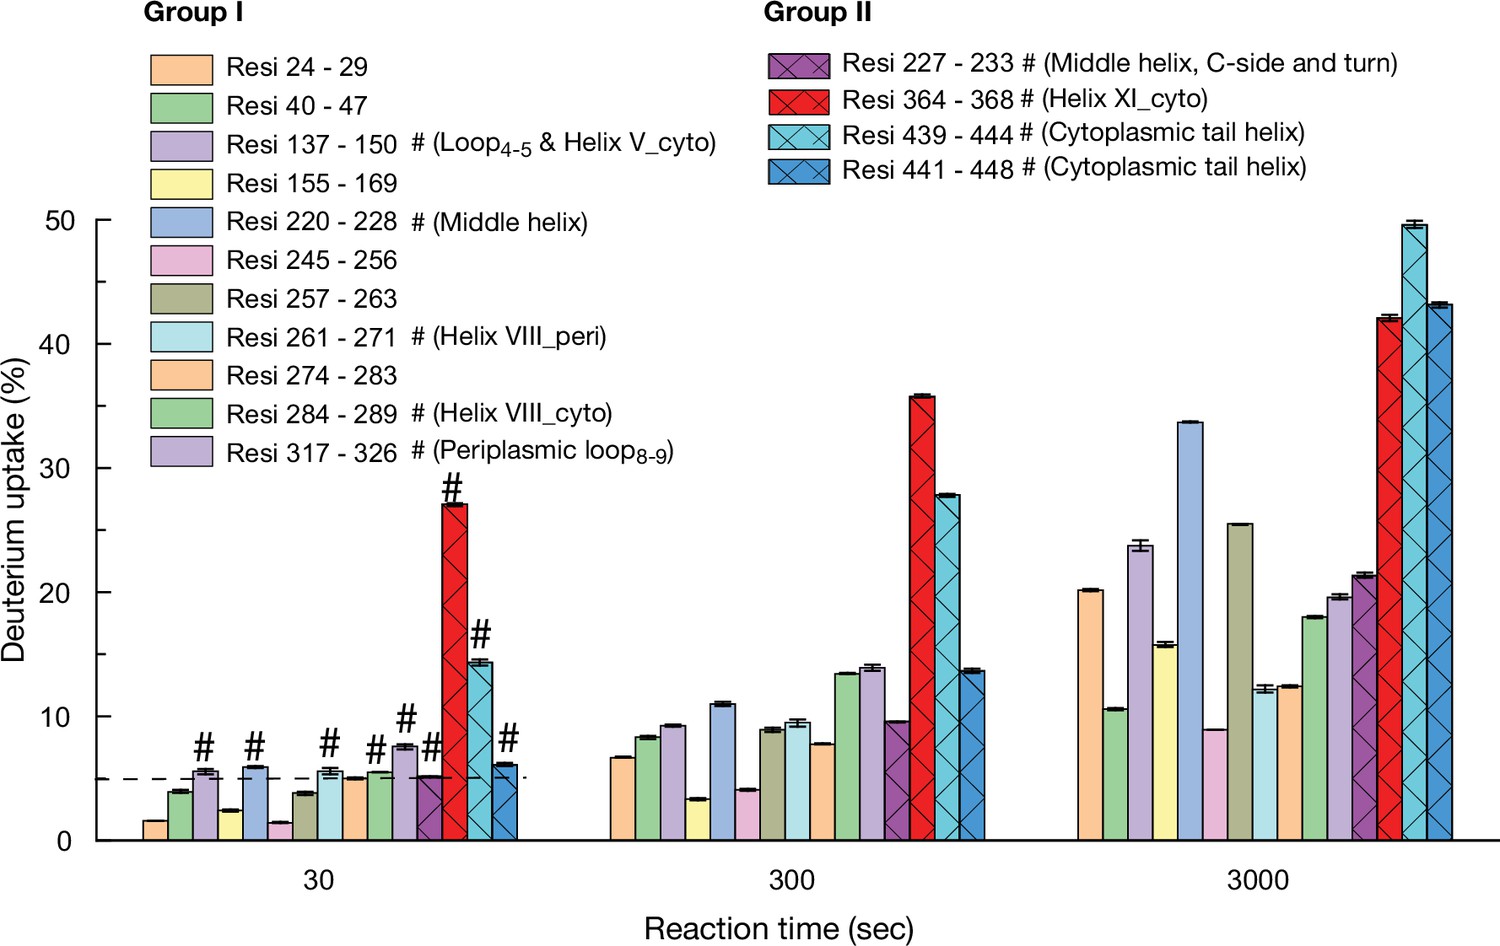
Histograms of deuterium uptake time courses. The deuterium uptake time courses of the groups I and II presented in Figure 7 are replotted in the histogram. Error bar, SEM; test number, 3.
Figure 7
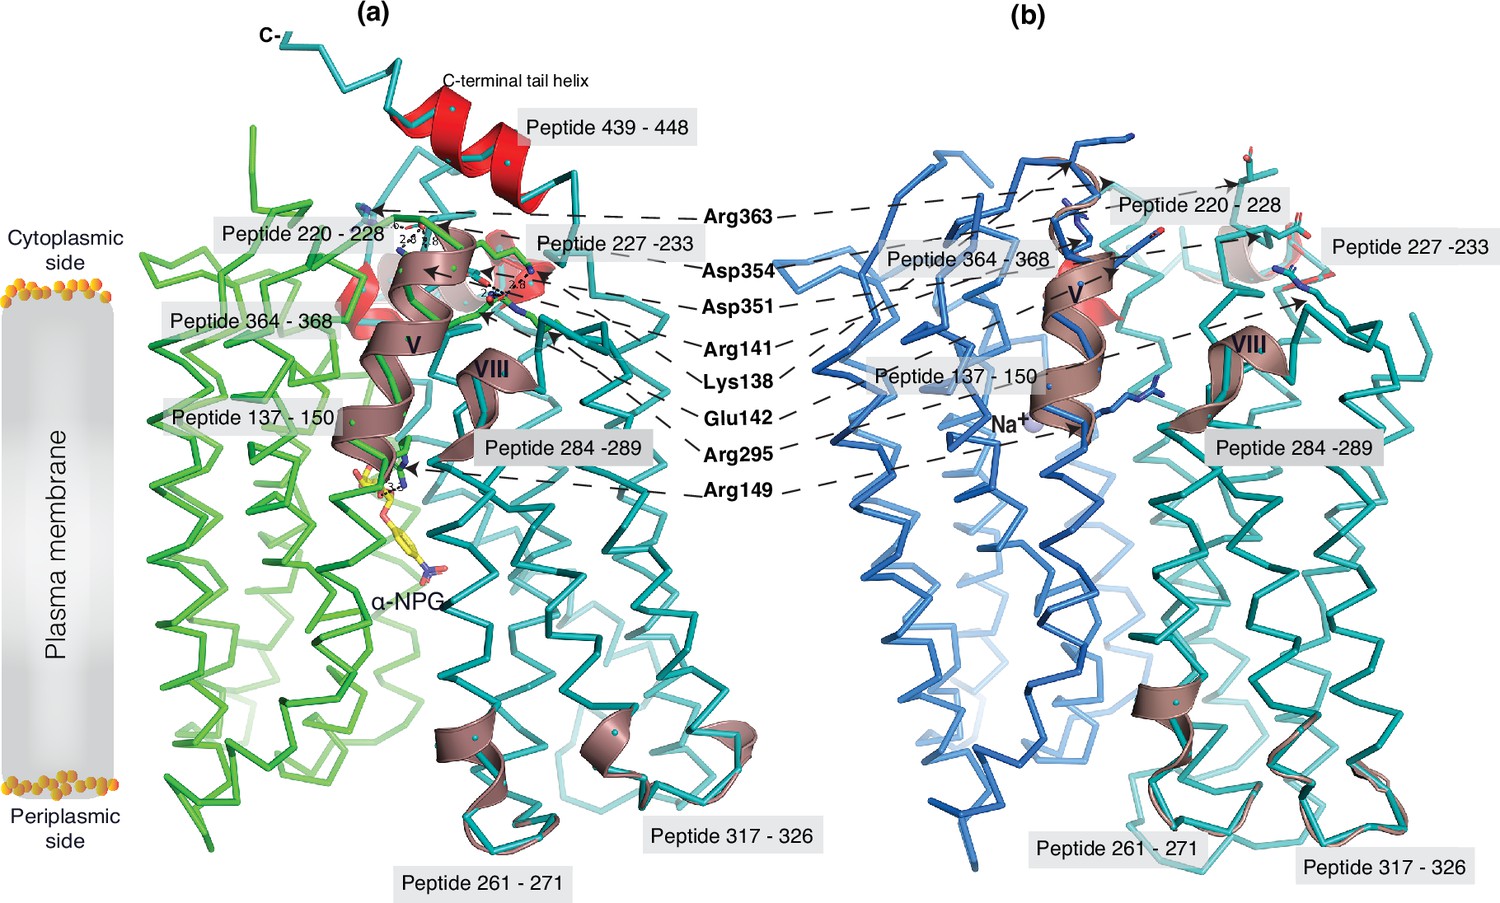
Dynamic regions of MelBSt.
The peptides that exhibited faster hydrogen/deuterium exchange (HDX) rates (>5% at 30 s) were mapped on both the α-NPG-bound outward-facing structure (7L17) in panel (a) and the inward-facing cryoEM Nb725_4-bound structure in the panel (b), respectively. All peptides are labeled and highlighted in a transparent gray box. The charged residues forming the inner barrier-specific salt-bridge network are highlighted in sticks and indicated by black arrows in dashed lines. In the Nb725_4-bound structure (b), the C-terminal tail was disordered. The cartoon colored in dirty violet, the group I peptides with faster HDX rate; the cartoon colored in red, group II peptides. The α-NPG is highlighted in yellow and Na+ is shown in blue sphere.
Figure 8
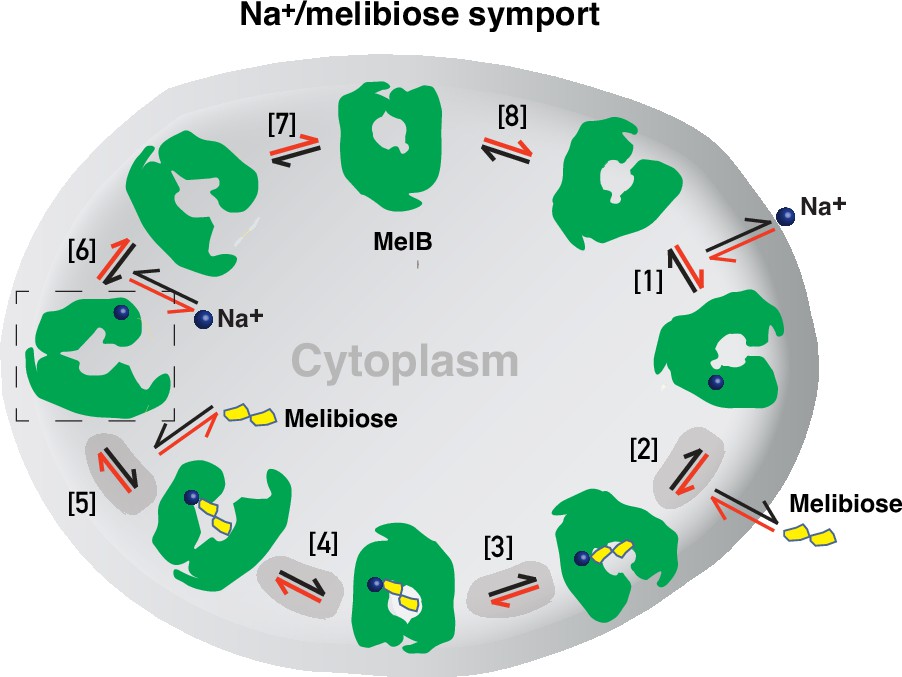
Stepped-binding model for the Na+/melibiose symport catalyzed by MelB.
Eight states are postulated including transient intermediates. In this reversal reaction, the cation binds prior to the sugar and releases after sugar release. Melibiose active transport or inflex begins at step [1] and proceeds via the red arrows clockwise around the circle, with one melibiose and one cation inwardly across the membrane per cycle. Melibiose efflux begins at step [6] and proceeds via the black arrows anticlockwise around the circle, with one melibiose and one cation outwardly across the membrane per circle. Melibiose exchange begins at step [6], and only takes four steps involving steps [2–5] as highlighted in gray color. The low-sugar affinity inward-facing Na+-bound cryoEM structure represents the state after the release of sugar, as indicated by a dashed box.
Tables
Table 1
Nanobodies (Nbs) binding.
| Titrant | Titrate condition | Kd(µM) | Number of tests | Fold of affinity change | p-Value* |
|---|---|---|---|---|---|
| Nb725_4 | MelBSt/Na+ | 3.64 ± 0.62† | 7 | ||
| MelBSt/Na+/melibiose | 11.81 ± 0.72 | 6 | -3.24 | <0.01 | |
| MelBSt/Na+/α- †NPG | 14.63 ± 1.27 | 2 | -4.02 | <0.01 | |
| MelBSt/Na+/EIIAGlc | 2.14 ± 0.11 | 2 | +1.70 | >0.05 | |
| NabFab | 52.53 ± 13.03‡ | 2 | |||
| Nb725 | MelBSt/Na+ | 1.58 ± 0.42 | 6 | ||
| MelBSt/Na+/melibiose | 8.88 ± 1.24 | 5 | -5.62 | <0.01 | |
| MelBSt/Na+/α-NPG | 12.58 ± 0.60 | 2 | -7.96 | <0.01 | |
| MelBSt/Na+/EIIAGlc | 1.18 ± 0.12 | 2 | +1.34 | >0.05 | |
| NabFab | 36.02 | 1 | |||
| Anti-Fab Nb | NabFab | 112.90 ± 16.33‡ | 2 |
-
*
Unpaired t-test.
-
†
Mean ± SEM.
-
‡
nM.
Table 2
Nanobody (Nb) effects on MelBSt binding to sugar, Na+, and EIIAGlc.
| Titrant | Titrate condition | Kd(µM) | Number of tests | Fold of affinity change | p-Value* | Reference |
|---|---|---|---|---|---|---|
| Melibiose | MelBSt/Na+ | 1430 ± 30.0† | 5 | / | ||
| MelBSt/Na+/Nb725_4 | /‡ | 3 | ||||
| MelBSt/Na+/Nb725 | / | 3 | ||||
| MelBSt/Na+/EIIAGlc | / | 3 | Hariharan et al., 2015 | |||
| α-NPG | MelBSt/Na+ | 16.46 ± 0.21 | 5 | / | ||
| MelBSt/Na+/Nb725_4 | 531.55 ± 19.25 | 2 | -32.29 | <0.01 | ||
| MelBSt/Na+/Nb725 | 353.55 ± 37.25 | 2 | -21.48 | <0.01 | ||
| MelBSt/Na+/EIIAGlc | 76.13 ± 4.52 | 2 | -4.63 | <0.01 | Hariharan et al., 2015 | |
| Na+ | MelBSt | 261.77 ± 49.15 | 4 | / | ||
| MelBSt/Nb725_4 | 345.04 ± 9.92 | 2 | -1.32 | >0.05 | ||
| MelBSt/Nb725 | 182.50 ± 11.30 | 2 | +1.43 | >0.05 | ||
| MelBSt/EIIAGlc | 253.50 ± 11.00 | 2 | +1.03 | >0.05 | Katsube et al., 2023 | |
| EIIAGlc | MelBSt/Na+ | 3.76 ± 0.29 | 5 | / | ||
| MelBSt/Na+/Nb725_4 | 4.32 ± 0.64 | 4 | -1.15 | >0.05 | ||
| MelBSt/Na+/Nb725 | 1.94 ± 0.10 | 4 | +1.94 | <0.01 |
-
*
Unpaired t-test.
-
†
Mean ± SEM.
-
‡
Not detectable.
Table 3
CryoEM data collection and structure determination statistics.
| MelBSt/Nb725m/NabFab | |||||
|---|---|---|---|---|---|
| EMDB | EMD-41062 | ||||
| PDB | 8T60 | ||||
| Non-tilted collection | Tilted collection | ||||
| Data collection | |||||
| Microscope | Krios-TEMBETA | Krios-TEMBETA | |||
| Voltage (kV) | 300 | 300 | |||
| Number of movies | 14,094 | 8716 | |||
| Electron dose (e-/Å2) | 50.00 | 50.00 | |||
| Defocus range (μm) | −0.8 to –1.8 | −0.8 to –1.8 | |||
| Pixel size (Å) | 0.86 | 0.86 | |||
| Plate tilt angel (°) | / | 30 | |||
| Data processing | |||||
| Initial number of particles | 7,632,727 | 2,887,147 | |||
| Combined final number of particles | 203,876 | ||||
| Symmetry imposed | C1 | ||||
| Map resolution* (Å) | 3.29 | ||||
| B factor | 101.4 | ||||
| Model refinement | |||||
| Chains | 5 | ||||
| Non-hydrogen atoms | 7503 | ||||
| Protein residues | 978 | ||||
| Mean B-factor | |||||
| Protein | 97.35 | ||||
| Na+ ion | 88.64 | ||||
| RMS deviations | |||||
| Bond lengths (Å) | 0.003 | ||||
| Bond angles (°) | 0.509 | ||||
| MolProbity score | 1.82 | ||||
| Clash score | 4.09 | ||||
| Poor rotamers (%) | 1.98 | ||||
| Ramachandran plot | |||||
| Favored (%) | 93.48 | ||||
| Allowed (%) | 6.52 | ||||
| Outliers (%) | 0.00 | ||||
| Model resolution (Å)† | 3.2/3.3/3.5 | ||||
-
*
Resolution determined by Fourier shell coefficient threshold of 0.143 for corrected masked map.
-
†
Resolution determined between the model and the resolved map by Fourier shell coefficient threshold of 0/0.143/0.5.
Table 4
HDX reaction and labeling details.
| Samples measured | WT MelBSt | WT MelBSt complexed with Nb725m |
|---|---|---|
| HX reaction buffer | 25 mM Tris-HCl, pD 7.5, 150 mM NaCl, 10% Glycerol, and 0.01% DDM | |
| Reaction temperature (°C) | 20 | |
| HX time course (s) | 0, 30, 300, 3000 | |
| Number of peptides | 153 | |
| Sequence coverage by labeling | 86% | |
| Mean peptide length | 9.3 | |
| Average redundancy | 2.9 | |
| Replicates (technical) | 3 | |
| |ΔD| (Da) | 0.3071 | |
| Back exchange rate | Not appliable | |
Key resources table
| Reagent type (species) or resource | Designation | Source or reference | Identifiers | Additional information |
|---|---|---|---|---|
| Strain, strain background melB (Salmonella typhimurium) | S. typhimurium strain LT2/SGSC1412/ATCC | PMID:1495487 | STM4299 | Used for melB cloning |
| Strain, strain background (Escherichia coli) | DW2 | PMID:3047112 | melA+ ΔmelB ΔlacZY | MelB expression and transport analysis |
| Strain, strain background (E. coli) | XL1 Blue | Agilent Technologies | recA1 endA1 gyrA96 thi-1 hsdR17 supE44 relA1 lac [F′ proAB lacIqZΔM15 Tn10 (Tetr)] | Plasmid amplification |
| Strain, strain background (E. coli) | ArcticExpress (DE3) | Agilent Technologies | F– ompT hsdS(rB – mB –) dcm+ Tetr gal λ(DE3) endA Hte [cpn10 cpn60 Gentr] | Protein expression |
| Strain, strain background (E. coli) | DH5α cyaA- | PMID:37380079 | ΔcyaA | Two-hybrid assay |
| Strain, strain background (E. coli) | BL21(DE3) T7 express | New England Biolabs | fhuA2 lacZ::T7 gene1 [lon] ompT gal sulA11 R(mcr-73::miniTn10--TetS)2 [dcm] R(zgb-210::Tn10--TetS) endA1 Δ(mcrC-mrr)114::IS10 | Protein expression |
| Strain, strain background (E. coli) | BL21(DE3) C43 | PMID:8757792 | F– ompT hsdSB (rB- mB-) gal dcm (DE3) | Protein expression |
| Strain, strain background (E. coli) | BL21(DE3) pRIL | Agilent Technologies | F– ompT hsdS(rB – mB –) dcm+ Tetr gal endA Hte [argU ileY leuW], Camr | Protein expression |
| Recombinant DNA reagent (plasmid) | pCS19 | PMID:10319814 | pQE60 derivative inserted with gene lacIq; ampr | Cloning/expressing vector |
| Recombinant DNA reagent (plasmid) | pCS19/FX | PMID:25627011 | Expression vector derived from pCS19 with two SapI sites and ccdB gene for FX cloning; ampr | |
| Recombinant DNA reagent (plasmid) | pACYC | PMID:2190220 | Expression vector; no ccdB gene: camr | |
| Recombinant DNA reagent (plasmid) | pACYC/FX | PMID:25627011 | Expression vector derived from pACYC; with ccdB gene, camr | |
| Recombinant DNA reagent (plasmid) | pACYC/MelBSt | PMID:25627011 | Expression plasmid for MelBSt derived from pACYC/FX; no ccdB gene, camr | |
| Recombinant DNA reagent (plasmid) | pCS19/X:T18/FX | PMID:37380079 | FX cloning vector; two SapI sites and ccdB gene for FX cloning; ampr | Two-hybrid assay vector; expressing a target protein ‘X’ with a C-terminal T18 fusion |
| Recombinant DNA reagent (plasmid) | pCS19/T18 | PMID:37380079 | Expression plasmid from pCS19/X:T18/FX for expressing T18 fragment only; no ccdB gene. | Two-hybrid assay plasmid; control vector |
| Recombinant DNA reagent (plasmid) | pACYC/T25 | PMID:37380079 | Expression plasmid from pACYC/T25:X/FX for expressing T25 fragment; no ccdB gene, camr | Two-hybrid assay plasmid; control vector |
| Recombinant DNA reagent (plasmid) | pACYC/T25:MelBSt | PMID:37380079 | Expression plasmid derived from pACYC/T25:X/FX; no ccdB gene, camr | Two-hybrid assay plasmid; expressing T25:MelBSt hybrid |
| Recombinant DNA reagent (plasmid) | pCS19/Nb725:T18 | PMID:37380079 | Expression plasmid hybrid derived from pCS19/X:T18/FX; no ccdB gene, ampr | Two-hybrid assay plasmid; expressing Nb725:T18 hybrid |
| Recombinant DNA reagent (plasmid) | pCS19/Nb725_4:T18 | This study | Expression plasmid derived from pCS19/X:T18/FX; no ccdB gene, ampr | Two-hybrid assay plasmid; expressing Nb725_4:T18 hybrid |
| Recombinant DNA reagent (plasmid) | pK95ΔAH/MelBSt/CHis10 | PMC3057838 | Constitutive expression plasmid | MelBSt protein expression |
| Recombinant DNA reagent (plasmid) | pCS19/Nb725 | PMID:37380079 | Expression plasmid for Nb725 derived from pCS19/FX; no ccdB gene, ampr | Nb725 protein expression |
| Recombinant DNA reagent (plasmid) | pCS19/Nb725_4 | This study | Expression plasmid for Nb725_4 derived from pCS19/FX; no ccdB gene, ampr | Nb725_4 protein expression |
| Recombinant DNA reagent (plasmid) | pET26b(+) | Novagen (EMD Millipore) | Periplasmic expression plasmid with a N-terminal pelB signal sequence; Kanr | For expression Nb725_4 and anti-Fab Nb |
| Recombinant DNA reagent (plasmid) | pET26/Nb725_4 | This study | Periplasmic expression plasmid derived from pET26b(+); Kanr | Nb725_4 protein production |
| Recombinant DNA reagent (plasmid) | pET26/Anti-Fab Nb | This study | Anti-Fab Nb periplasmic expression plasmid; Kanr | Anti-Fab Nb protein expression |
| Recombinant DNA reagent (plasmid) | p7XC3H/Nb725 | PMID:37380079 | Cytoplasmic expression plasmid; Kanr | Nb725 protein production |
| Recombinant DNA reagent (plasmid) | p7XNH3/EIIAGlc | PMID:25296751 | Cytoplasmic expression plasmid; Kanr | EIIAGlc protein production |
| Recombinant DNA reagent (plasmid) | pR2.2/NabFab | PMID:34782475 | Periplasmic expression of NabFab; Ampr | NabFab protein production |
| Recombinant DNA reagent (plasmid) | pMSP1E3D1 | Addgene/20066 | Expressing SP1E3D1; Kanr | MSP1E3D1 production |
| Recombinant DNA reagent (plasmid) | pRK792 | Addgene/8830 | Expressing TEV protease; Ampr | TEV protease production |
| Sequence-based reagent (primers) | MelB_Nb725_4_T18 | This study | Fwd: 5′- ATATATGCTCTTCTAGTCAACGTCAATTGGTAG -3′ Rev: 5′- TATATAGCTCTTCATGCGCTGCTCACGGTCAC -3′ | FX cloning primers to contrast pCS19/Nb725_4:T18; addition of a C-terminal ‘A’ of Nb725_4 enabling the C-terminal T18 in-frame fusion |
| Sequence-based reagent (primer) | MelB_Nb725_4 | This study | Fwd: 5′-ATATATGCTCTTCTAGTATGCAACGTCAATTGGTAG-3′ Rev: 5′-TATATAGCTCTTCATGCTTAGTGGTGATGATGGTGGTGGCT GCTCACGGTCAC-3′ | FX cloning primers to construct pCS19:Nb725_4-CTH with a C-terminal 6x His-tag |
| Sequence-based reagent (primer) | Nb-PelB-NdeI | This study | Fwd: 5′-TTTAAGAAGGAGATATACATATG-3′ | Insert NdeI restriction site for Nb725_4 and anti-Fab Nb construction |
| Sequence-based reagent (primer) | Nb-STRP-XhoI | This study | Rev: 5′-TTTGTTCTAGACTCGAGTTATTTCTC-3′ | Add XhoI restriction site for Nb725_4 and anti-Fab Nb construction |
| Chemical compound, drug | [3H]Melibiose | PerkinElmer | (5.32 Ci/mmol) | Transport assay S |
| Chemical compound, drug | UDM | Anatrace | Cat# D300HA | MelBSt purification |
| Chemical compound, drug | DDM | Anatrace | Cat# D310 | MelBSt purification |
| Chemical compound, drug | Melibiose | Acros Organics | Cat# 125375000 | Fermentation and Binding assay |
| Chemical compound, drug | α-NPG | Acros Organics | Cat# 33733500 | Binding assay |
| Chemical compound, drug | E. coli lipids | Avanti Polar Lipids, Inc | Extract Polar, 100600 | Nanodiscs |
| Software, algorithm | CryoSPARC | CryoSPARC | 2-4.01 | CryoEM data processing |
| Software, algorithm | USF ChimeraX | USF ChimeraX | 1.6 | Mask preparation |
| Software, algorithm | Phenix | Phenix | 1.20-4459 | Map sharpen and model refinement |
| Software, algorithm | Coot | Coot | 0.9 | Model building |
| Software, algorithm | Pymol | Pymol | 2.5 | Model visualization |
| Software, algorithm | Qscore | Qscore | Q score calculation | |
| Software, algorithm | NanoAnalyze | TA Instruments | 3.7.5 | Data fitting |
| Software, algorithm | HDExaminer | Trajan Scientific and Medical | 3.3 | HDX data analysis |
| Software, algorithm | BioPharma Finder | Thermo | 5.1 | HDX data analysis and peptide mapping |
Additional files
Download links
A two-part list of links to download the article, or parts of the article, in various formats.
Downloads (link to download the article as PDF)
Open citations (links to open the citations from this article in various online reference manager services)
Cite this article (links to download the citations from this article in formats compatible with various reference manager tools)
Mobile barrier mechanisms for Na+-coupled symport in an MFS sugar transporter
eLife 12:RP92462.
https://doi.org/10.7554/eLife.92462.3


