mitoBKCa is functionally expressed in murine and human breast cancer cells and potentially contributes to metabolic reprogramming
- Department of Pharmacology, Toxicology and Clinical Pharmacy, Institute of Pharmacy, University of Tübingen, Germany
- Dr Margarete Fischer-Bosch Institute of Clinical Pharmacology, Germany
- Laboratory of Intracellular Ion Channels, Nencki Institute of Experimental Biology, Polish Academy of Sciences, Poland
- NMI Natural and Medical Sciences Institute at the University of Tübingen, Germany
- Center for Medical Research, CF Bioimaging, Medical University of Graz, Austria
- Institute of Pharmaceutical Sciences, Pharmaceutical (Bio-)Analysis, University of Tübingen, Germany
- University of Tübingen, Germany
- Medical Clinic IV, University Hospital Tübingen, Germany
- Institute of Pathology and Neuropathology, University Hospital Tübingen, Germany
- iFIT Cluster of Excellence (EXC 2180) “Image-guided and Functionally Instructed Tumor Therapies”, University of Tübingen, Germany
- Department of Clinical Pharmacology, Universityhostpital of Tübingen, Germany
- Department of Biochemistry and Pharmacy, University of Tübingen, Germany
- German Cancer Consortium (DKTK), German Cancer Research Center, Partner Site Tübingen, Germany
- Institute for Diabetes Research and Metabolic Diseases (IDM) of the Helmholtz Center Munich at the Eberhard Karls University Tübingen, University of Tübingen, Germany
- German Center for Diabetes Research (DZD), Germany
- Gottfried Schatz Research Center, Molecular Biology and Biochemistry, Medical University of Graz, Austria
- BioTechMed Graz, Austria
- Department of Physics and Biophysics, Warsaw University of Life Sciences (SGGW), Poland
Figures
Figure 1 with 1 supplement
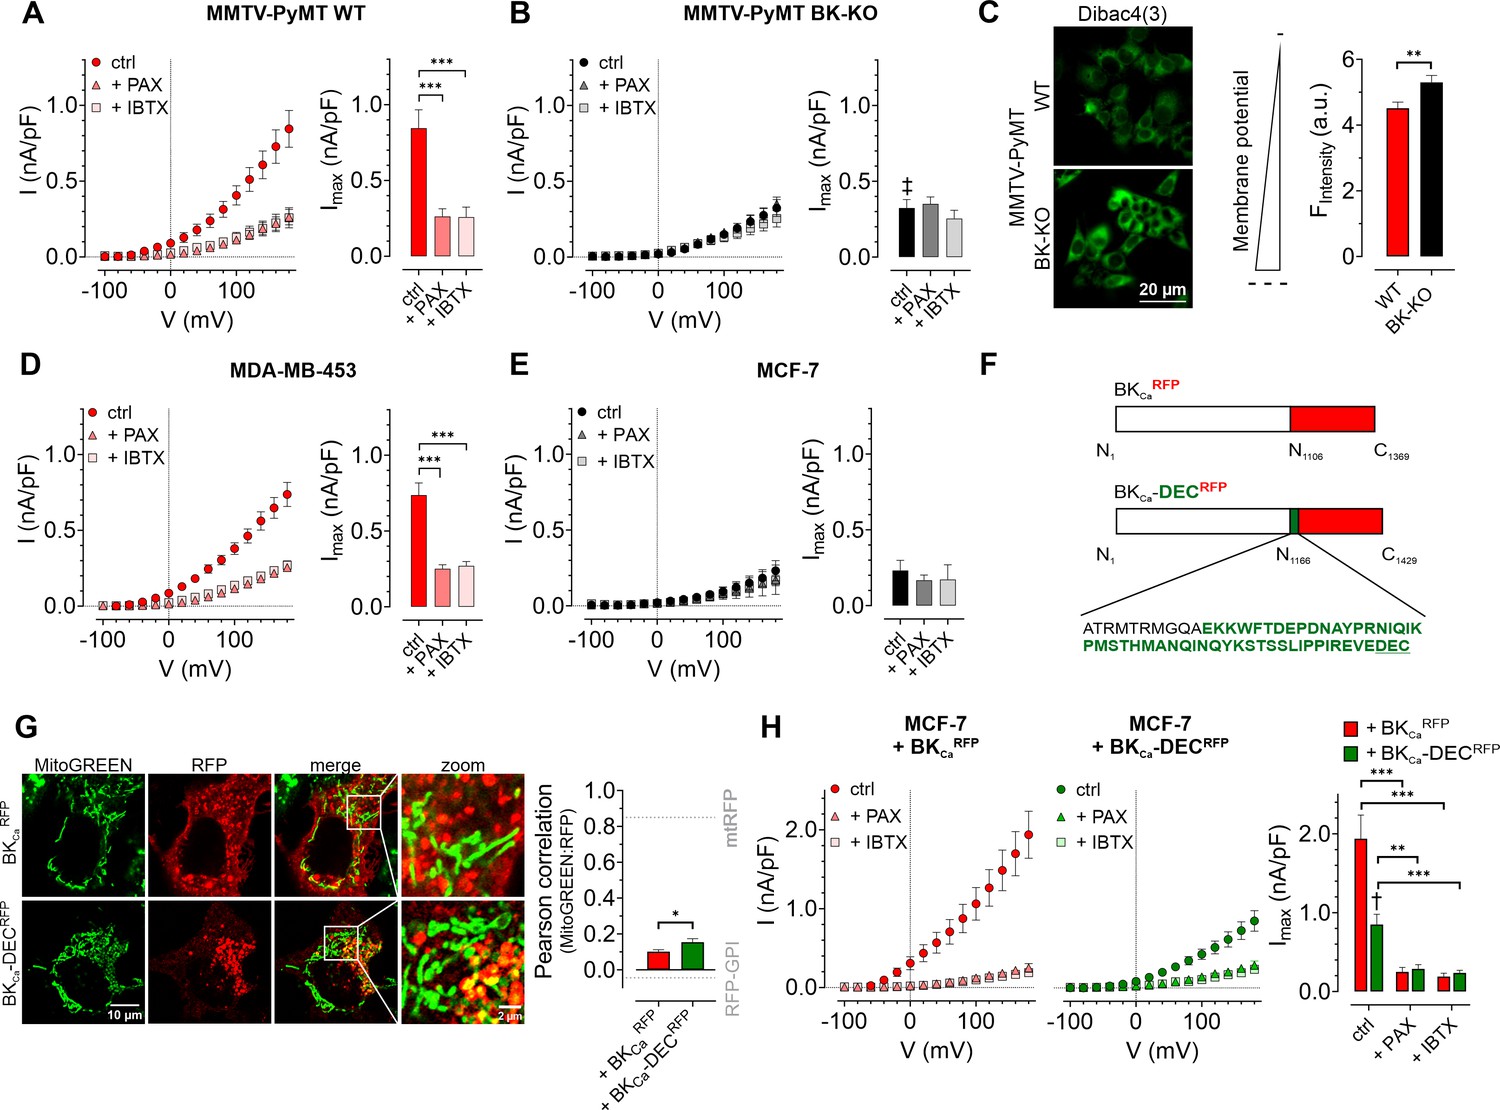
Characterization of BKCa channels in murine and human BCCs.
(A, B) I-V curves (left) and corresponding maximal currents (right) of MMTV-PyMT WT (A) and MMTV-PyMT BK-KO (B) cells, either under control conditions, or in the presence of paxilline or iberiotoxin. Data represents average ± SEM. n (cells) = 15 WT ctrl, 17 WT +PAX, 17 WT +IBTX, 16 BK-KO ctrl, 17 BK-KO +PAX, 19 BK-KO +IBTX. ***p≤0.001, Brown-Forsythe and Welch ANOVA test followed by Games-Howell’s multiple comparison test. ‡P≤0.001 compared to respective WT condition, Welch’s t-test. (C) Representative fluorescence images (left) and statistics (right) of MMTV-PyMT WT and BK-KO cells loaded with the ΔΨPM sensitive dye Dibac4(3). N = 6 independent experiments, **p≤0.01, Unpaired t-test. (D) I-V curves (left) and maximal currents (right) of MDA-MB-453 cells, either under control conditions, or in the presence of paxilline or iberiotoxin. Data represents average ± SEM. n (cells) = 30 ctrl, 22 +PAX, 24 +IBTX. ***p≤0.001, Kruskal-Wallis test followed by Dunn’s multiple comparison test. (E) I-V curves (left) and maximal currents (right) of MCF-7 cells, either under control conditions, or in the presence of paxilline or iberiotoxin. Data shows average ± SEM. n (cells) = 16 ctrl, 20 +PAX, 15 +IBTX. (F) Schematic representation of constructs used for over-expression in MCF-7 cells. The DEC exon is indicated in green. (G) Representative images (left) of MCF-7 cells either expressing BKCaRFP (upper) or BKCa-DECRFP (lower), additionally stained with MitoGREEN. Average Pearson correlations ± SEM of MitoGREEN and RFP of BKCa or BKCa-DEC are shown. n (cells) = 17 BKCa-RFP, 22 BKCa-DECRFP. *p≤0.05, Unpaired t-test. (H) I-V curves (left and middle) and corresponding maximal currents (right) of MCF-7 cells expressing BKCaRFP (left) or BKCa-DECRFP (middle), respectively, either under control conditions, or in the presence of paxilline or iberiotoxin. Data represents average ± SEM. n (cells) = 18 BKCaRFP ctrl, 14 BKCaRFP +PAX, 19 BKCaRFP +IBTX, 18 BKCa-DECRFP ctrl, 21 BKCa-DECRFP +PAX, 18 BKCa-DECRFP +IBTX. **P≤0.01, ***p≤0.001, Brown-Forsythe and Welch ANOVA test followed by Games-Howell’s multiple comparison test. †p≤0.01 between ctrl conditions, Welch’s t-test.
-
Figure 1—source data 1
Numerical values underlying the data shown in Figure 1.
- https://cdn.elifesciences.org/articles/92511/elife-92511-fig1-data1-v1.xlsx
Figure 1—figure supplement 1
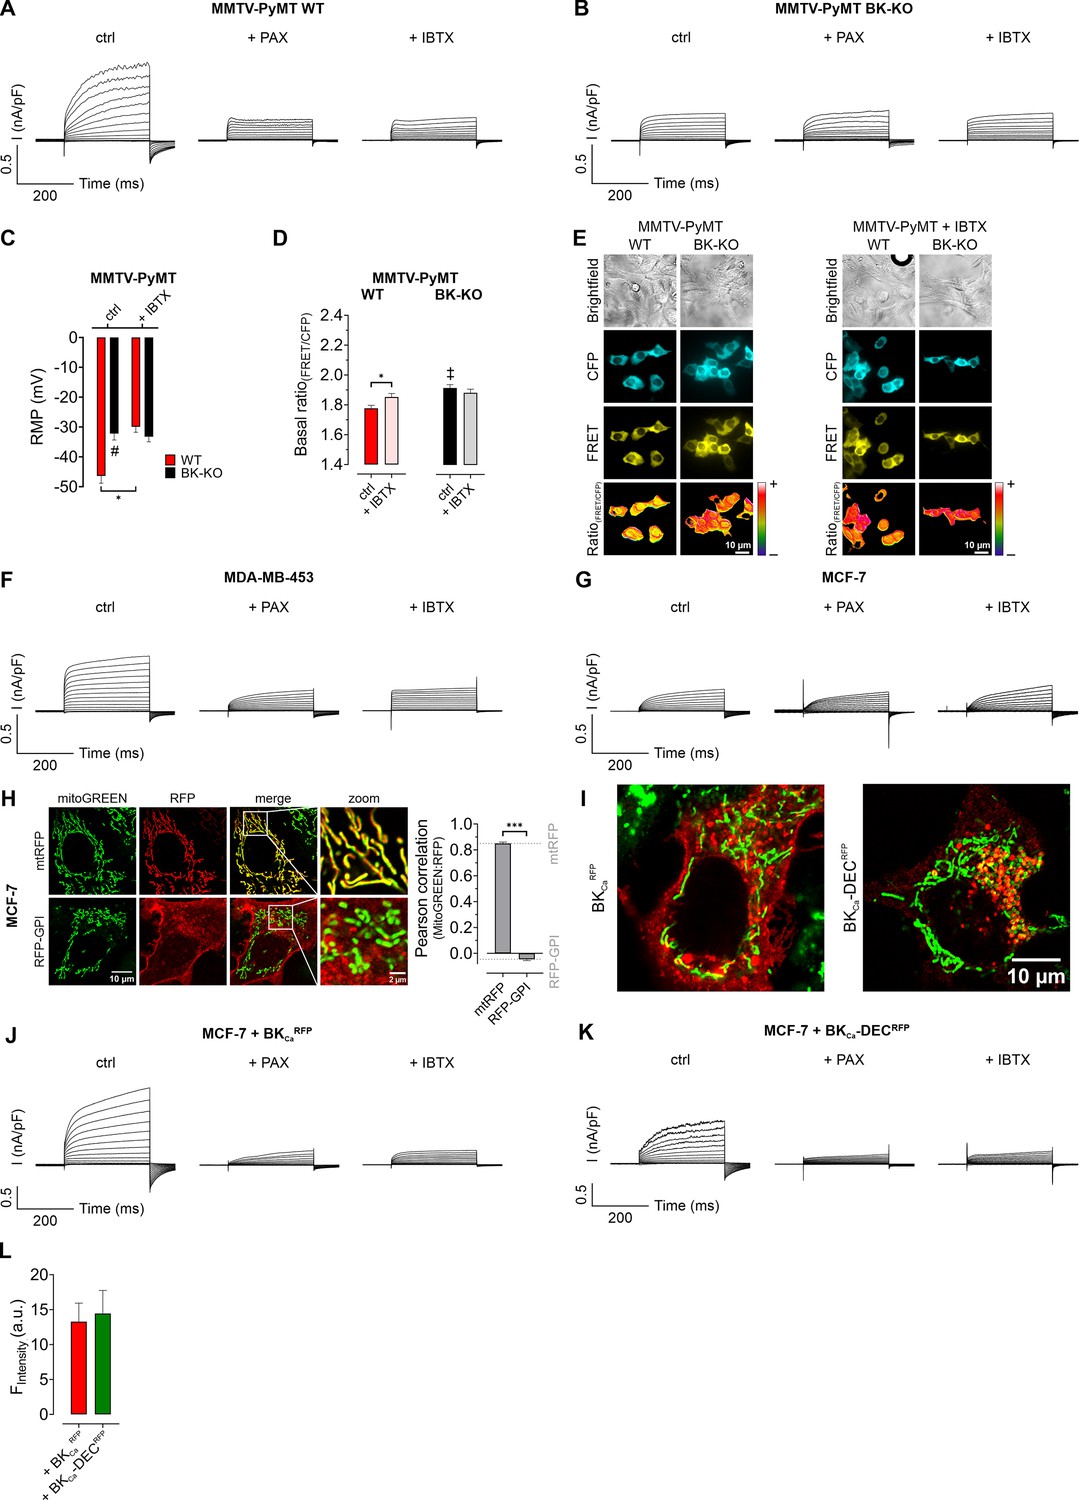
Representative whole-cell patch-clamp traces and colocalization analysis in BCCs.
(A, B) Representative whole-cell patch-clamp traces of MMTV-PyMT WT (A) and MMTV-PyMT BK-KO cells (B), either under control conditions (ctrl), or in the presence of 5 µM paxilline (+PAX) or 30 nM iberiotoxin (+IBTX), respectively, as indicated in the panels. (C) Resting membrane potential (RMP) ± SEM of MMTV-PyMT WT (red) and BK-KO cells (black) in mV as measured using the current-clamp mode during patch-clamp experiments. Cells were either analyzed under control conditions (ctrl, left bars), or in the presence of 30 nM iberiotoxin (+IBTX, right bars). n (cells) = 9 for WT ctrl and WT + IBTX, 8 for BK-KO ctrl, 10 for BK-KO +IBTX. *p≤0.05, #p≤0.05 compared to respective WT condition. Statistical analysis was performed using Kruskal-Wallis test followed by Dunn’s multiple comparison test. (D) Basal FRET-ratio values ± SEM of MMTV-PyMT WT (left panel) and MMTV-PyMT BK-KO cells (right panel) expressing NES lc-LysM GEPII 1.0, a cytosolic K+ sensor. Experiments were either performed under control conditions (ctrl) or in the presence of 30 nM iberiotoxin (+IBTX). N (independent experiments) / n (cells analyzed) = 4/62 WT ctrl, 4/50 WT+IBTX, 4/35 BK-KO ctrl, 4/36 BK-KO +IBTX. *p≤0.05. ‡p≤0.001 compared to respective WT condition, Unpaired t-test (WT) or Mann-Whitney test (BK-KO and WT ctrl vs. BK-KO ctrl). (E) Representative images of MMTV-PyMT WT and MMTV-PyMT BK-KO cells, either under control conditions (left panel) or in the presence of 30 nM iberiotoxin (+IBTX, right panel). Brightfield images (top row), cyan fluorescence (second row), FRET (third row) and pseudocolored FRET-ratio images (fourth row) are demonstrated. (F, G) Representative whole-cell patch-clamp traces of MDA-MB-453 cells (F) and MCF-7 cells (G), either under control conditions (ctrl), or in the presence of 5 µM paxilline (+PAX) or 30 nM iberiotoxin (+IBTX), respectively, as indicated in the panels. (H) Representative images (left) of MCF-7 cells either expressing a mitochondrial targeted red fluorescent protein (mtRFP, upper images, second column) or a red fluorescent protein fused to a glycosylphosphatidylinositol (GPI)-anchor (RFP-GPI, lower images, second column). Cells were additionally stained with MitoGREEN for visualization of mitochondria (first column). Merge of the channels (third column) and a zoom (fourth column) are demonstrated. Right panel shows average Pearson correlation ± SEM of MitoGREEN and RFP of mtRFP (left bar) or RFP-GPI (right bar). Grey dashed lines indicate average colocalization scores of MitoGREEN and RFP of mtRFP and RFP-GPI, which is also shown in Figure 1G. n (cells) = 18 for mtRFP and 16 for RFP-GPI. ***p≤0.001 Unpaired t-test. (I) Representative images of MCF-7 cells either expressing BKCaRFP (left image) or BKCa-DECRFP (right image) additionally stained with MitoGREEN to visualize mitochondria. Images represent larger versions of the exact same images shown in Figure 1G. (J, K) Representative whole-cell patch-clamp traces of MCF-7 cells either expressing BKCaRFP (J) or BKCa-DECRFP (K) either under control conditions (ctrl, left panels), or in the presence of 5 µM paxilline (+PAX, middle panels) or 30 nM iberiotoxin (+IBTX, right panels). (L) Global cellular RFP-fluorescence intensities of MCF-7 cells used for patch-clamp experiments. Cells either expressed BKCaRFP (red bar) or BKCa-DECRFP (green bar). Data represents average ± SEM of 18 cells for both conditions.
-
Figure 1—figure supplement 1—source data 1
Numerical values underlying the data shown in Figure 1.
- https://cdn.elifesciences.org/articles/92511/elife-92511-fig1-figsupp1-data1-v1.xlsx
Figure 2 with 1 supplement
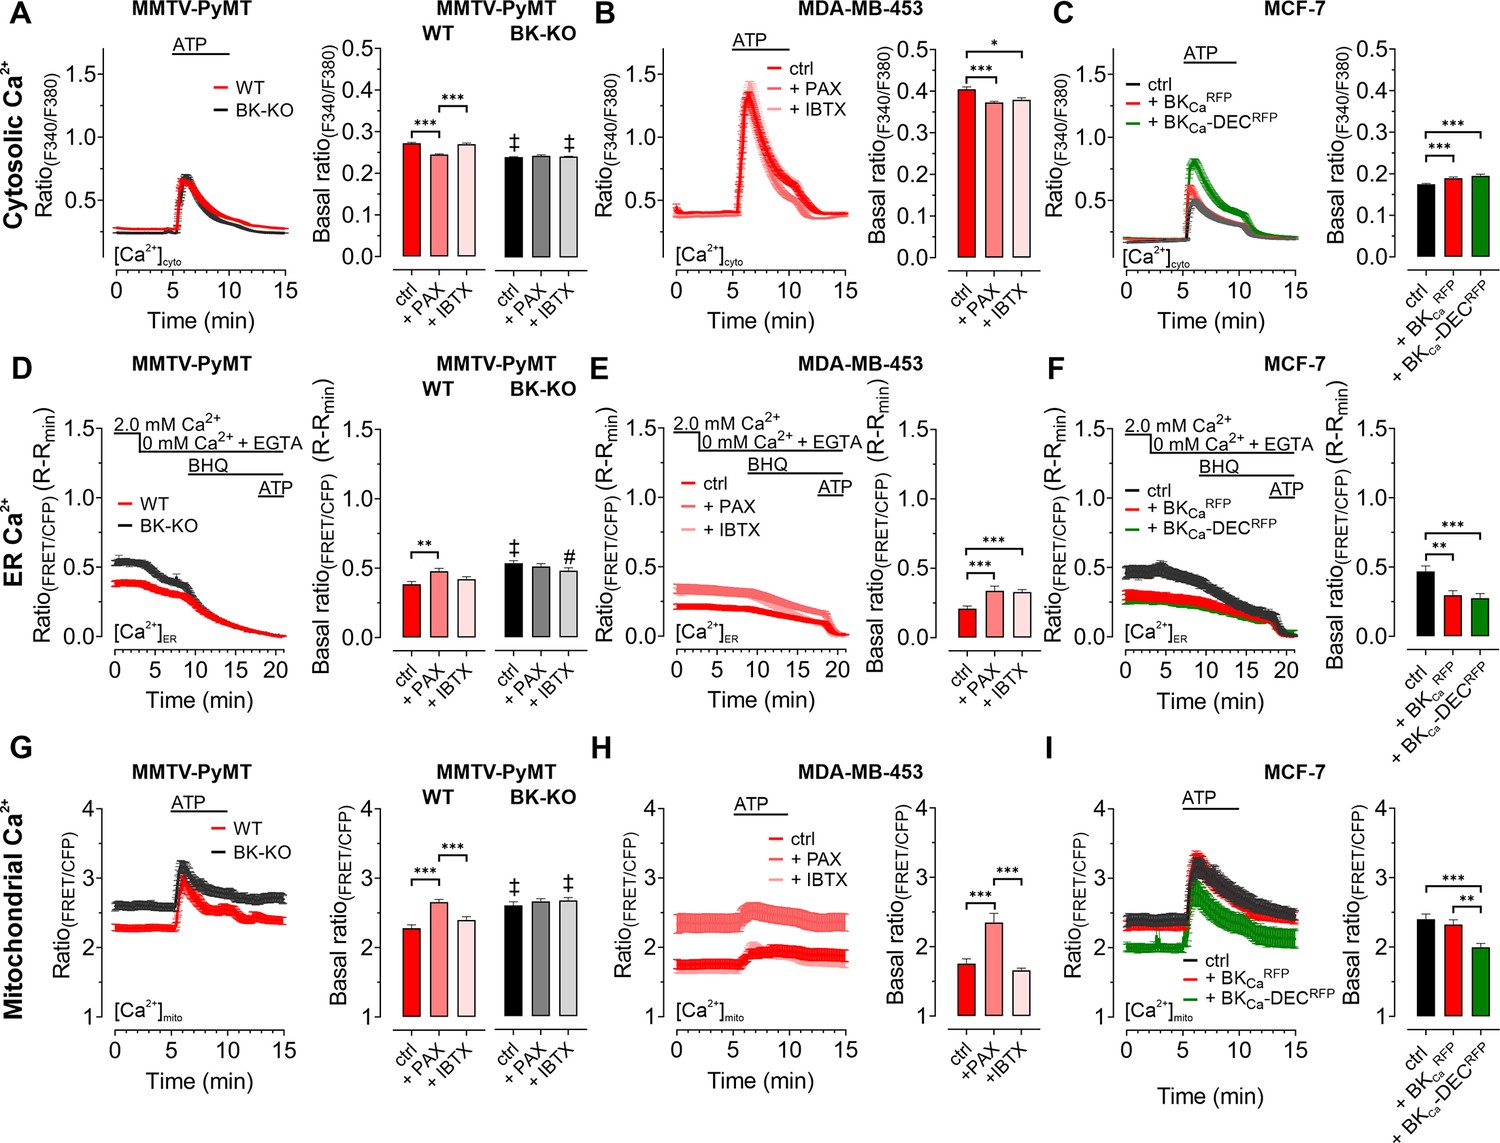
BKCa modulates the subcellular Ca2+ homeostasis in BCCs.
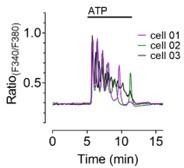
Cytosolic (A – C), endoplasmic reticulum (ER) (D – F), and mitochondrial Ca2+ dynamics (G – I) over-time of MMTV-PyMT WT and MMTV-PyMT BK-KO cells (A, D, G), MDA-MB-453 cells (B, E, H) or MCF-7 cells (C, F, I). All data represent average ± SEM. At time points indicated in the panels, cytosolic and mitochondrial Ca2+ alterations were evoked by extracellular stimulation with ATP (A – C, G – I), or by Ca2+ depletion of the ER using Ca2+-free buffer containing the Ca2+ chelator EGTA, followed by administration of the SERCA inhibitor BHQ prior to ATP administration (D – F). MMTV-PyMT (A, D, G) and MDA-MB-453 (B, E, H) cells were either measured under control conditions, or in the presence of paxilline (+PAX) or iberiotoxin (+IBTX). MCF-7 cells (C, F, I) either expressed an RFP (ctrl), BKCaRFP, or BKCa-DECRFP. N (independent experiments) / n (cells analyzed) = (A): 17/784 WT ctrl, 18/857 BK-KO ctrl, 6/300 WT +PAX, 6/300 BK-KO +PAX, 5/318 WT +IBTX, 5/304 BK-KO +IBTX, (B): 4/151 ctrl, 4/132 +PAX, 4/87 +IBTX, (C): 5/111 ctrl, 5/117 +BKCaRFP, 5/91 +BKCa-DECRFP, (D): 14/116 WT ctrl, 13/117 BK-KO ctrl, 8/71 WT +PAX, 8/92 BK-KO +PAX, 6/102 WT +IBTX, 6/86 BK-KO +IBTX, (E): 7/44 ctrl, 9/34 +PAX, 5/49 +IBTX, (F): 4/25 ctrl, 4/35 +BKCaRFP, 4/38 +BKCa-DECRFP, (G): 11/47 WT ctrl, 12/86 BK-KO ctrl, 6/46 WT +PAX, 6/58 BK-KO +PAX, 5/59 WT +IBTX, 4/43 BK-KO +IBTX, (H): 8/33 ctrl, 8/28 +PAX, 5/22 +IBTX, (I): 5/28 ctrl, 4/27 +BKCaRFP, 4/24 +BKCa-DECRFP. **p≤0.01, ***p≤0.001. Kruskal-Wallis test followed by Dunn’s MC test (A, B, C, D, I), One-Way ANOVA test followed by Tukey’s MC test (E, F, G) or Brown-Forsythe ANOVA test followed by Games-Howell’s MC test (H). #p≤0.05, ‡p≤0.001 compared to respective WT condition, Mann-Whitney test (A, D) ctrl in (G) or Welch’s t test (+IBTX in G).
-
Figure 2—source data 1
Numerical values underlying the data shown in Figure 2.
- https://cdn.elifesciences.org/articles/92511/elife-92511-fig2-data1-v1.xlsx
Figure 2—figure supplement 1
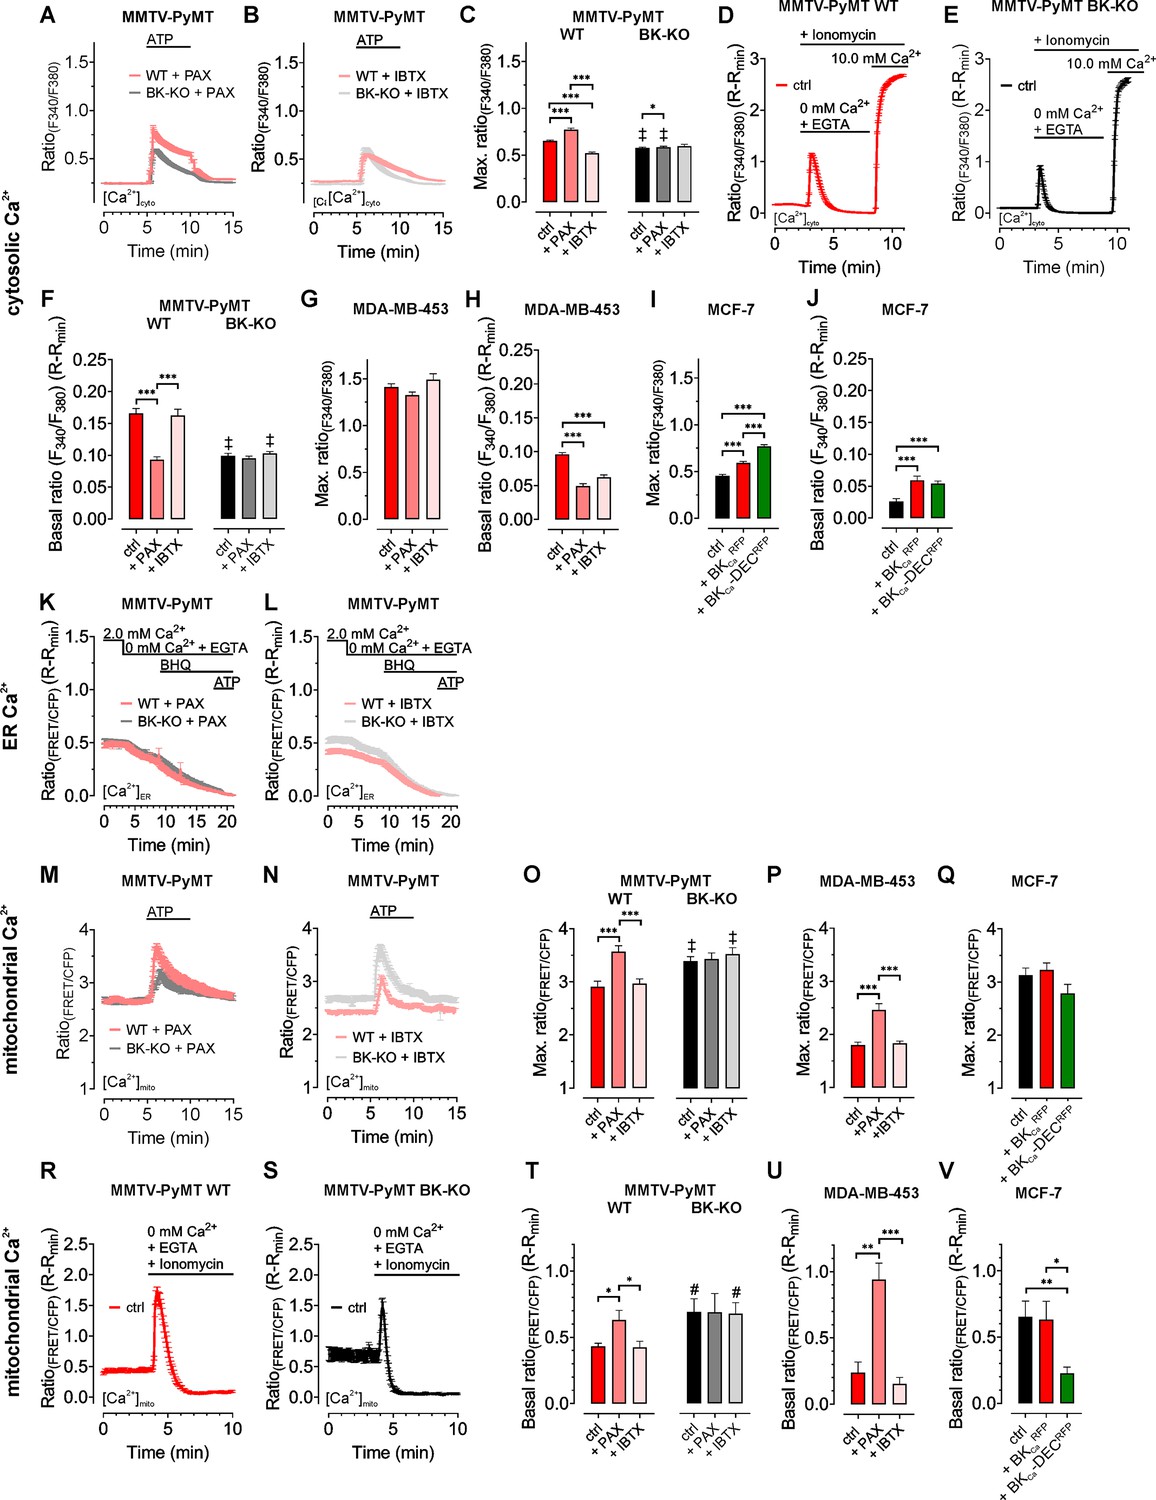
Cytosolic-, ER-, and mitochondrial Ca2+ homeostasis is altered by functional BKCa expression in BCCs.
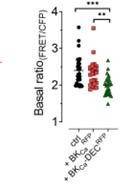
(A, B) Fura-2 ratio signals (F340/F380) of MMTV-PyMT WT or BK-KO cells over-time in response to cell stimulation with 100 µM ATP. Experiments were either performed in the presence of 5 µM paxilline (A) or 30 nM iberiotoxin (B). (C, G, I) Maximal fura-2 ratio signals of MMTV-PyMT WT and BK-KO (C), MDA-MB-453 (G) or MCF-7 cells (I) upon stimulation with 100 µM ATP, under control conditions, in the presence of 5 µM paxilline or 30 nM iberiotoxin (C, G), or upon expression of BKCaRFP or BKCa-DECRFP (I). (D, E) Fura-2 ratio signals ± SEM over-time of MMTV-PyMT WT and BK-KO cells. At time points indicated in the panels, cells were treated with 5 µM ionomycin for Ca2+ permeabilization, Ca2+ was removed and chelated using EGTA, or 10.0 mM of Ca2+ were re-added for Fura-2 saturation. (F, H, J) Basal Fura-2 ratio signals (R-Rmin) ± SEM of MMTV-PyMT WT and BK-KO cells (F), MDA-MB-453 (H) and MCF-7 cells (J) received from experiments as demonstrated in (D) and (E). (K, L) FRET-ratio signals over-time of MMTV-PyMT WT and BK-KO cells expressing D1ER, a FRET-based ER Ca2+ sensor. Throughout the experiments, either 5 µM paxilline (F) or 30 nM iberiotoxin (G) were present. (M, N) [Ca2+]mito over-time of MMTV-PyMT WT or BK-KO cells in response to cell stimulation with 100 µM ATP. [Ca2+]mito was assessed using 4mtD3cpV, a FRET-based Ca2+ indicator targeted to the mitochondrial matrix. Experiments were either performed in the presence of 5 µM paxilline (M) or 30 nM iberiotoxin (N). (O – Q) Maximal FRET-ratio (FRET/CFP) signals received upon stimulation of MMTV-PyMT WT or BK-KO (O), MDA-MB-453 (P) or MCF-7 cells (Q) with 100 µM ATP. Experiments were either performed under control conditions, in the presence of 5 µM paxilline or 30 nM iberiotoxin (O, P), or upon expression of BKCaRFP or BKCa-DECRFP (Q). (R, S) FRET-ratio signals over-time of MMTV-PyMT WT and BK-KO cells expressing 4mtD3cpV, a FRET-based mitochondrial Ca2+ sensor. At time point indicated in the panels, cells were treated with 5 µM ionomycin for Ca2+ permeabilization, and Ca2+ was removed and chelated using EGTA. (T – V) Basal FRET-ratio signals (R-Rmin) of MMTV-PyMT WT and BK-KO cells (T), MDA-MB-453 (U) and MCF-7 cells expressing 4mtD3cpV (V) received from experiments as demonstrated in (R) and (S). All data represent average ± SEM. N (independent experiments) / n (cells analyzed) = (A): 6/300 WT +PAX, 6/300 BK-KO +PAX, (B): 5/318 WT +IBTX, 5/304 BK-KO +IBTX, (C): 17/784 WT ctrl, 18/857 BK-KO ctrl, 6/300 WT +PAX, 6/300 BK-KO +PAX, 5/318 WT +IBTX, 5/304 BK-KO +IBTX, (D): 3/109 WT ctrl, (E): 3/93 BK-KO ctrl, (F): 3/109 WT ctrl, 3/110 WT +PAX, 3/123 WT +IBTX, 3/93 BK-KO ctrl, 3/94 BK-KO +PAX, 3/111 BK-KO +IBTX, (G): 4/151 ctrl, 4/132 +PAX, 4/87 +IBTX, (H): 3/106 ctrl, 3/107 +PAX, 3/109 +IBTX, (I): 5/111 ctrl, 5/117 +BKCaRFP, 5/91 +BKCa-DECRFP, (J): 4/53 ctrl, 5/34 +BKCaRFP, 5/36 +BKCa-DECRFP, (K): 8/71 WT +PAX, 8/92 BK-KO +PAX, (L): 6/102 WT +IBTX, 6/86 BK-KO +IBTX, (M): 6/46 WT +PAX, 6/58 BK-KO +PAX, (N): 5/59 WT +IBTX, 4/43 BK-KO +IBTX, (O): 11/47 WT ctrl, , 6/46 WT +PAX, 5/59 WT +IBTX, 12/86 BK-KO ctrl, 6/58 BK-KO +PAX, 4/43 BK-KO +IBTX, (P): 8/33 ctrl, 8/28 +PAX, 5/22 +IBTX, (Q): 5/28 ctrl, 4/27 +BKCaRFP, 4/24 +BKCa-DECRFP, (R): 3/19 WT ctrl, (S): 3/12 BK-KO ctrl, (T): 3/19 WT ctrl, 3/23 WT +PAX, 3/22 WT +IBTX, 3/12 BK-KO ctrl, 3/17 BK-KO +PAX, 3/14 BK-KO +IBTX, (U): 6/16 ctrl, 6/19 +PAX, 6/19 +IBTX, (V): 5/21 ctrl, 4/10 +BKCaRFP, 4/11 +BKCa-DECRFP. *p≤0.05, **p≤0.01, ***p≤0.001, Kruskal-Wallis test followed by Dunn’s MC test (C, H, I, J, T, U), One-Way ANOVA test followed by Tukey’s MC test (I, O) or Brown-Forsythe and Welch ANOVA test followed by Games-Howell’s MC test (P, V). #p≤0.05, ‡p≤0.001 compared to respective WT condition, Mann-Whitney test (H, O, ctrl in C, +IBTX in T), Welch’s t-test (+PAX in C, ctrl in T). Unpaired t-test (+IBTX in O).
-
Figure 2—figure supplement 1—source data 1
Numerical values underlying the data shown in Figure 2.
- https://cdn.elifesciences.org/articles/92511/elife-92511-fig2-figsupp1-data1-v1.xlsx
Figure 3 with 1 supplement
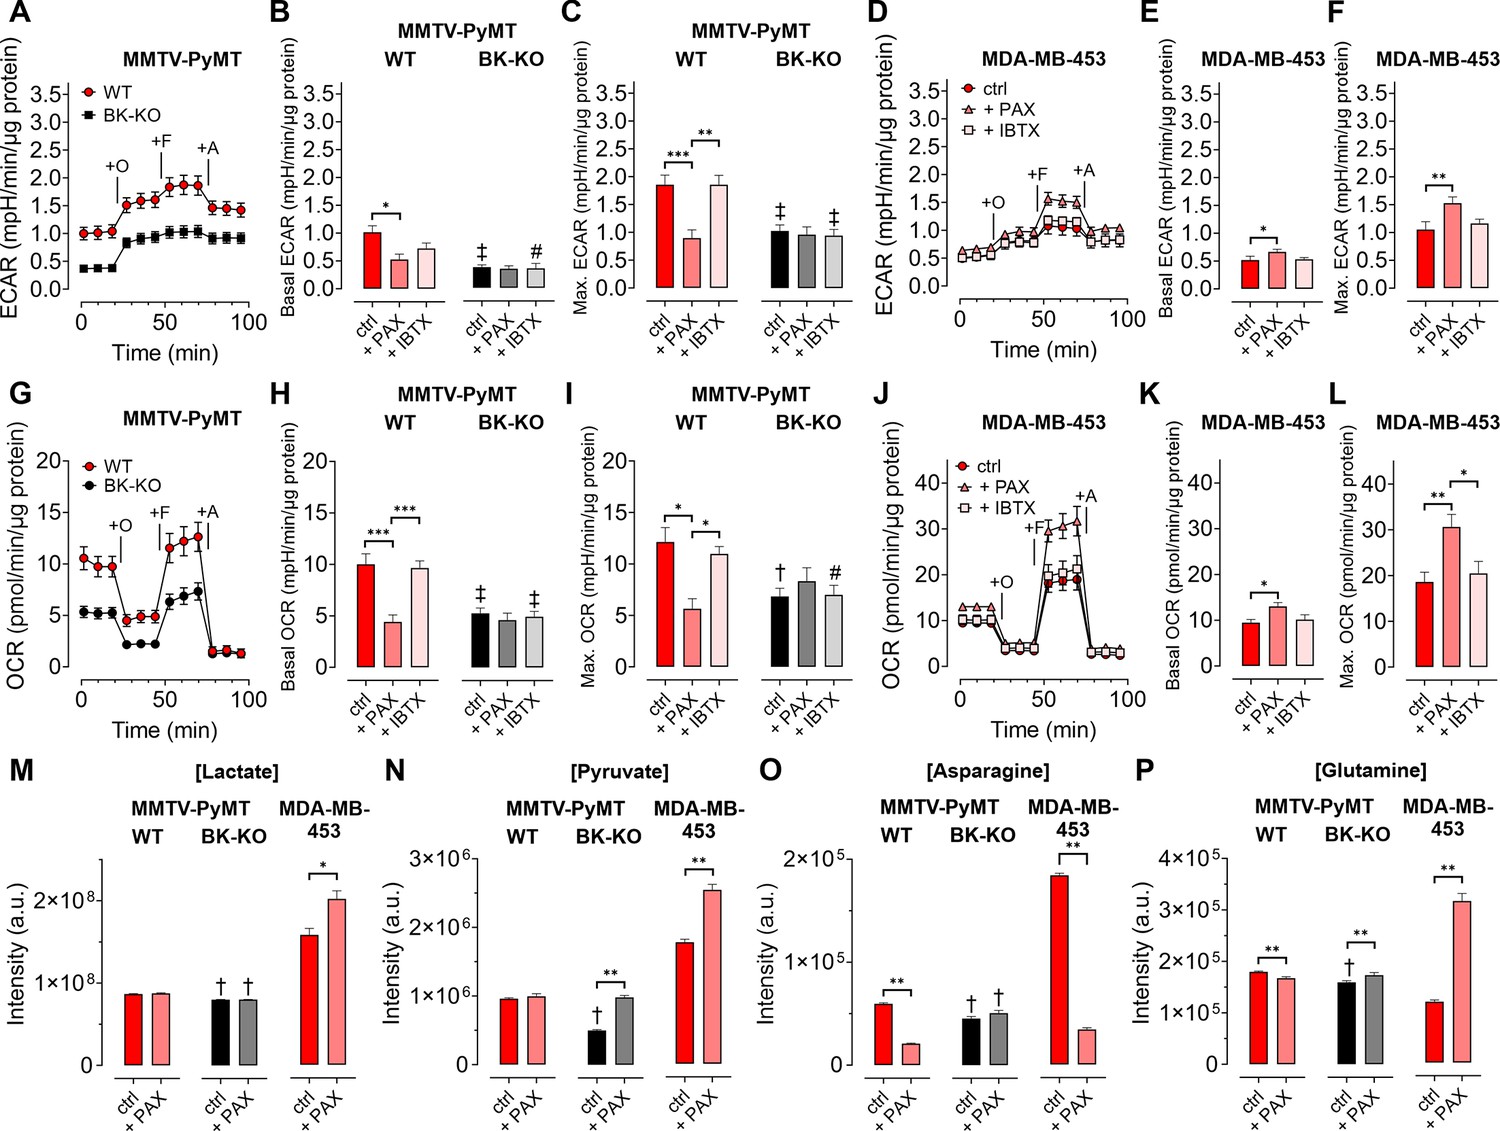
BKCa channels alter the metabolic activity of BCCs.
(A, D) Average ECAR over-time ± SEM of MMTV-PyMT WT (A, red) and BK-KO cells (A, black), or MDA-MB-453 cells (D) in response to administration of Oligomycin-A (+O), FCCP (+F) and Antimycin-A (+A) at time points indicated. (B, E) Average basal and (C, F) maximal ECAR ± SEM of MMTV-PyMT WT (B, C, left) and BK-KO cells (B, C, right), or MDA-MB-453 cells (E, F) under control conditions, or in the presence of paxilline or iberiotoxin. (G, J) Average OCR over-time ± SEM of MMTV-PyMT WT (G, red) and BK-KO cells (G, black), or MDA-MB-453 cells (J) in response to administration of Oligomycin-A (+O), FCCP (+F) and Antimycin-A (+A) at time points indicated. (H, K) Average basal and (I, L) maximal OCR ± SEM of MMTV-PyMT WT (H, I, left) and BK-KO cells (H, I, right), or MDA-MB-453 cells (K, L) under control conditions, or in the presence of paxilline or iberiotoxin. (M – P) LC-MS-based determination of major glycolytic and mitochondrial metabolites in particular Lactate [Lactate]; (M), Pyruvate [Pyruvate]; (N), Asparagine [Asparagine]; (O), and Glutamine [Glutamine]; (P), of MMTV-PyMT WT (left panels), BK-KO (middle panels) and MDA-MB-453 cells (right panels), either under control conditions or after cell cultivation with paxilline. N (independent experiments) = (A, B, C, G, H, I): 7 WT ctrl and BK-KO, 3 for all others, (D, E, F, J, K, L): 3 for all, (M – P): 7 for BK-KO ctrl, 6 for all others. *p≤0.05, **p≤0.01, ***p≤0.001, Kruskal-Wallis test followed by Dunn’s MC test (B, E, F, I), Brown-Forsythe and Welch ANOVA test followed by Games-Howell’s MC test (C, H), One-Way ANOVA test followed by Tukey’s MC test (K, L) or Mann-Whitney test (M – P). #p≤0.05, †p≤0.01, ‡p≤0.001, to respective WT condition, Mann-Whitney test (B, C) +IBTX in (I), (M – P), Welch’s t-test (ctrl in H) and (I) or Unpaired t-test (+IBTX in H).
-
Figure 3—source data 1
Numerical values underlying the data shown in Figure 3.
- https://cdn.elifesciences.org/articles/92511/elife-92511-fig3-data1-v1.xlsx
Figure 3—figure supplement 1
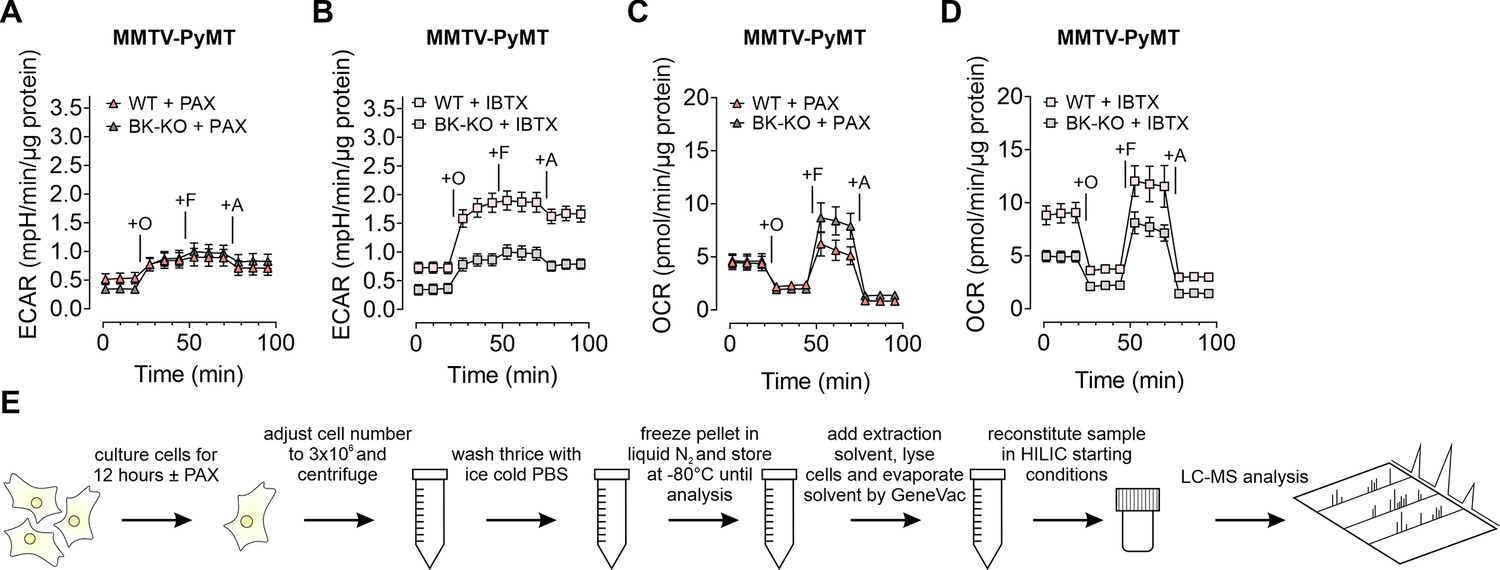
Paxilline and iberiotoxin differentially modulate ECAR and OCR in MMTV-PyMT WT and BK-KO cells.
(A, B) Average ECAR over-time ± SEM of MMTV-PyMT WT (bright red and salmon) and BK-KO cells (dark and bright grey) in response to administration of Oligomycin-A (+O), FCCP (+F) and Antimycin-A (+A) at time points indicated in the panel. Experiments were either performed in the presence of 5 µM paxilline (A) or 30 nM iberiotoxin (B). N = 3 for all. (C, D) Average OCR over-time ± SEM of MMTV-PyMT WT (bright red and salmon) and BK-KO cells (dark and bright grey) in response to administration of Oligomycin-A (+O), FCCP (+F) and Antimycin-A (+A) at time points indicated in the panel. Experiments were either performed in the presence of paxilline (C) or iberiotoxin (D). N = 3 for all. (E) Schematic representation of the workflow for LC-MS-based metabolomics. HILIC: Hydrophilic interaction liquid chromatography.
-
Figure 3—figure supplement 1—source data 1
Numerical values underlying the data shown in Figure 3.
- https://cdn.elifesciences.org/articles/92511/elife-92511-fig3-figsupp1-data1-v1.xlsx
Figure 4 with 1 supplement
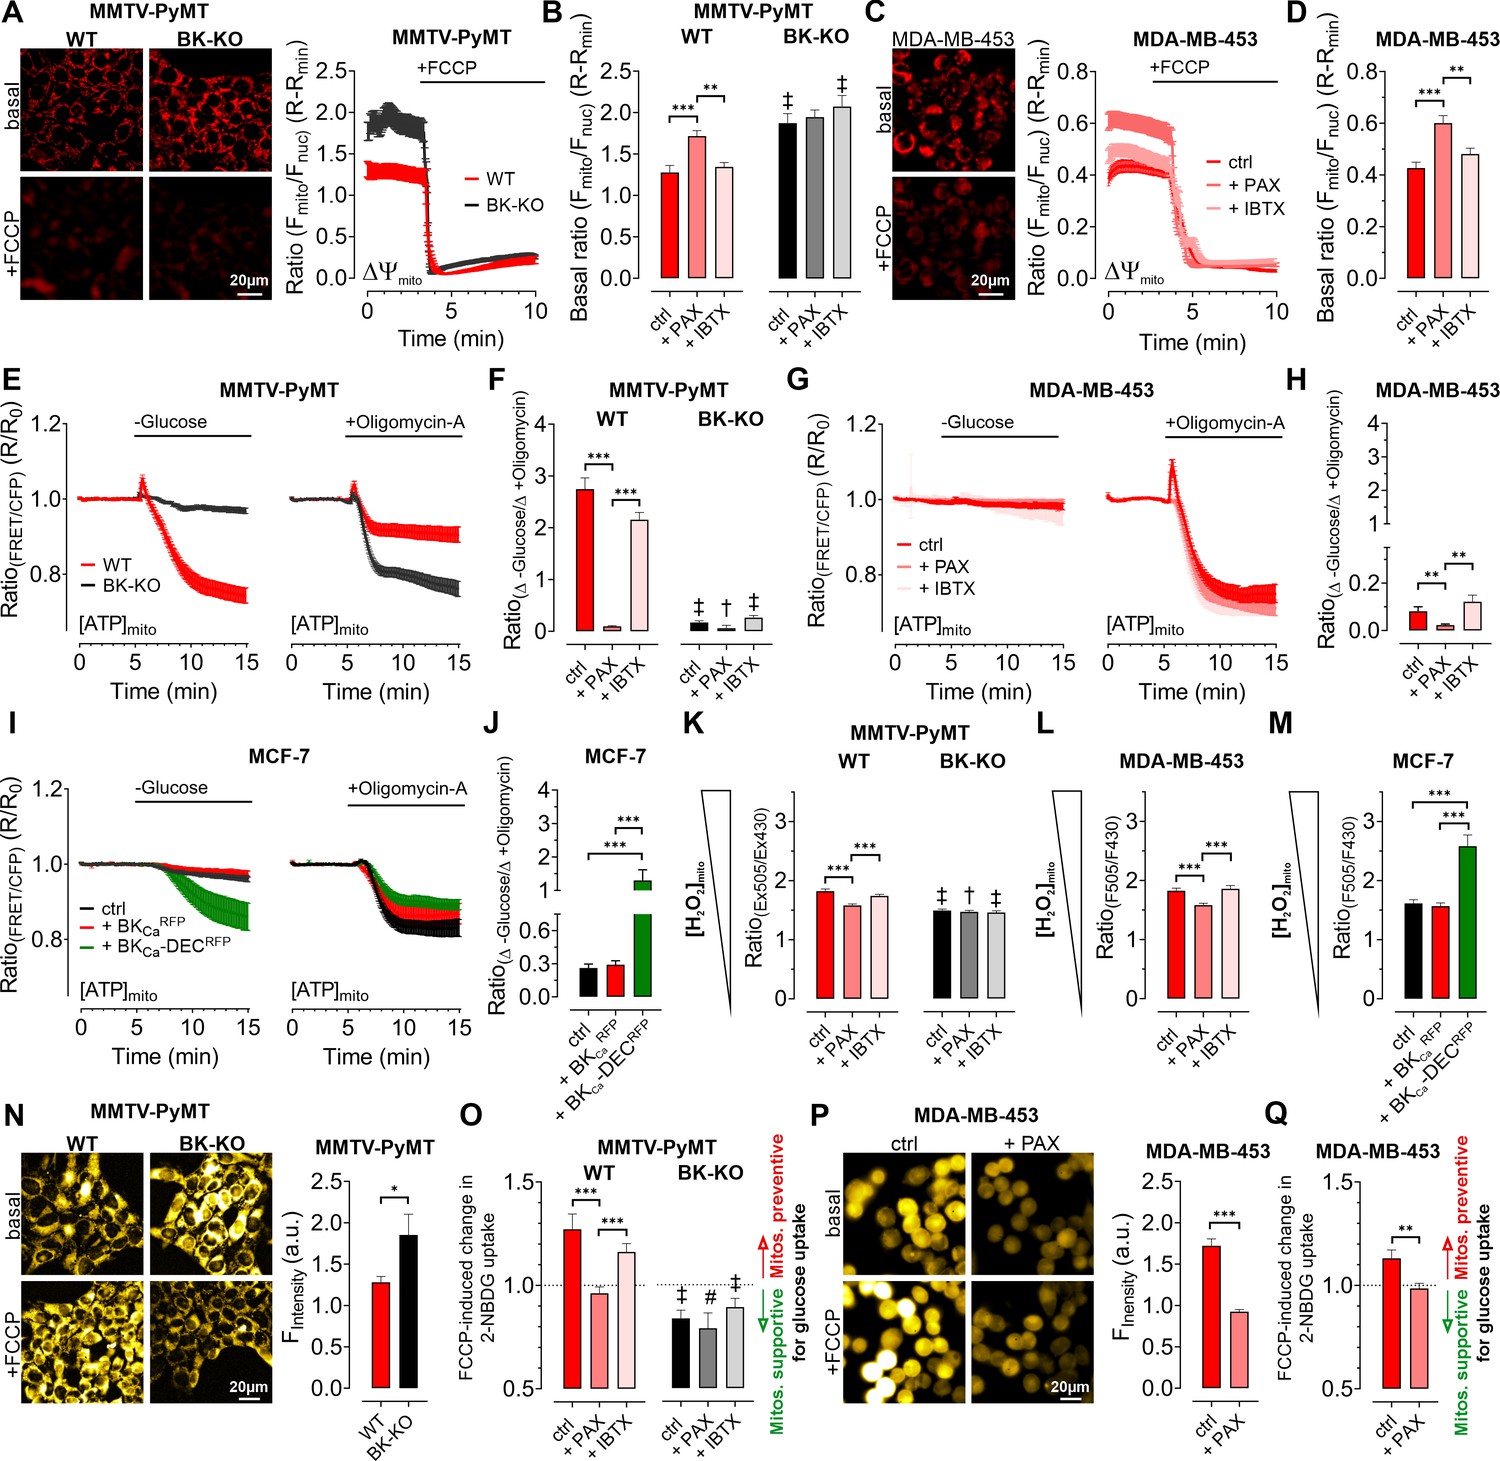
Expression of BKCa modulates mitochondrial function and glucose uptake of BCCs.
(A – D) Representative fluorescence images and -ratios (Fmito/Fnuc) over-time (A, C), and corresponding statistics ± SEM (B, D) representing ΔΨmito of TMRM-loaded MMTV-PyMT WT and BK-KO (A, B) and MDA-MB-453 cells (C, D) under basal conditions (A, C, upper images) and upon administration of FCCP for mitochondrial depolarization (A, C, lower images). (E – J) [ATP]mito dynamics ± SEM over-time of MMTV-PyMT WT and BK-KO cells (E), MDA-MB-453 cells (G) and MCF-7 cells (I) in response to extracellular glucose removal (left panels) or upon administration of Oligomycin-A (right panels). (F, H) and (J) show changes of [ATP]mito induced by glucose removal to Oligomycin-A administration ± SEM, under control conditions, or in the presence of paxilline or iberiotoxin (F, H), or upon expression of BKCaRFP or BKCa-DECRFP (J). (K – M) Basal mitochondrial H2O2 concentrations ± SEM of MMTV-PyMT WT (K, left), BK-KO (K, right), MDA-MB-453 (L) and MCF-7 cells (M), either under control conditions, in the presence of paxilline or iberiotoxin (K, L), or upon expression of BKCaRFP or BKCa-DECRFP (M). (N, P) Representative fluorescence wide-field images (left) and corresponding statistics ± SEM (right) of MMTV-PyMT WT (N, left images and red bars) and BK-KO cells (N, right images and black bars) or MDA-MB-453 cells (P) incubated with 2-NBDG, either in the absence (upper images) or presence of FCCP (lower images). (O, Q) Average ± SEM of FCCP induced change in 2-NBDG uptake of MMTV-PyMT WT (O, left) and BK-KO cells (O, right), or MDA-MB-453 cells (Q) either under control conditions, or in the presence of paxilline or iberiotoxin. Values above 1 indicate that mitochondria prevent, values below 1 that mitochondria support glucose uptake. N (independent experiments) / n (cells analyzed) = (A, B): 4/75 WT ctrl, 4/90 WT +PAX, 4/86 WT +IBTX, 4/91 BK-KO ctrl, 4/89 BK-KO +PAX, 4/100 BK-KO +IBTX, (C, D): 4/113 ctrl, 4/97+PAX, 4/103+IBTX, (E, F): [-Glucose]: 8/55 WT ctrl, 6/45 WT +PAX, 7/27 WT +IBTX, 8/65 BK-KO ctrl, 6/57 BK-KO +PAX, 7/28 BK-KO +IBTX, [+Oligomycin-A]: 11/52 WT ctrl, 7/53 WT +PAX, 7/34 WT +IBTX, 8/87 BK-KO ctrl, 6/35 BK-KO +PAX, 5/45 BK-KO +IBTX. (G, H): [-Glucose]: 5/14 ctrl, 3/13+PAX, 5/13+IBTX, [+Oligomycin-A]: 5/33 ctrl, 3/21+PAX, 8/27+IBTX, (I, J): [-Glucose]: 6/48 ctrl, 5/23+BKCaRFP, 5/20+BKCa-DECRFP, [+Oligomycin-A]: 5/27 ctrl, 5/23+BKCaRFP, 5/37+BKCa-DECRFP, (K): 3/33 WT ctrl, 4/51 WT +PAX, 4/54 WT +IBTX, 4/55 BK-KO ctrl, 4/51 BK-KO +PAX, 4/54 BK-KO +IBTX, (L): 4/31 ctrl, 4/39+PAX, 4/31+IBTX, (M): 4/29 ctrl, 4/17+BKCaRFP, 4/21+BKCa-DECRFP, (N – Q): 4 for all. *p≤0.05, **p≤0.01, ***p≤0.001, Kruskal-Wallis test followed by Dunn’s MC test (B, D, F, H, J, K, O), Brown-Forsythe and Welch ANOVA test followed by Games-Howell’s MC test (L, M), Mann-Whitney test (N), Unpaired t-test (P) or Welch’s t-test (Q). #p≤0.05, †p≤0.01, ‡p≤0.001, to respective WT condition, Mann-Whitney test (B, F) +PAX and+IBTX in (K) ctrl in (O), Unpaired t-test (ctrl in K) +PAX and+IBTX in (O).
-
Figure 4—source data 1
Numerical values underlying the data shown in Figure 4.
- https://cdn.elifesciences.org/articles/92511/elife-92511-fig4-data1-v1.xlsx
Figure 4—figure supplement 1
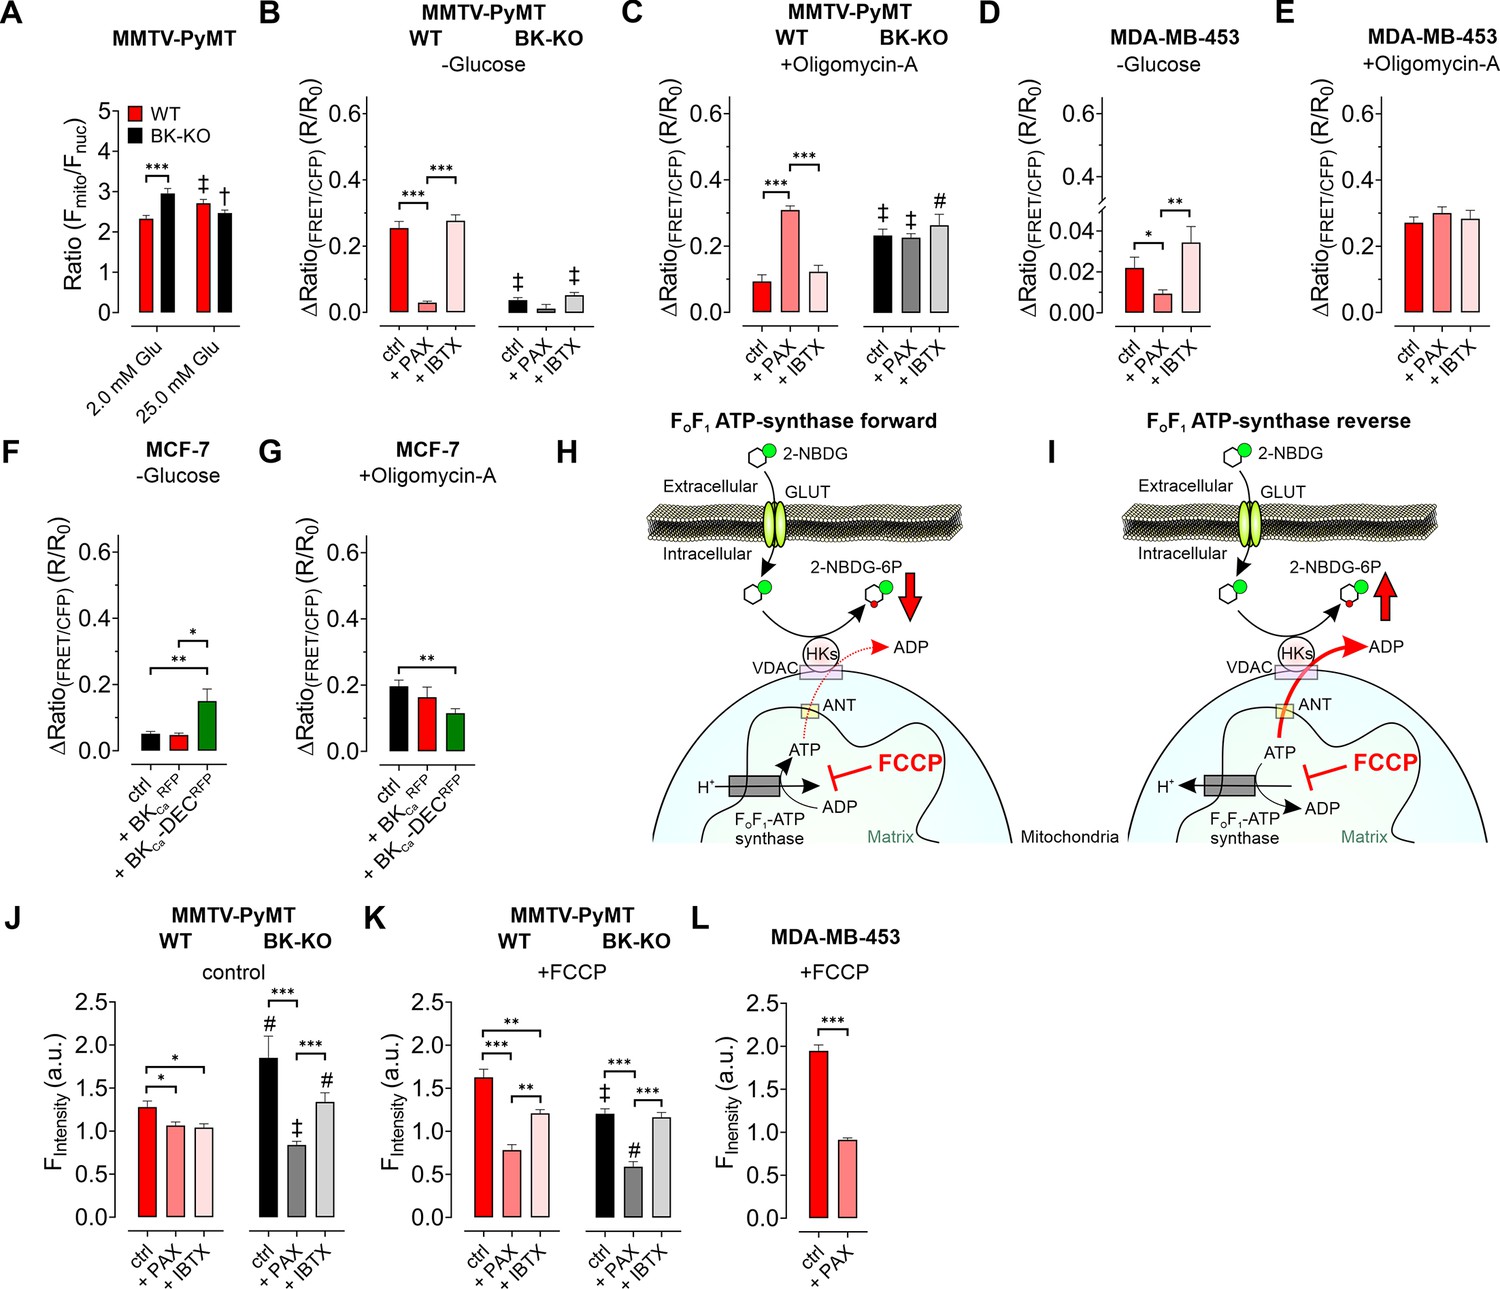
BKCa modulates cellular substrate dependency for maintaining [ATP]mito and reverses FOF1 ATP-synthase.
(A) Average fluorescence ratios (Fmito/Fnuc) of MMTV-PyMT WT and BK-KO cells, either in the presence of 2.0 mM or 25.0 mM extracellular glucose. N (independent experiments) / n (cells analyzed) = 6/171 WT 2.0 mM Glu, 6/180 WT 25.0 mM Glu, 5/133 BK-KO 2.0 mM Glu, 6/163 BK-KO 25.0 mM Glu. ***p≤0.001, Mann-Whitney test. †p≤0.01, ‡p≤0.001 compared to 2.0 mM glucose condition of the respective cell type, Mann-Whitney test. (B – E) Average changes in FRET-ratio signals ± SEM induced either upon extracellular glucose removal (B, D) or upon administration of Oligomycin-A (C, E) to MMTV-PyMT WT, BK-KO (B, C) or MDA-MB-453 cells (D, E) expressing mtAT1.03, a FRET-based ATP sensor targeted to the mitochondrial matrix. Experiments were either performed under control conditions or in the presence of 5 µM paxilline or 30 nM iberiotoxin. N/n = (B): 8/55 WT ctrl, 6/45 WT +PAX, 7/27 WT +IBTX, 8/65 BK-KO ctrl, 6/57 BK-KO +PAX, 7/28 BK-KO +IBTX, (C): 11/52 WT ctrl, 7/53 WT +PAX, 7/34 WT +IBTX, 8/87 BK-KO ctrl, 6/35 BK-KO +PAX, 8/45 BK-KO +IBTX, (D): 5/14 ctrl, 3/13+PAX and 5/13+IBTX, (E): 5/33 ctrl, 3/21+PAX, 8/27+IBTX. *p≤0.05, **p≤0.01, ***p≤0.001, Kruskal-Wallis test followed by Dunn’s MC test (B, C, D). #p≤0.05, ‡p≤0.001 compared to respective WT condition, Mann-Whitney test (ctrl in B), all in C, or Welchs t-test (+IBTX in B). (F, G) Average changes in FRET-ratio signals ± SEM induced either upon extracellular glucose removal (F) or upon administration of Oligomycin-A (G) to MCF-7 cells expressing mtAT1.03, either in combination with a red fluorescent protein as control, or BKCaRFP or BKCa-DECRFP, respectively *p≤0.05, **p≤0.01, Kruskal-Wallis test followed by Dunn’s MC test. N/n = (F): 6/48 ctrl, 5/23+BKCaRFP, 5/20+BKCa-DECRFP, (G): 5/27 ctrl, 5/23+BKCaRFP, 5/37+BKCa-DECRFP. (H, I) Schematic representation of processes involved in 2-NBDG uptake. 2-NBDG is taken up via glucose transporters (GLUTs, green), and ATP-dependently phosphorylated by hexokinase isoforms (HKs, red) to 2-NBDG-6-phosphate (2-NBDG-6P). Under basal conditions, if FOF1 ATP-synthase is running in forward mode (H), mitochondria contribute to 2-NBDG uptake by ATP generation and delivery to HKs via the adenine nucleotide transporter (ANT, yellow), and the voltage-dependent anion channel (VDAC, violet). Contrary, under basal conditions, if FOF1 ATP-synthase activity is reversed (I) it competes with HKs for ATP. Subsequent inhibition of mitochondria due to their depolarization with FCCP (red) stops ATP-synthase activity. Under these conditions, 2-NBDG uptake will decrease if FOF1 ATP-synthase operates in forward mode (H), but will increase if FOF1 ATP-synthase shows reversed activity (I). (J – L) Average fluorescence signal (a.u.) ± SEM of MMTV-PyMT WT and BK-KO cells (J, K), or MDA-MB-453 cells (L) incubated with 100 µM 2-NBDG at 37 °C for 30 min either under control conditions (J) or in the presence of 200 nM FCCP for mitochondrial depolarization (K, L), with or without 5 µM paxilline or 30 nM iberiotoxin. N = 4 for all. *p≤0.05, ***p≤0.001, Kruskal-Wallis test followed by Dunn’s MC test (J), and WT in K, One-Way ANOVA test (BK-KO in K) or Welch’s t-test (L). #p≤0.05, ‡p≤0.001 compared to respective WT condition, Mann-Whitney test (ctrl and +IBTX in J), ctrl in (K), or Unpaired t-test (+PAX in J) and +PAX in (K).
-
Figure 4—figure supplement 1—source data 1
Numerical values underlying the data shown in Figure 4.
- https://cdn.elifesciences.org/articles/92511/elife-92511-fig4-figsupp1-data1-v1.xlsx
Figure 5 with 1 supplement
BKCa activity is present in the inner mitochondrial membrane (IMM) of BCCs.
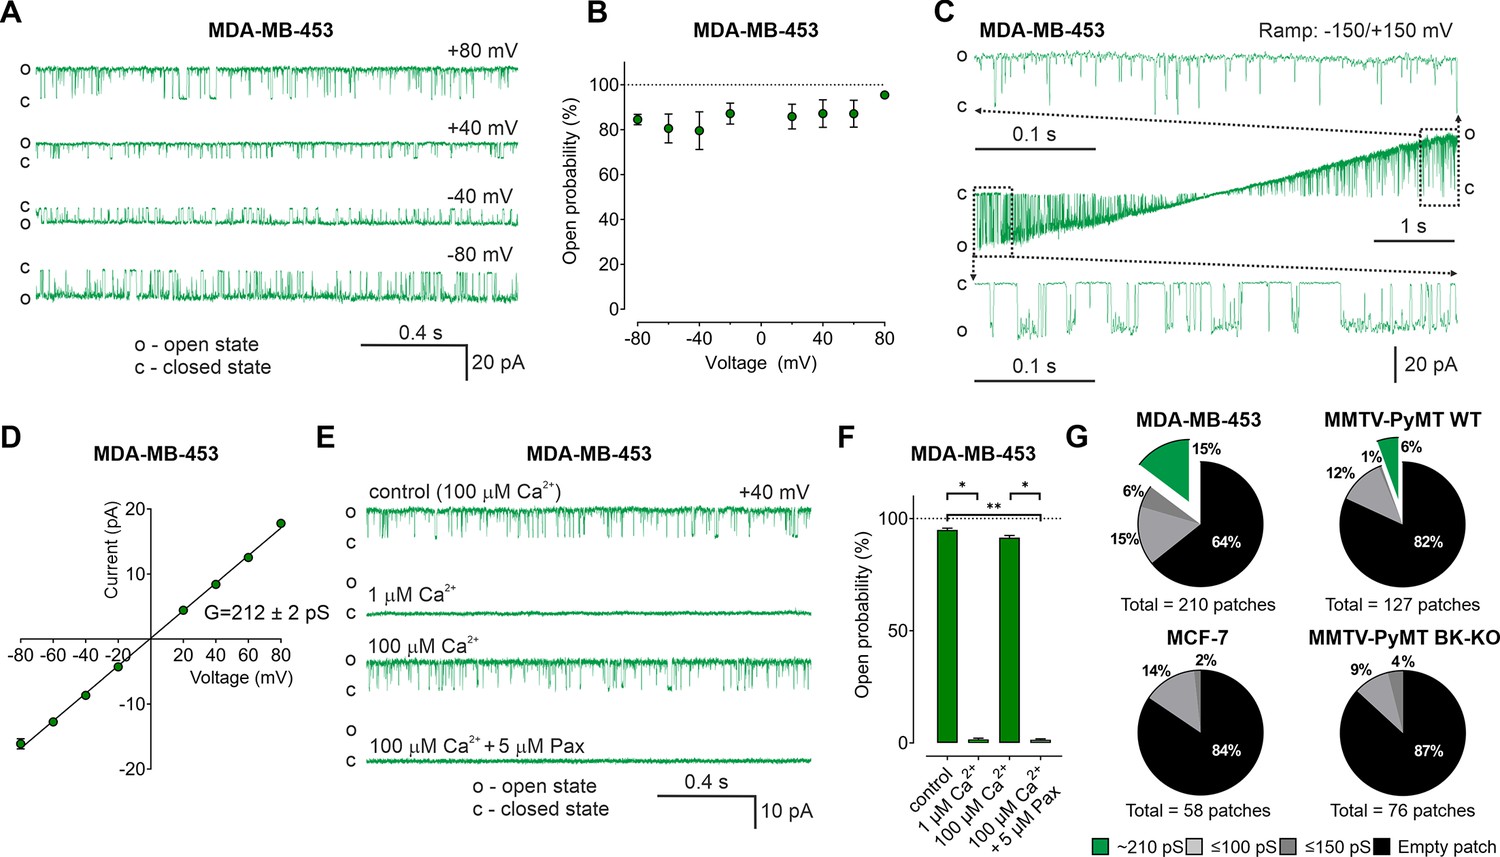
(A) Representative BKCa single-channel recordings of the IMM of mitoplasts isolated from MDA-MB-453 cells using a symmetric 150/150 mM isotonic KCl solution containing 100 µM Ca2+ at voltages ranging from –80 to +80 mV as indicated in the panel. (B) Open probability analysis of mitoBKCa at different voltages received from experiments as performed in (A). N = 8. (C) Single-channel currents of the IMM of mitoplasts isolated from MDA-MB-453 cells recorded using a voltage ramp protocol ranging from −150 to +150 mV. Above and below the ramp are enlarged excerpts of the records shown in rectangles. (D) Current-voltage (I–V) plot based on single-channel recordings of MDA-MB-453 cells as performed in (A), using a symmetric 150/150 mM KCl isotonic solution containing 100 µM Ca2+. N = 11. (E, F) Representative single-channel recordings of the IMM of mitoplasts isolated from MDA-MB-453 cells (E) and corresponding open probabilities at +40 mV in a symmetric 150/150 mM KCl isotonic solution under control conditions (100 μM Ca2+), after reducing Ca2+ to 1 μM, re-addition of 100 μM Ca2+ and finally after application of 5 μM paxilline in the presence of 100 μM Ca2. Data in (F) show average ± SEM. *p≤0.05, **p≤0.01 using Friedmann test followed by Dunn’s multiple comparison test, n = 7. (G) Pie chart displaying the percentage of mitoBKCa channel currents (green) possessing a conductance of ~210 pS, versus the total number of patch-clamp experiments performed using mitoplasts isolated from MDA-MB-453 cells (upper left), MMTV-PyMT WT cells (upper right), MCF-7 cells (lower left), and MMTV-PyMT BK-KO cells (lower right). Black segments represent empty patches, bright- and dark grey fraction demonstrate percentage of channels possessing smaller conductances of ≤100 pS and ≤150 pS, respectively. All recordings were low-pass filtered at 1 kHz. ‘c’ and ‘o’ indicate the closed- and open state of the channel, respectively.
-
Figure 5—source data 1
Numerical values underlying the data shown in Figure 5.
- https://cdn.elifesciences.org/articles/92511/elife-92511-fig5-data1-v1.xlsx
Figure 5—figure supplement 1
BKCa is present in the inner mitochondrial membrane of MMTV-PyMT WT and MDA-MB-453 cells.
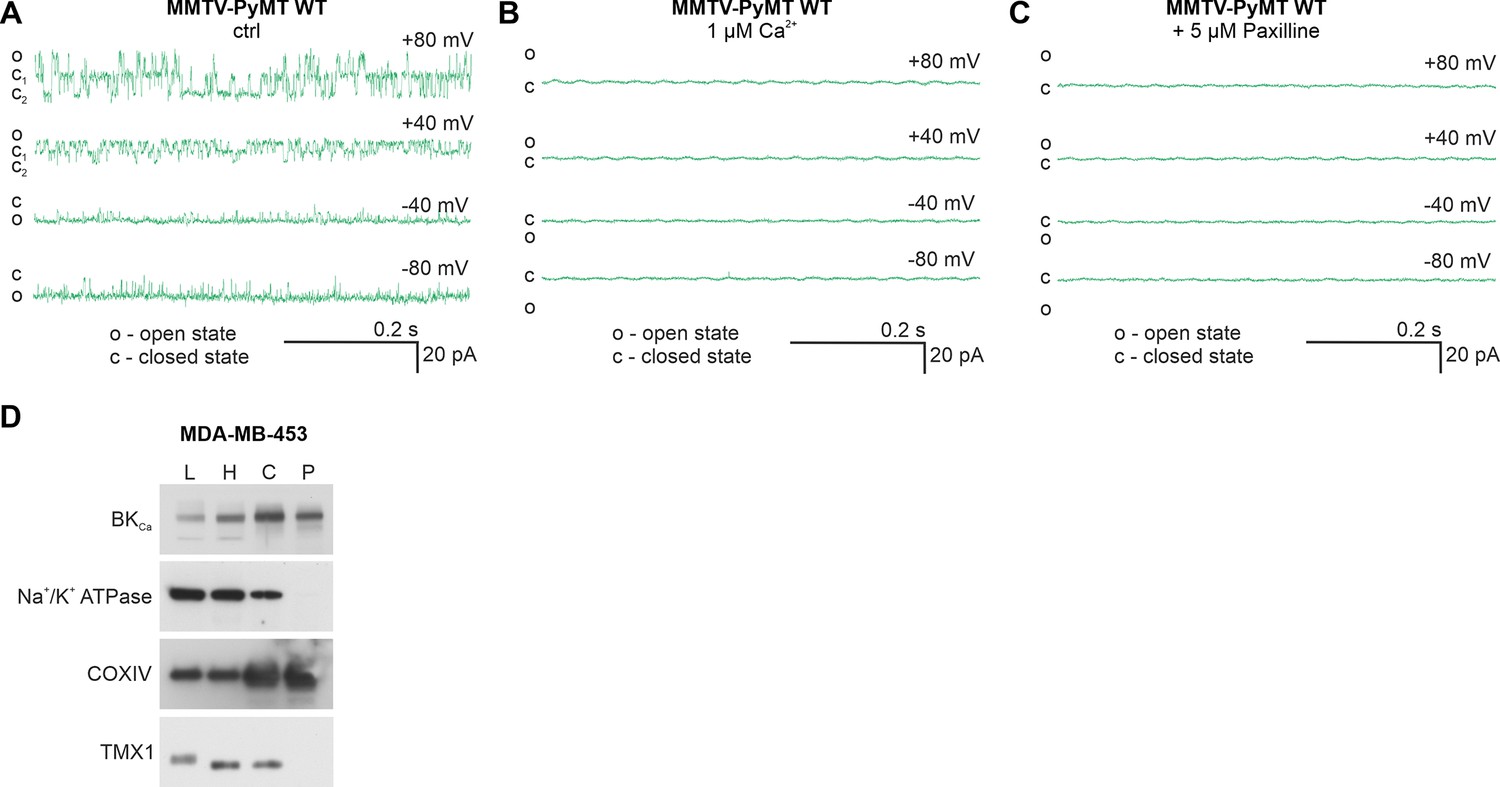
(A – C) Graphs show representative BKCa single-channel recordings of the inner mitochondrial membrane of mitoplasts isolated from MMTV-PyMT WT cells using a symmetric 150/150 mM isotonic KCl solution, either containing 100 µM Ca2+ (A), 1 µM Ca2+ (B), or 5 µM Paxilline in the presence of 100 µM Ca2+ (C), at voltages ranging from –80 to +80 mV as indicated in the panels. The patch in (A) contained two BKCa channels. ‘c’ indicates the closed-, ‘o’ the open state of the channel. (D) Representative western blot of BKCa, Na+/K+ ATPase as a plasma membrane marker, cytochrome c oxidase subunit IV (COXIV) as a mitochondrial marker and thioredoxin-related transmembrane protein 1 (TMX1), a protein enriched in the ER membrane. Western blot was performed using whole-cell lysates (L), the homogenate (H), crude isolated mitochondria (C) and mitochondria after percoll gradient purification (P) of MDA-MB-453 cells. N = 3.
-
Figure 5—figure supplement 1—source data 1
Original image of the Western Blot against TMX1.
- https://cdn.elifesciences.org/articles/92511/elife-92511-fig5-figsupp1-data1-v1.pdf
-
Figure 5—figure supplement 1—source data 2
Original image of the Western Blot against TMX1 with bands used in the Figure indicated.
- https://cdn.elifesciences.org/articles/92511/elife-92511-fig5-figsupp1-data2-v1.pdf
-
Figure 5—figure supplement 1—source data 3
Original image of the Western Blot against Na+/K+ ATPase.
- https://cdn.elifesciences.org/articles/92511/elife-92511-fig5-figsupp1-data3-v1.pdf
-
Figure 5—figure supplement 1—source data 4
Original image of the Western Blot against Na+/K+ ATPase with bands used in the Figure indicated.
- https://cdn.elifesciences.org/articles/92511/elife-92511-fig5-figsupp1-data4-v1.pdf
-
Figure 5—figure supplement 1—source data 5
Original image of the Western Blot against BKCa.
- https://cdn.elifesciences.org/articles/92511/elife-92511-fig5-figsupp1-data5-v1.pdf
-
Figure 5—figure supplement 1—source data 6
Original image of the Western Blot against BKCa with bands used in the Figure indicated.
- https://cdn.elifesciences.org/articles/92511/elife-92511-fig5-figsupp1-data6-v1.pdf
-
Figure 5—figure supplement 1—source data 7
Original image of the Western Blot against COX IV.
- https://cdn.elifesciences.org/articles/92511/elife-92511-fig5-figsupp1-data7-v1.pdf
-
Figure 5—figure supplement 1—source data 8
Original image of the Western Blot against COX IV with bands used in the Figure indicated.
- https://cdn.elifesciences.org/articles/92511/elife-92511-fig5-figsupp1-data8-v1.pdf
Figure 6 with 1 supplement
BKCa-DEC expression contributes to the metabolic remodeling and growth of murine and human BCCs and is present in primary tumor samples.
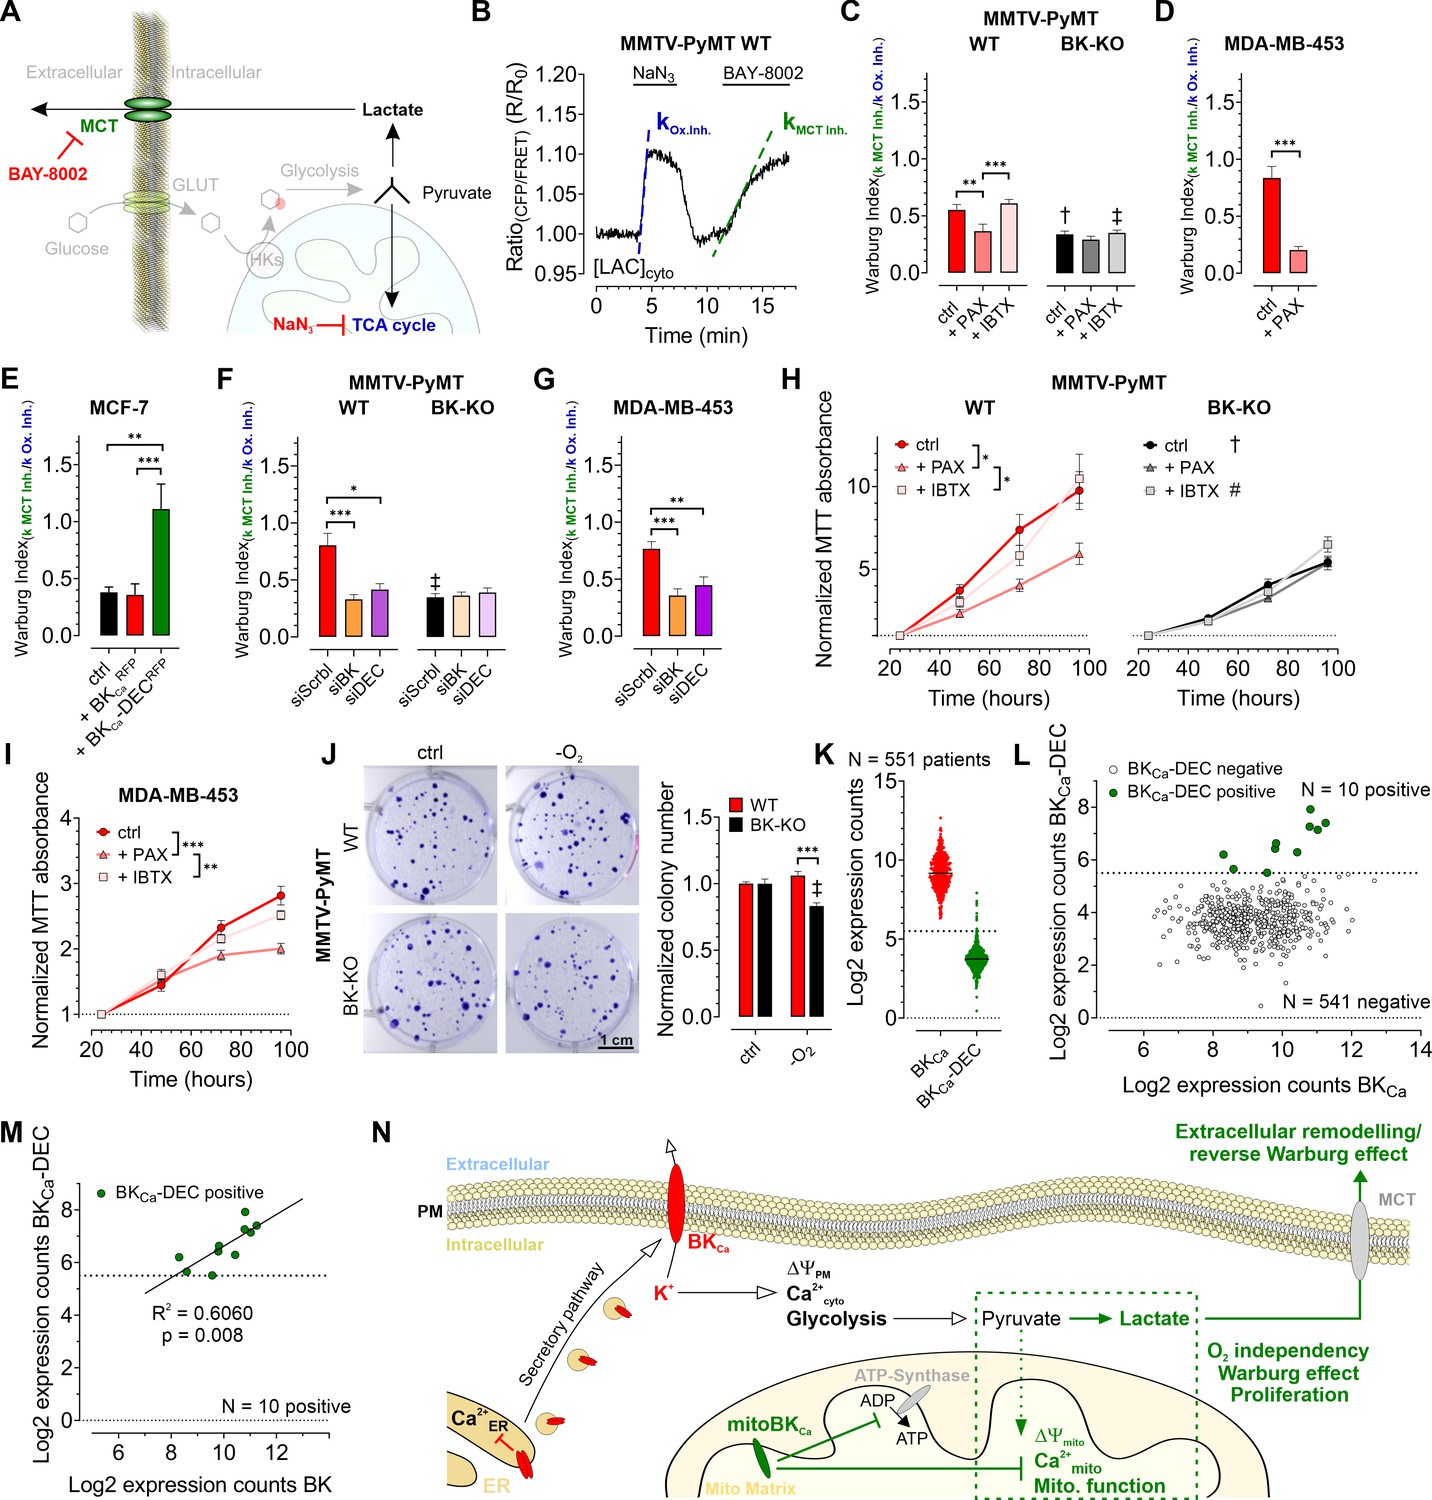
(A) Schematic representation of the fate of glucose in glycolysis. The tricarboxylic acid (TCA) cycle or lactate secretion via monocarboxylate transporters (MCT) can be inhibited, either using NaN3 or BAY-8002. GLUT: Glucose transporter, HKs: Hexokinases. (B) Representative cytosolic lactate concentration ([LAC]cyto) of a MMTV-PyMT WT cell over-time in response to administration or removal of NaN3 and BAY-8002 at time points indicated. Dashed lines indicate slopes taken for assessment of the ‘Warburg index’. (C – G) Average Warburg indices ± SEM of MMTV-PyMT WT (C, F, left), MMTV-PyMT BK-KO (C, F, right), MDA-MB-453 cells (D, G) and MCF-7 cells (E) calculated from the experiments as shown in (B), either under control conditions, in the presence of paxilline or iberiotoxin (C, D), upon expression of BKCaRFP or BKCa-DECRFP (E), or upon cell treatment with a scrambled siRNA (siScrbl), or siRNA against a common BKCa sequence targeting all known splice variants (siBK), or a siRNA specifically designed to knockdown BKCa-DEC (siDEC) (F, G). (H, I) Normalized MTT absorbance over-time of MMTV-PyMT WT (H, left) and BK-KO cells (H, right), and MDA-MB-453 cells (I), either under control conditions, or in the presence of paxilline or iberiotoxin. (J), Representative images and corresponding statistics of colony formation assays using MMTV-PyMT WT or BK-KO cells in the presence or absence of O2. (K – N) mRNA expression of BKCa and BKCa-DEC as performed by Nanostring analysis of 551 BC patient samples. (K) Log2 expression counts of BKCa and BKCa-DEC. The threshold for positive expression level was set to log2 = 5.5 (dashed line). (L) Log2 expression counts of BKCa-DEC blotted over the log2 expression counts of BKCa. 10 of the 551 patient samples showed expression of BKCa-DEC above the threshold of log2 = 5.5 (dashed line), whereas 541 patient samples were BKCa-DEC negative. (M) Correlation of the log2 expression counts of BKCa-DEC positive samples with the log2 expression counts of BKCa in the primary human BC material. (N) Summarizing scheme of BKCa in cancer cell homeostasis. N (independent experiments) / n (cells analyzed) = (C): 4/26 WT ctrl, 6/28 WT +PAX, 4/39 WT +IBTX, 4/17 BK-KO ctrl, 5/18 BK-KO +PAX, 4/27 BK-KO +IBTX, (D): 7/29 ctrl, 5/13+PAX, (E): 5/27 ctrl, 5/20+BKCaRFP, 7/26 BKCa-DECRFP, (F): 5/22 WT siScrbl, 5/28 WT siBK, 4/26 WT siDEC, 5/24 BK-KO siScrbl, 5/24 BK-KO siBK, 5/29 BK-KO siDEC, (G): 5/21 siScrbl, 5/22 siBK, 5/19 siDEC, (H – J): 4 for all. *p≤0.05, **p≤0.01, ***p≤0.001, Kruskal-Wallis test followed by Dunn’s MC test (C, E, F, G, I), One-Way ANOVA test followed by Tukey’s MC test (H) or Mann-Whitney test (D). †p≤0.01, ‡p≤0.001 compared to respective WT condition, Unpaired t-test ctrl, (C, J) or Mann-Whitney test (+IBTX, C, F).
-
Figure 6—source data 1
Numerical values underlying the data shown in Figure 6.
- https://cdn.elifesciences.org/articles/92511/elife-92511-fig6-data1-v1.xlsx
Figure 6—figure supplement 1
Effects of siRNA treatment on expression of BKCa and BKCa-DEC, and physiologic consequences of BKCa inhibition in BCCs.
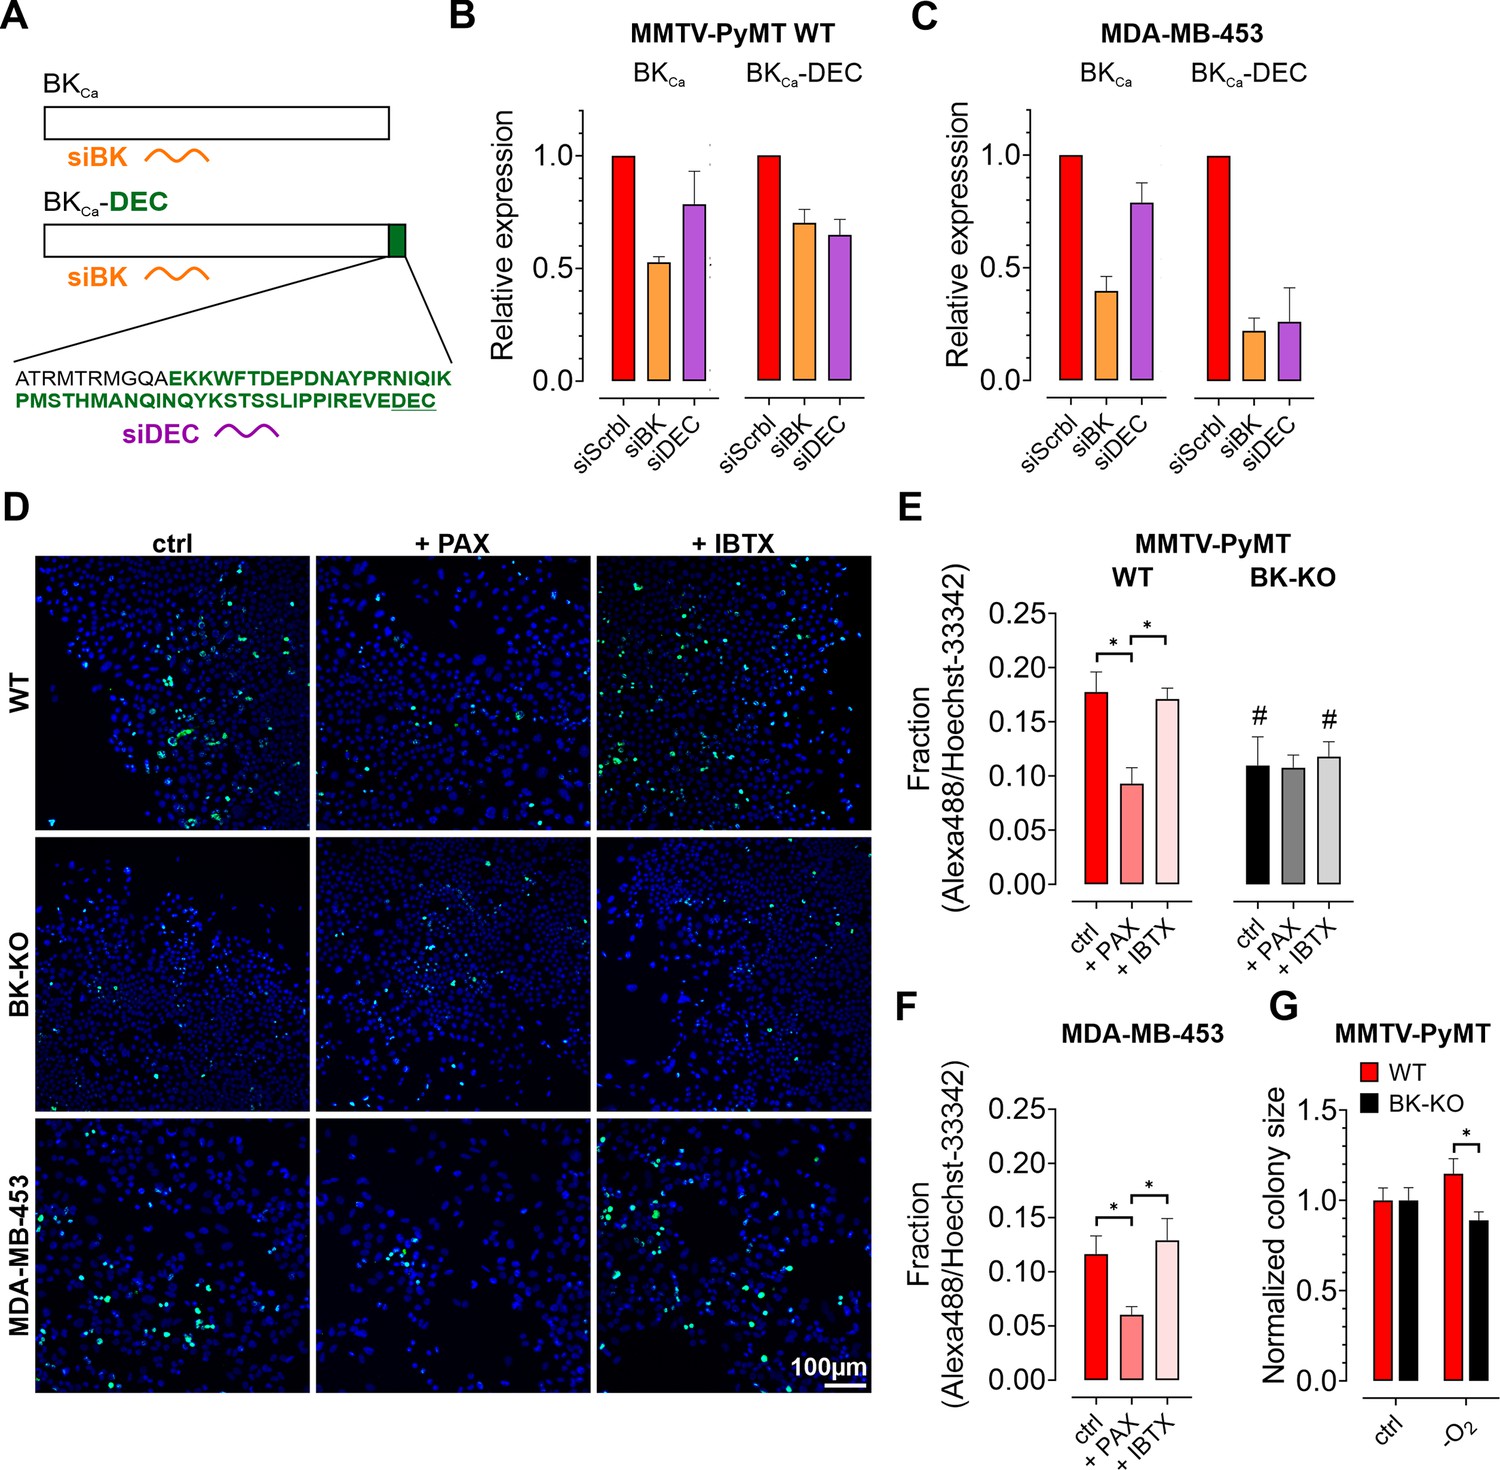
(A) Schematic representation of siRNAs used for subsequent silencing experiments. Either an siRNA targeting all known BKCa isoforms, referred to as siBK (orange), or an siRNA specifically designed against the DEC exon (green), referred to as siDEC (violet), were used. (B, C) Relative mRNA expression levels ± SEM of BKCa and BKCa-DEC in MMTV-PyMT WT (B) and MDA-MB-453 cells (C), as analyzed by qPCR. Cells were either treated with a scrambled siRNA as a control (siScrbl), siRNA against all known BKCa isoforms (siBK) or siRNA specifically targeting BKCa-DEC (siDEC), respectively. N = 4 siBK MMTV-PyMT WT, 3 for all others. (D–F) Representative images (D) and corresponding statistics (E, F) of MMTV-PyMT WT cells (D, upper line and E, left panel), MMTV-PyMT BK-KO cells (D, middle line and E, right panel) and MDA-MB-453 cells (D, lower line and F) immune-stained for the proliferation marker KI-67 (Alexa488, green), and Hoechst-33342 (blue) for visualizing all nuclei. Experiments were either performed under control conditions (ctrl, left column), or in the presence of 5 µM paxilline (+PAX, middle column) or iberiotoxin (+IBTX, right column). *p≤0.05, Kruskal-Wallis test followed by Dunn’s MC test. #p≤0.05 compared to respective WT condition, Mann-Whitney test. N = 5 for WT ctrl, BK-KO +PAX and MDA-MB-453+IBTX, N = 6 for all others. (G) Normalized colony sizes of colony formation assays performed using MMTV-PyMT WT and BK-KO cells. Cells were cultivated for 7 days either in the presence or absence of O2. *p≤0.05, Mann-Whitney test. N = 4 independent experiments for all conditions.
-
Figure 6—figure supplement 1—source data 1
Numerical values underlying the data shown in Figure 6.
- https://cdn.elifesciences.org/articles/92511/elife-92511-fig6-figsupp1-data1-v1.xlsx
Author response image 1

Cytosolic Ca2+ concentrations over-time in the presence of 1.
mM or 2.0 mM extracellular Ca2+.
Author response image 2

Mitochondrial membrane potential, as measured using TMRM, in response to acute short-term administration of 5µM paxilline, followed by mitochondrial depolarization using FCCP.
Author response image 3

Author response image 3: Schematic representation of mitoplast attached patch-clamp experiments.
Author response image 4

Representative single channels different to mitoBKCa detected in MDAMB-453 mitoplasts.
Author response image 5
Dot blot for data shown in Figure 2I.
Author response image 6
Representative single cell responses of Fura-2 loaded MMTV-PyMT WT cells.
Author response image 7

Representative images at different brightnesses.
Additional files
-
Supplementary file 1
File contains the Supplementary Tables for the Manuscript.
(a) Probes used for Nanostring nCounter gene expression analysis. (b) Primers used for qPCR analysis. (c) siRNAs used for silencing based experiments.
- https://cdn.elifesciences.org/articles/92511/elife-92511-supp1-v1.docx
-
MDAR checklist
- https://cdn.elifesciences.org/articles/92511/elife-92511-mdarchecklist1-v1.pdf
Download links
A two-part list of links to download the article, or parts of the article, in various formats.
Downloads (link to download the article as PDF)
Open citations (links to open the citations from this article in various online reference manager services)
Cite this article (links to download the citations from this article in formats compatible with various reference manager tools)
mitoBKCa is functionally expressed in murine and human breast cancer cells and potentially contributes to metabolic reprogramming
eLife 12:RP92511.
https://doi.org/10.7554/eLife.92511.3


