Emergence of ion-channel-mediated electrical oscillations in Escherichia coli biofilms
- Division of Infection, Lydia Becker Institute of Immunology and Inflammation, School of Biological Sciences, University of Manchester, United Kingdom
- Biological Physics, Department of Physics and Astronomy, University of Manchester, United Kingdom
- Division of Evolution, Infection and Genomics, School of Biological Sciences, Faculty of Biology, Medicine and Health University of Manchester, United Kingdom
Figures
Figure 1
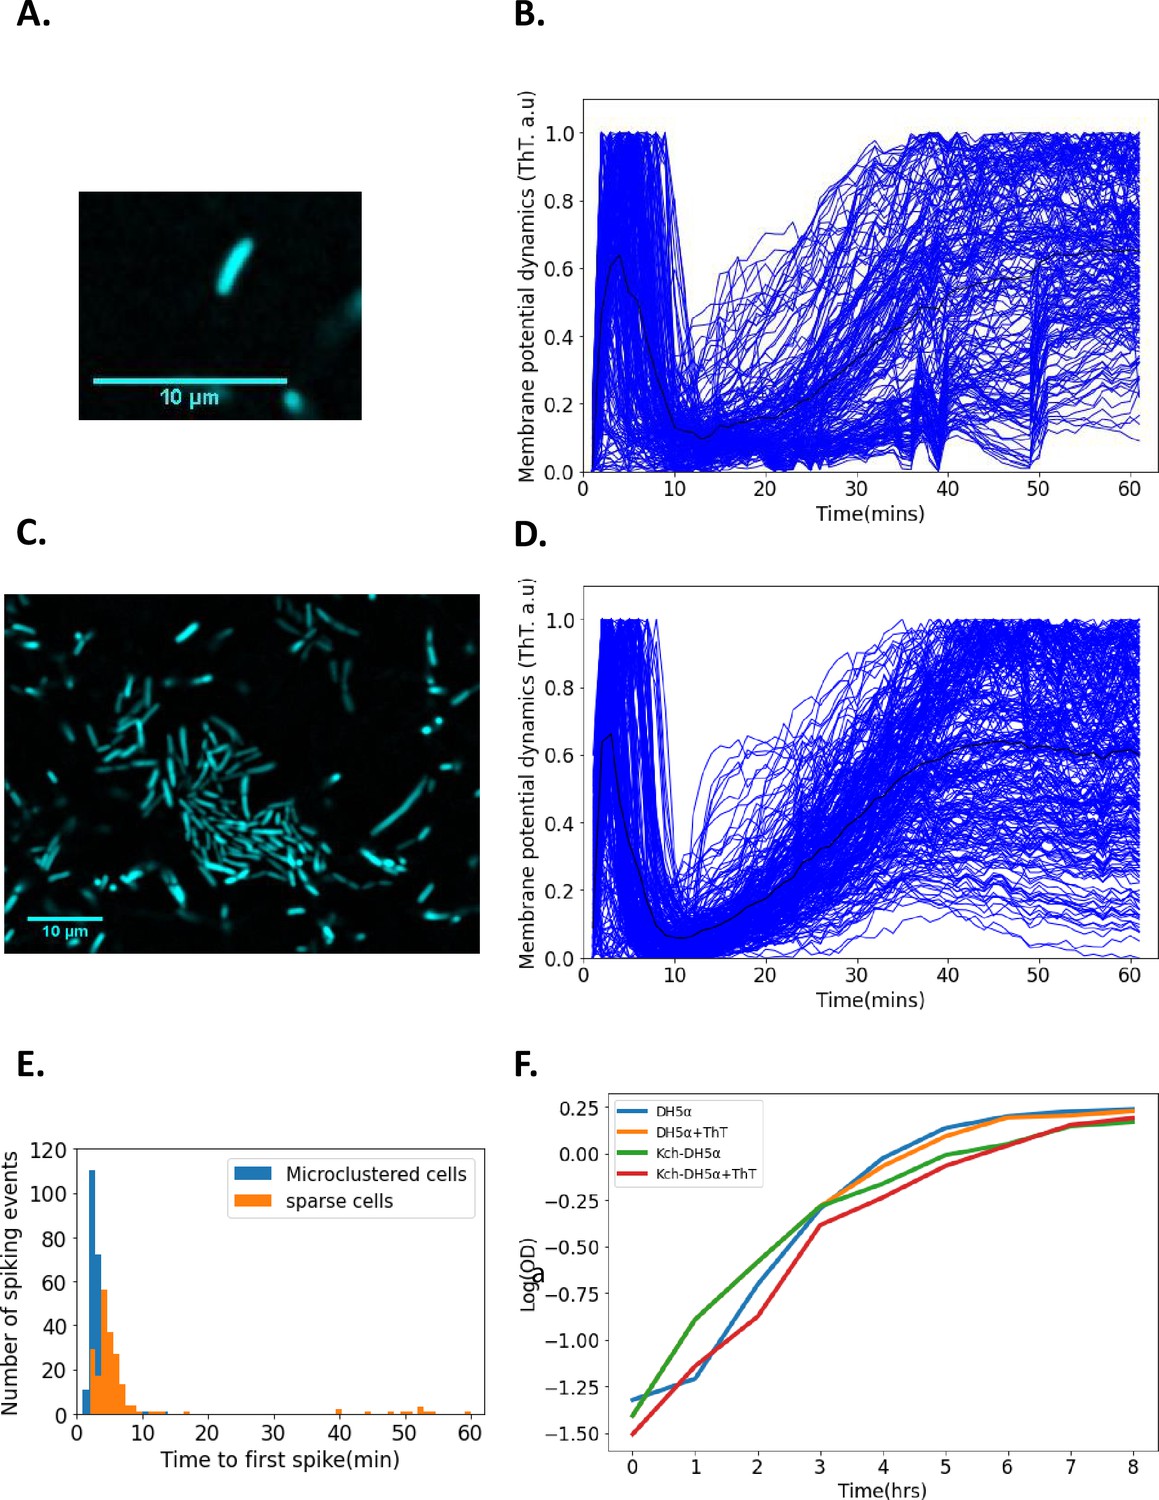
Single-cell DH5α E. coli exhibit membrane potential dynamics in response to 440 nm blue light stress.
(A) Image of a sparse single cell containing ThT imaged in the microfluidic device (Scale bar: 10 µm). (B) Normalized fluorescence intensities of ion-transients for sparse cells (n=206) as a function of time after stimulation. Each curve describes a single cell. The curve depicting the mean membrane potential dynamics is shown in black. (C) Representative image of microclustered cells containing ThT in the microfluidic device. (D) Fluorescent intensity of ion-transients for cells in microclusters as a function of time after stimulation. Each curve describes a single cell. The curve depicting the mean membrane potential dynamics is shown in black. (E) Time to first spike histogram for sparse cells (n=206, Sparse cells in orange) and cells in microclusters (n=272, microclustered cells in blue, cells recovered from 15 clusters). The number of spiking events is shown as a function of time to the first spike. (F) Growth curves (in a semi-log coordinates) for E. coli (measured via OD600) as a function of time in the presence and absence of ThT. All data were from at least three experimental replicates. Light stress was applied for 60 min. The scale bars for all the images are 10 µm.
Figure 2
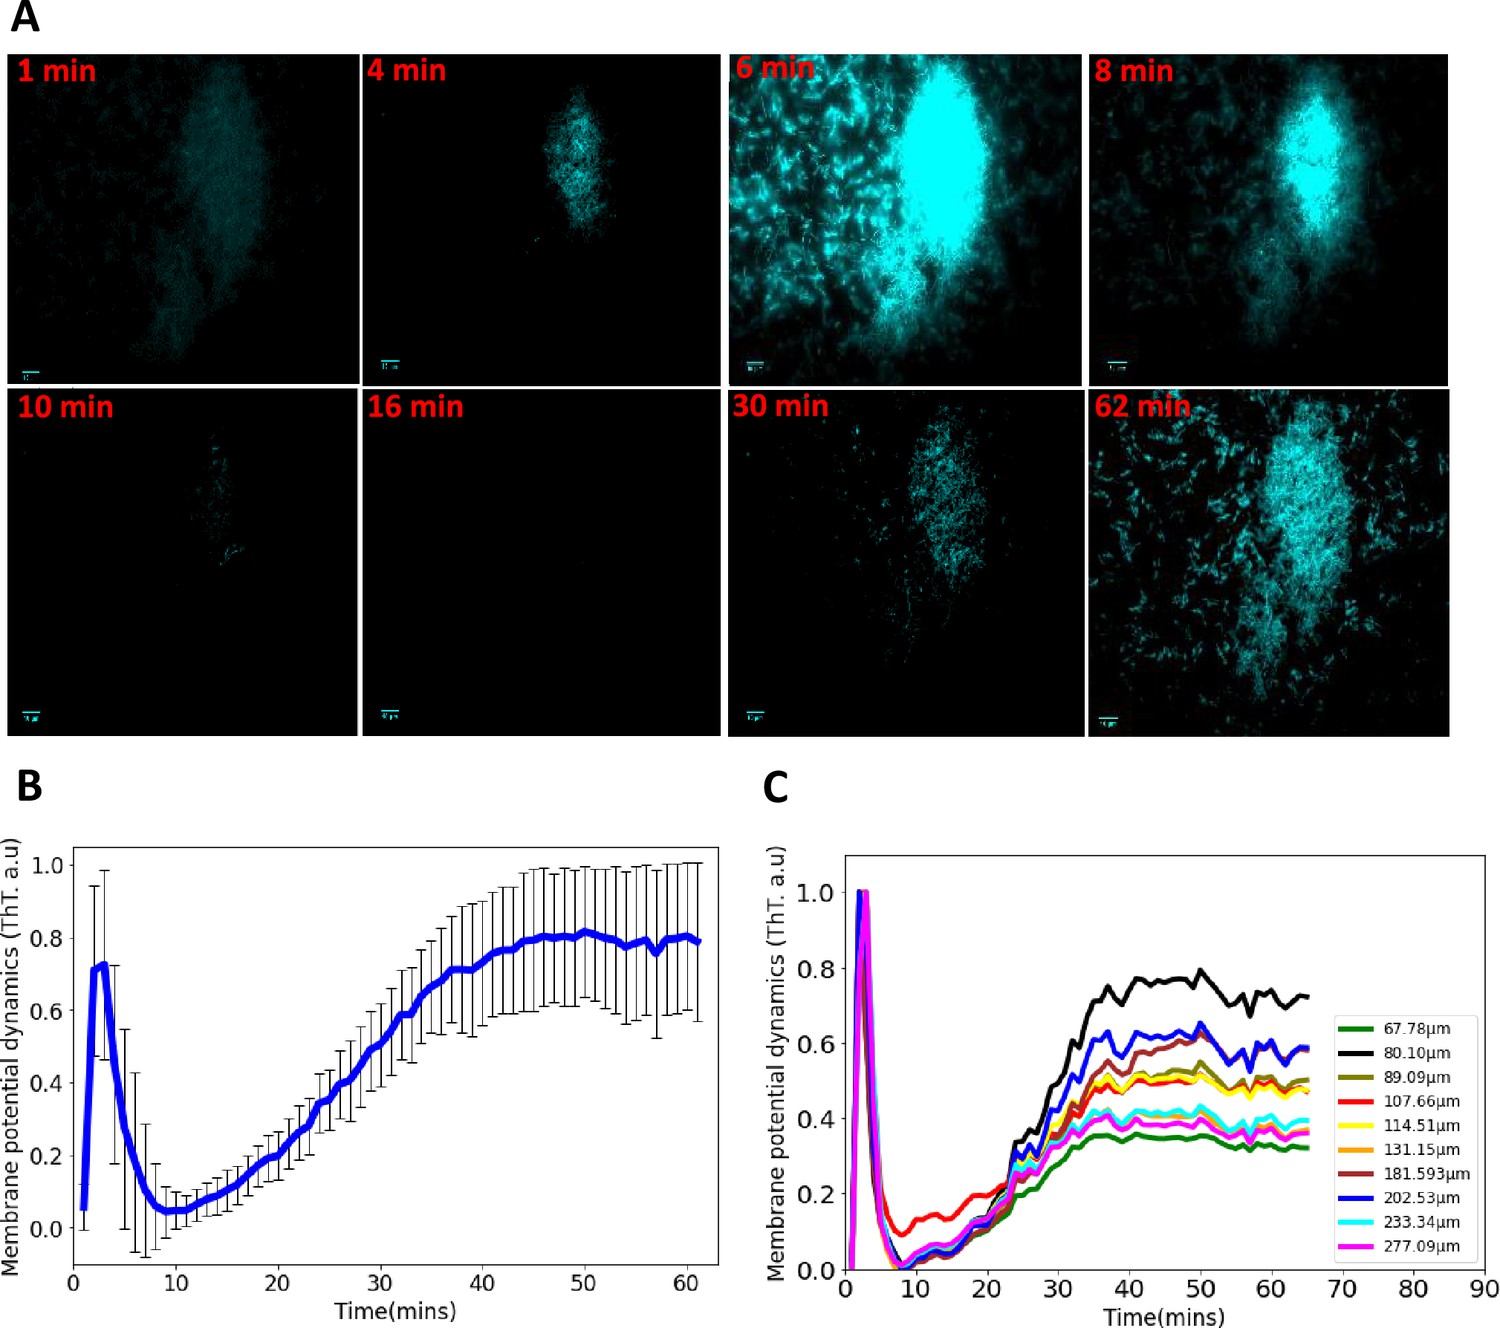
Synchronized ion-channel-mediated wavefronts in E. coli biofilm.
(A) Representative fluorescence microscopy image as a function of time (1–62 min). Robust global wavefronts can be seen in an E. coli biofilm with ThT. The scale bars for all the images are 10 µm. (B) Global averaged intensity wavefront trace obtained from a 2D section of a biofilm as a function of time (mean ± SD for 30 biofilms from at least three experiments). (C) Globally averaged ion-channel-mediated dynamics in E. coli biofilms for different sized biofilms (68–277 µm). ThT intensity is shown as a function of time.
Figure 3
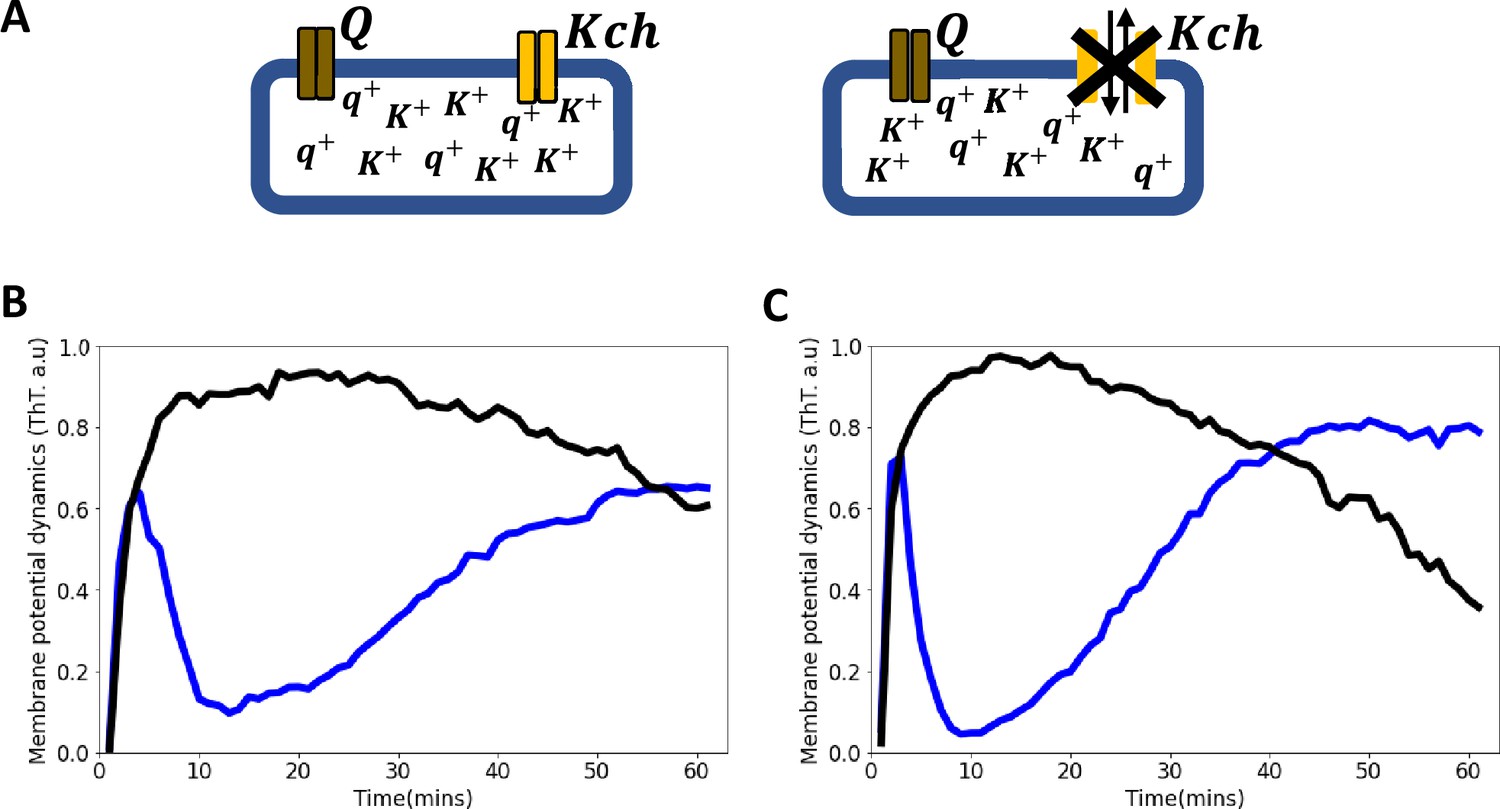
Voltage-gated Kch potassium channel mediates ion channel membrane potential dynamics in E. coli.
(A) Schematic diagram showing the deletion of the voltage-gated Kch channel in E. coli. (B) ThT fluorescence shown as a function of time of irradiation. Deletion of Kch inactivates the second peak in single cell E. coli DH5α. Data is a mean from 52 single cells from three experimental replicates per time point for DH5α ∆kch mutant (black) plotted against the wildtype single cell E. coli DH5α (blue). (C) Deletion of kch also inactivates the second peak in E. coli biofilms. Data is shown for global membrane potential dynamics for biofilms grown from E. coli DH5α ∆kch mutant (black) and wildtype DH5α (blue).
Figure 4
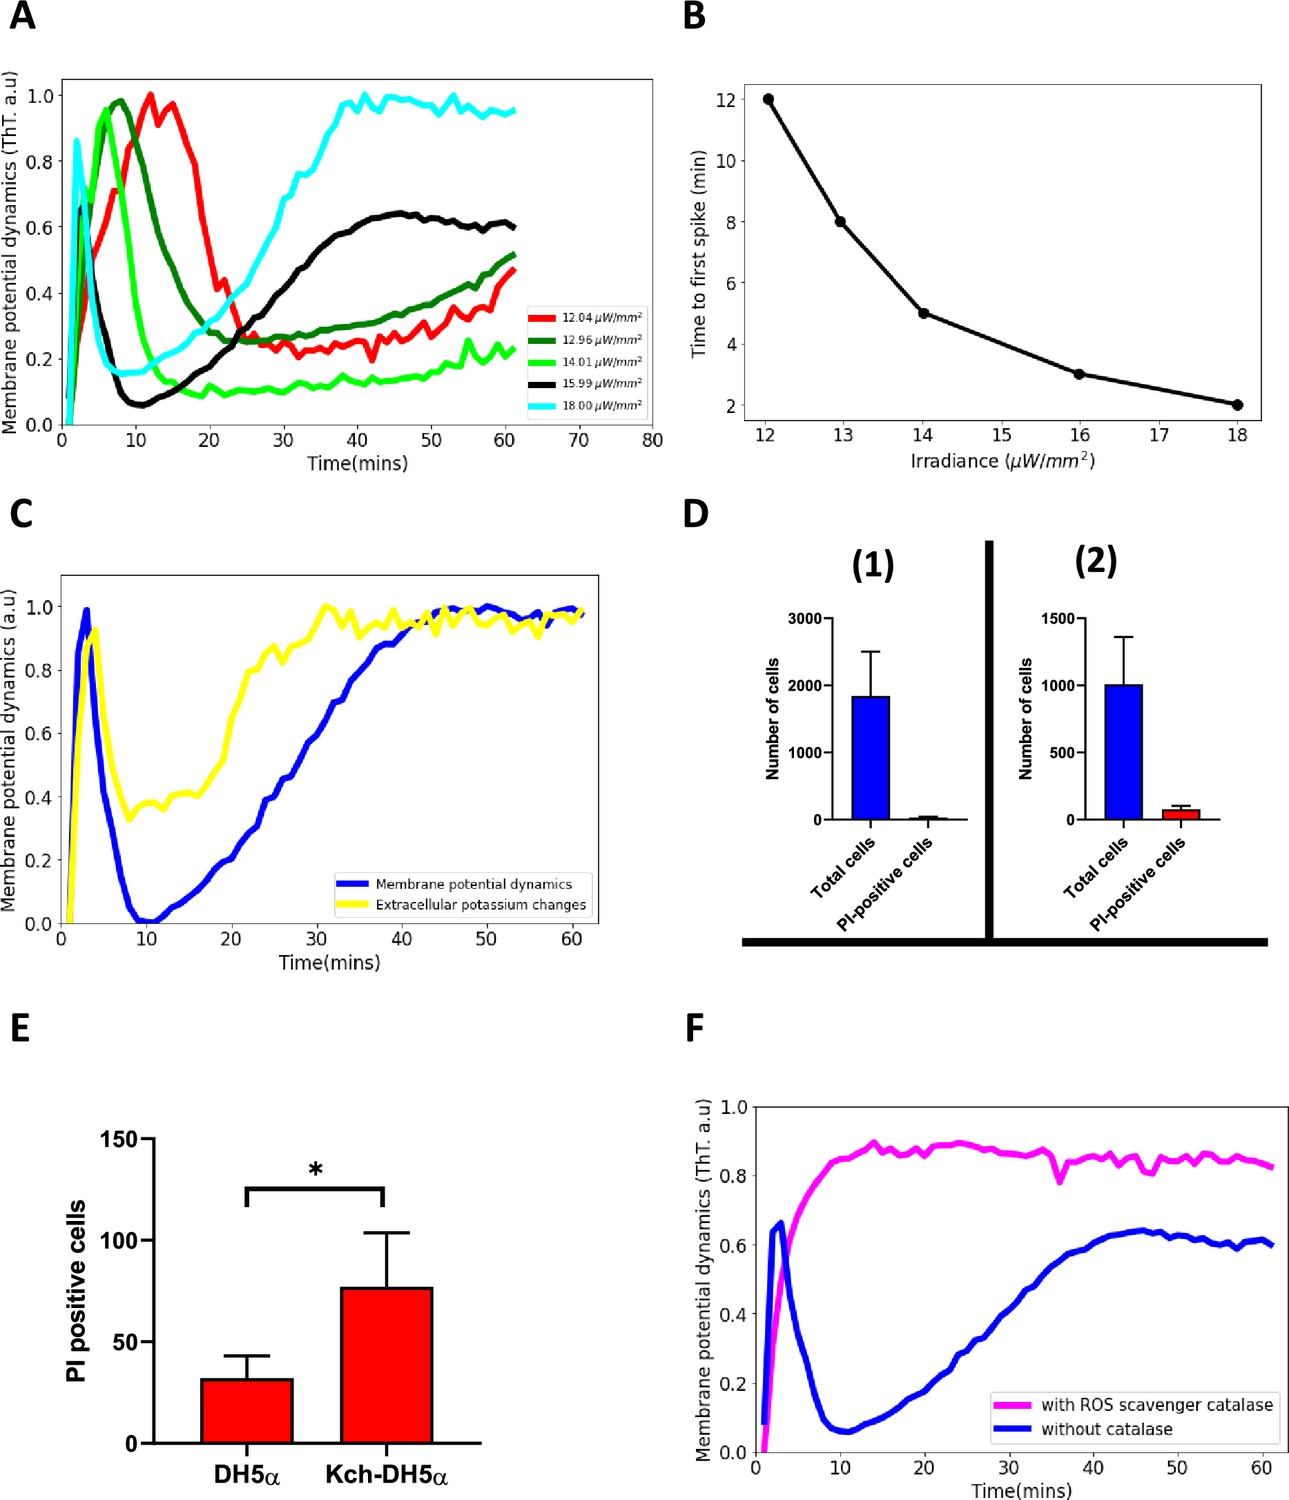
Blue light influences ion-channel-mediated membrane potential events in E. coli.
(A) ThT intensity as a function of time when irradiated with different powers of 440 nm light. The time to the second excitation peak is dependent on the power. All subsequent experiments were done at the irradiance value of 15.99 µW/mm2. (B) Time to first spike plotted as a function of irradiance. Blue-light irradiance affects the time to the first peak in E. coli biofilm. (C) Measurement of extracellular potassium changes for regions close to biofilms as a function of time using fluorescence microscopy. (D) LiveDead Assay using the accumulation of propidium iodide in cells (1) DH5α (n=1842) (2) DH5α ∆kch mutant (n=1008). (E) Comparison between PI-positive cells for the DH5α and the DH5α ∆kch mutant. Statistical significance was calculated using the Student’s t-test, p≤0.05. (F) ThT fluorescence intensity as a function of time for cells in the presence of a ROS scavenger. E. coli cells employ ion-channel-mediated dynamics to manage ROS-induced stress linked to light irradiation. Data was obtained from not less than three experiments.
Figure 5

Model of ion-channel-mediated membrane potential in E. coli, predictions and experimental validation.
(A) Schematic diagram of the conductance model and its predictions. The model consists of two ion-channel gates. The first channel (bronze, Q) is unknown. The second channel is the potassium channel, Kch (yellow). At the onset regime 0, both ion channels are closed. Exposure to light stress results in a rapid opening of the Q channel, which has a faster-opening gating variable than the Kch channel (regime I). The Q channel has little contribution to the repolarization event, hence the overlap of regimes I and II. (B) In the Hodgkin Huxley type conductance model the current changes are modulated by the two ion channels (Q and Kch) and the leakage channel (L). (C) The predicted ThT fluorescence intensity as a function of time for the Hodgkin Huxley model. Our Hodgkin Huxley model correctly reproduces the E. coli membrane potential dynamics for the wildtype (blue) and kch-mutants (black). The wildtype has two hyperpolarization events. (D) Fluorescence intensity from our microscopy experiments with ThT as a function of time for the wildtype (blue) and Kch-mutants (black).
Figure 6
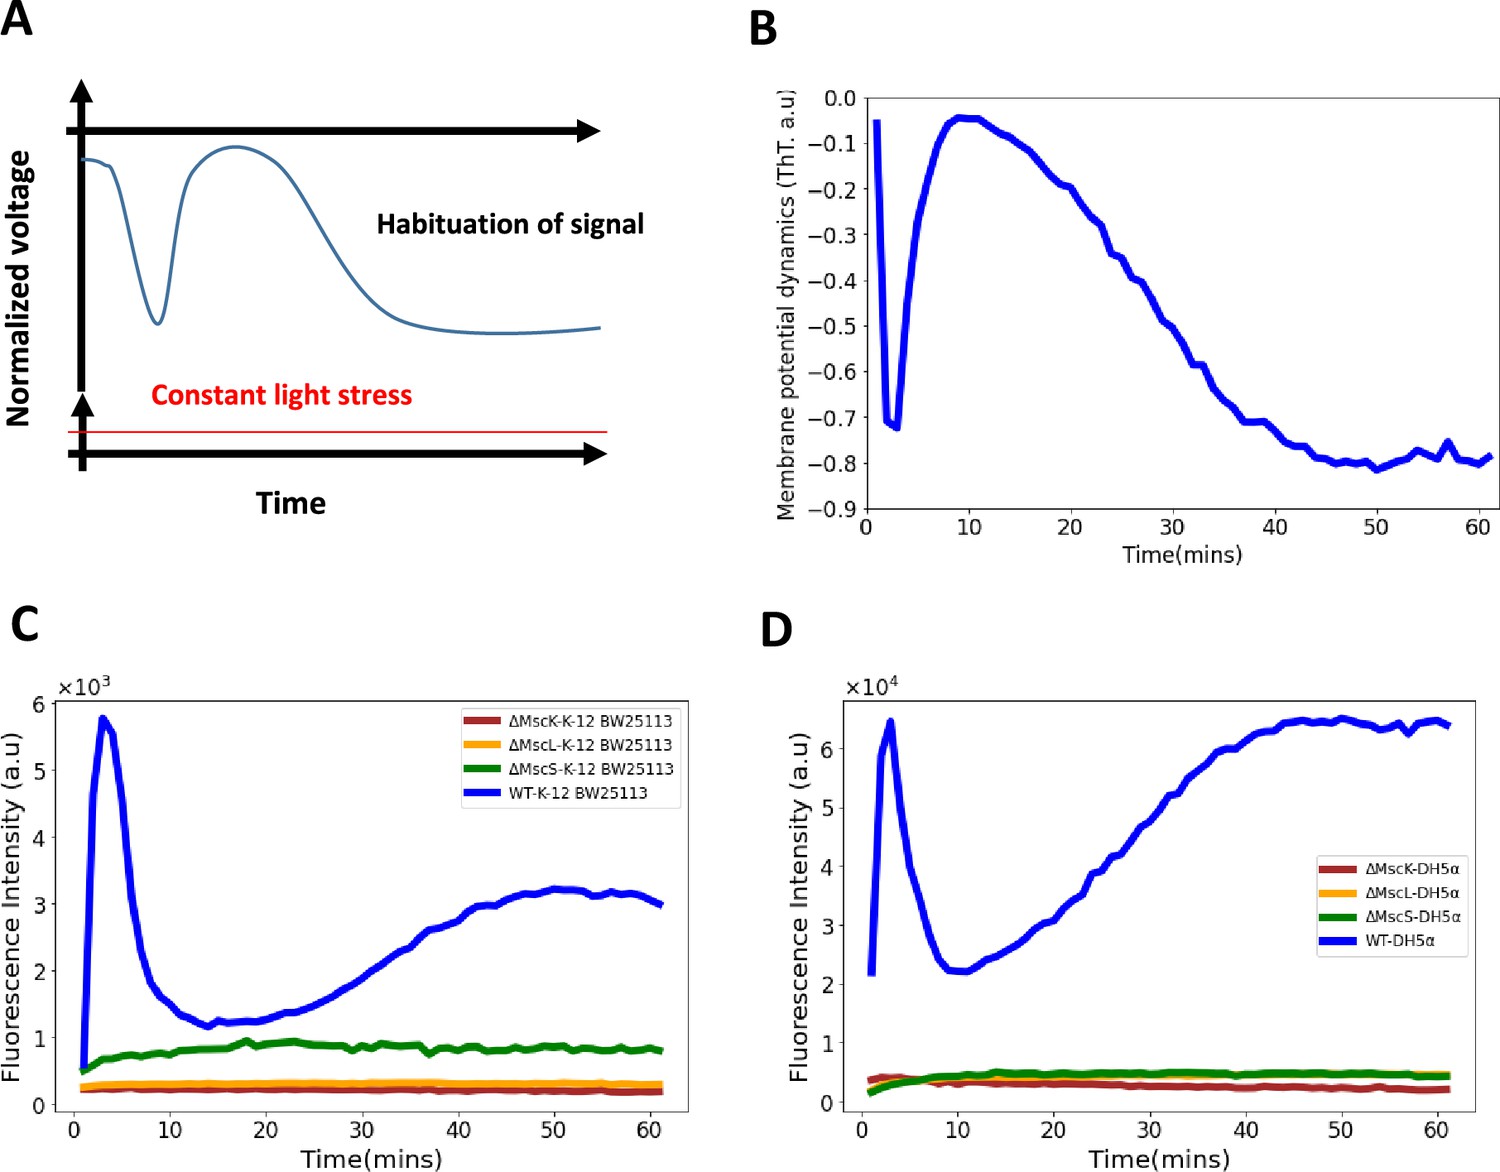
Role of mechananosensitive channels in the first hyperpolarization event in E. coli.
(A) A generic diagram for the membrane voltage during neuronal habituation to a constant stimulus e.g light stress (Avery et al., 2021; Wu et al., 2020). (B) An illustrative diagram of membrane potential dynamics of our experiment as a function of time which is a mirror image of the ThT dynamics for comparison with (A). (C) Membrane potential dynamics for MS mutants of the wildtype, E. coli strain BW25113. (D) Membrane potential dynamics for MS mutants of the wildtype, E. coli DH5α.
Figure 7
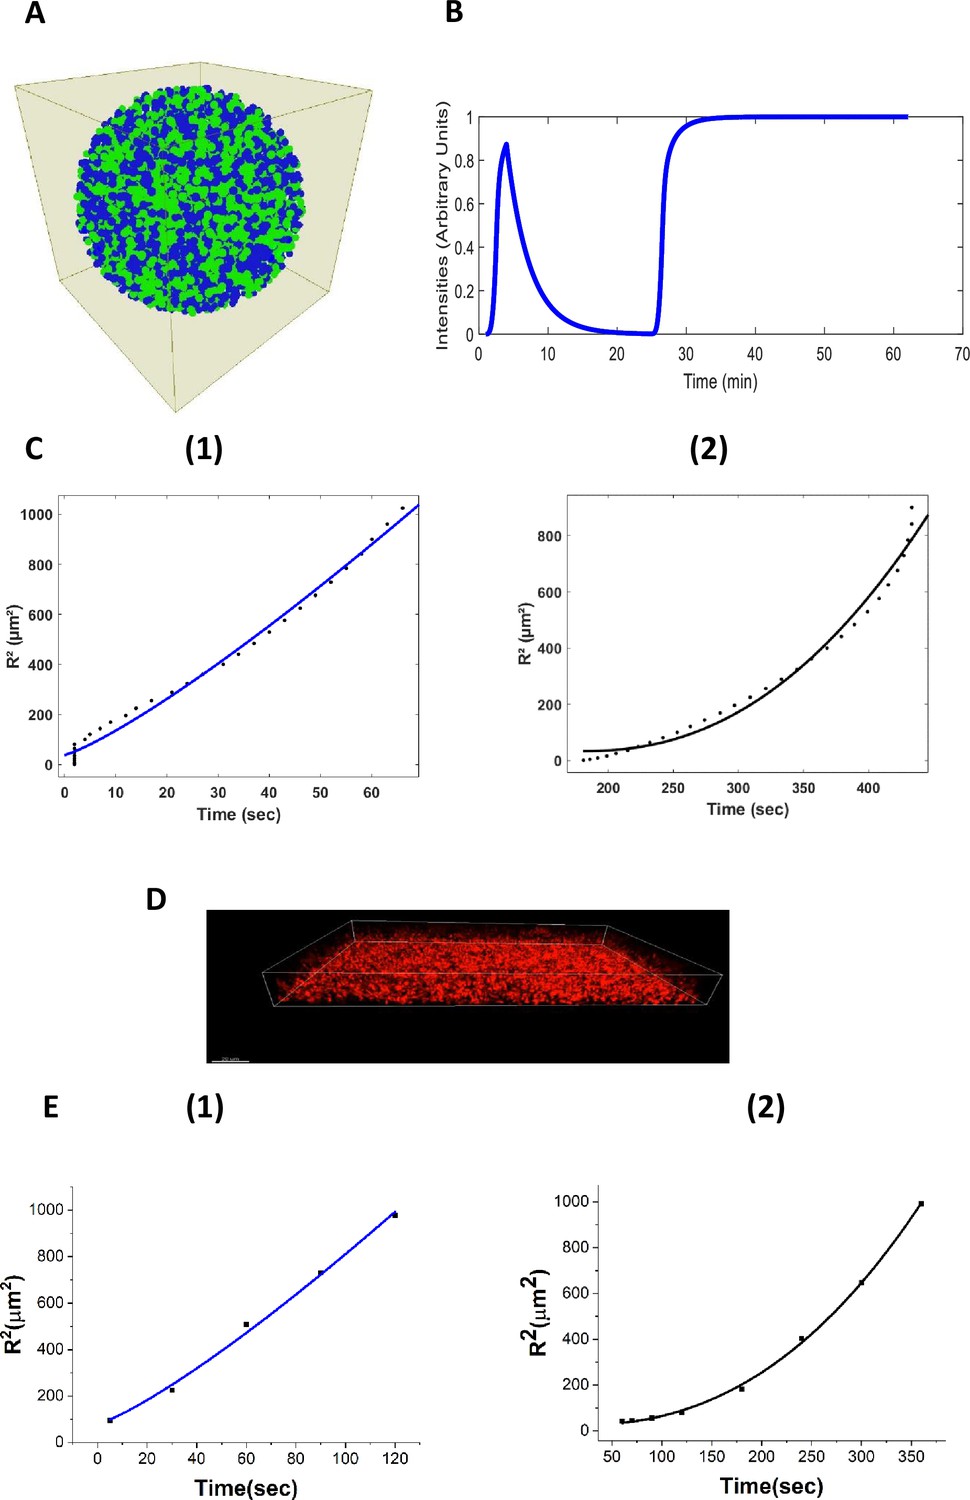
Agent-based fire-diffuse-fire model (ABFDF) and experimental validation of anomalous ion-channel-mediated wave propagation in three-dimensional E. coli biofilm.
(A) 3D spherical biofilm in a fluid-filled environment simulated using BSim. (B) ABFDF global electrical signaling wavefront profile averaged over a three-dimensional biofilm. The ThT intensity is predicted as a function of time. (C) Plot of the square radial distance of the wavefront () against time and fit with a power law, . For the first peak’s (1) centrifugal motion: and (2) centripetal motion: from ABFDF simulation data. (D) Representative confocal fluorescence image for a sessile 3D biofilm containing ThT (Scale bar =20 µm). (E) Plot of against time fit with a power law, for the first peak’s (1) centrifugal motion: and (2) centripetal motion: from the experimental data.
Figure 8
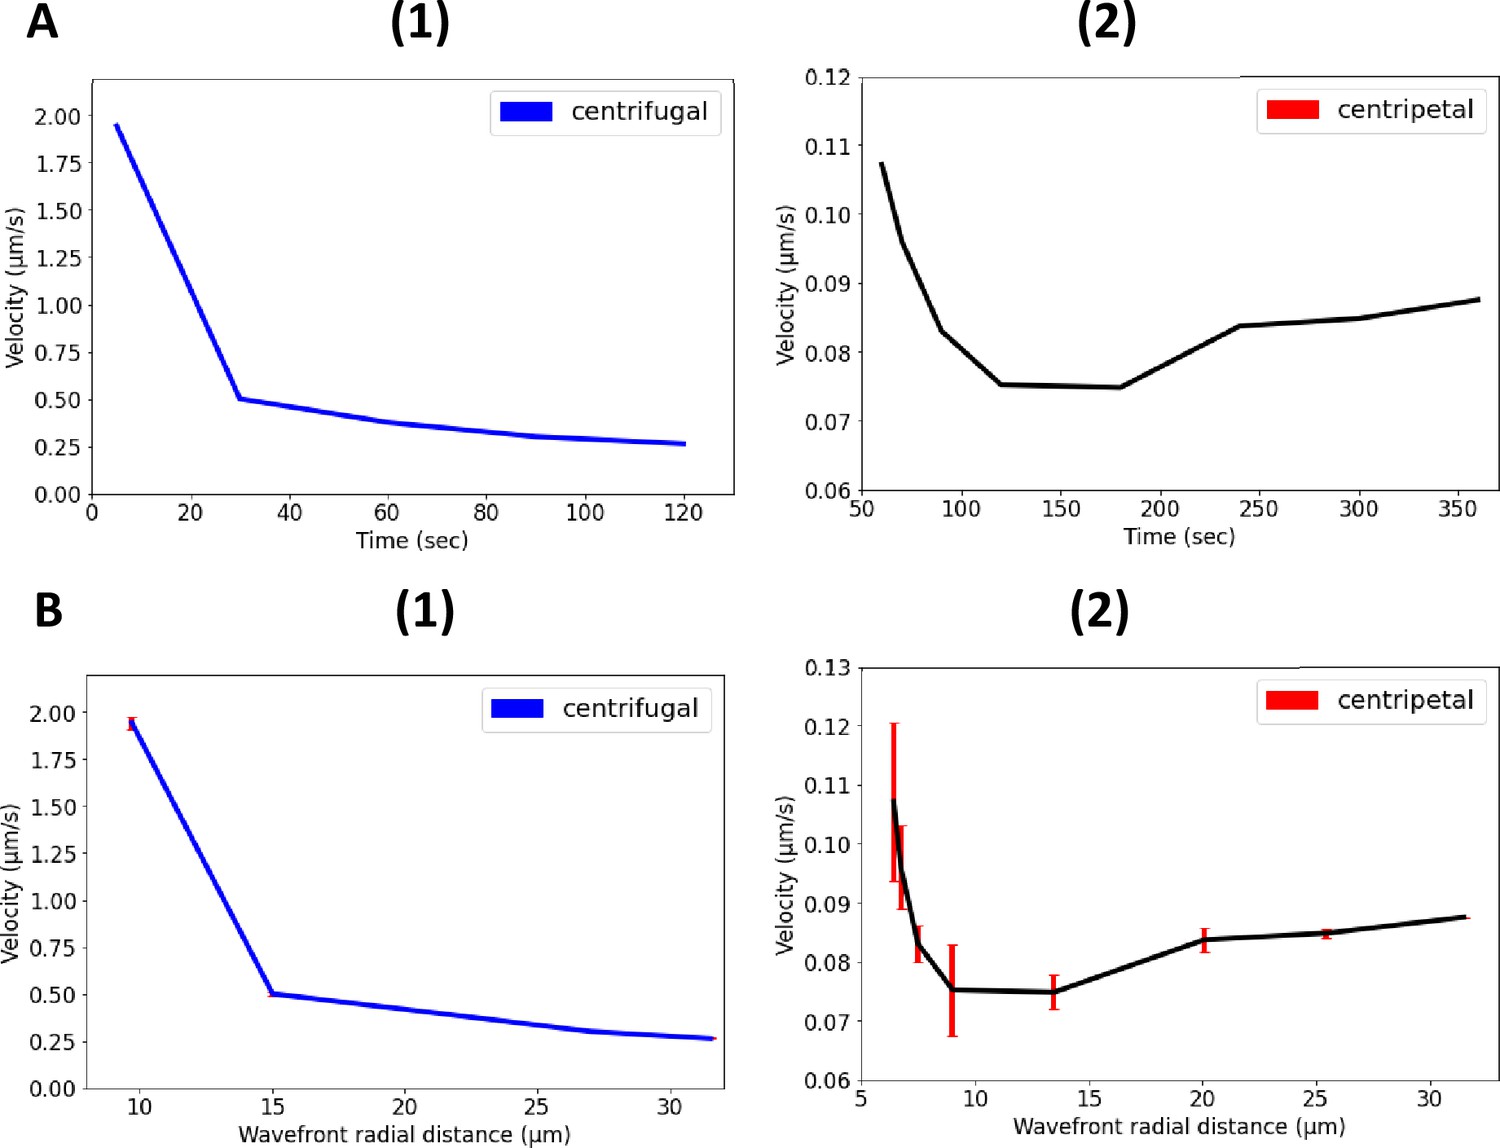
Nonlinear propagation of ion-channel-mediated wave in 3D E. coli biofilms.
(A) Nonlinear relationship between propagation velocity of the wavefront and the time for (1) centrifugal wave and (2) centripetal wave of the first peak. (B) Nonlinear relationship between propagation velocity of the wavefront and the radial distance for (1) centrifugal wave and (2) centripetal wave of the first peak.
Appendix 1—figure 1
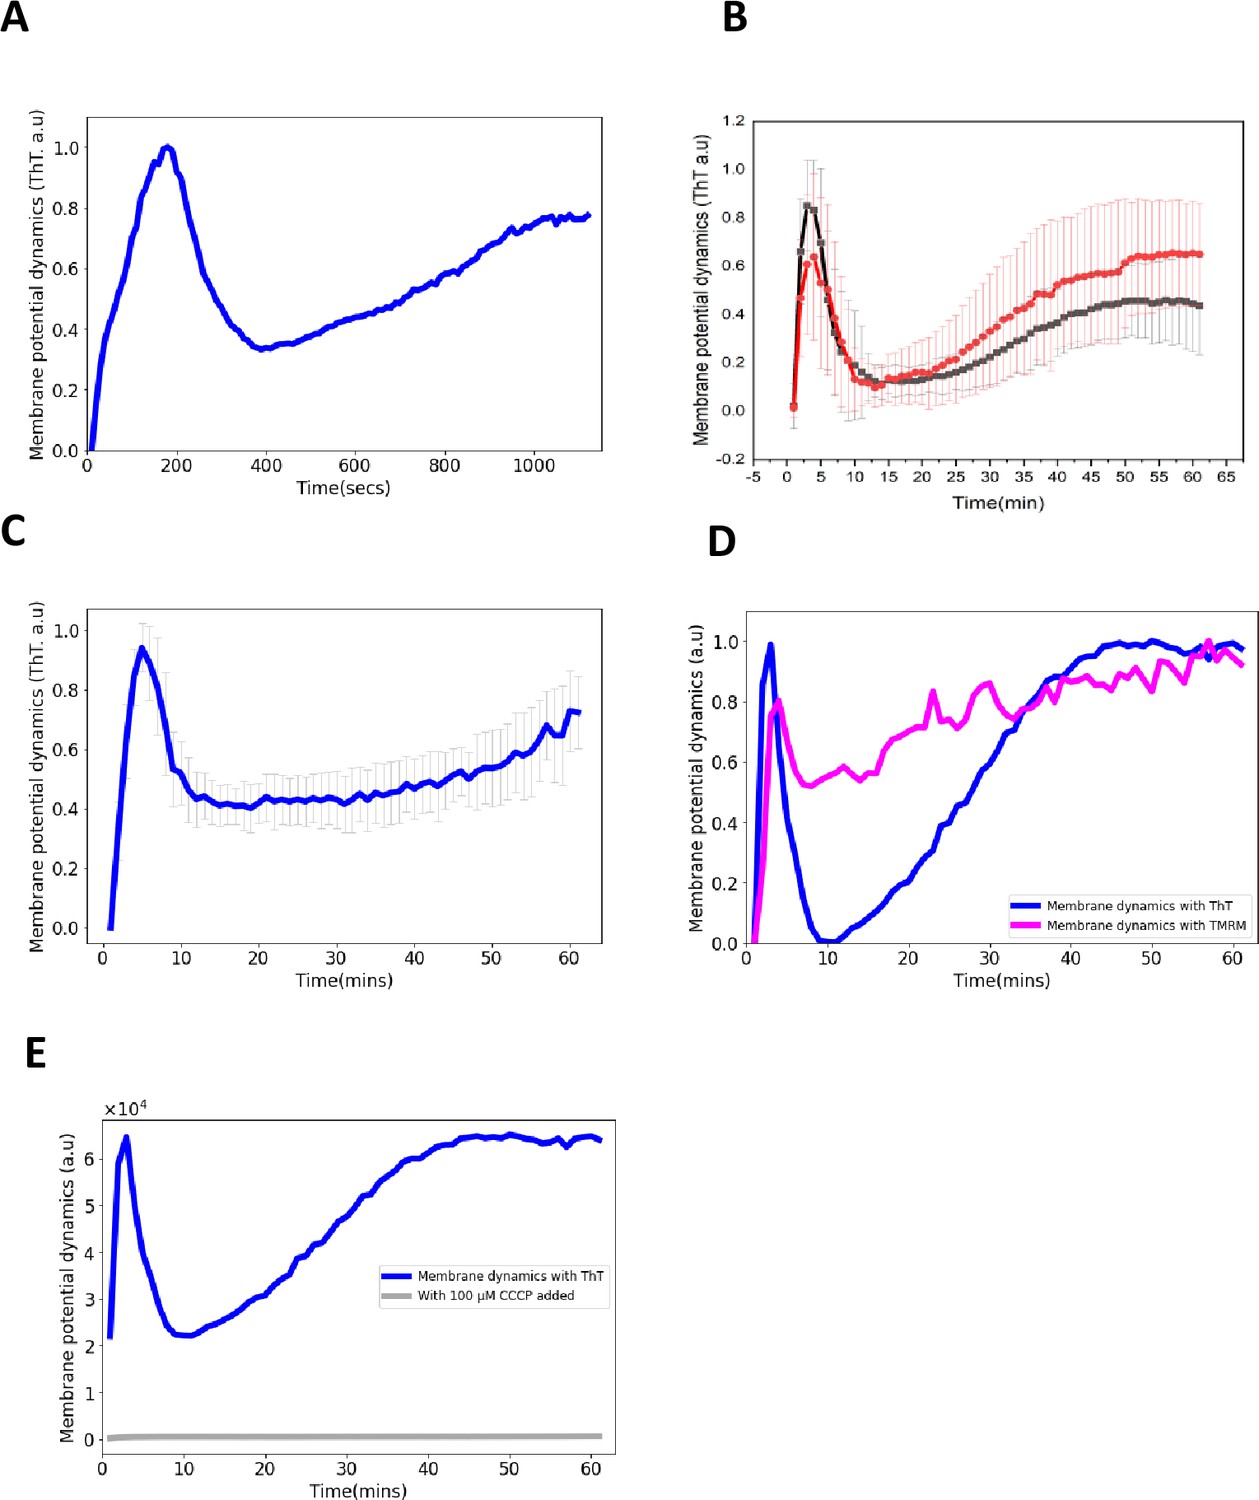
Control experiments for ThT fluorescence in E. coli.
(A) ThT fluorescence as a function of time shows the E. coli membrane potential dynamics under light stress with images collected every 10 s. (B) ThT fluorescence as a function of time shows the membrane potential dynamics for both wildtype E. coli strains, DH5α (red) and E. coli BW25113 (black) (Data: mean ± SD). (C) ThT fluorescence as a function of time shows the membrane potential dynamics of E. coli in M9 media. The light stress was applied continuously each minute for 1 hr with images collected every minute. (D) TMRM and ThT fluorescence as a function of time with E. coli. The cationic dye, TMRM is used to confirm the membrane potential dynamics with ThT. (E) ThT fluorescence as a function of time. CCCP quenches membrane potential dynamics. CCCP was added to cell suspension and left for 50 min before exposure to blue light stress.
Appendix 1—figure 2
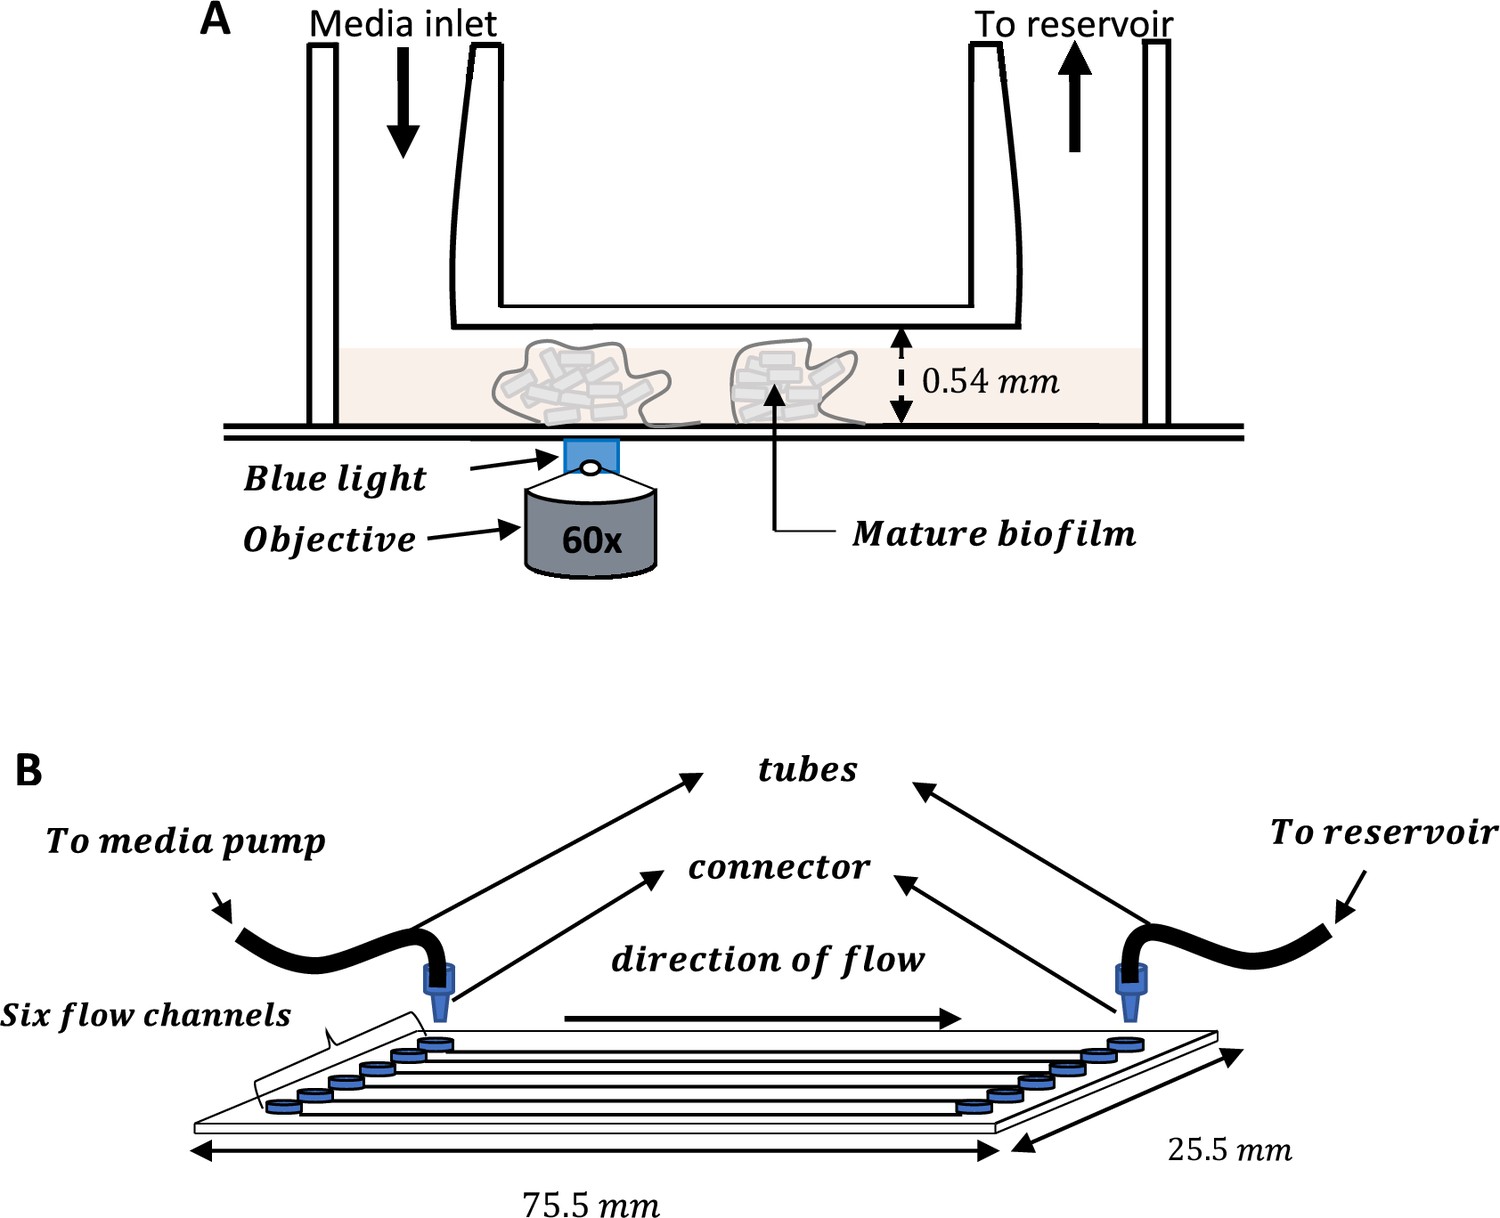
Schematic of the IBIDI flow cells used for all the experiments.
(A) IBIDI uncoated glass bottom µ-Slide VI0.5 showing the inlet and outlet openings. The 0.54 mm depth enabled growth of biofilms in 3D. (B) IBIDI uncoated glass bottom µ-Slide VI0.5 with six identical wells for the growth of E. coli biofilms.
Appendix 1—figure 3
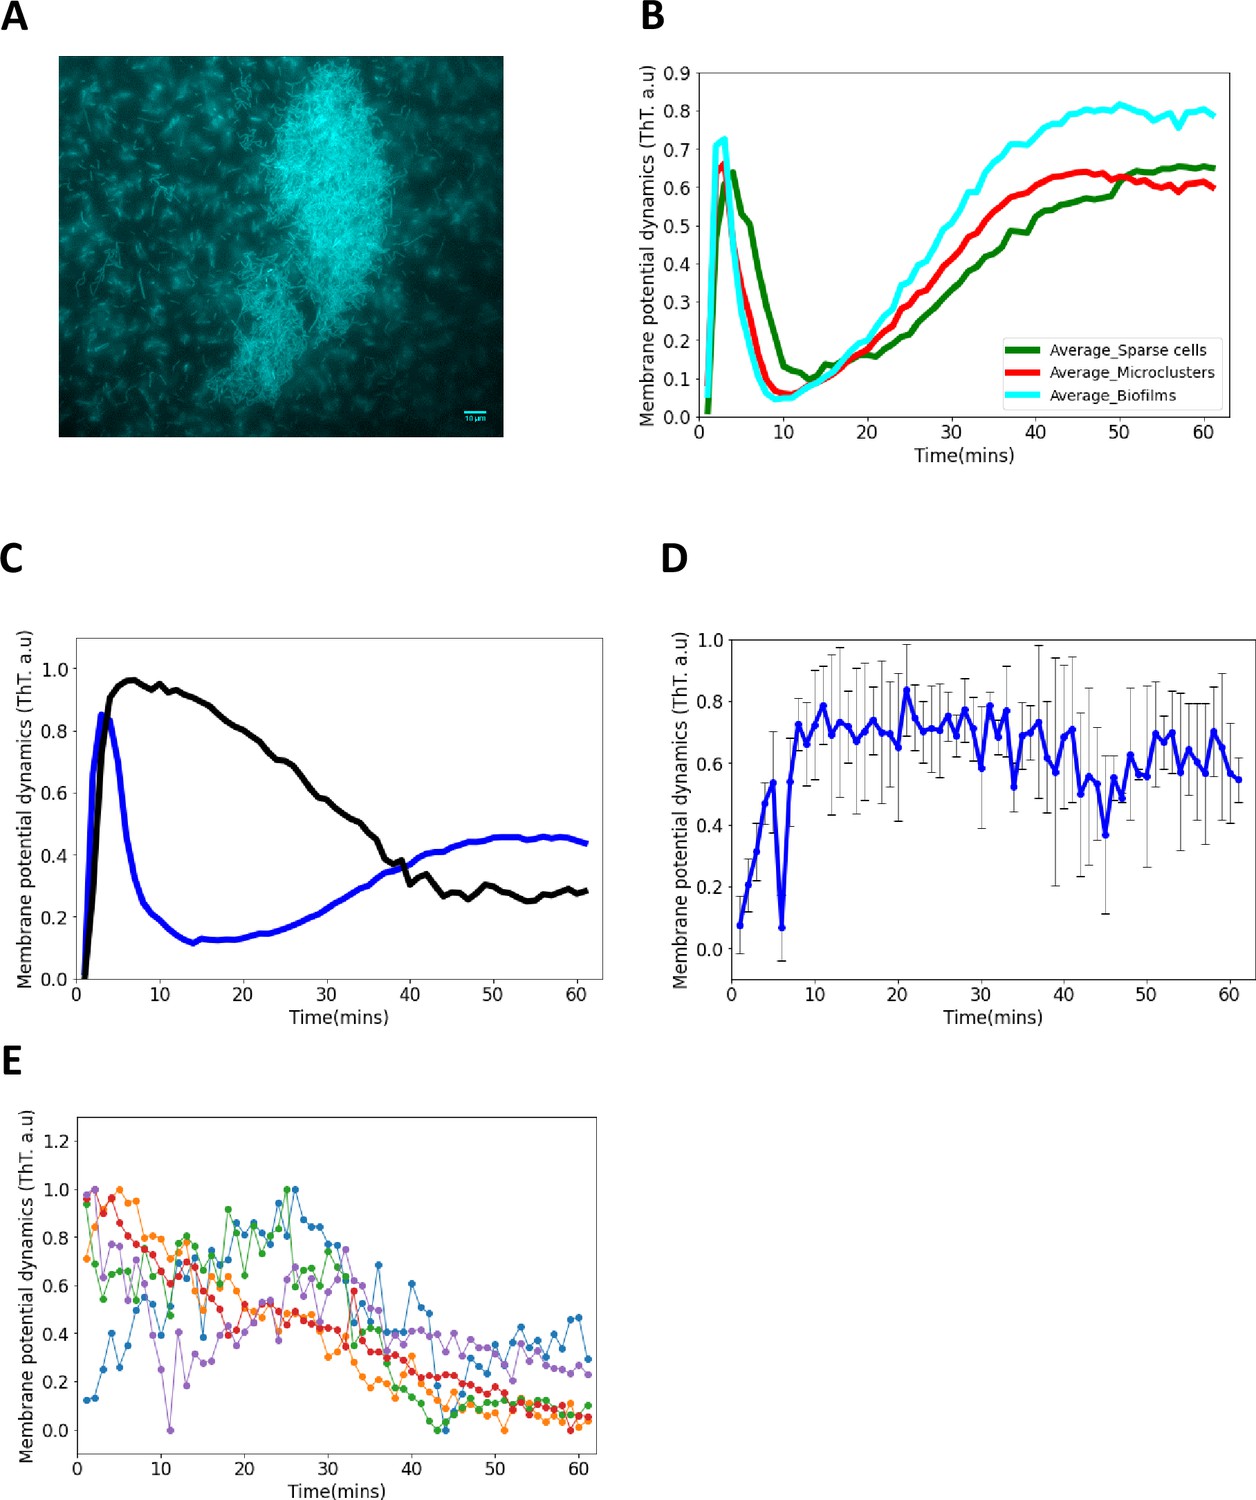
ThT fluorescence in E. coli biofilms.
(A) Representative fluorescence image of a mature sessile biofilm labeled with ThT. The scale bar is 10 µm. (B) ThT fluorescence as a function of time for sparse cells, clustered cells and biofilms. First peak latency is much shorter in E. coli biofilms than in single cells and microclusters. (C) ThT fluorescence shown as a function of time of irradiation. Deletion of Kch inactivates the second peak in single cell E. coli BW25113 ∆kch-mutants. Data is a mean from three experimental replicates per time point for E. coli BW25113 ∆kch-mutants (black) and BW25113 (blue). (D) Membrane potential dynamics of kch-complemented DH5α. (E) Calcium flux in single cells DH5α under light stress.
Appendix 1—figure 4
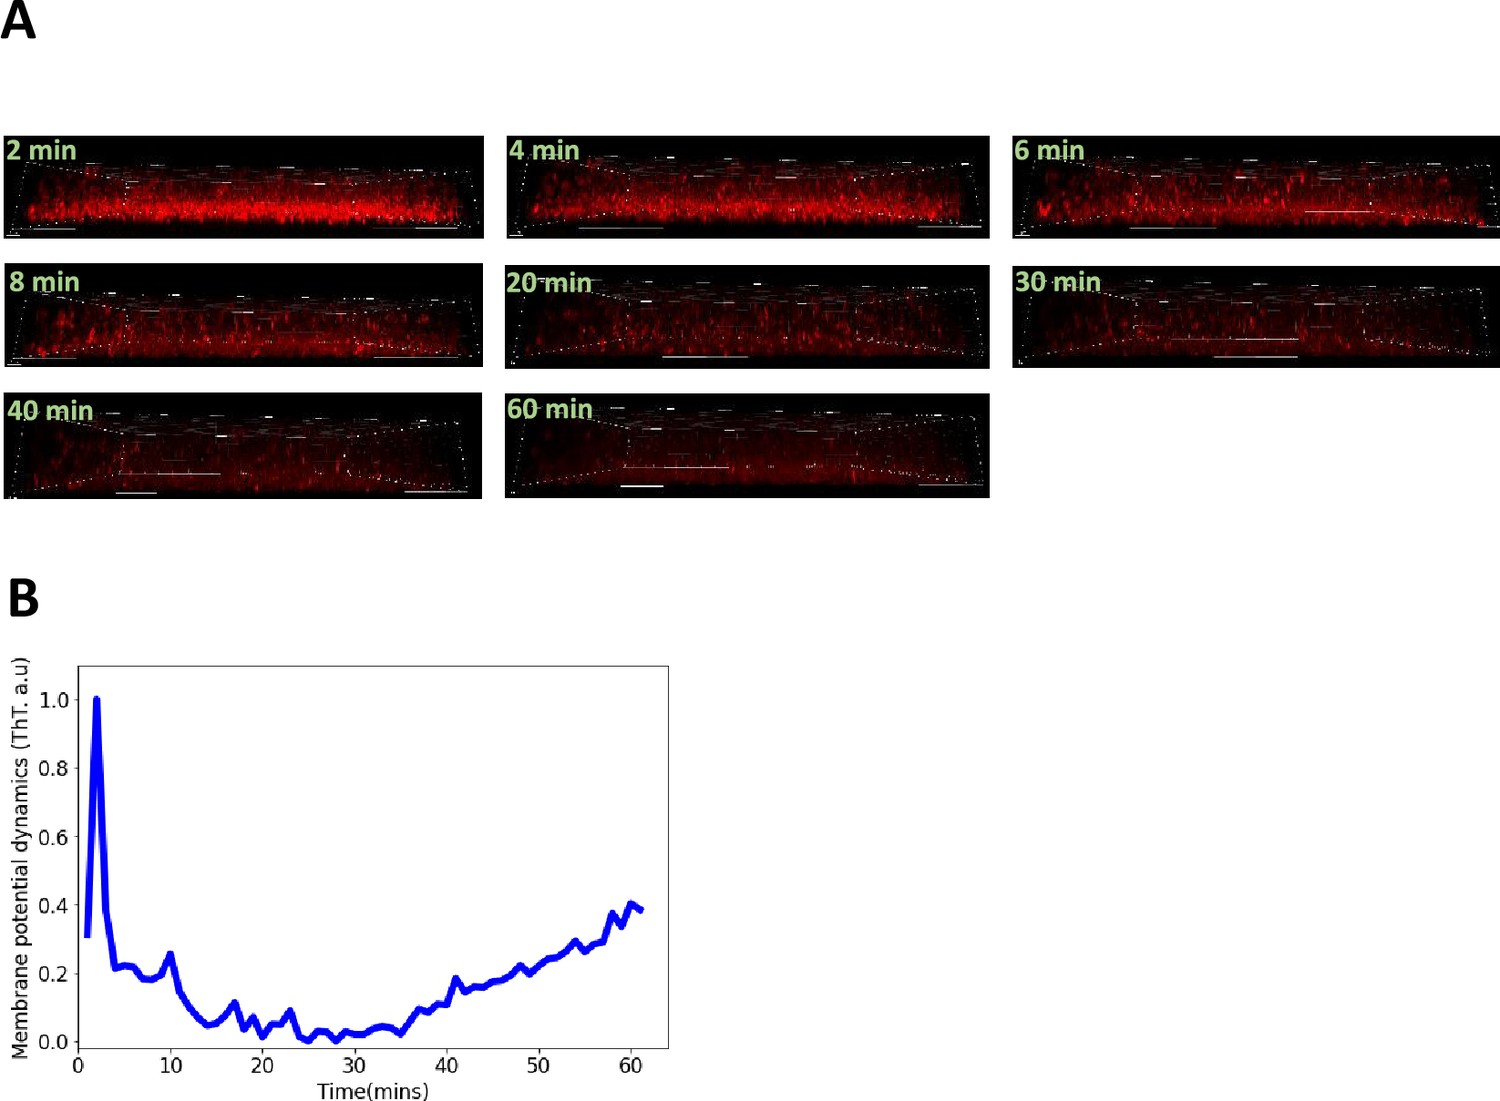
Confocal microscopy experiments with ThT in E. coli biofilms.
(A) Timelapse of the sagittal section of the three-dimensional E. coli biofilm obtained using the confocal microscope. (B) Representative global ThT intensity membrane potential dynamics trace as a function of time obtained from a 3D DH5α E. coli biofilm. The scale bars for all the image are 8 µm.
Appendix 1—figure 5
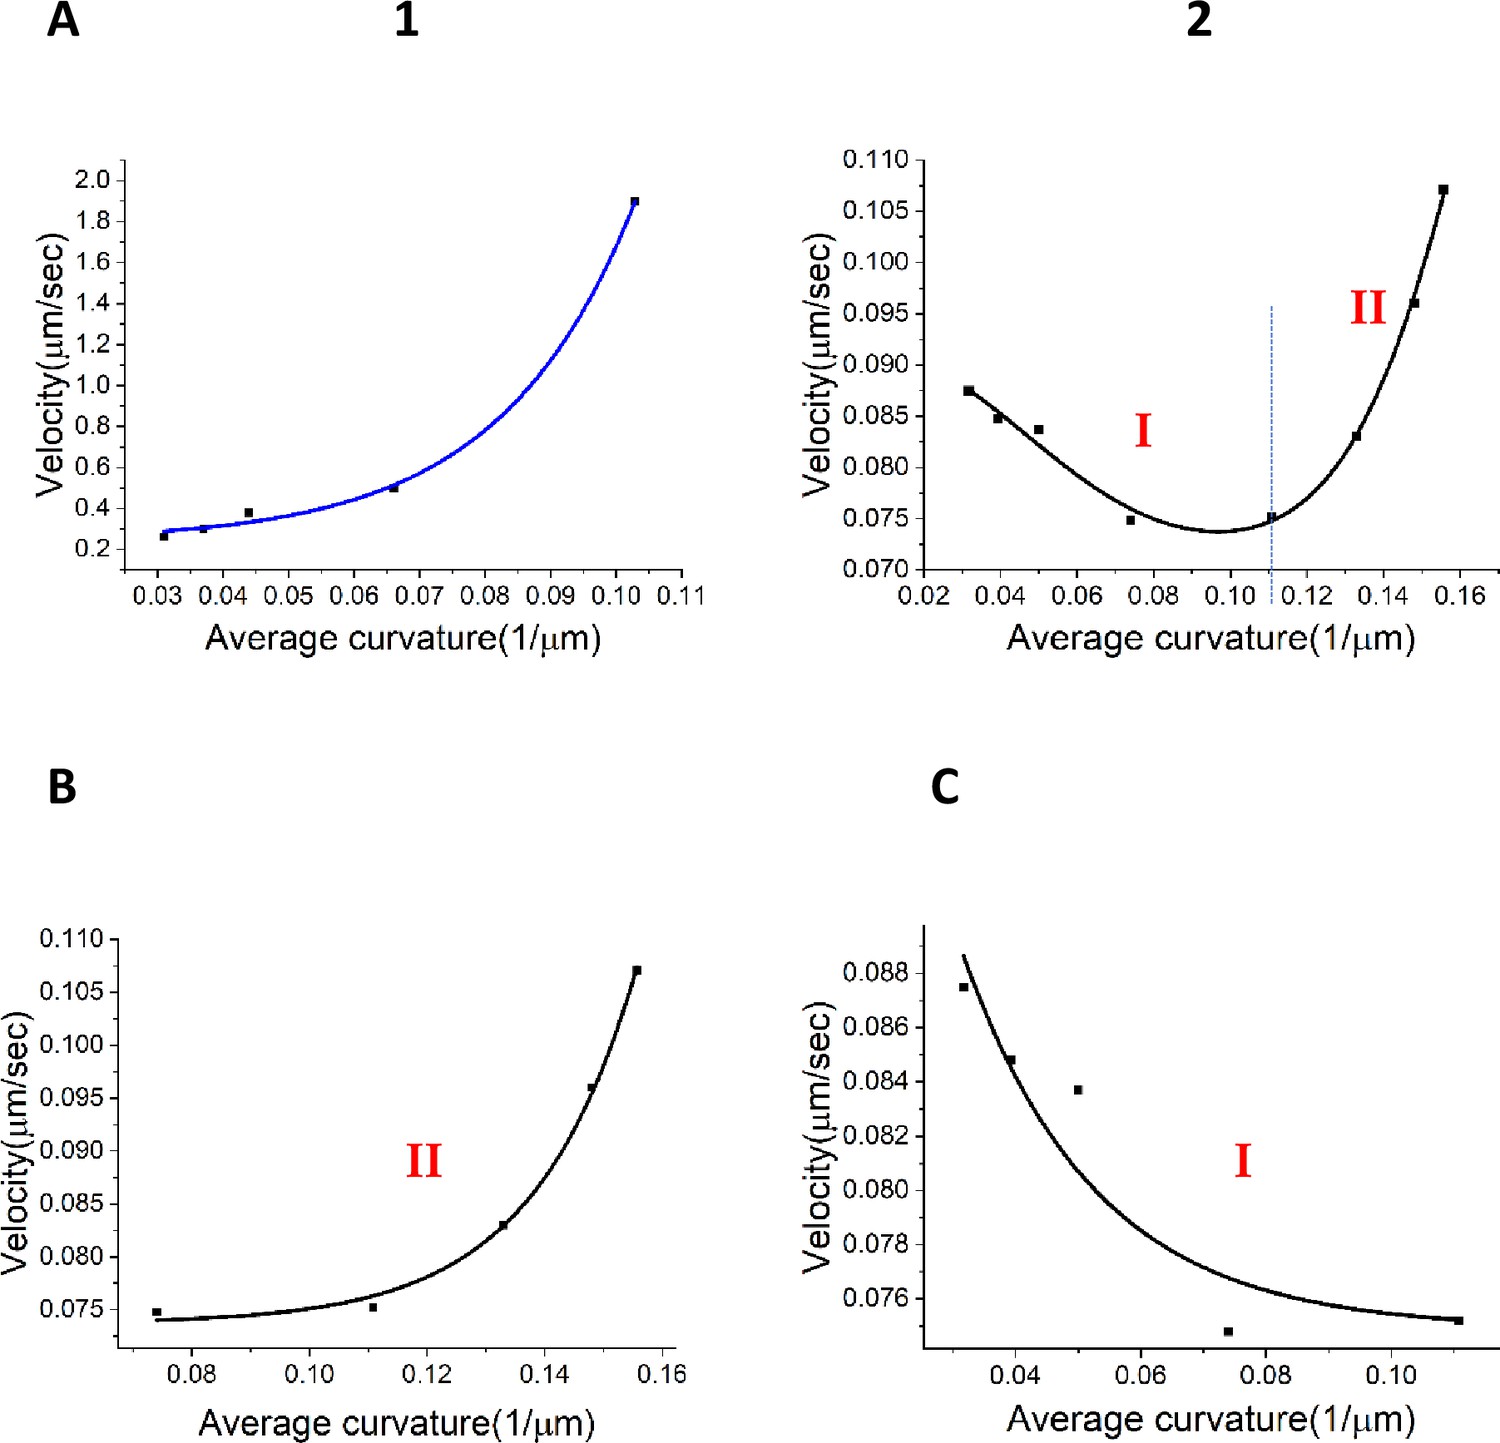
Relationships between velocity and curvature for the wavefronts.
(A) (1) Relation between the wavefront velocity and average curvature from the experimental data for the centrifugal wavefront. (A) (2) Nonlinear relationship between the wavefront velocity and average curvature for the centripetal wavefront. (B) Exponential fit for stage I of the centripetal wavefront travel as shown in (A 2). (C) Exponential fit for stage II of the centripetal wavefront travel shown in (A 2).
Author response image 1

Schematic diagram of ThT loading during an experiment with E. coli cells under blue light illumination i.e. ThT fluorescence as a function of time.
Three empirical regimes for the fluorescence are shown (1, 2 and 3).
Videos
Video 1
Fluorescence microscopy images of ThT in sparse single E. coli cells irradiated with blue light.
Video 2
Fluorescence microscopy images of ThT in E coli microclusters irradiated with blue light.
Video 3
Fluorescence microscopy images of ThT in an E. coli biofilm irradiated with blue light.
Video 4
Fluorescence microscopy images of ThT in knockdown mutants of voltage-gated Kch-potassium channel in E. coli irradiated with blue light.
Video 5
Fluorescence microscopy images of ThT in an E. coli biofilm irradiated with blue light in the presence of ROS scavenger, catalase.
Video 6
3D simulation of electrical signalling in bacterial biofilms via the fire-diffuse-fire agent based model.
Video 7
3D confocal fluorescence microscopy images of ThT in an E. coli biofilm irradiated with blue light.
Tables
Table 1
Fit constants for Equation 1 to results from the ABFDF and experimental data.
| Constants | Symbol | Centrifugal wavefrontModel | Centripetal wavefrontModel | Centrifugal wavefrontExperiment | Centripetal wavefrontExperiment |
|---|---|---|---|---|---|
| The anomalous exponent | γ | 1.21 ± 0.12 | 2.26 ± 0.31 | 1.22 ± 0.15 | 2.43 ± 0.08 |
| The critical biofilm size | Rc | 6.17 ± 1.84 µm | – | 4.71 ± 0.98 µm | – |
Appendix 1—table 1
Parameters for the Mathematical modeling of membrane potential dynamics in E. coli.
| Parameter | Description | Value | Units |
|---|---|---|---|
| Potassium channel conductance | 90 | min−1 | |
| Leak channel conductance | 0.2 | min−1 | |
| channel conductance | 5 | min−1 | |
| Nernst Potential for Potassium | −94 | mV | |
| Nernst potential for channel | −200 | mV | |
| Nernst potential for leak channel | −156 | mV | |
| Stress threshold for opening of ion channels | 0.04 | μM | |
| Voltage threshold for stress production | −150 | mV | |
| Maximum rate of channel opening | 2 | min−1 | |
| Channel opening rate decay constant | 1.3 | min−1 | |
| Cooperativity parameter for ion channels | 1 | – | |
| Stress threshold sharpness coefficient | 0.2 | mV | |
| Extracellular ion relaxation rate | 10 | min−1 | |
| Leak slope coefficient | 8 | mV/mM | |
| channel slope coefficient | 2 | mV/mM | |
| Potassium channel slope coefficient | 1 | mV/mM | |
| Stress production slope coefficient | 0.001 | μM/ (minmV) | |
| ThT uptake rate coefficient | 0.4 | μM/ (minmV) | |
| Stress decay rate | 0.1 | min−1 | |
| ThT decay rate | 4 | min−1 | |
| Membrane capacitance | 5.6 | mM/mV |
Appendix 1—table 2
Parameters used for the agent-based Fire-diffuse-fire model in the three-dimensional E. coli biofilm.
| Field and model parameters | Symbols | Values |
|---|---|---|
| Diffusion coefficient | Dc | 0.1 μm2 |
| Simulation time step | Ts | 1 sec |
| Total time of simulation for the 2 peaks | ts | 3660 sec |
| Total time of simulation for the first peak | ts | 720 sec |
| Size of fluid-filled environment | Sb | 64 μm × 64 μm × 64 μm |
| Fixed amount of chemical added | σ | 5 × 109 μm−3 |
| Threshold concentration to fire | c | 103 μm−3 |
| Decay rate (for refractoriness) | υ | 7 × 10⁻³ molecules−1 |
Appendix 1—table 3
Fit constants for the centrifugal and centripetal wavefronts from experimental data.
| Fit constants for the centrifugal wavefront | Values |
|---|---|
| 0.23 ± 0.04 | |
| 0.010 ± 0.008 | |
| 0.020 ± 0.002 | |
| Fit constants for the centripetal wavefront – Stage I | |
| 0.074 ± 0.001 | |
| – | |
| 0.018 ±0.002 | |
| Fit constants for the centripetal wavefront – Stage II | |
| 0.075 ± 0.003 | |
| – | |
| −0.02 ± 0.01 |
Appendix 1—table 4
Media recipe, bacterial strains, software, and microfluidic components.
| Media | Recipe | |
|---|---|---|
| Luria Broth (LB) | 10 g/l NaCl, 5 g/l yeast extract, 10 g/l Tryptone. Distilled water to 1 L | |
| LB agar | 10 g/l NaCl, 5 g/l yeast extract, 10 g/l Tryptone, 15 g/l agar. | |
| Minimal Media (M9) (1 L) | M9 salts (64 g/l Na2HPO4·7 H20, 15 g/l KH2PO4, 2.5 g/l NaCl, 5.0 g NH4Cl), 1 M CaCl2, 1 M MgSO4, 10% Arginine, 20% of glucose | |
| Experimental Models: Organisms/Strains | ||
| E. coli DH5α | Ian Robert’s lab | |
| E. coli DH5α (∆Kch) | This study | |
| E. coli DH5α (∆MscK) | This study | |
| E. coli DH5α (∆MscL) | This study | |
| E. coli DH5α (∆MscS) | This study | |
| E. coli BW25113 (JW1242-1) | Keio Collection Baba et al., 2006 | |
| E. coli BW25113 (∆Kch) | Keio Collection Baba et al., 2006 | |
| E. coli BW25113 (∆MscL) | Keio Collection Baba et al., 2006 | |
| E. coli BW25113 (∆MscS) | Keio Collection Baba et al., 2006 | |
| E. coli BW25113 (∆MscK) | Keio Collection Baba et al., 2006 | |
| Reagent or Resource | Source | IdentifierDENTIFIER |
| Propidium Iodide (PI) | Thermo Fisher Scientific | Cat #: P1304MP |
| Thioflavin T (ThT) | Sigma-Aldrich | Cat #: T3516 |
| Carbonyl cyanide 3-chlorophenylhydrazone (CCCP) | Sigma-Aldrich | Cat #: C2759 |
| ION Potassium Green–4 (IPG-4) AM | ION Biosciences | https://ionbiosciences.com/product/ipg-4-am/ |
| Tetramethylrhodamine methyl ester perchlorate (TMRM) | Sigma-Aldrich | Cat No: T5428 |
| pkLL11-GCaMP6f bb100 | A gift from Joel Kralj | Addgene plasmid #158983 |
| Software and AlgorithmsHartmann et al., 2021; Schindelin et al., 2012 | ||
| ImageJ Fiji | Schindelin et al., 2012 | https://fiji.sc/ |
| Python (Anaconda) | Python | https://anaconda.org/ContinuumIO |
| MATLAB | MATLAB | https://uk.mathworks.com /products/matlab.html |
| BiofilmQ | Hartmann et al., 2021 | https://drescherlab.org/data/biofilmQ/ docs/usage/installation.html |
| OriginPro | https://www.originlab.com/origin | https://www.originlab.com/origin |
| IMARIS | https://imaris.oxinst.com/ | https://imaris.oxinst.com/ |
| Microfluidics | ||
| IBIDI flow cell | Thistle Scientific | Cat #: 80607 |
| IBIDI Elbow Luer Connector Male | Thistle Scientific | Cat #: 10802 |
| C-Flex laboratory tubing with I.D. x O.D. 1/32 in. x 3/32 in | Sigma-Aldrich | Cat #: T8413-25FT. |
Additional files
Download links
A two-part list of links to download the article, or parts of the article, in various formats.
Downloads (link to download the article as PDF)
Open citations (links to open the citations from this article in various online reference manager services)
Cite this article (links to download the citations from this article in formats compatible with various reference manager tools)
Emergence of ion-channel-mediated electrical oscillations in Escherichia coli biofilms
eLife 13:RP92525.
https://doi.org/10.7554/eLife.92525.3


