The catalytic mechanism of the RNA methyltransferase METTL3
- Department of Biochemistry, University of Zurich, Switzerland
- Department of Chemistry, Boston University, United States
- Université Paris Cité, CNRS, Laboratoire de Chimie et Biochimie Pharmacologiques et Toxicologiques, France
- Department of Physics, Boston University, United States
- Department of Biomedical Engineering, Boston University, United States
Figures
Figure 1
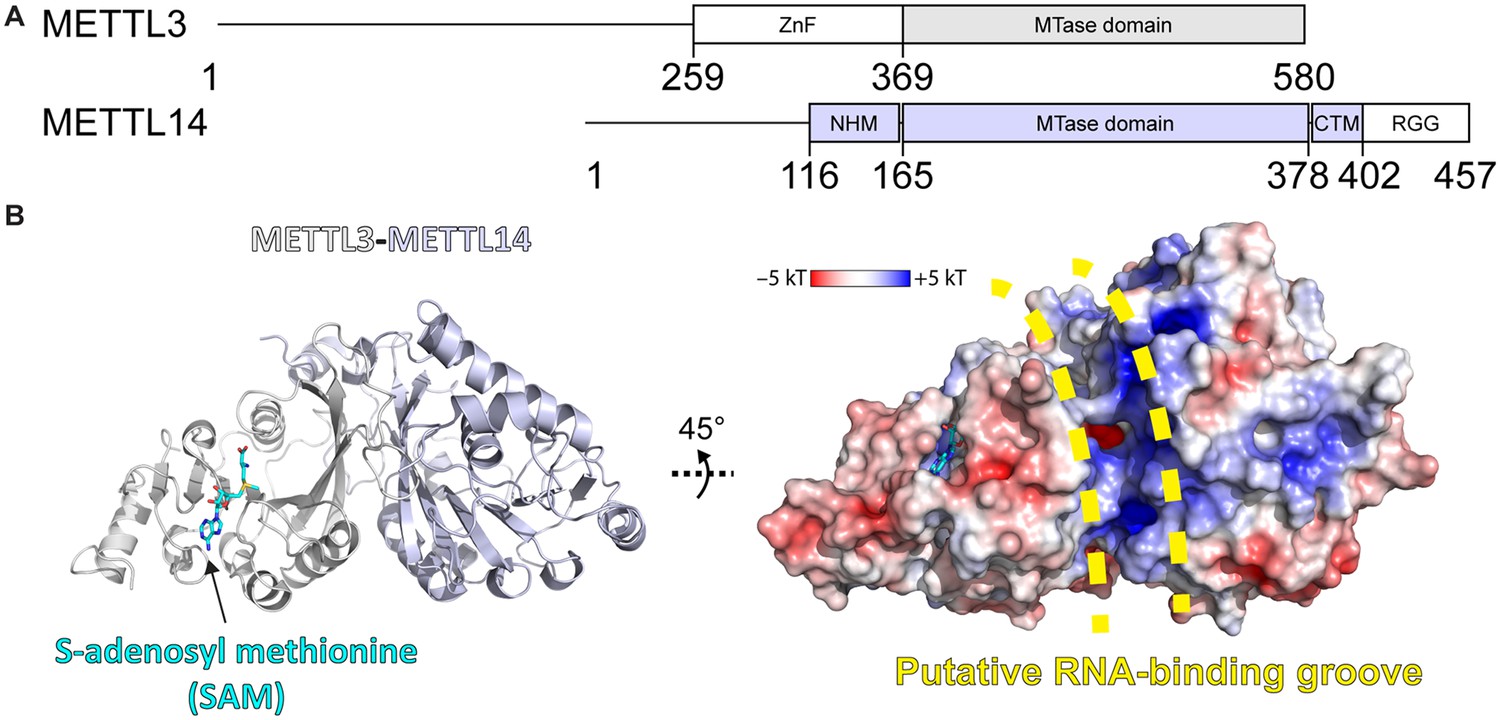
Methyltransferase-like proteins 3 and 14 (METTL3-14) domain architecture and structure.
(A) Domain architecture of METTL3 and METTL14. ZnF = zinc finger, NHM = N-terminal α-helical motif, CTM = C-terminal motif, RGG = arginine-glycine-glycine motif. (B) Crystal structure of the methyltransferase (MTase) domains of METTL3-14. Ribbon representations (left) are coloured as in panel (A). Surface renderings (right) are coloured according to the electrostatic potential. S-Adenosylmethionine (SAM) and the putative RNA binding site are indicated.
Figure 2 with 1 supplement
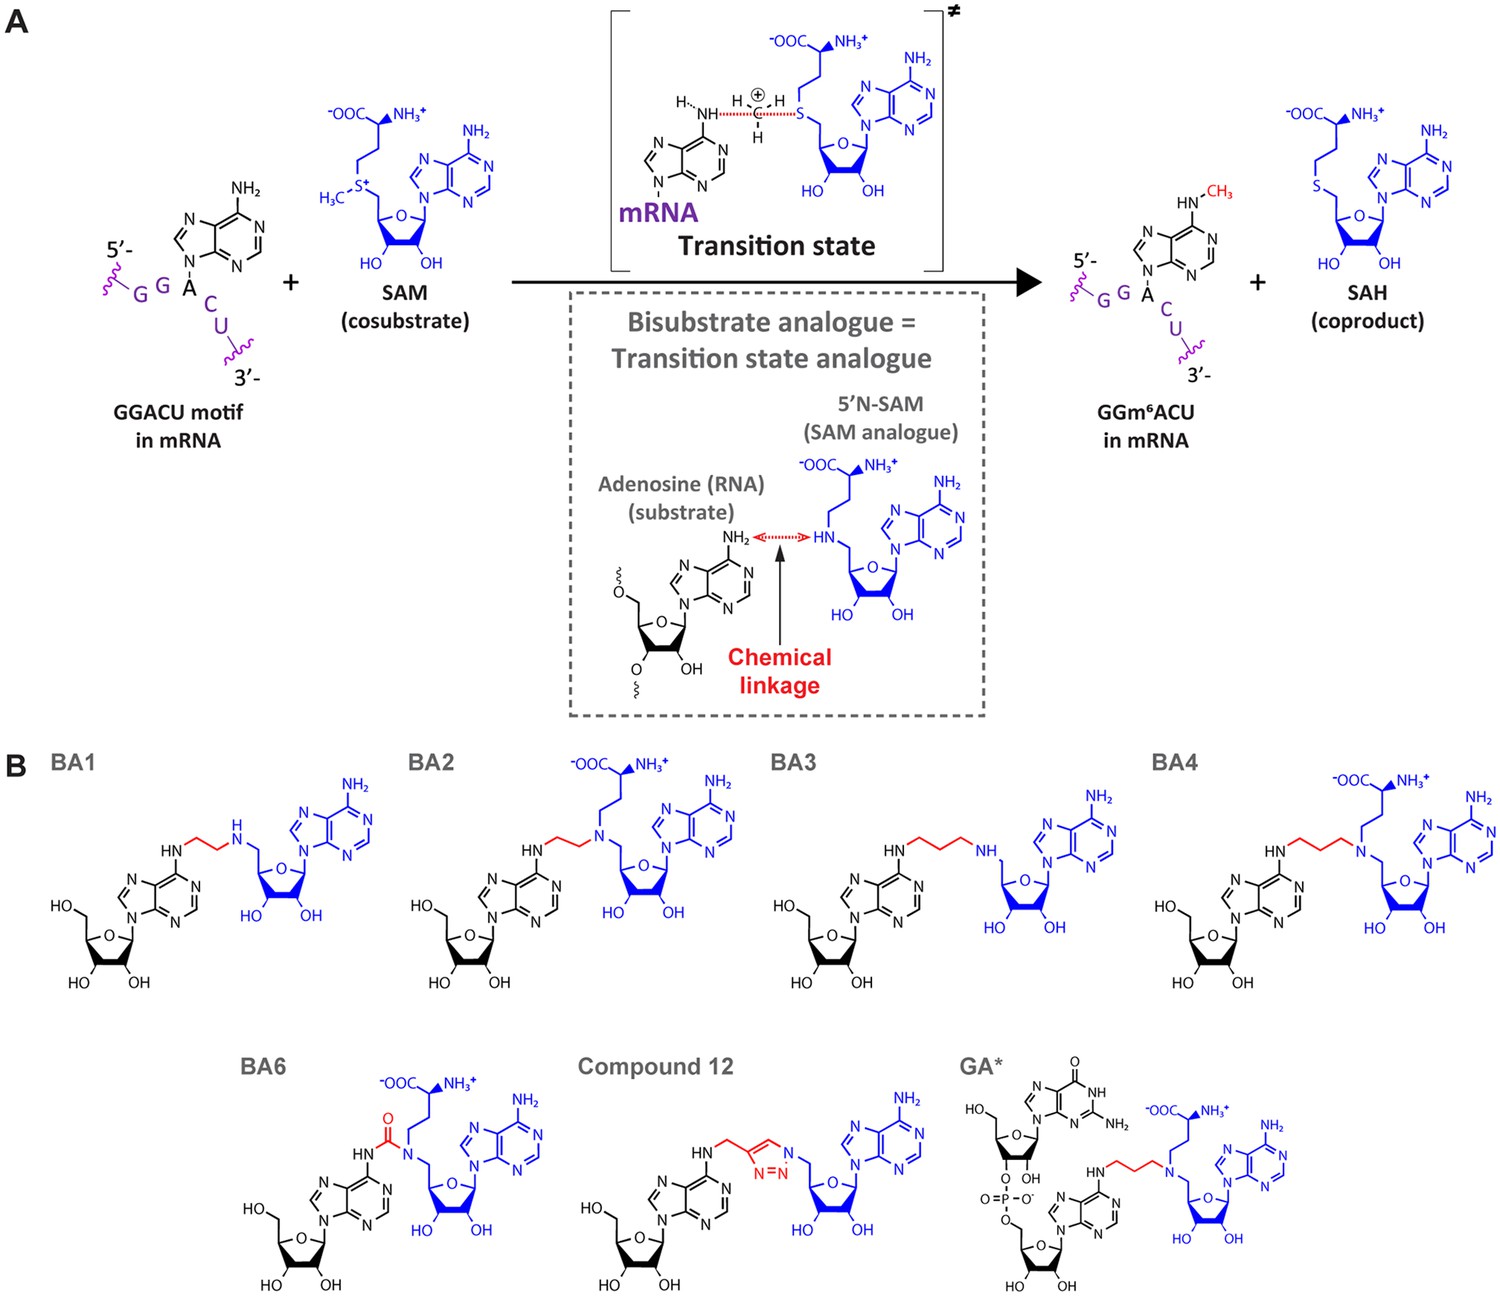
Bisubstrate analogues (BAs) as transition state mimics for methyltransferase-like protein 3 (METTL3).
(A) METTL3-catalysed transfer of the methyl group of S-adenosylmethionine (SAM) to the N6-atom of A in a GGACU motif-containing messenger RNA (mRNA) and the production of N6-methyladenosine (m6A) and S-adenosylhomocysteine (SAH). The inset shows the design principle of BAs as transition state analogues. The point of linkage in the BA is indicated with a double arrow (red) between the N6-atom of adenosine and 5’N of the SAM analogue. (B) Chemical structures of the BAs used in this study. Substrate adenosine = black; SAM analogue = blue; linker = red. Compound names are as previously published: BA1/2/3/4/6, Oerum et al., 2019; Compound 12, Atdjian et al., 2020; GA*, Meynier et al., 2022.
Figure 2—figure supplement 1
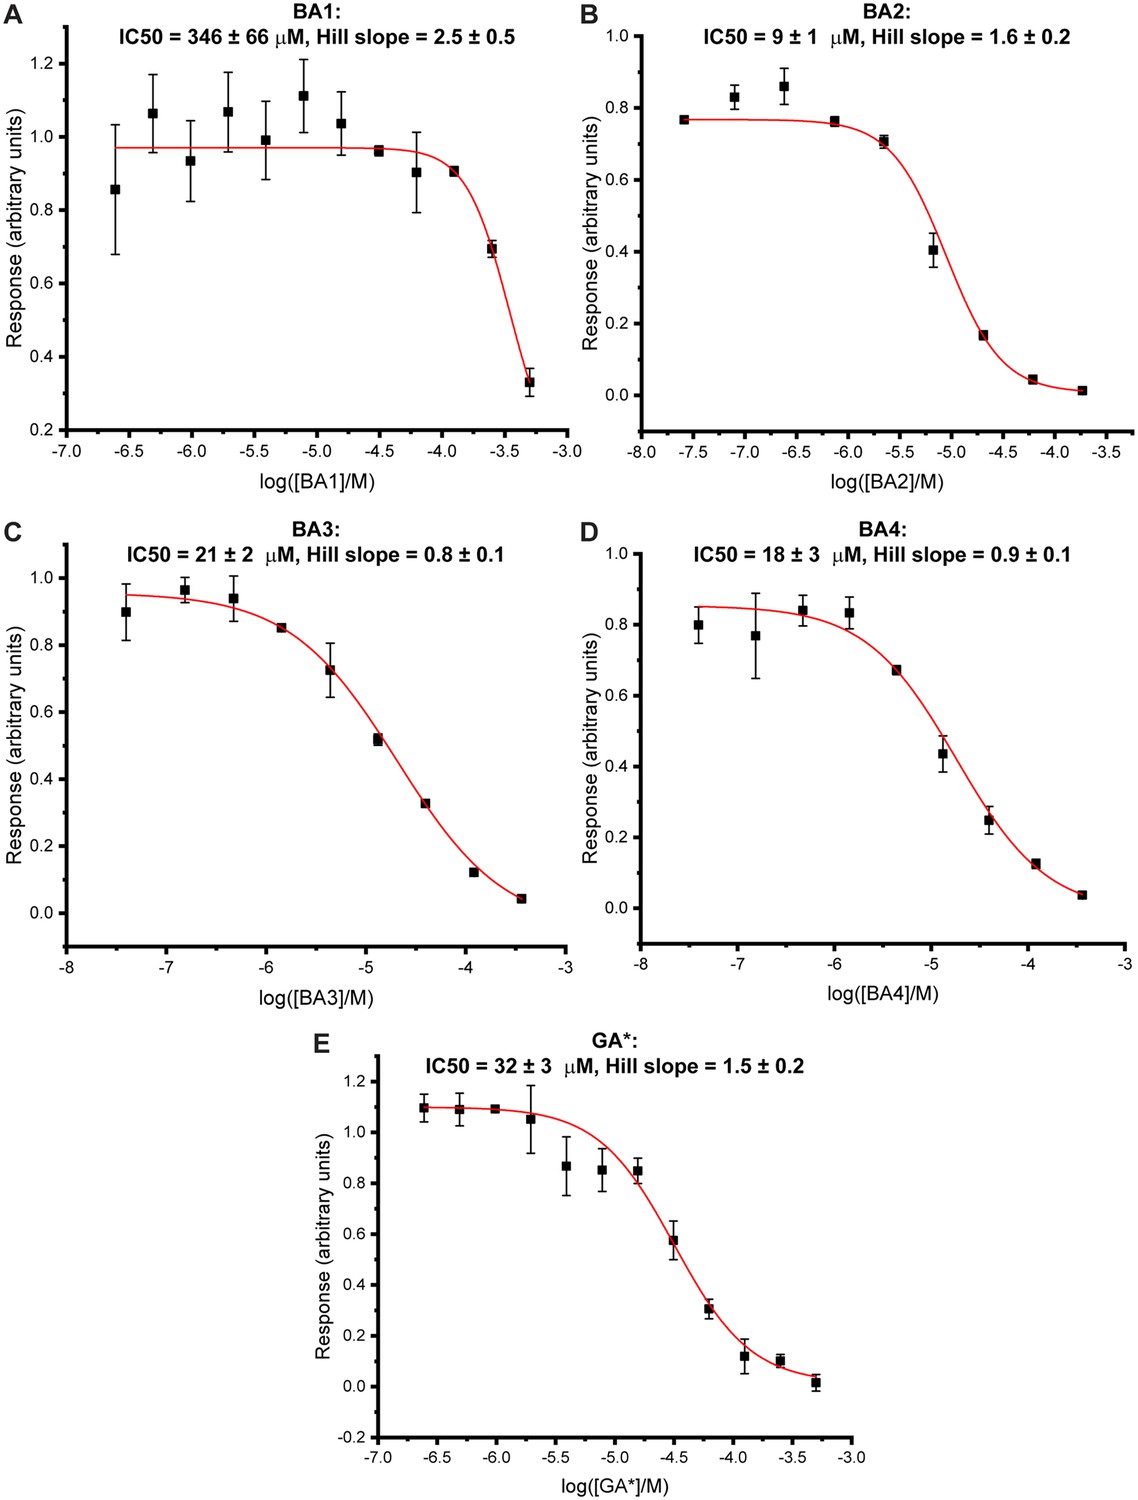
Bisubstrate analogues show dose-dependent inhibitory effects in a time resolved-Förster resonance energy transfer (TR-FRET)-based enzymatic assay of methyltransferase-like proteins 3 and 14 (METTL3-14).
Dose-response curves derived from the reader-based TR-FRET inhibition assay on METTL3-14 (mean ± standard deviation, n=2 or 3 technical replicates) for bisubstrate analogues (BAs) for which IC50 values could be determined: BA1 (A), BA2 (B), BA3 (C), BA4 (D), and GA* (E). IC50 and Hill slope values were obtained from fits with nonlinear regression ‘log(inhibitor) vs. normalised response with variable slope’ and are given at the top of each curve.
Figure 3 with 2 supplements
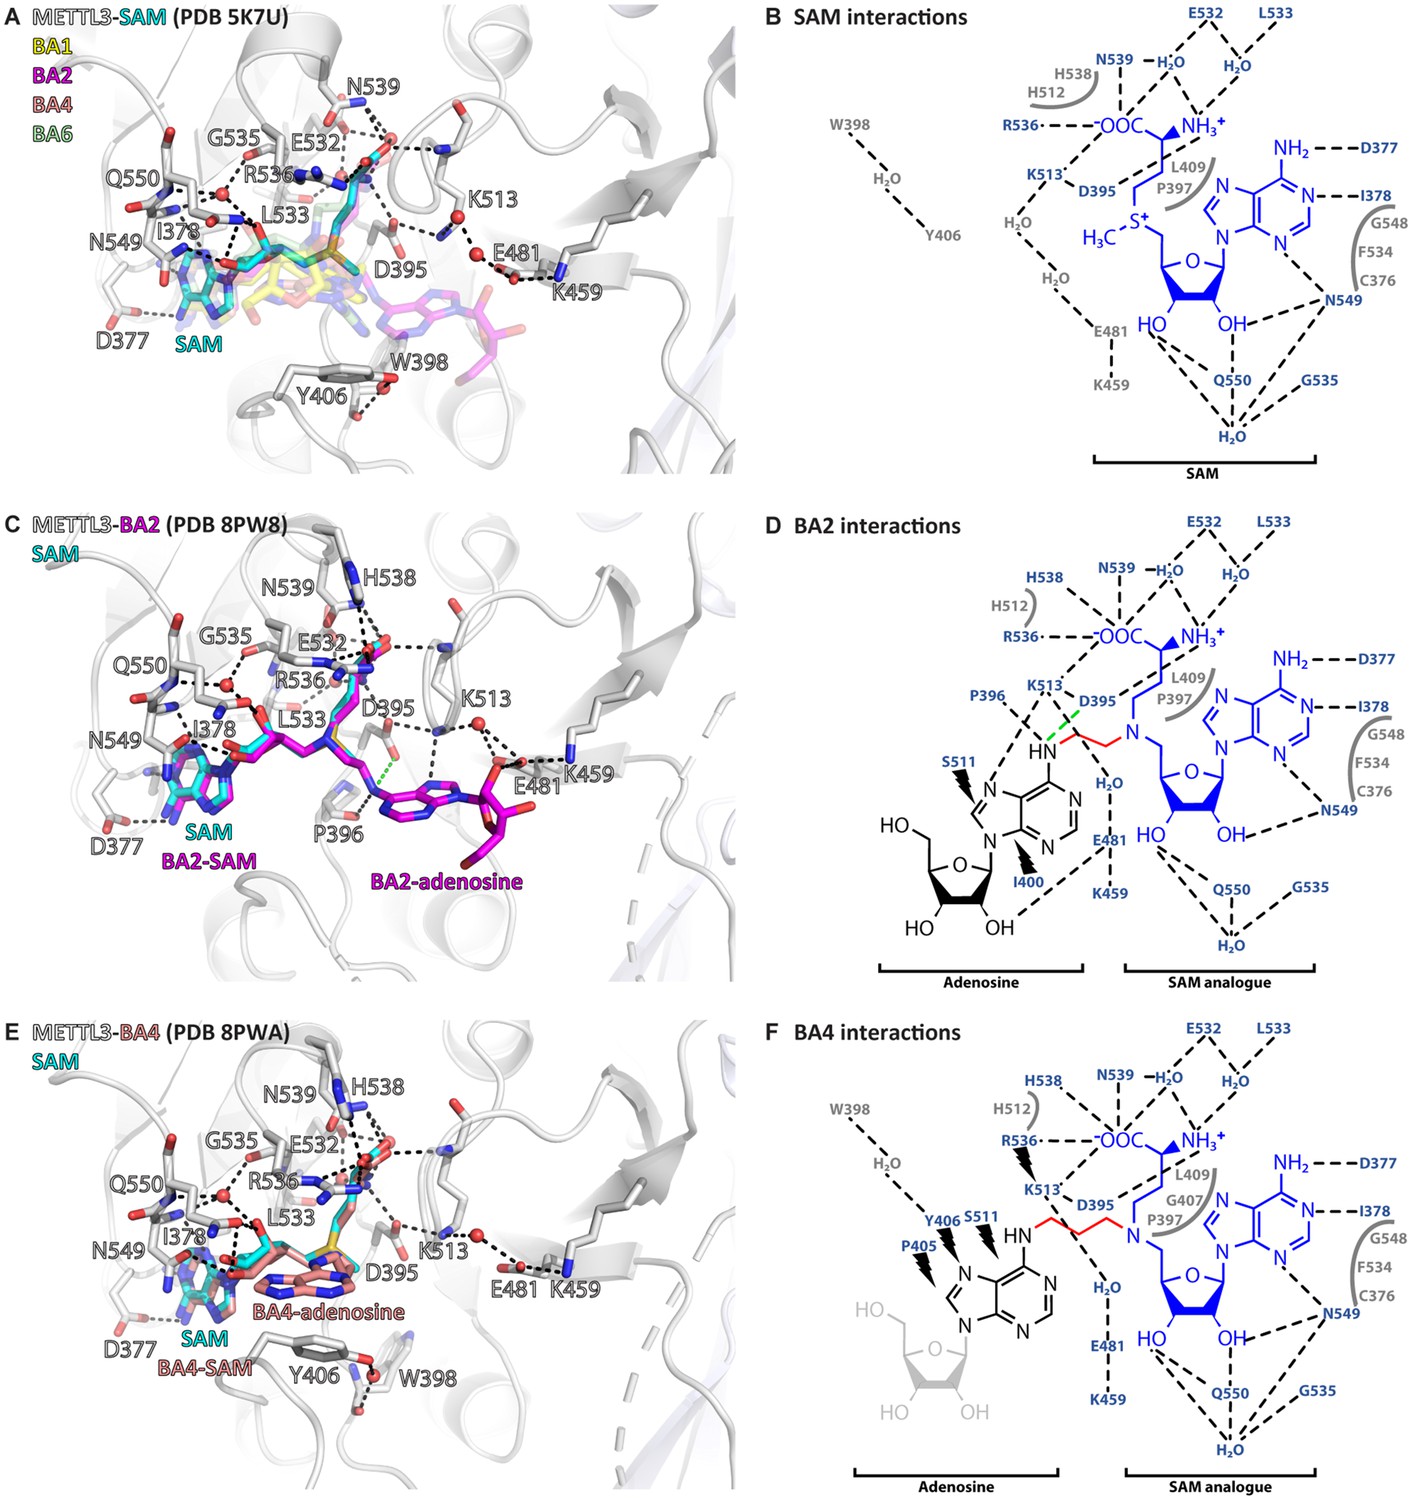
Crystal structures of methyltransferase-like proteins 3 and 14 (METTL3-14) show that bisubstrate analogues (BAs) bind in the METTL3 active site.
(A) Superposition of the crystal structures of METTL3-14 bound to S-adenosylmethionine (SAM) and the four BAs. METTL3 backbone is shown as ribbon, side chains involved in polar interactions with SAM or intramolecularly are shown as sticks, waters as red spheres. SAM (cyan) is shown as sticks and indicated, and BAs are shown as transparent sticks (BA1=yellow, BA2=magenta, BA4=salmon, BA6=pale green). Black dashes indicate polar contacts in the crystal structure. (B) Outline of METTL3/SAM interactions from a LigPlot+ analysis (Laskowski and Swindells, 2011). Black dashed lines indicate polar contacts in the crystal structure, residues forming the binding pocket environment are shown in grey. (C) Structure of METTL3-BA2. Figure composition as in (A). BA2 is coloured magenta, its SAM and adenosine moieties are indicated. The green dashes indicate a hydrogen bond that does not form with BA2, but is likely to have favourable geometry to form between D395 and adenosine-N6 (i.e. the NH2 group) of the natural RNA substrate. (D) Outline of METTL3/BA2 interactions from a LigPlot+ analysis, as in (B). The SAM analogue and adenosine parts of the BA are indicated. Black lightnings highlight residues in METTL3 involved in hydrophobic contacts with the adenosine moiety of the BA. (E) Structure of METTL3-BA4. Figure composition as in (C). BA4 is coloured salmon, its SAM and adenosine moieties are indicated. Note that BA4 is missing the ribose of the substrate adenosine moiety due to lack of electron density in the crystal structure probably due to flexibility of this group. (F) Outline of METTL3/BA4 interactions from a LigPlot+ analysis, as in (D). The missing ribose of the substrate adenosine moiety in the crystal structure is indicated with a lighter colour.
Figure 3—figure supplement 1

Crystal structures of the complex of methyltransferase-like proteins 3 and 14 (METTL3-14) with the bisubstrate analogues BA1 and BA6 show divergent interactions with the S-adenosylmethionine (SAM) moiety.
(A) Structure of the METTL3-BA1 complex. METTL3 backbone is shown as ribbon, side chains involved in polar interactions with BA1 or intramolecularly are shown as sticks. Waters are shown as red spheres. BA1 (yellow) and SAM (cyan) are shown as sticks, SAM and the BA1 moieties are indicated. Because of the missing methionine moiety in BA1, METTL3 residues D395 and R536 cannot form salt bridges with the NH3+ and COO- groups of the methionine group of the SAM moiety, respectively, and instead form non-canonical hydrogen bonds with the BA linker and adenine ring, respectively (red dashes). (B) Ligplot+ analysis of the interaction between METTL3 and BA1. The SAM analogue and adenosine parts of the BA are indicated. Black dashed lines indicate polar contacts between METTL3 and BA1 in the crystal structure. Small lightnings highlight residues in METTL3 involved in hydrophobic contacts with the adenosine part of the BA. Residues forming the binding pocket environment are shown in grey. Red dashed lines indicate polar contacts that can only form because the methionine moiety of the SAM part of the BA is missing. (C) Structure of the METTL3-BA6 complex. METTL3 backbone is shown as ribbon, side chains involved in polar interactions with BA6 or intramolecularly are shown as sticks. Waters are shown as red spheres. BA6 (pale green) and SAM (cyan) are shown as sticks, SAM and the BA6 moieties are indicated. Note that BA6 is missing the ribose moiety of the substrate adenosine part due to lack of electron density in the crystal structure, probably due to flexibility of this group. Because of the polar urea group in the BA6 linker, METTL3 residue R536 forms a hydrogen bond with it (red dashes) leading to a shift of the position of the SAM-like moiety of BA6 compared to the natural SAM cosubstrate. (D) Ligplot+ analysis of the interaction between METTL3 and BA6, as in (B). The missing ribose of the substrate adenosine moiety in the crystal structure is indicated with a lighter colour. (E, F) Structures from (A) and (C) shown with electron densities for the BAs (contoured at 0.7 sigma) and METTL3 side chains and waters (contoured at 1.0 sigma).
Figure 3—figure supplement 2
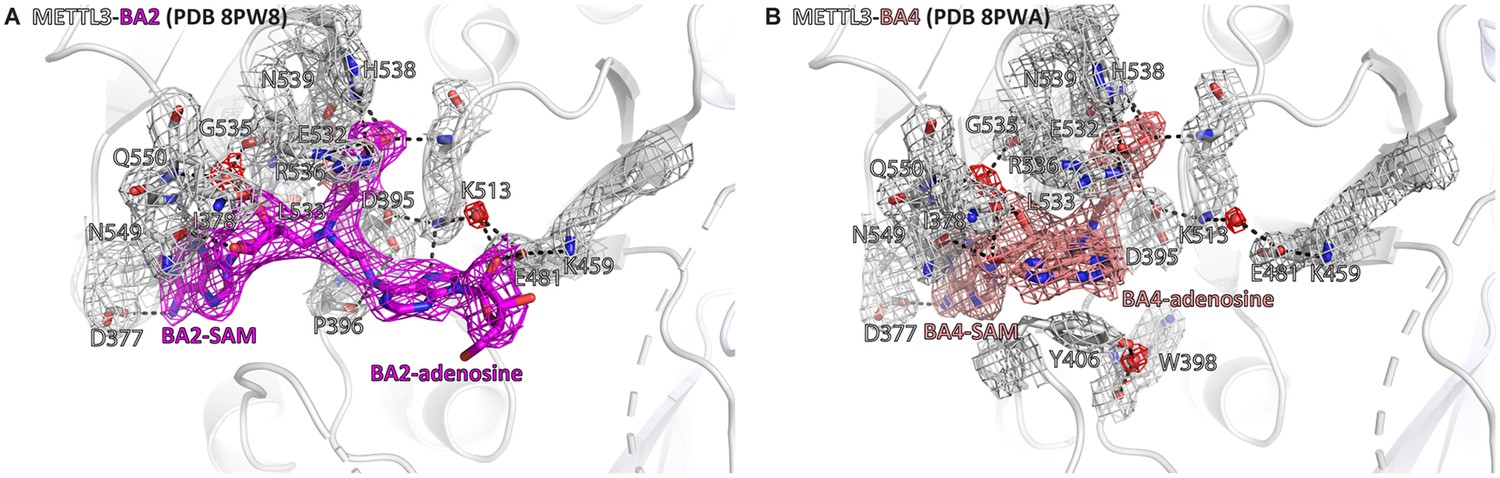
Crystal structures of the complex of methyltransferase-like proteins 3 and 14 (METTL3-14) with BA2 and BA4 show electron density supporting the conformations of the bisubstrate analogues (BAs) and their interactions with METTL3.
Structures of METTL3 bound to BA2 (A) and BA4 (B) from main text Figure 3C and E, respectively, shown with electron densities for the BAs (contoured at 0.7 sigma) and METTL3 side chains and waters (contoured at 1.0 sigma). METTL3 backbone is shown as ribbon, side chains involved in polar contacts with the BAs or intramolecularly are shown as sticks, waters as red spheres. Dashes indicate polar contacts. The S-adenosylmethionine (SAM) and adenosine moieties of the BAs are indicated. Note that BA4 is missing electron density for the ribose of the substrate adenosine moiety probably due to flexibility of this group.
Figure 4 with 8 supplements
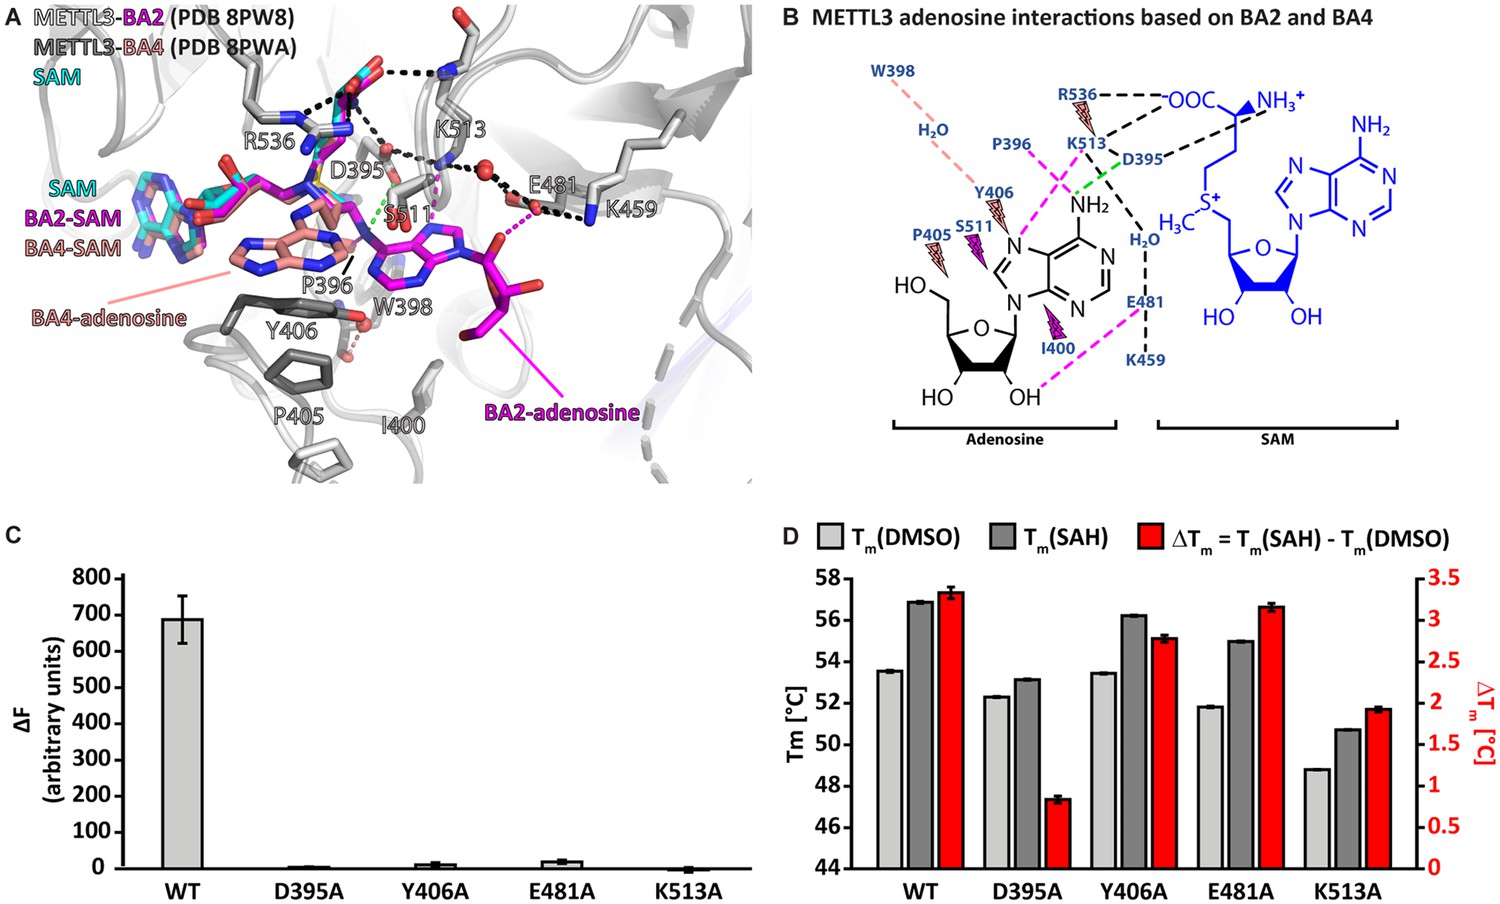
Crystal structures of methyltransferase-like proteins 3 and 14 (METTL3-14) with BA2 and BA4 reveal two distinct adenosine binding modes.
(A) Superposition of the structures of S-adenosylmethionine (SAM) (cyan), BA2 (magenta), and BA4 (salmon) bound to METTL3. The ligands and their moieties are indicated. METTL3 in light/dark grey for BA2/BA4, backbone is shown as ribbon with side chains involved in the interactions with the adenosine moiety of the bisubstrate analogues (BAs) shown as sticks. Waters are shown as red spheres. Black dashes indicate polar contacts common to BA2/BA4. Magenta/salmon dashes indicate hydrogen bonds unique to BA2/BA4. The green dashes indicate a hydrogen bond that does not form with BA2, but is likely to have favourable geometry to form between D395 and adenosine-N6 (i.e. the NH2 group) of the natural RNA substrate. Note that there is no electron density for the side chain of Y406 in the complex with BA2 and for the ribose of the adenosine moiety in the complex with BA4 which is most likely due to flexibility of these groups. (B) Ligplot+ analysis showing key interactions between METTL3, adenosine, and SAM based on the BA2 and BA4 structures. Dashed lines indicate polar contacts as in (A). Small magenta/salmon lightnings highlight residues in METTL3 involved in hydrophobic contacts with the adenosine moiety in the BA2/BA4 conformation. (C) Mutational analysis of the enzymatic activity of METTL3 active site residues involved in adenosine binding. The error bars represent standard deviation from triplicate measurements. (D) The melting temperature (Tm) and its shift (ΔTm, in red) for METTL3 wild-type (WT) and mutants with DMSO as control (light grey bars) or in the presence of S-adenosylhomocysteine (SAH) (dark grey bars) measured using differential scanning fluorimetry. The error bars represent standard deviation from triplicate measurements.
Figure 4—figure supplement 1
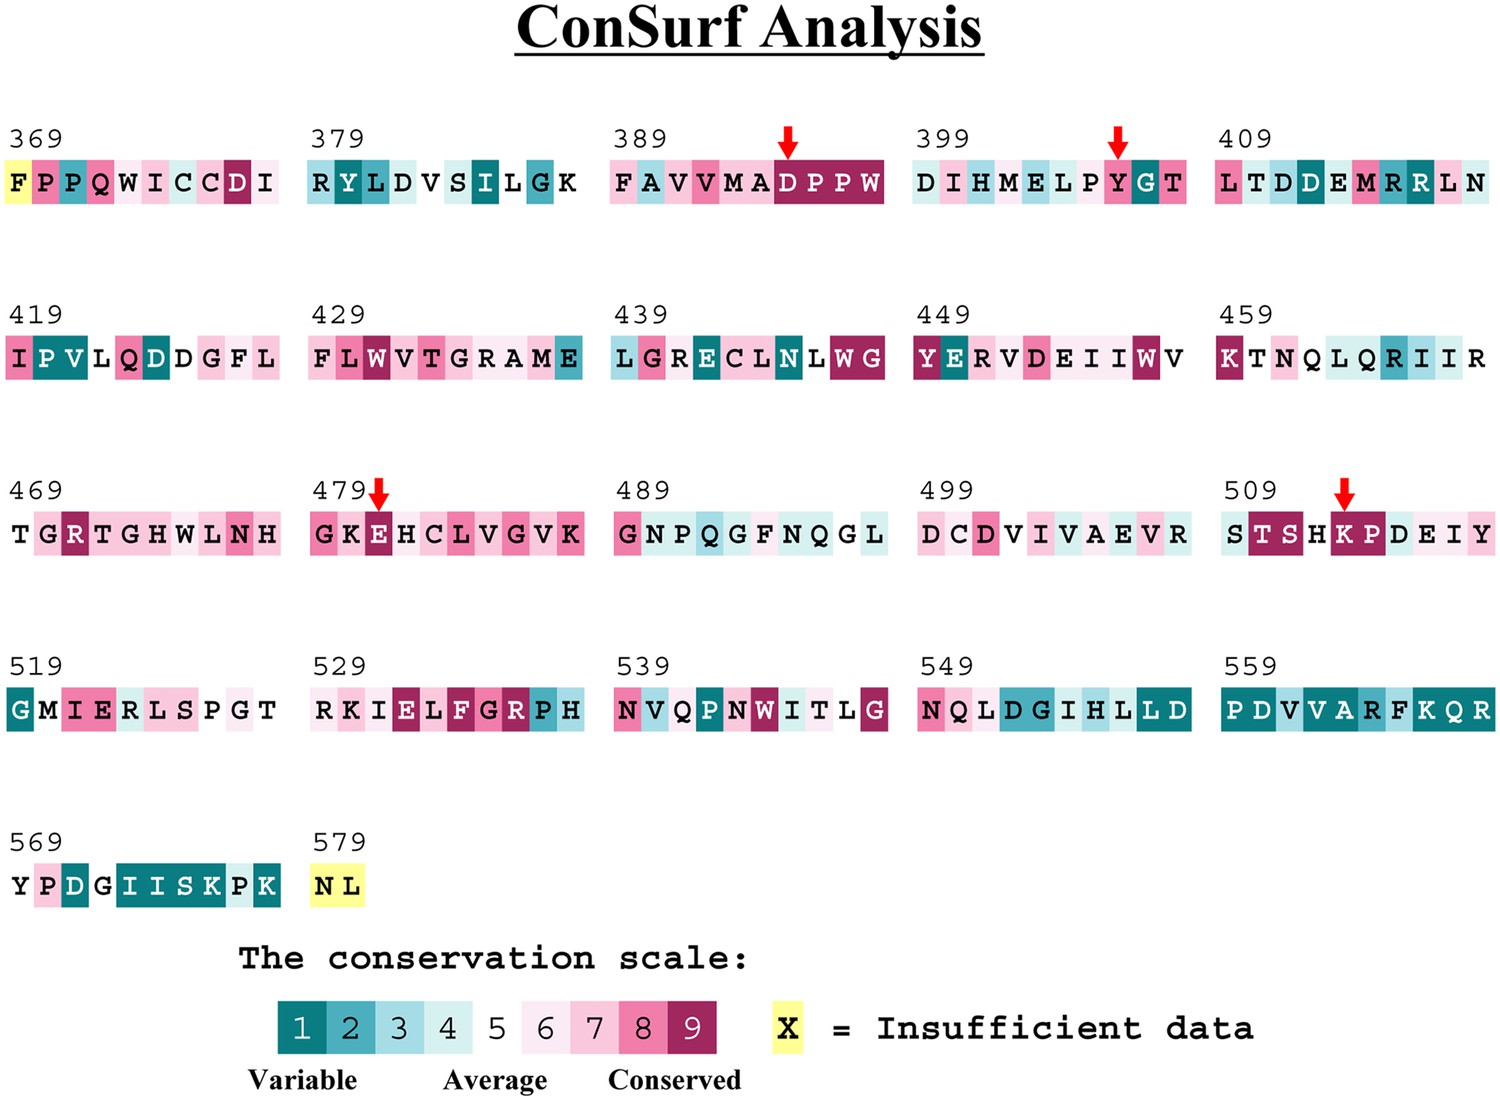
Methyltransferase-like protein 3 (METTL3) residues that interact with the adenosine part of the bisubstrate analogues are highly conserved.
Conservation analysis of the METTL3 methyltransferase (MTase) domain from Protein Data Bank (PDB) ID 5IL0 using Consurf-DB (Goldenberg et al., 2009; Ben Chorin et al., 2020). Relative conservation scores indicated by colours. The mutated residues in this study are marked with red arrows.
Figure 4—figure supplement 2
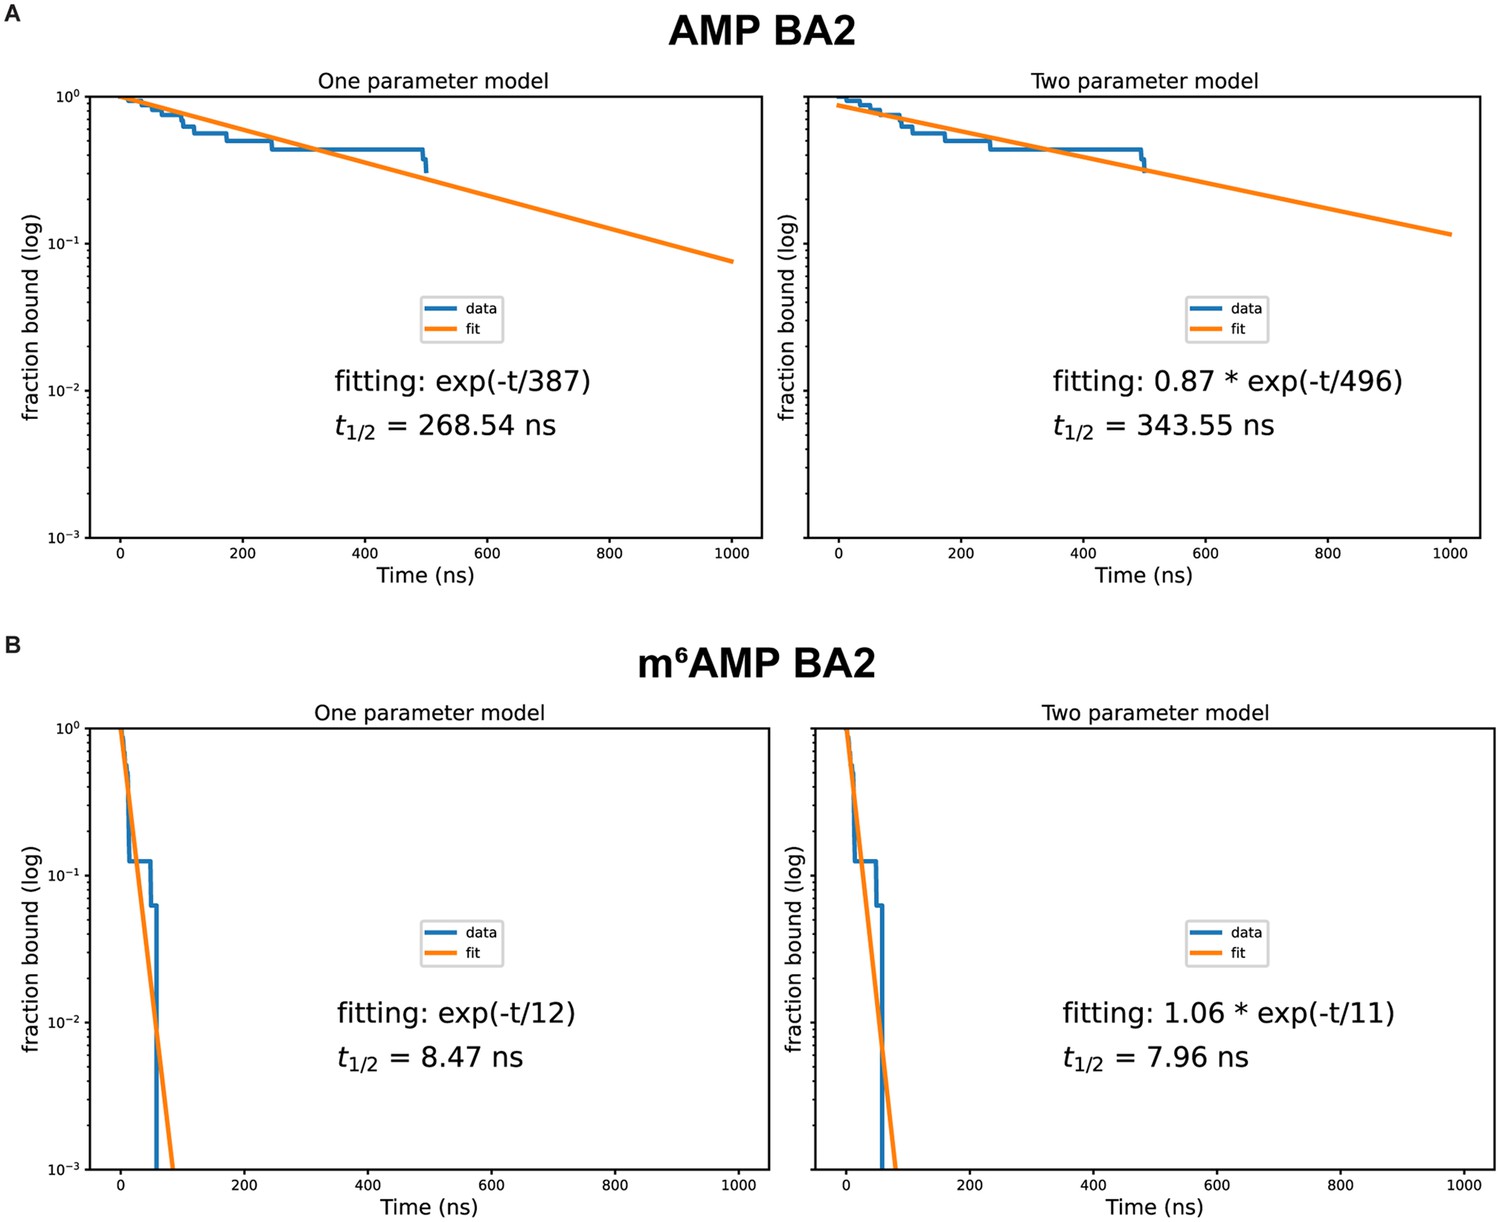
Exponential fitting of adenosine monophosphate (AMP) and m6AMP dissociation.
Fitting done for AMP (A) and m6AMP (B) with a one-parameter exponential decay function (left panel) and a two-parameter exponential decay function with a multiplicative factor (right panel). Starting conformation and bound ligand indicated at top of each figure. Fitting done using all trajectories in contrast with values in Table 2.
Figure 4—figure supplement 3

Geometric annotation for trajectories started with substrates in the BA4 crystal structure conformation.
Shown are distance time series of 500 ns molecular dynamics (MD) trajectories started from the BA4 conformation of methyltransferase-like protein 3 (METTL3) with (co)substrates. Starting conformation and bound ligands indicated on top of the figure. Y406 to W398 distance, interaction of METTL3 to adenosine monophosphate (AMP) substrate (black traces), METTL3 to S-adenosylmethionine (SAM) (blue traces), and intramolecular salt bridges.
Figure 4—figure supplement 4
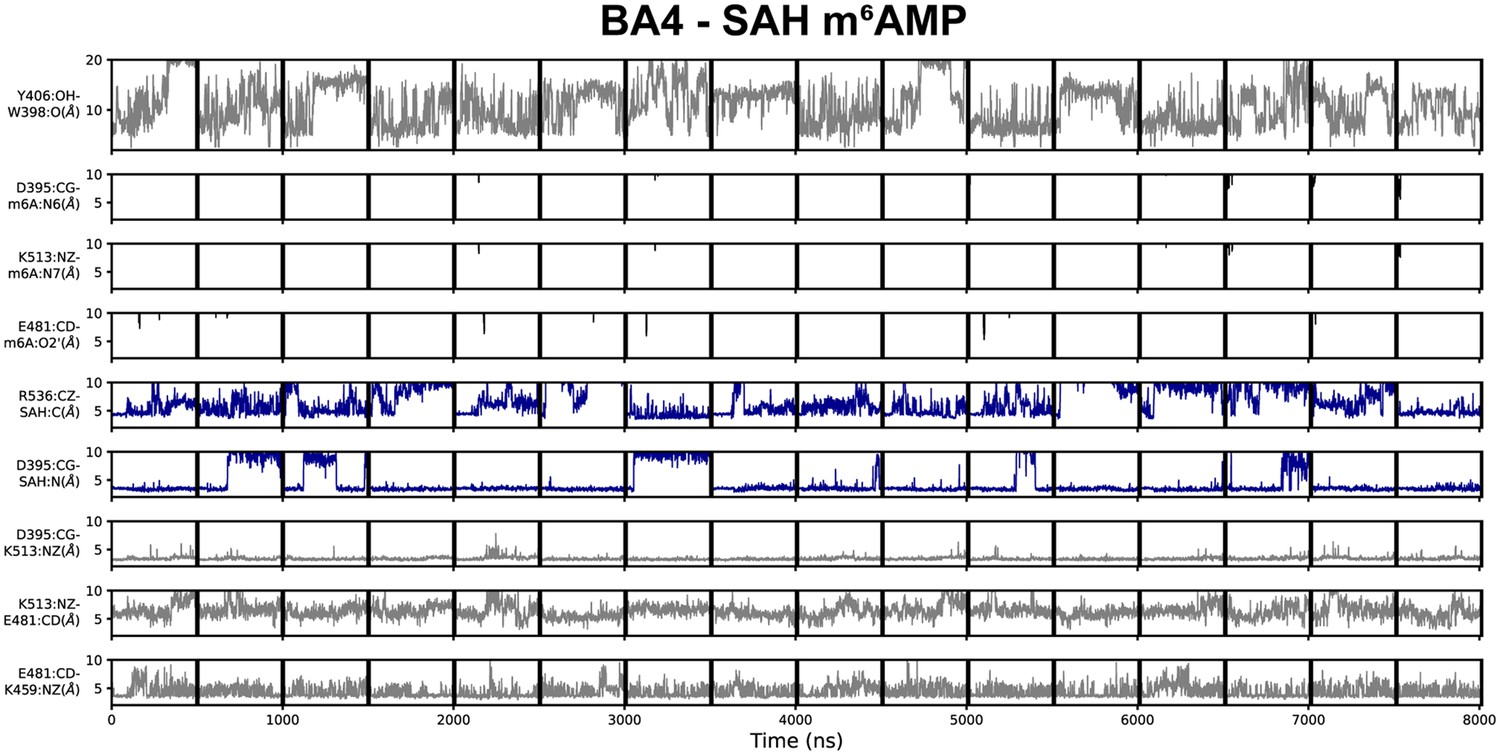
Geometric annotation for trajectories started with products in the BA4 crystal structure conformation.
Shown are distance time series of 500 ns molecular dynamics (MD) trajectories started from the BA4 conformation of methyltransferase-like protein 3 (METTL3) with (co)products. Starting conformation and bound ligands indicated on top of the figure. Y406 to W398 distance, interaction of METTL3 to m6AMP product (black traces), METTL3 to S-adenosylhomocysteine (SAH) (blue traces), and intramolecular salt bridges.
Figure 4—figure supplement 5
Geometric annotation for trajectories started with substrates in the BA2 crystal structure conformation.
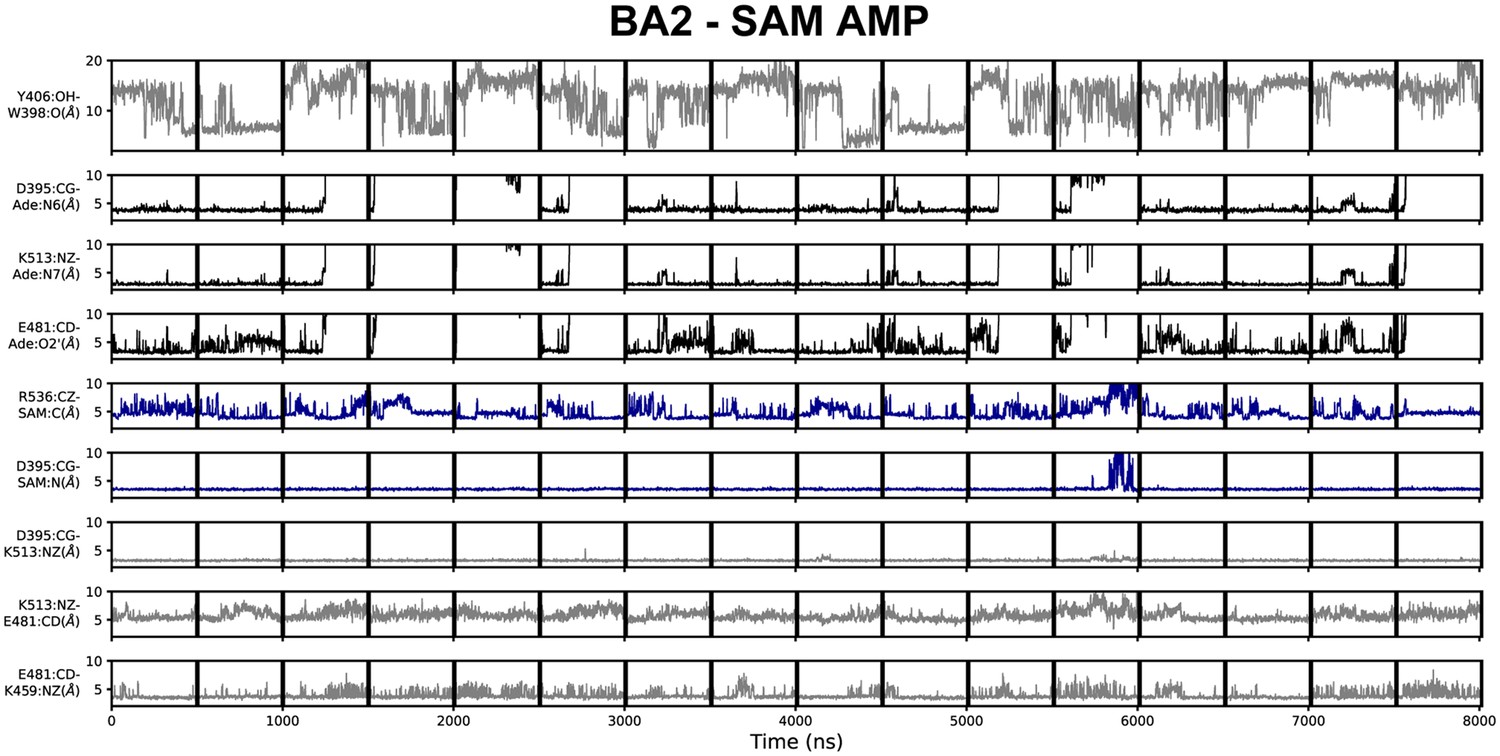
Shown are distance time series of 500 ns molecular dynamics (MD) trajectories started from the BA2 conformation of methyltransferase-like protein 3 (METTL3) with (co)substrates. Starting conformation and bound ligands indicated on top of the figure. Y406 to W398 distance, interaction of METTL3 to adenosine monophosphate (AMP) substrate (black traces), METTL3 to S-adenosylmethionine (SAM) (blue traces), and intramolecular salt bridges.
Figure 4—figure supplement 6

Geometric annotation for trajectories started with products in the BA2 crystal structure conformation.
Shown are distance time series of 500 ns molecular dynamics (MD) trajectories started from the BA2 conformation of methyltransferase-like protein 3 (METTL3) with (co)products. Starting conformation and bound ligands indicated on top of the figure. Y406 to W398 distance, interaction of METTL3 to m6AMP product (black traces), METTL3 to S-adenosylmethionine (SAM) (blue traces), and intramolecular salt bridges.
Figure 4—figure supplement 7

Structural stability and conformational transitions of adenosine monophosphate (AMP) in the molecular dynamics (MD) simulations.
(A) Shown are time series of 500 ns MD trajectories of methyltransferase-like protein 3 (METTL3). The time series show the root mean square deviation (RMSD) of the adenine atoms of AMP started from the BA2 (top) or BA4 (bottom) conformation using as a reference their corresponding positions in the crystal structure of BA2 (black traces) or BA4 (red traces). AMP shows less RMSD fluctuations and is hence more stable in the MD simulations started from the complex in the BA2 (top) than BA4 (bottom) conformation. In some of the dissociation events from the BA2 conformation, AMP transiently populates a binding mode similar to the BA4 conformation (green circled regions and blue star). (B) Close-up view of a trajectory starting from the BA2 conformation shows a dissociation event from the BA2 conformation in which AMP transiently populates a binding mode similar to the BA4 conformation (indicated with a blue star and green circle in (A)). (C) Conformation of the AMP at the frame marked by a star in (A) and (B) shows the AMP conformation overlaps with the one of AMP in the BA4 conformation (ball and sticks).
Figure 4—figure supplement 8
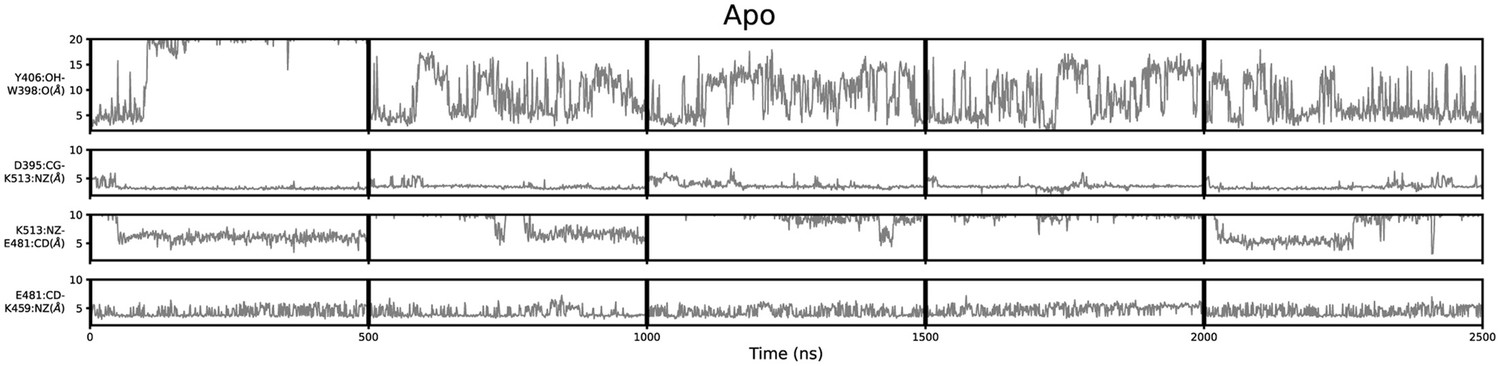
Geometric annotation of apo trajectories.
Shown are distance time series of 500 ns molecular dynamics (MD) trajectories of apo methyltransferase-like protein 3 (METTL3). Y406 side chain in the ASL1 loop and intramolecular salt bridges monitored for five trajectories of apo METTL3-14.
Figure 5 with 1 supplement
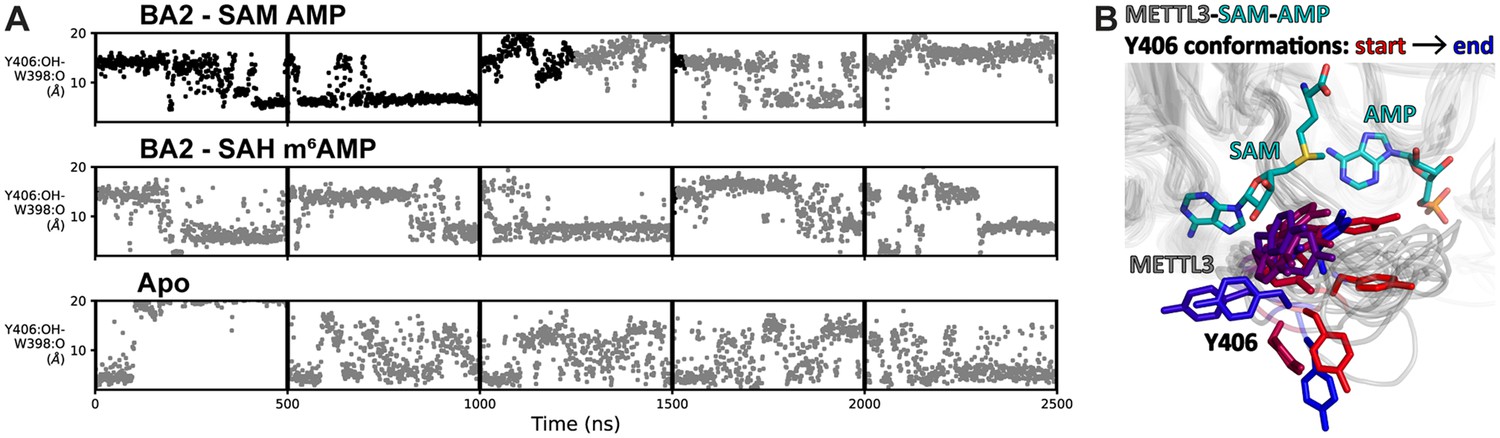
Flexibility of Y406 is evidenced by molecular dynamics (MD) simulations.
(A) Distance time series of five 500 ns MD trajectories started from the BA2 conformation with substrates (top), products (middle), or apo methyltransferase-like proteins 3 and 14 (METTL3-14) (bottom). The distance between the Y406 side chain and the backbone O of W398 (grey trace) reports on the orientation of Y406 and the flexibility of the loop. The data points are coloured black if adenosine monophosphate (AMP)/m6AMP is bound, and grey if not. Bound AMP is defined by a distance of less than 6 Å between N6 of adenosine and Cγ of D395. (B) The conformations of the flexible METTL3 backbone (ribbon) and Y406 side chain (sticks) are shown at different timepoints between 0 and 300 ns of the simulation with S-adenosylmethionine (SAM) and AMP, the Y406 side chain is coloured from red/start to blue/end. SAM and AMP are shown as sticks at the start of the simulation.
Figure 5—video 1
Stable/flexible binding of S-adenosylmethionine (SAM)/adenosine monophosphate (AMP) and flexibility of ASL1/Y406 is evidenced by molecular dynamics (MD) simulations.
Shown is a movie from MD simulations with the complex of methyltransferase-like protein 3 (METTL3) (grey ribbon representation) and METTL14 (teal ribbon representation) in complex with SAM (sticks representation, coloured by atom with carbon in teal and the sulphur atom in yellow) and AMP (sticks representation, coloured by atom with carbon in teal) started from the conformation of bisubstrate analogue BA2. METTL3 residues D395, W398, Y406, K459, E481, S511, K513, and R536 are shown as sticks and coloured by atom with carbon in teal. The movie begins with the SAM and AMP in the position of BA2. The flexibility of the Y406 side chain and the ASL1 loop in which it is located is observed already at the beginning of the movie. At around time point 00:15, the Y406 interacts with the adenosine ring of AMP, and at 00:20, there is a dissociation of AMP from the binding pocket. AMP remains bound to Y406 via π-π interactions for the next 10 s and finally dissociates completely. In the natural system, the adenosine would remain bound by the rest of the RNA chain, but in this case, when AMP is alone, it dissociates away. Y406 occupies the binding pocket close to SAM. At around 00:39, the AMP re-enters in the vicinity of the pocket, and the Y406 again coordinates via π-π interactions with the adenosine ring at 00:45. After around 10 s, the AMP dissociates again. The binding mechanism of the natural substrate probably requires the binding of the RNA chain in the groove, followed by the interaction of Y406 with the substrate adenosine. The rest of the movie continues with a partial dissociation of the methionine moiety of SAM at around 01:05 and the non-specific interactions of AMP with METTL3-14.
Figure 6 with 1 supplement
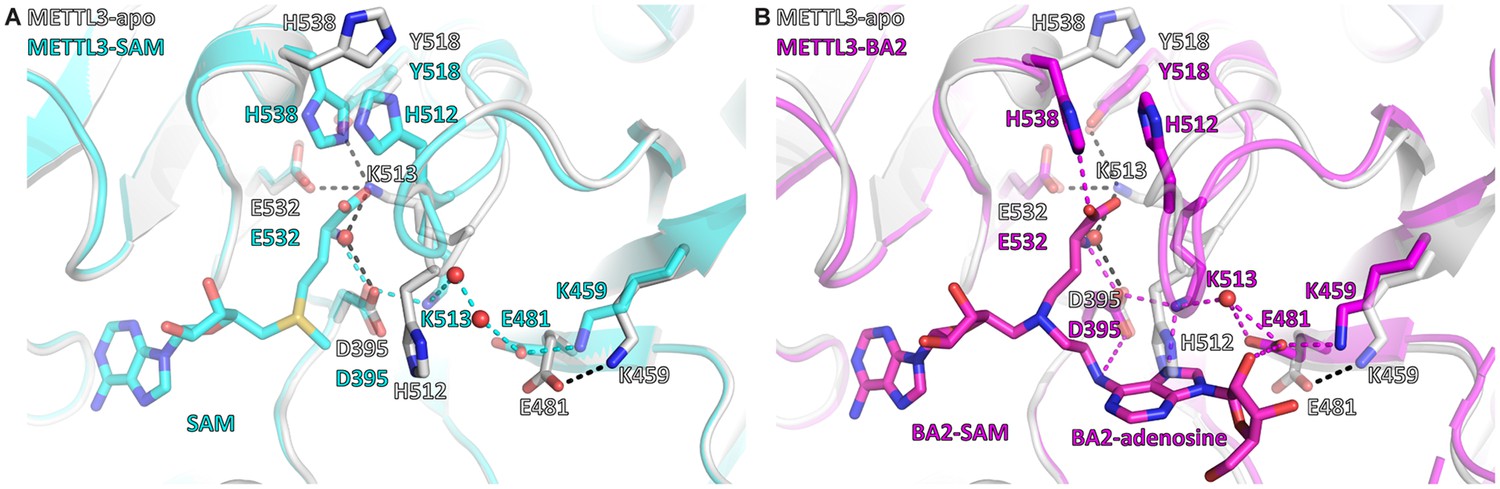
S-Adenosylmethionine (SAM) binding primes the methyltransferase-like protein 3 (METTL3) active site for adenosine binding.
(A) Structural overlay of the METTL3 apo (grey) and SAM-bound holo state (cyan). Black/cyan dashes indicate intramolecular polar contacts in apo/holo METTL3. Residues are shown as sticks and labelled. SAM and METTL3 residues in the holo state are shown as transparent sticks. Waters are shown as red spheres. (B) Structural overlay of the METTL3 apo (grey) and BA2-bound state (magenta). Black dashes indicate intramolecular polar contacts in apo METTL3, magenta dashes indicate polar contacts in BA2-bound METTL3. Residues are shown as sticks and labelled. BA2 is shown in magenta as sticks, its SAM and adenosine moieties are indicated. METTL3 residues in the apo state are shown as transparent sticks. Waters are shown as red spheres.
Figure 6—figure supplement 1

Flexibility of the side chains of H512 and H538.
(A, B) Shown are distance time series between the Cγ atoms of H512 and H538 of 500 ns molecular dynamics (MD) trajectories of apo methyltransferase-like protein 3 (METTL3) (A) and METTL3 bound to S-adenosylmethionine (SAM) and adenosine monophosphate (AMP) that were started from the conformation of BA2 (B). (C, D) Conformation of H512 (ball and sticks) and H538 (sticks) at different time points (from red to blue) of a trajectory of apo METTL3-14 (C) and with bound SAM and AMP (D). In the presence of SAM, the motion of H512 is restricted. METTL14 was present in the MD simulation runs but is omitted here for clarity.
Figure 7
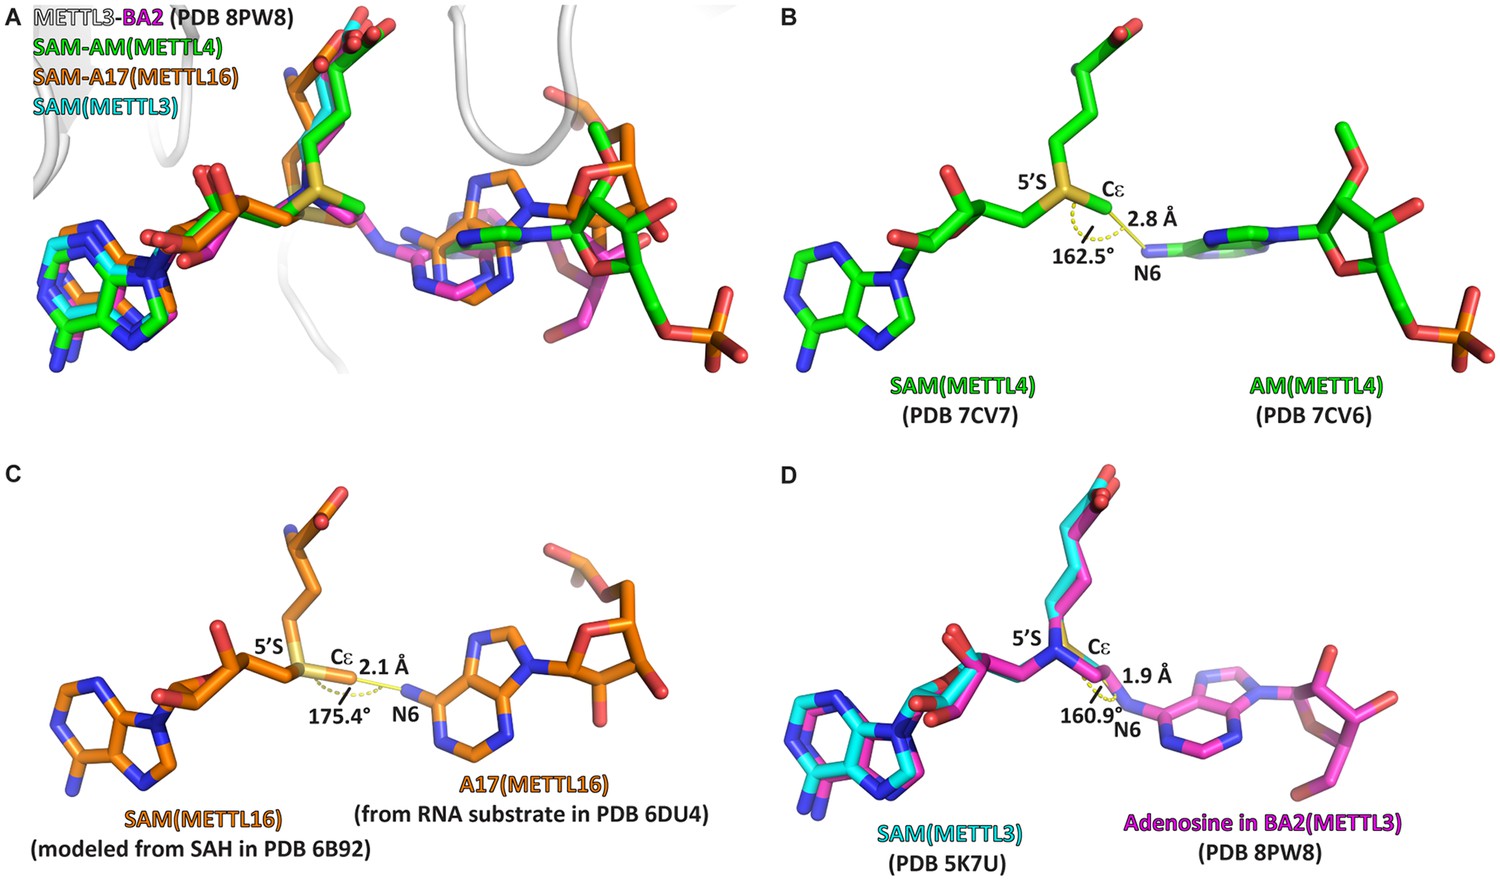
The crystal structure of the complex of methyltransferase-like proteins 3 and 14 (METTL3-14) with the bisubstrate analogue BA2 represents the transition state of catalysis.
(A) Overlap of the crystal structure of the complex of METTL3-14 (grey) with BA2 (magenta) to the complex with S-adenosylmethionine (SAM) (cyan) and the substrate-cosubstrate pairs of METTL4 (green) and METTL16 (orange). The overlap was generated by aligning SAM from each (co)substrate pair to the SAM of METTL3. (B–D) Measurements of distances and angles between the adenosine-N6 and SAM-CH3 groups in the respective (co)substrate pairs shown in (A). (B) The METTL4 (co)substrate pair was generated by aligning the structure of METTL4-AM to METTL4-SAM. (C) The METTL16 (co)substrate pair was generated by aligning the structure of METTL16-MAT2A 3'UTR hairpin 1 to METTL16-S-adenosylhomocysteine (SAH). SAM was then generated from SAH using the Chem3D software. (D) The METTL3 overlay was generated by aligning the structure of METTL3-BA2 to METTL3-SAM. The distance was measured between the N6 of BA2 and Cε of SAM, the angle was measured between the N6 of BA2, Cε of SAM, and 5’S of SAM.
Figure 8 with 2 supplements
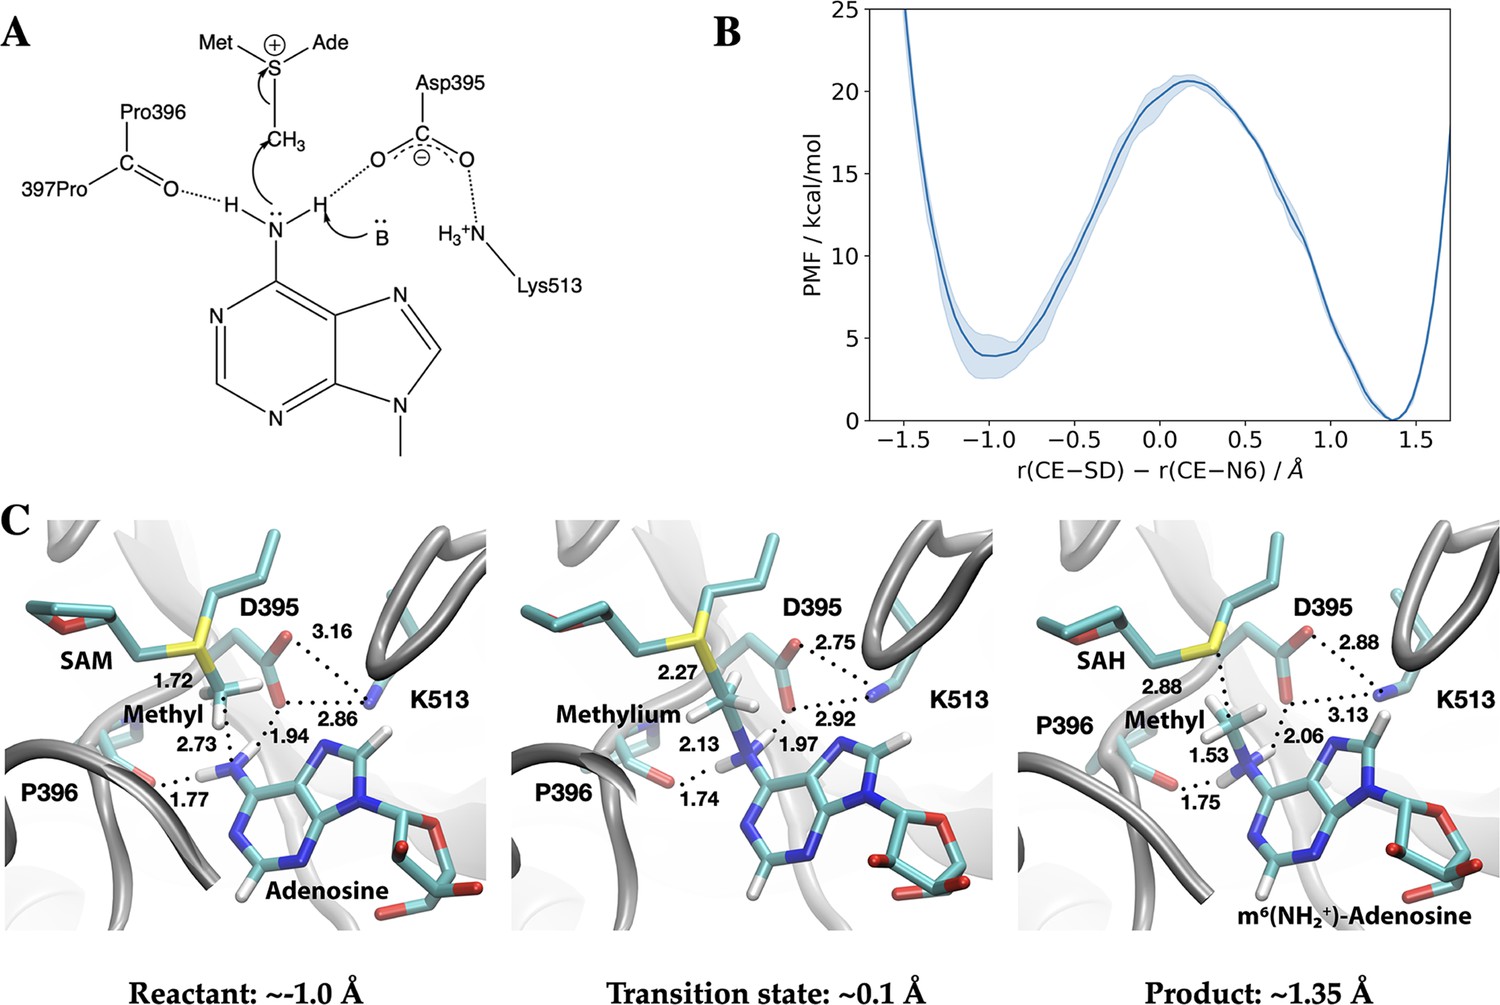
Methyl transfer catalysed by methyltransferase-like protein 3 (METTL3) without prior deprotonation of adenosine is energetically favourable based on third-order density functional tight binding (DFTB3)/MM simulations.
(A) Proposed mechanism of the methyl transfer reaction catalysed by METTL3. (B) Potential of mean force (PMF) along the antisymmetric stretch coordinate that describes the transfer of the methyl group (carbon atom indicated as CE) between the S-adenosylmethionine (SAM) sulphur atom (indicated as SD) and the N6-atom in adenosine (indicated as N6) computed using multiple walker metadynamics simulations. The solid curve represents the PMF averaged over three independent runs, and the shaded area represents the standard error of the mean of the three replicas. (C) Snapshots of the active site for the reactant (left panel), transition state (middle panel), and product windows (right panel). Key distances (in Å) involving the reactive groups and the nearby ion pair (D395-K513) and P396 backbone carbonyl are shown. METTL3 backbone is shown in grey ribbon representation with side chains shown as sticks and labelled. SAM/adenosine and S-adenosylhomocysteine (SAH)/m6(NH2+)-adenosine are shown as sticks and labelled in the reactant and product window, respectively, together with the transferred methyl group. The methylium group (CH3+) is indicated in the transition state window.
Figure 8—figure supplement 1

Potentials of mean force computed with different numbers of deposited Gaussians during the metadynamics simulation are compared to illustrate the convergence behaviour of the simulation.
Figure 8—figure supplement 2
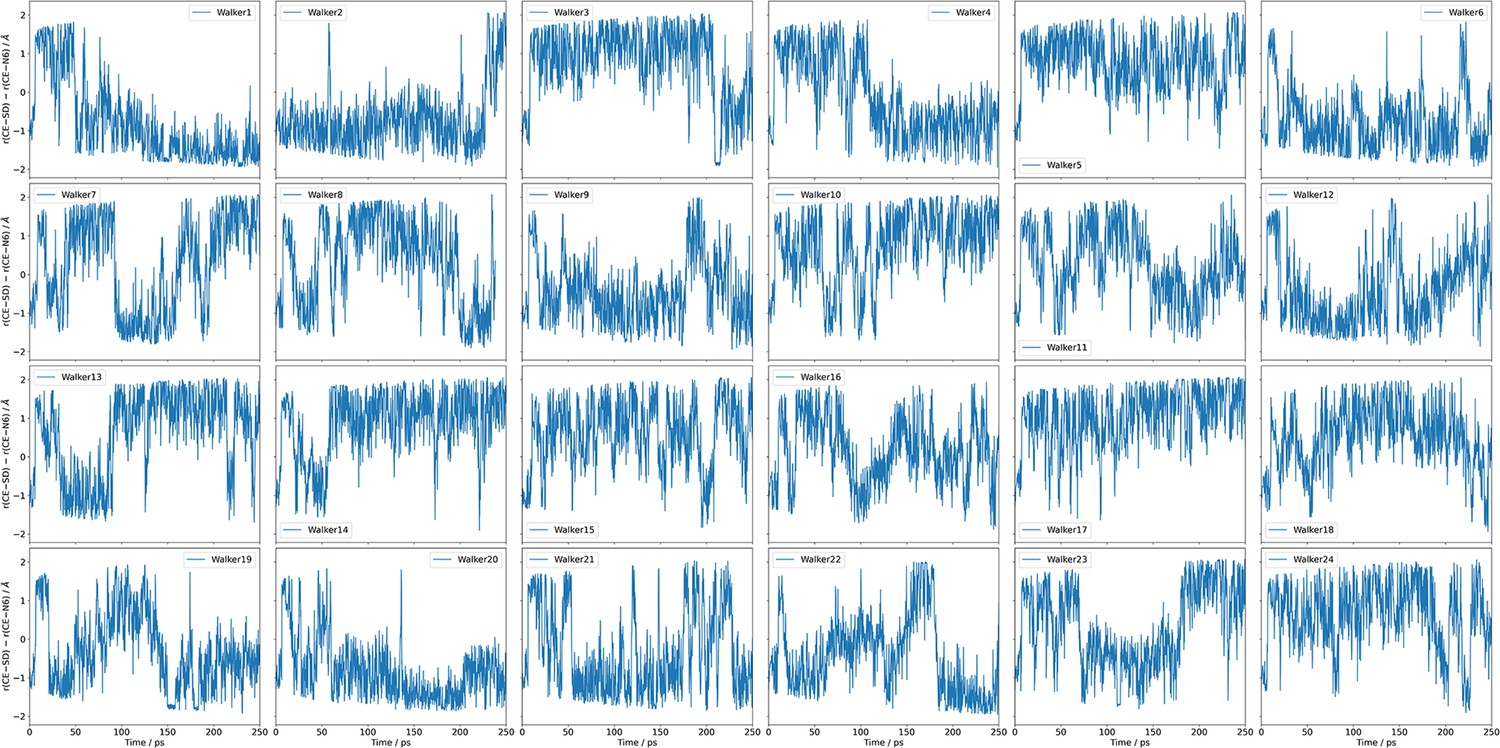
The time series of the collective variable (CV) sampled by the 24 independent walkers during one set of metadynamics simulations.
These results clearly indicate that the CV exhibits diffusive behaviours between the reactant and product regions, further supporting the adequate sampling and convergence of the metadynamics simulations.
Figure 9
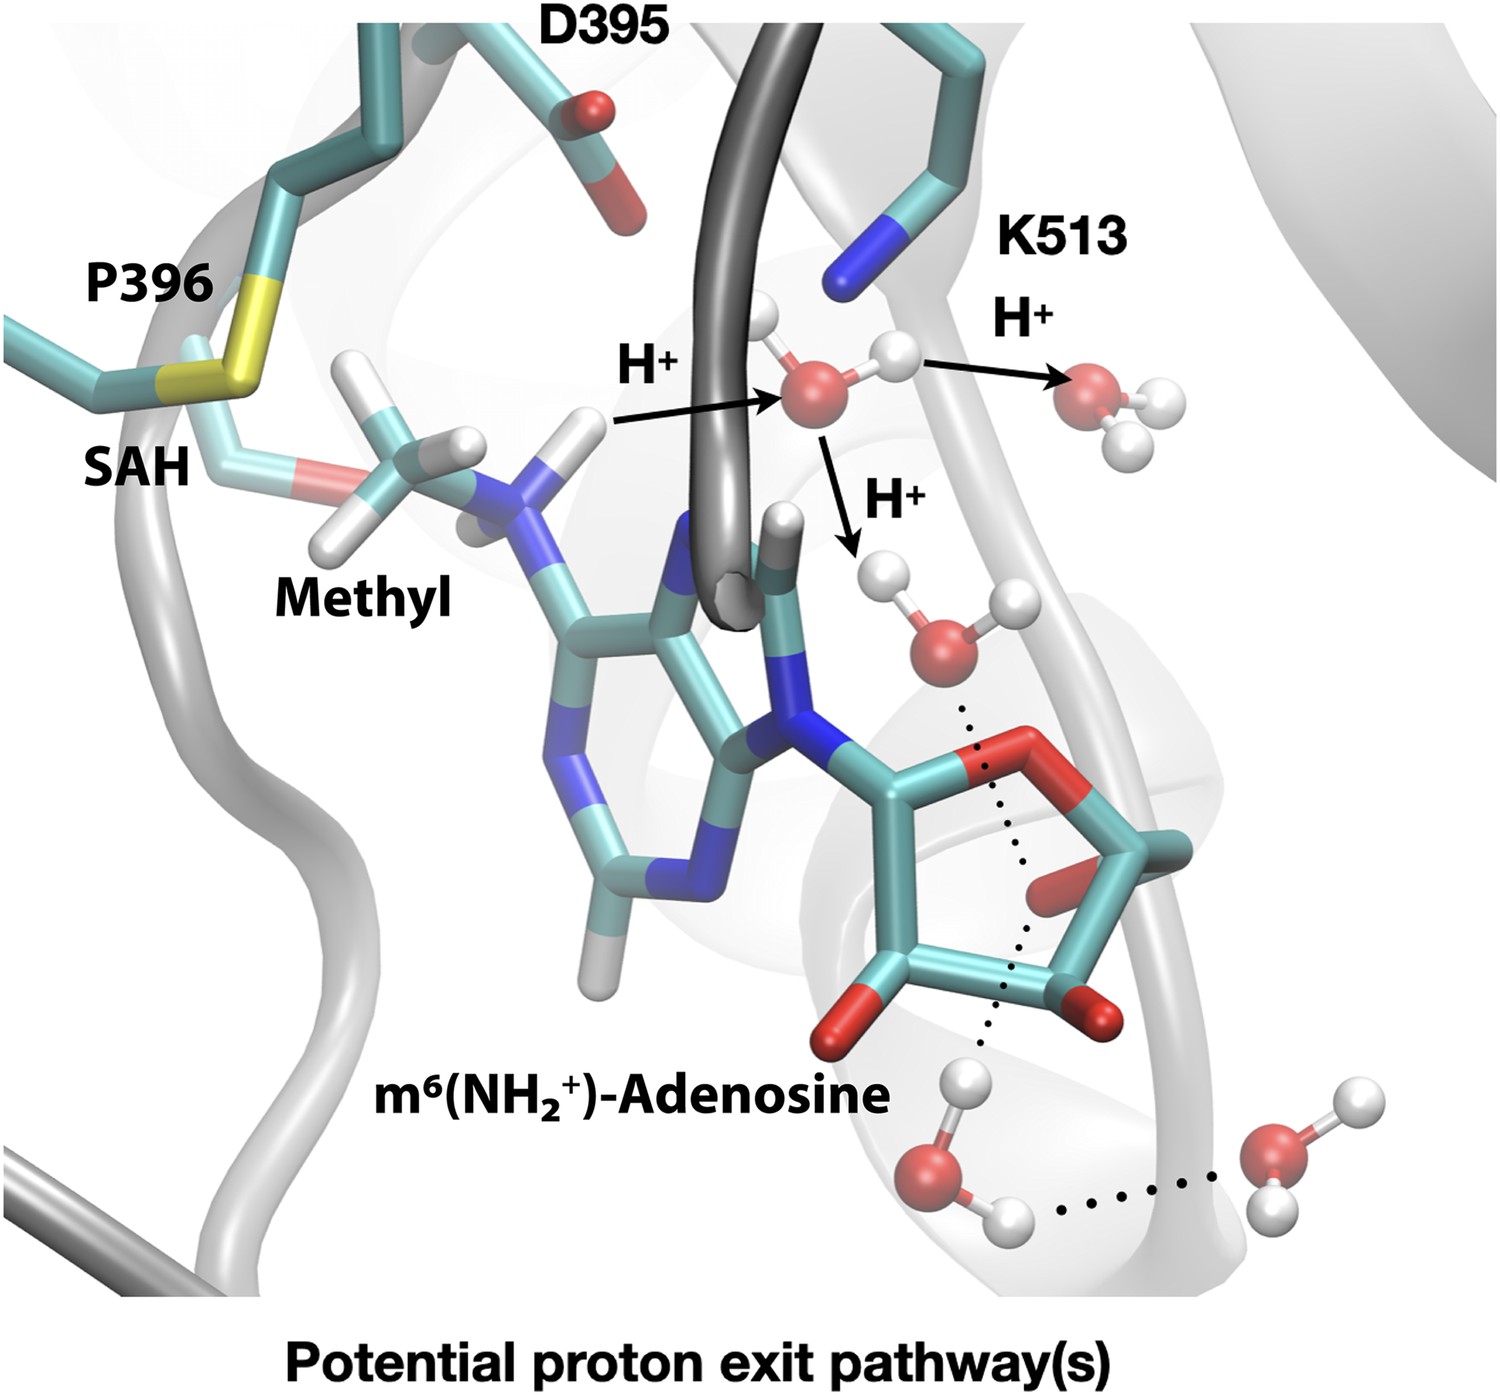
Deprotonation of adenosine-m6NH2+ may occur readily through water wires that connect the adenosine-N6 position to the protein-solvent interface.
Shown is a snapshot of the product state from third-order density functional tight binding (DFTB3)/MM simulations illustrating that the deprotonation of adenosine-N6 following the methyl transfer may proceed along multiple water-mediated pathways that lead to the protein/solvent interface. Methyltransferase-like protein 3 (METTL3) backbone is shown in grey ribbon representation with side chains shown as sticks and labelled, water molecules are shown as spheres. S-Adenosylhomocysteine (SAH) and m6(NH2+)-adenosine are shown as sticks and labelled, together with the transferred methyl group. Hydrogen bonds are indicated with dotted lines. The movement of protons through water channels is indicated with arrows.
Figure 10
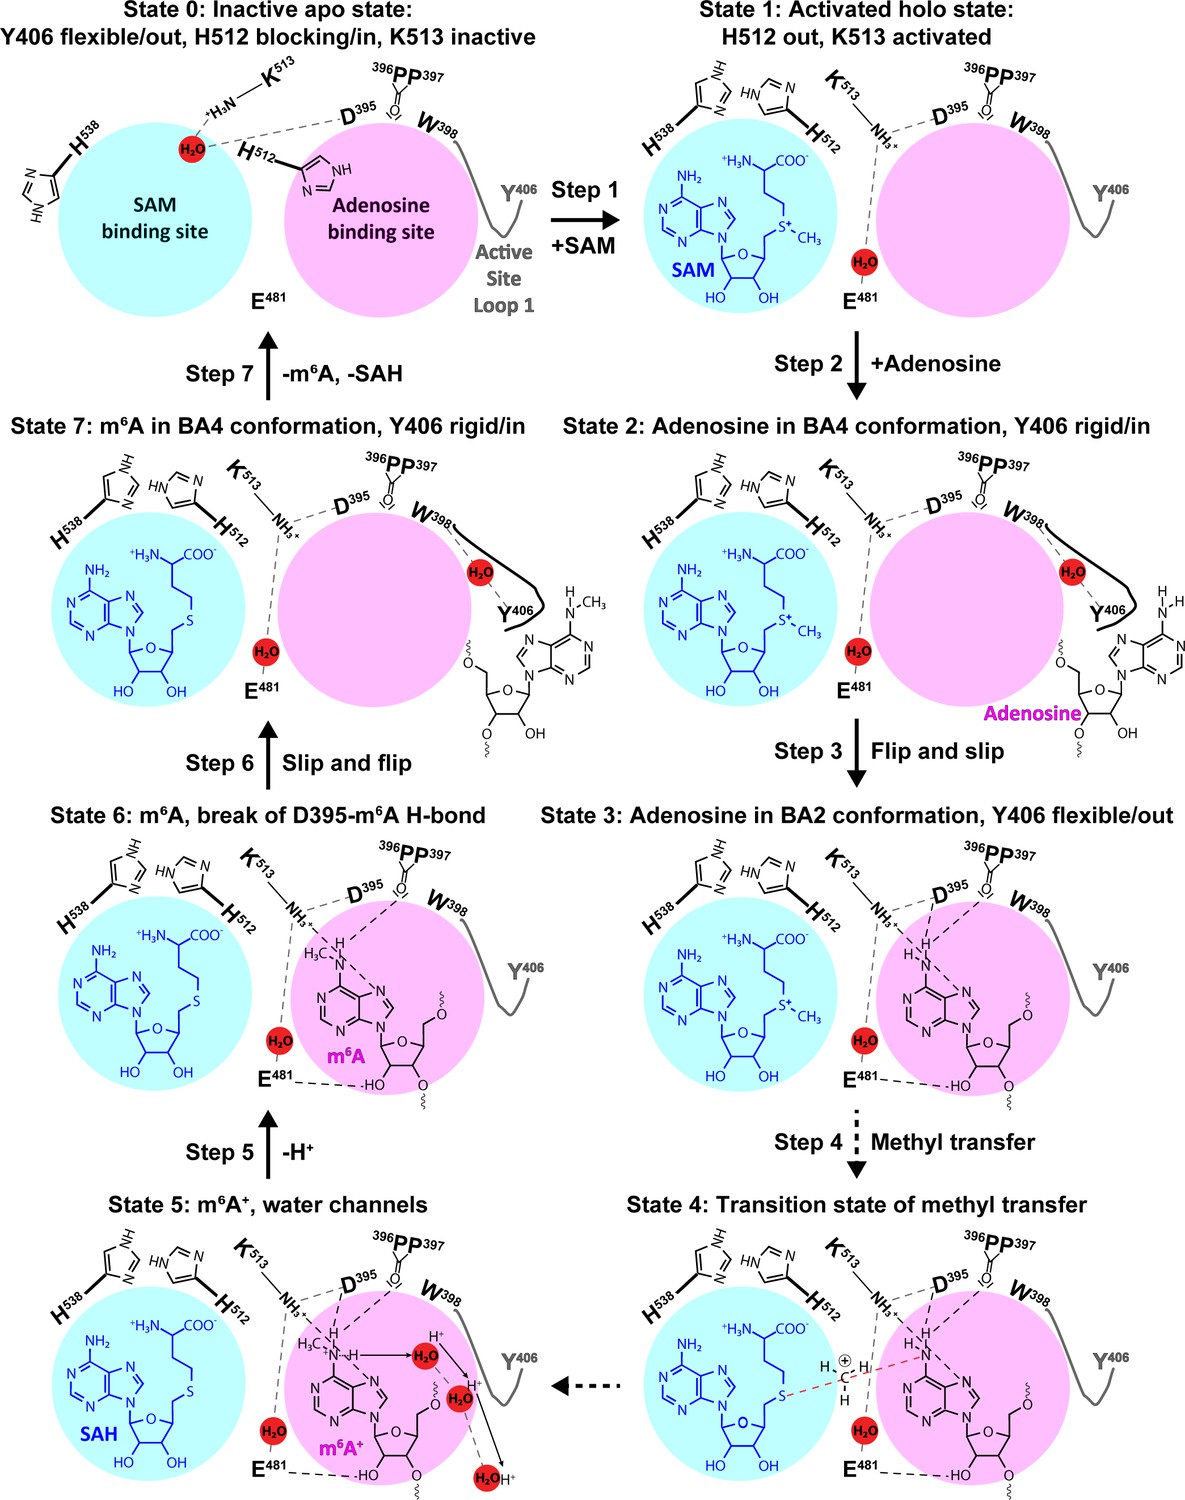
The experimental and computational data elucidate the individual steps of substrate binding, product release, and methyl transfer catalysed by methyltransferase-like protein 3 (METTL3).
Schematic illustration of the individual steps making up the (co)substrate binding, methyl transfer, and (co)product release mechanism of METTL3; dashed grey and black lines indicate polar contacts that are intramolecular in METTL3 (including water mediated [waters shown as red spheres]) and intermolecular to the substrate/product adenosine/m6A, respectively. The ASL1 containing Y406 is either flexible (grey colour) or stabilised by the interaction with the substrate/product adenosine/m6A (black colour). Step 1: binding of S-adenosylmethionine (SAM) and flexibility of Y406 (supporting evidence from crystal structures and molecular dynamics [MD] simulations of apo and SAM-bound states); Step 2: substrate recognition (crystal structure of the complex with BA4); Step 3: flip of the adenosine ring and slip of the substrate into the catalytic site (crystal structure of the complex with BA2); Steps 4 and 5: methyl transfer and deprotonation of adenosine-m6NH2+ through water channels (movement of protons indicated by arrows) (quantum mechanics/molecular mechanics [QM/MM] free energy calculations); Steps 6 and 7: slip and flip of the product N6-methyladenosine (m6A) out of the catalytic site and subsequent dissociation from METTL3, along with S-adenosylhomocysteine (SAH) release to re-establish the apo state (MD simulations).
Tables
Table 1
Bisubstrate analogues (BAs) for methyltransferase-like proteins 3 and 14 (METTL3-14) characterised in this study.
| Bisubstrate analogue namea | IC50 (µM)b ± SE | PDB IDc | Resolutionc (Å) |
|---|---|---|---|
| BA1 | 346±66 | 8PW9 | 2.3 |
| BA2 | 9±1 | 8PW8 | 2.3 |
| BA3 | 21±2 | NA | NA |
| BA4 | 18±3 | 8PWA | 2.1 |
| BA6 | ⪆500 | 8PWB | 2.5 |
| Compound 12 | ⪆500 | NA | NA |
| GA* | 32±3 | NA | NA |
-
NA = not available.
-
a Compound names as previously published: BA1/2/3/4/6, Oerum et al., 2019; Compound 12, Atdjian et al., 2020; GA*, Meynier et al., 2022.
-
b IC50=Half maximal inhibitory concentration from the enzymatic assay, SE=standard error from the fit; for comparison, IC50 of S-adenosylhomocysteine (SAH) is 0.51µM, Wiedmer et al., 2019.
-
c Data for the METTL3-14-BA complex structures deposited to the Protein Data Bank (PDB).
Table 2
Kinetic parameters of ligand dissociation.
Mean lifetime (τ) in ns of the analysed (co)substrates or (co)products as calculated from fitting of a single exponential (A) or an exponential with a multiplicative factor (in parentheses) (B).
| Initial structure | Fit | Substrates | Products | ||
|---|---|---|---|---|---|
| SAM | AMP | SAH | m6AMP | ||
| BA2 | A | >>500 | 426±196 | >>500 | 12.87±0.02 |
| B | 579±386 (0.9±0.1) | 12.70±4.95 (1.1±0.1) | |||
| BA4 | A | >>500 | 0 | >>500 | 0 |
Table 3
Reaction energetics (in kcal/mol) computed for model methyl transfer reactions that involve S-adenosylmethionine (SAM) and adenosine using different levels of theory*.
| Reaction† | Different computational models | ||||||
|---|---|---|---|---|---|---|---|
| B3LYP-D3 | ωB97XD | B3LYP-D3 | ωB97XD | DFTB3/3OB | B3LYP-D3 | ωB97XD | |
| aug-cc-pVDZ | aug-cc-pVTZ | CPCM‡, aug-cc-pVTZ | |||||
| SAM+Ade → SAH+Ade-CH3 | 5.3 | 5.0 | 7.3 | 6.9 | 2.5 | 10.2 | 9.6 |
| SAM+dp-Ade → SAH+dp-Ade-CH3 | –129.1 | –130.6 | –128.1 | –129.8 | –140.5 | –37.7 | –38.9 |
| Difference | –134.5 | –135.6 | –135.4 | –136.8 | –143.0 | –47.9 | –48.5 |
-
*
Different density functional theory methods (B3LYP-D3, ωB97XD) and basis set combinations (aug-cc-pVDZ and aug-cc-pVTZ), along with a semi-empirical quantum mechanical method, third-order density functional tight binding (DFTB3)/3OB, are used to evaluate the intrinsic energetics for model methyl transfer reactions. The comparison also helps validate the more approximate DFTB3/3OB method, which is used in quantum mechanics/molecular mechanics (QM/MM) free energy simulations.
-
†
dp-Ade indicates a deprotonated adenosine at the N6 position. SAM and S-adenosylhomocysteine (SAH) are modelled by replacing the adenosine and amino moieties by ethyl groups.
-
‡
A dielectric constant of 78.4 is used for the conductor-like polarisable continuum model (CPCM) to estimate the reaction energetics in solution. All other results are based on gas-phase calculations.
Additional files
-
Supplementary file 1
Crystallography data collection and refinement statistics.
Statistics for the highest-resolution shell are shown in parentheses.
- https://cdn.elifesciences.org/articles/92537/elife-92537-supp1-v1.docx
-
Transparent reporting form
- https://cdn.elifesciences.org/articles/92537/elife-92537-transrepform1-v1.docx
Download links
A two-part list of links to download the article, or parts of the article, in various formats.
Downloads (link to download the article as PDF)
Open citations (links to open the citations from this article in various online reference manager services)
Cite this article (links to download the citations from this article in formats compatible with various reference manager tools)
The catalytic mechanism of the RNA methyltransferase METTL3
eLife 12:RP92537.
https://doi.org/10.7554/eLife.92537.3


