Development of equation of motion deciphering locomotion including omega turns of Caenorhabditis elegans
- Daegu Gyeongbuk Institute of Science and Technology, Republic of Korea
Figures
Figure 1

Components of ElegansBot.
(A) Chain model for C. elegans body. (B) Rods in chain model. (C) i-actuator, which is a damped torsional spring. (D) Frictional force (black arrow) due to the translation motion of a rod. (E) Frictional force (black arrow) due to the rotational motion of a rod. (F) Joint force (black arrows) acting on i-rod and (i+1)-rod.
Figure 2 with 1 supplement
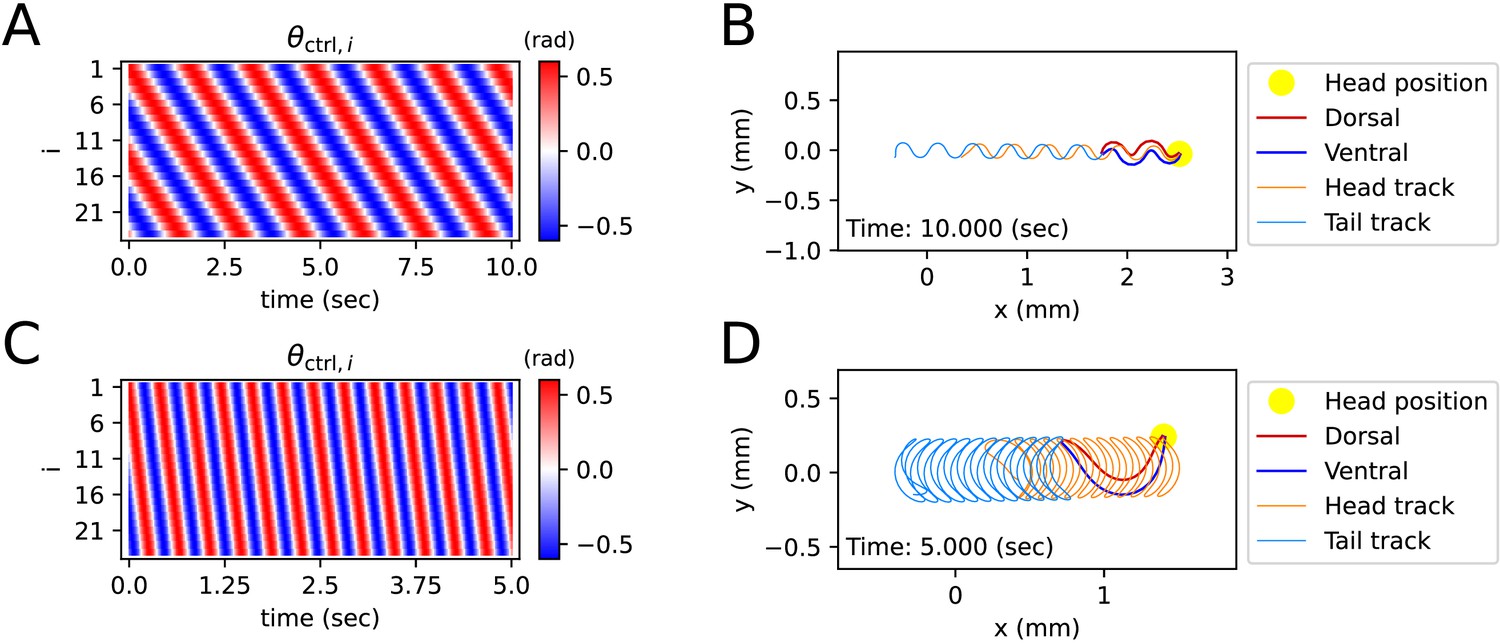
Simulated locomotion from a sine kymogram.
(A) Crawling kymogram. Kymogram indicates the angle of i-joint which is located between i-rod and (i+1)-rod. Red and blue color mean i-joint bend in the dorsal and ventral directions, respectively. (B) Crawling trajectory. The yellow circle indicates the position of the worm’s head. The Orange and sky-blue lines show the worm’s head and tail trajectories, respectively. (C) Swimming kymogram. (D) Swimming trajectory.
Figure 2—figure supplement 1
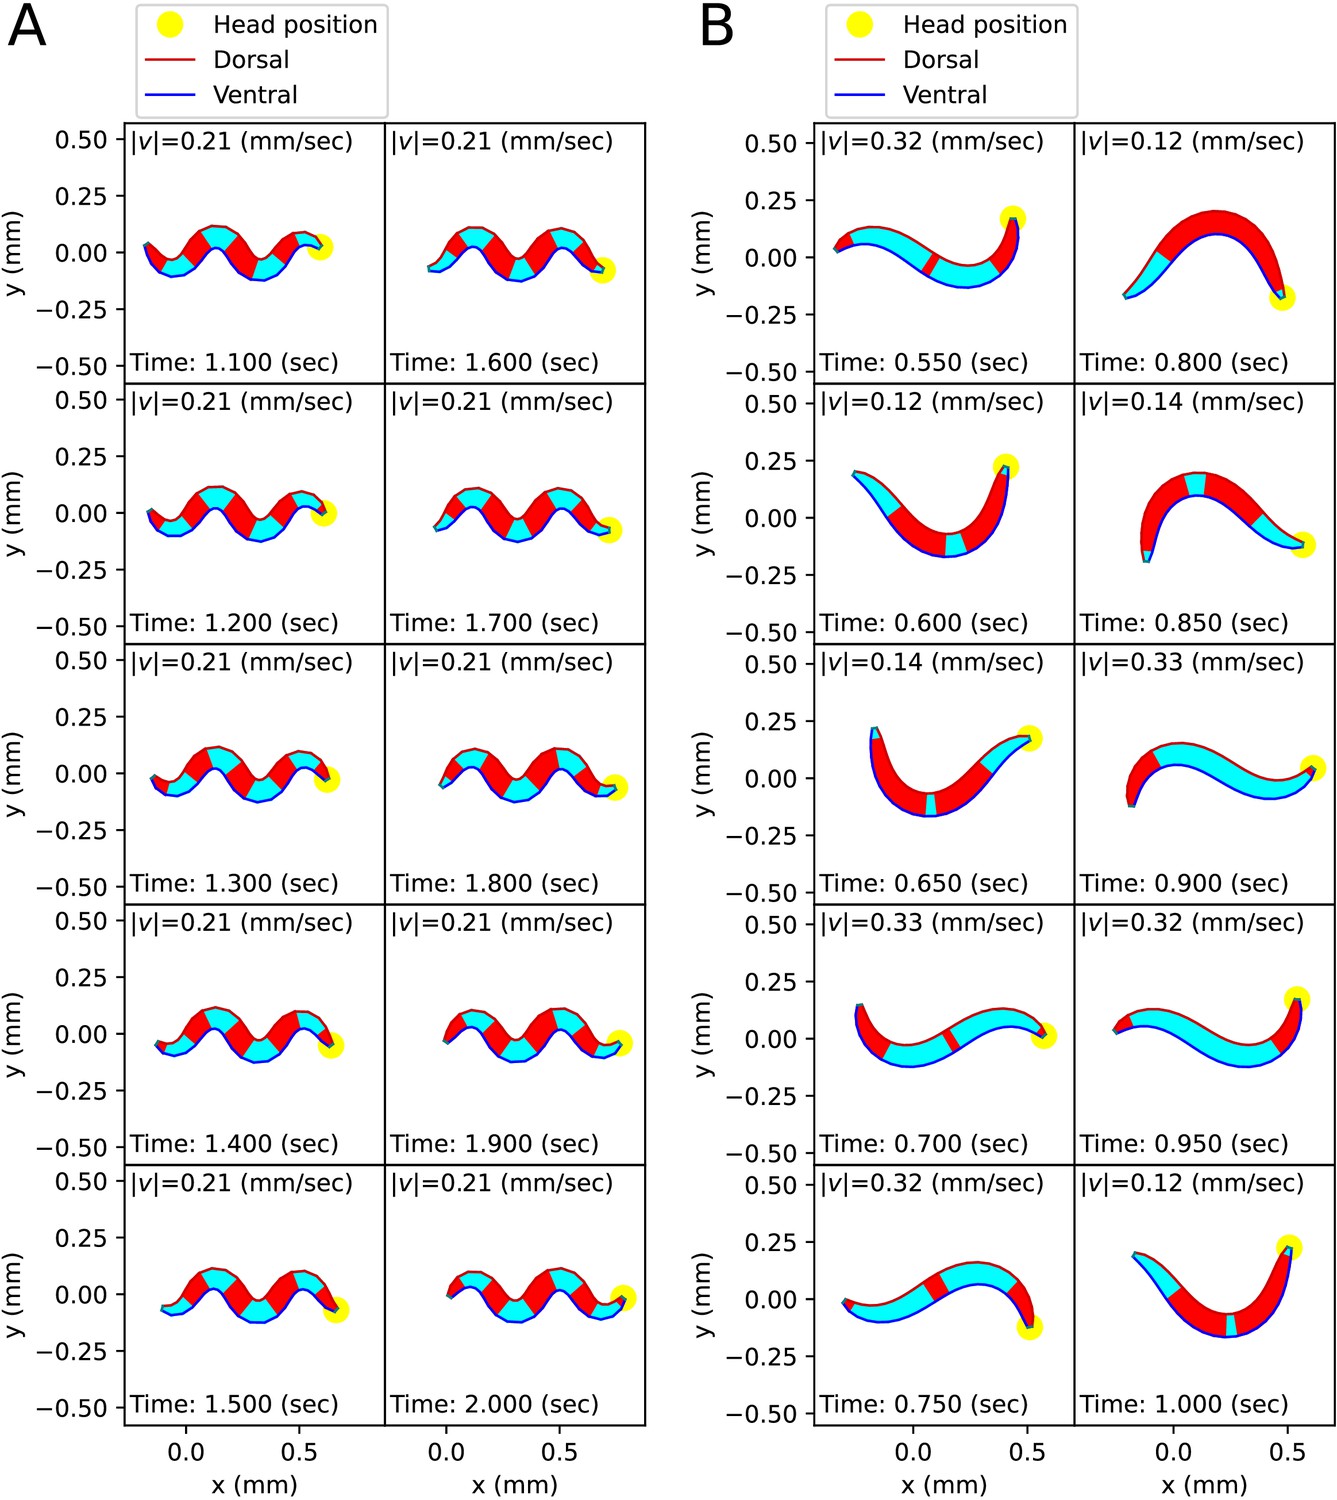
Locomotion propulsion mechanism.
During the worm’s locomotion, the parts receiving force in the direction of progress are marked in red, and the parts receiving force in the opposite direction are marked in cyan. (A) Crawling propulsion mechanism. During crawling, the worm gains propulsion from the body parts diagonal to the direction of progress. (B) Swimming propulsion mechanism. During swimming, the worm generates propulsion when it bends into a C-shape. While the worm’s speed is almost constant during crawling, it is not constant during swimming.
Figure 3 with 2 supplements

Simulated locomotion from a kymogram of a real worm locomotion video.
The length and direction of a black arrow indicate the magnitude and direction of the frictional force () that the corresponding body part, which is the starting point of the arrow, exerts on the surface. (A) Escaping behavior kymogram. Triangles over the heatmap indicate the corresponding time of snapshots shown in Figure (C). (B) Delta-turn kymogram. Triangles over the heatmap indicate the corresponding time of snapshots shown in Figure (D). (C) Escaping behavior trajectory. (D) Delta-turn trajectory. The arrow length scale is different from Figure (C) to clearly show the arrows' directions and head and tail tracks.
Figure 3—video 1
Reproduced escaping behavior of experimental video (Broekmans et al., 2016).
Left: Original video. Right: Reproduced video by ElegansBot.
Figure 3—video 2
Reproduced delta-turn of experimental video (Broekmans et al., 2016).
Left: Original video. Right: Reproduced video by ElegansBot.
Figure 4 with 1 supplement

Frictional force on each rod.
(A) Escaping behavior. The top panel represents the frictional force experienced by i-rod. As indicated on the color wheel to the right, the hue of this heatmap represents the direction of the force, and the saturation represents the magnitude of the force. The second panel from the top shows the magnitude of the frictional force . The third panel from the top represents the average (black solid line) of each column in the middle panel and the power (red dotted line), which is the amount of energy the worm consumes per unit time. The bottom panel represents the classification of the worm’s behavior (blue: forward locomotion, red: backward locomotion, green: turn) (The definitions of behavioral categories are in Methods). The triangles over each panel indicate the corresponding time of the snapshots depicted in Figure 3C. (B) Delta-turn. The triangles over each panel indicate the corresponding time of the snapshots depicted in Figure 3D.
Figure 4—figure supplement 1
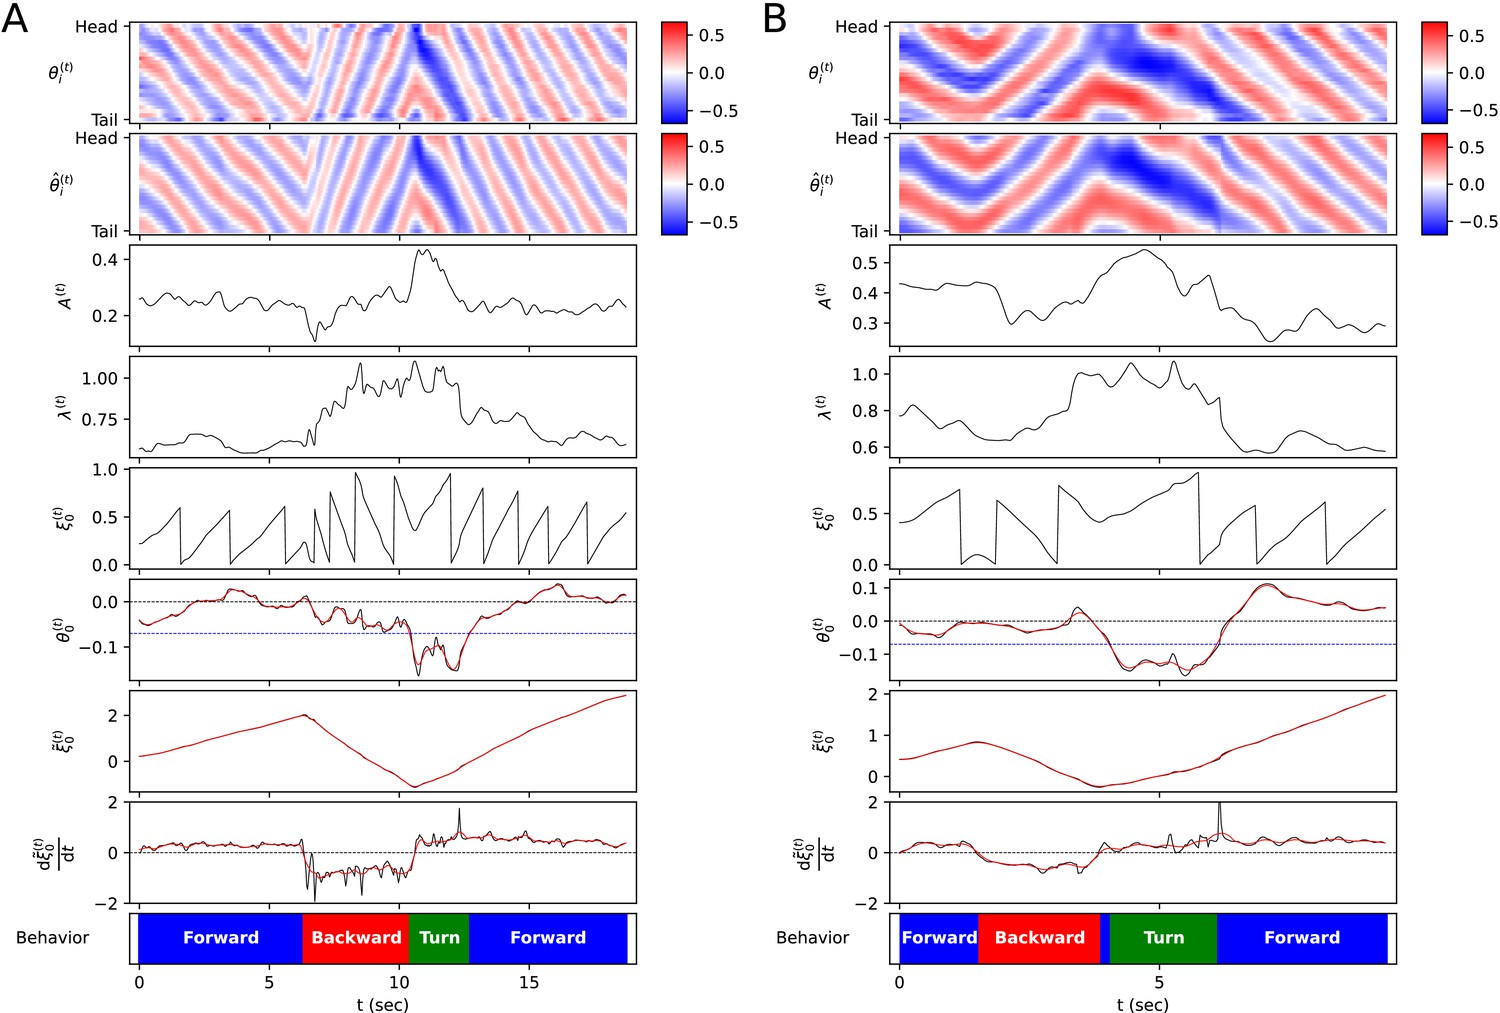
Process of defining behavioral categories.
(A) Escaping behavior. The top heatmap represents the body angle . The second panel from the top is the sine fitting of , denoted as . The third to the eighth panels present the parameters derived from the sine fitting (amplitude , wavelength , phase , body angle bias ), and values derived from these parameters ( , ). The black solid line represents the actual value, and the red solid line represents the smoothed value. The bottom panel shows the behavior classification calculated from and (blue: forward locomotion, red: backward locomotion, green: turn). (B) Delta-turn.
Figure 5 with 3 supplements
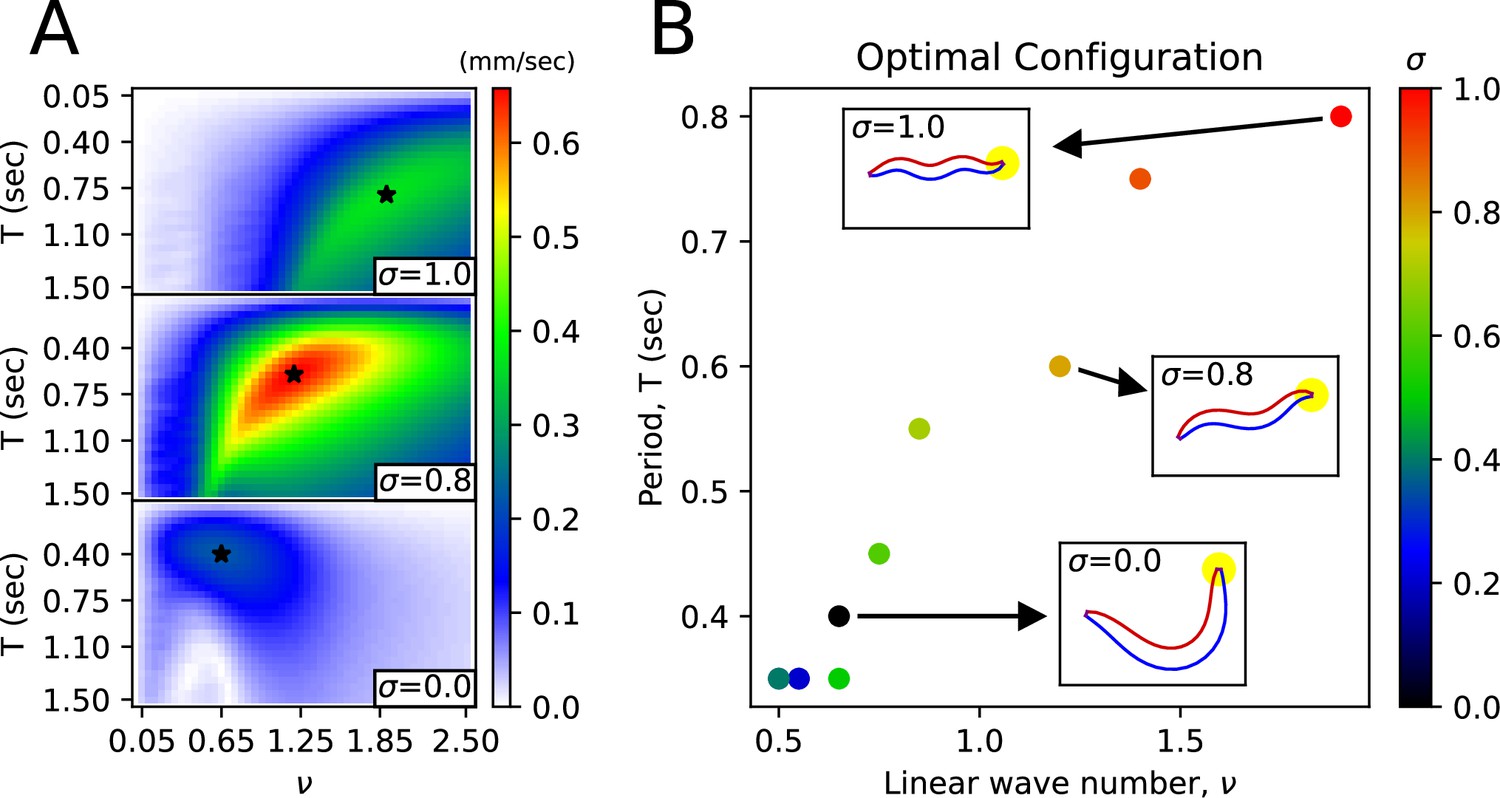
Body shape transition from the shape in water to the shape in agar.
(A) Average velocity of the worm as a function of wavenumber () and period () for a given friction coefficient. The star symbol indicates the pair of (, ) that maximizes the worm’s average velocity. (B) For each environmental index , the pair of (, ) that maximizes the worm’s average velocity. The worm figures inside the small rectangles pointed to by the arrows represent the body shape corresponding to the respective (, ) pair.
Figure 5—figure supplement 1
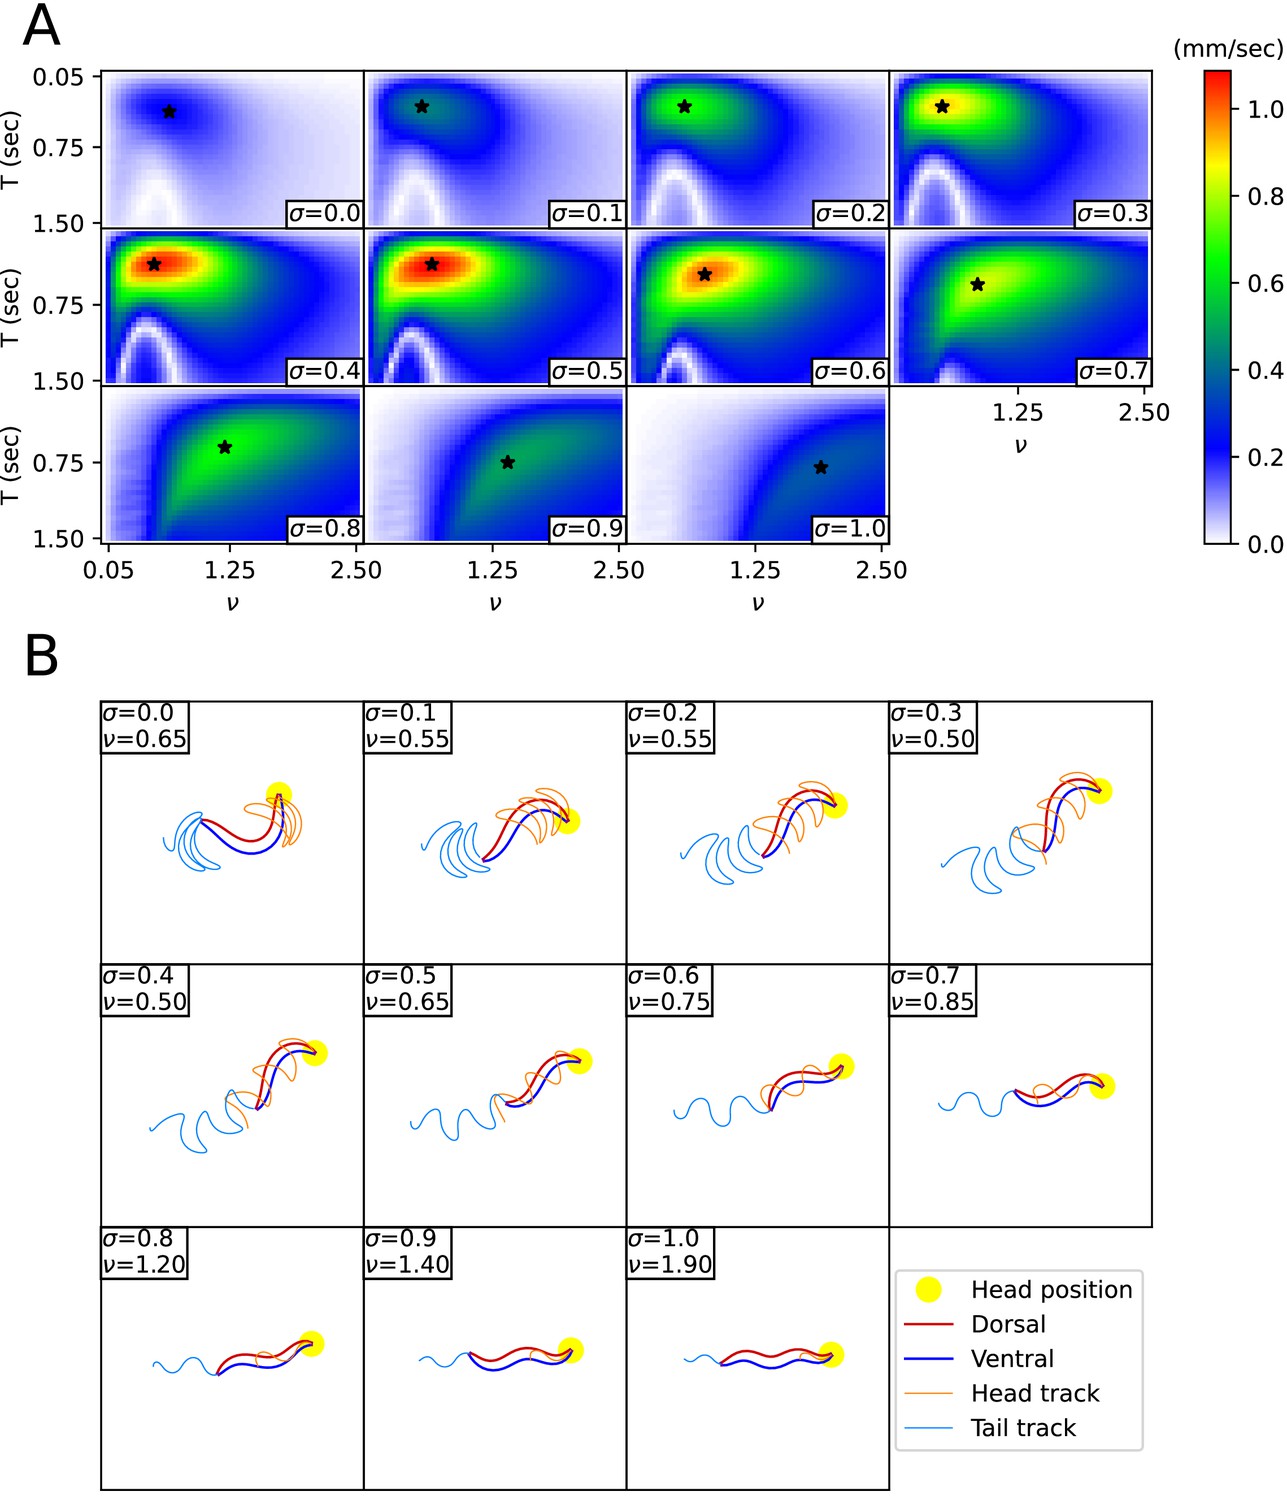
Transition of body shape from water () to agar ().
(A) The average velocity of the worm according to the wavenumber and period to the friction coefficient by . The star marker denotes the pair of (, ) that maximizes the average velocity of the worm (i.e., optimal (, )). As increases and the friction coefficient gradually increases, the optimal (, ) transitions from the upper left to the lower right. (B) The body shape and locomotion pattern due to the pair of (, ) that maximizes the average velocity of the worm for the friction coefficient by .
Figure 5—figure supplement 2
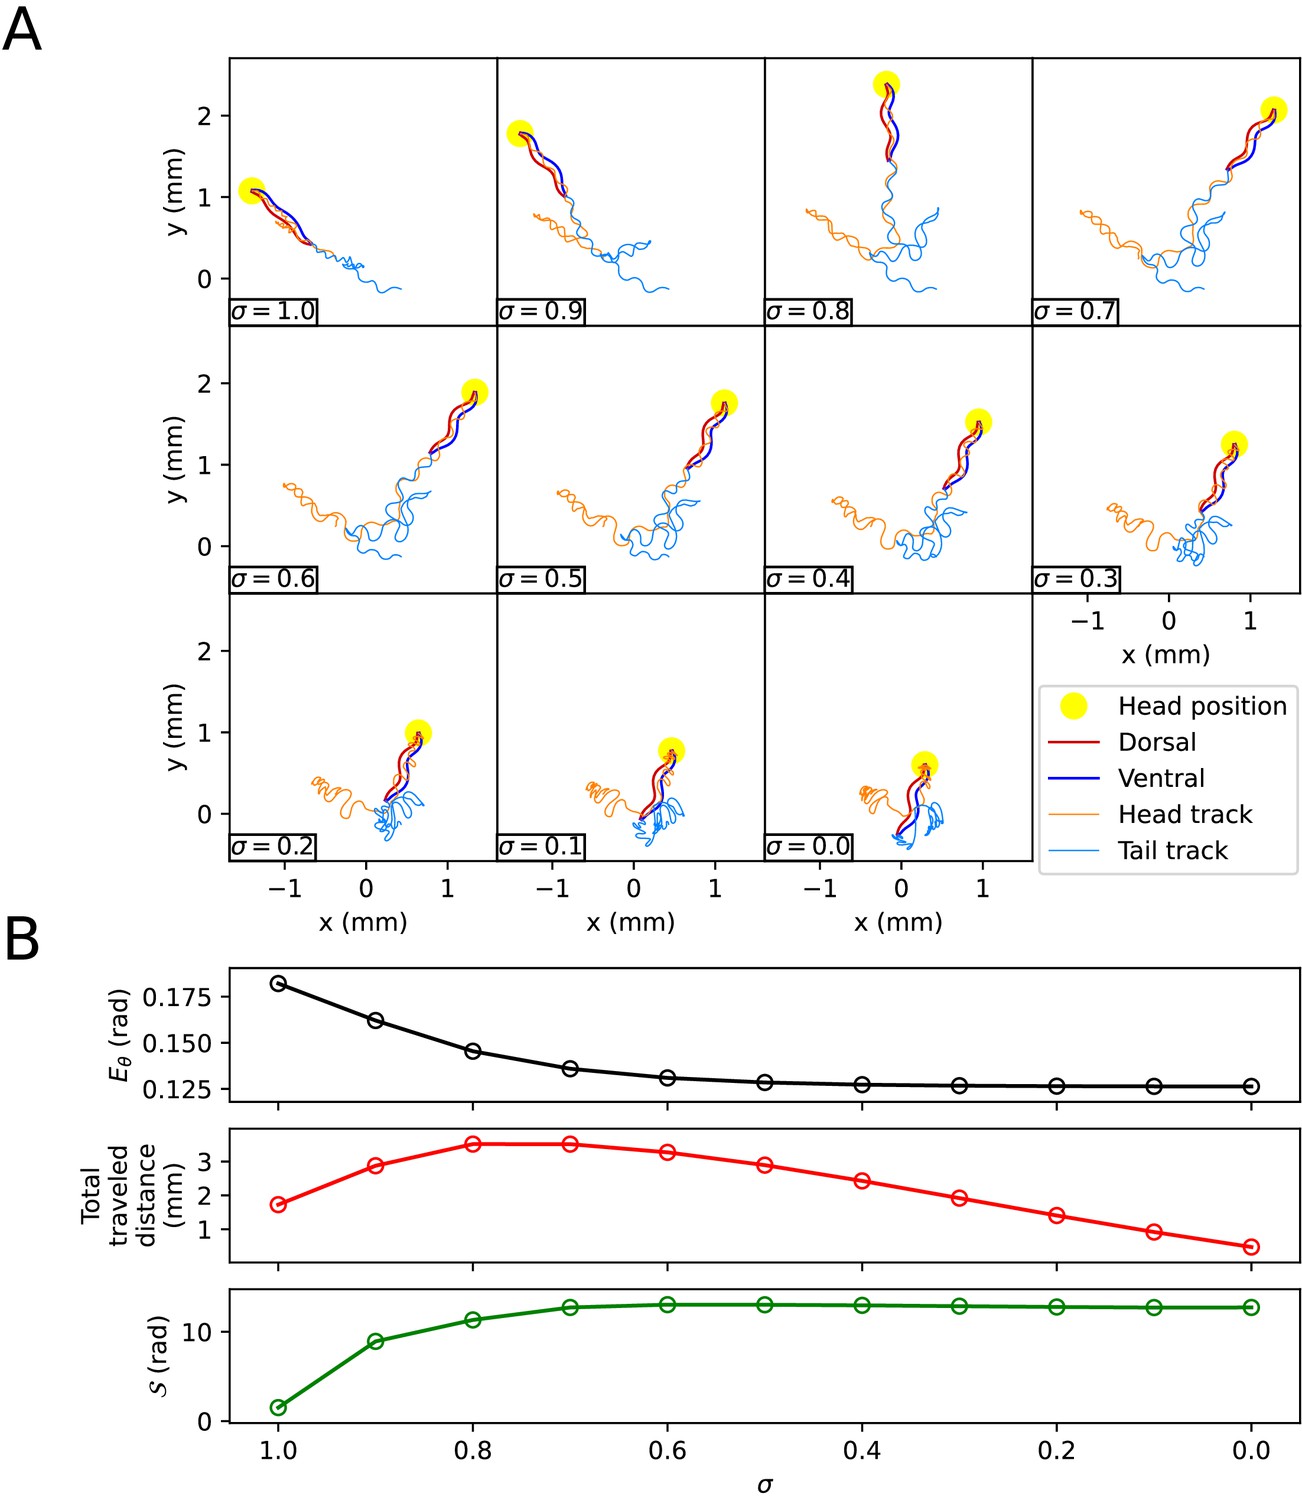
The effect of the environmental index on escaping behavior.
(A) The trajectory of the worm depends on the environmental index . (B) Characteristics of the trajectory. The top graph represents . The middle graph shows the total traveled distance of the worm. The bottom graph represents the total absolute angle change ().
Figure 5—figure supplement 3
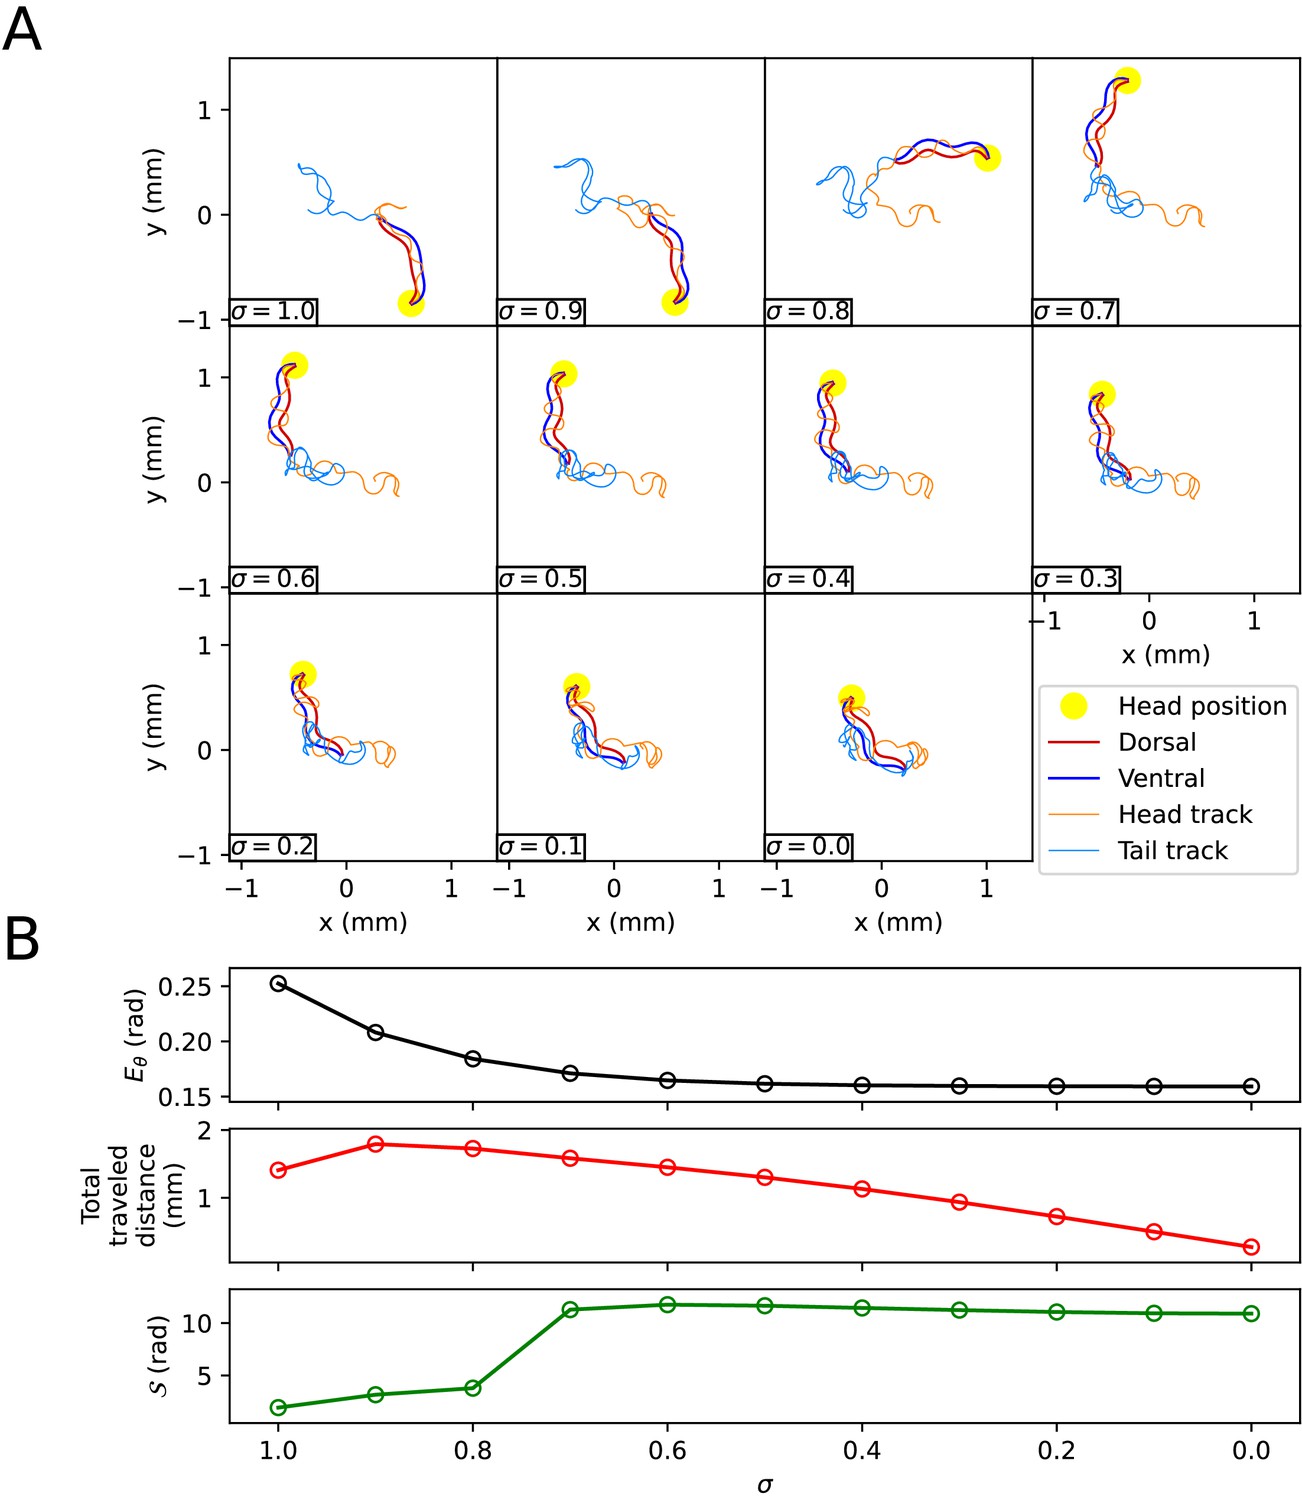
The effect of the environmental index on the delta-turn.
(A) The trajectory of the worm for each environmental index . (B) Characteristics of the trajectory. The top graph represents . The middle graph shows the total traveled distance of the worm. The bottom graph represents the total absolute angle change ().
Appendix 1—figure 1
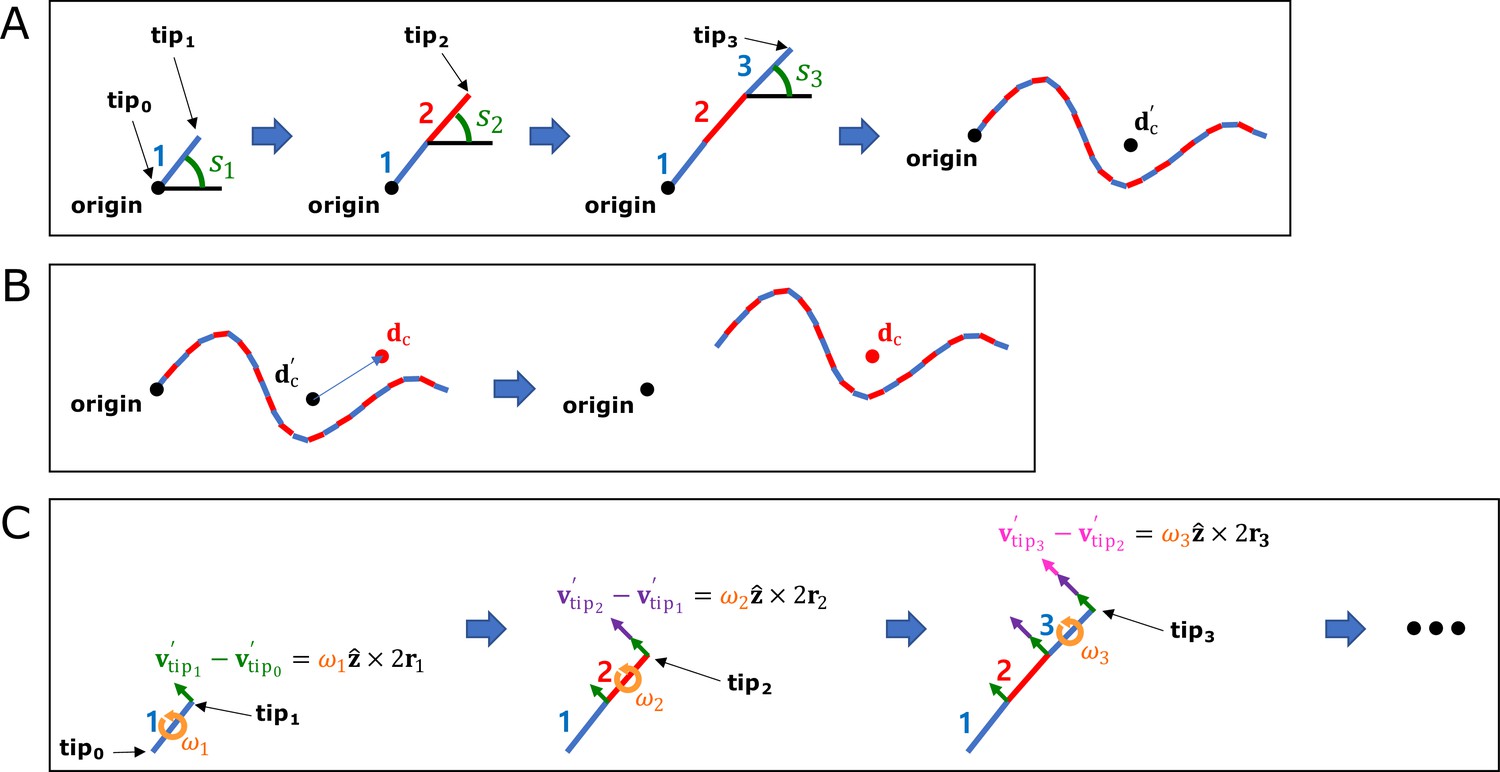
Method of compressing motion state information.
(A) Method of calculating the relative position of the rod. (B) Method of calculating the absolute position of the rod. (C) Method of calculating the relative velocity of the rod.
Appendix 1—figure 2
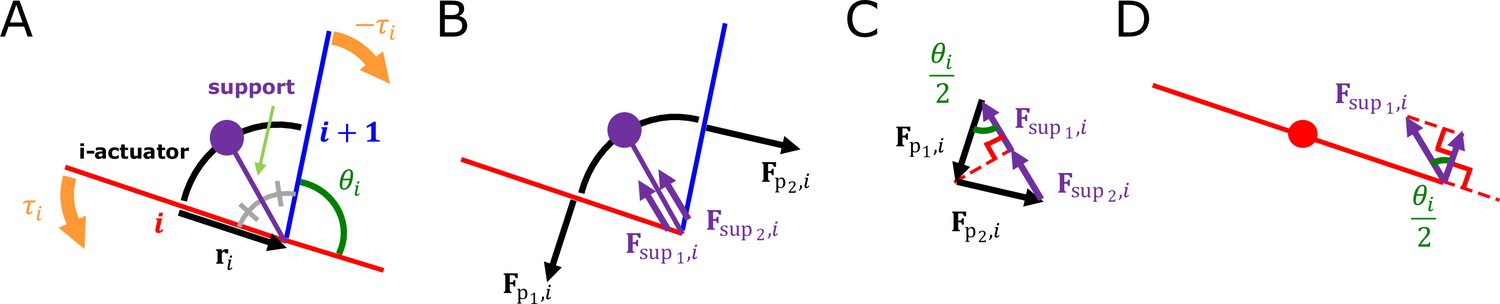
The i-actuator.
(A) Composition of i-actuator. (B) Forces that i-actuator gives to i-rod and (i+1)-rod. (C) Resultant force given by i-actuator. (D) Force component of i-actuator that applies torque to i-rod.
Appendix 1—figure 3
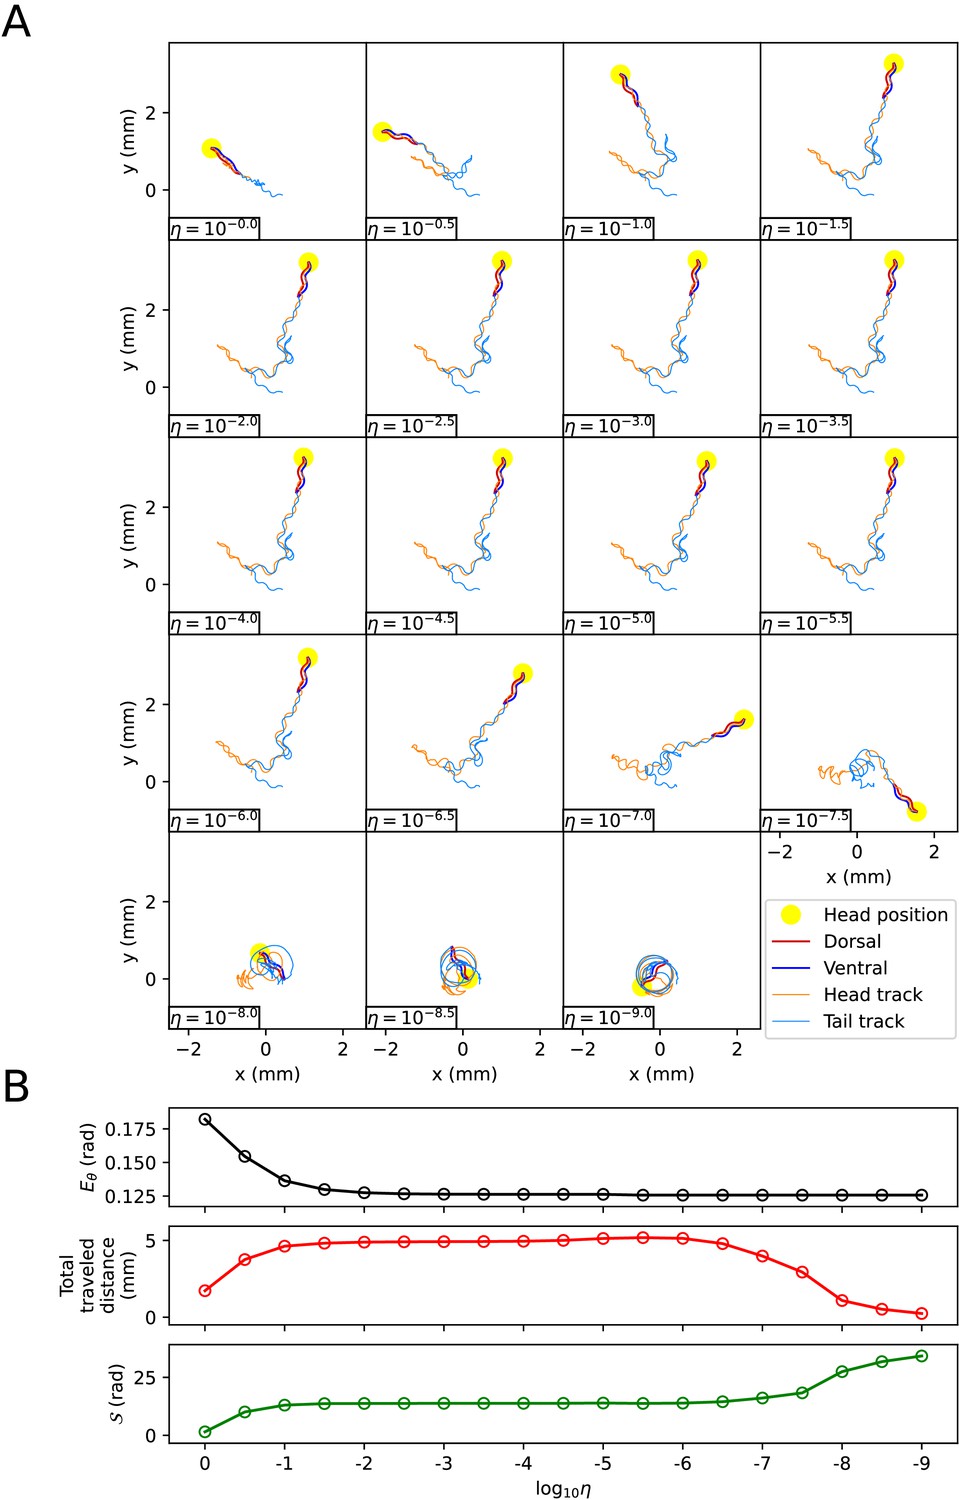
The effect of the scaling factor η of the friction coefficients on the escaping behavior.
(A) The trajectory of the worm for each scaling factor η. (B) Characteristics of the trajectory. The top graph represents . The middle graph shows the total traveled distance of the worm. The bottom graph represents the total absolute angle change (, where T is the total time of the experimental video).
Appendix 1—figure 4
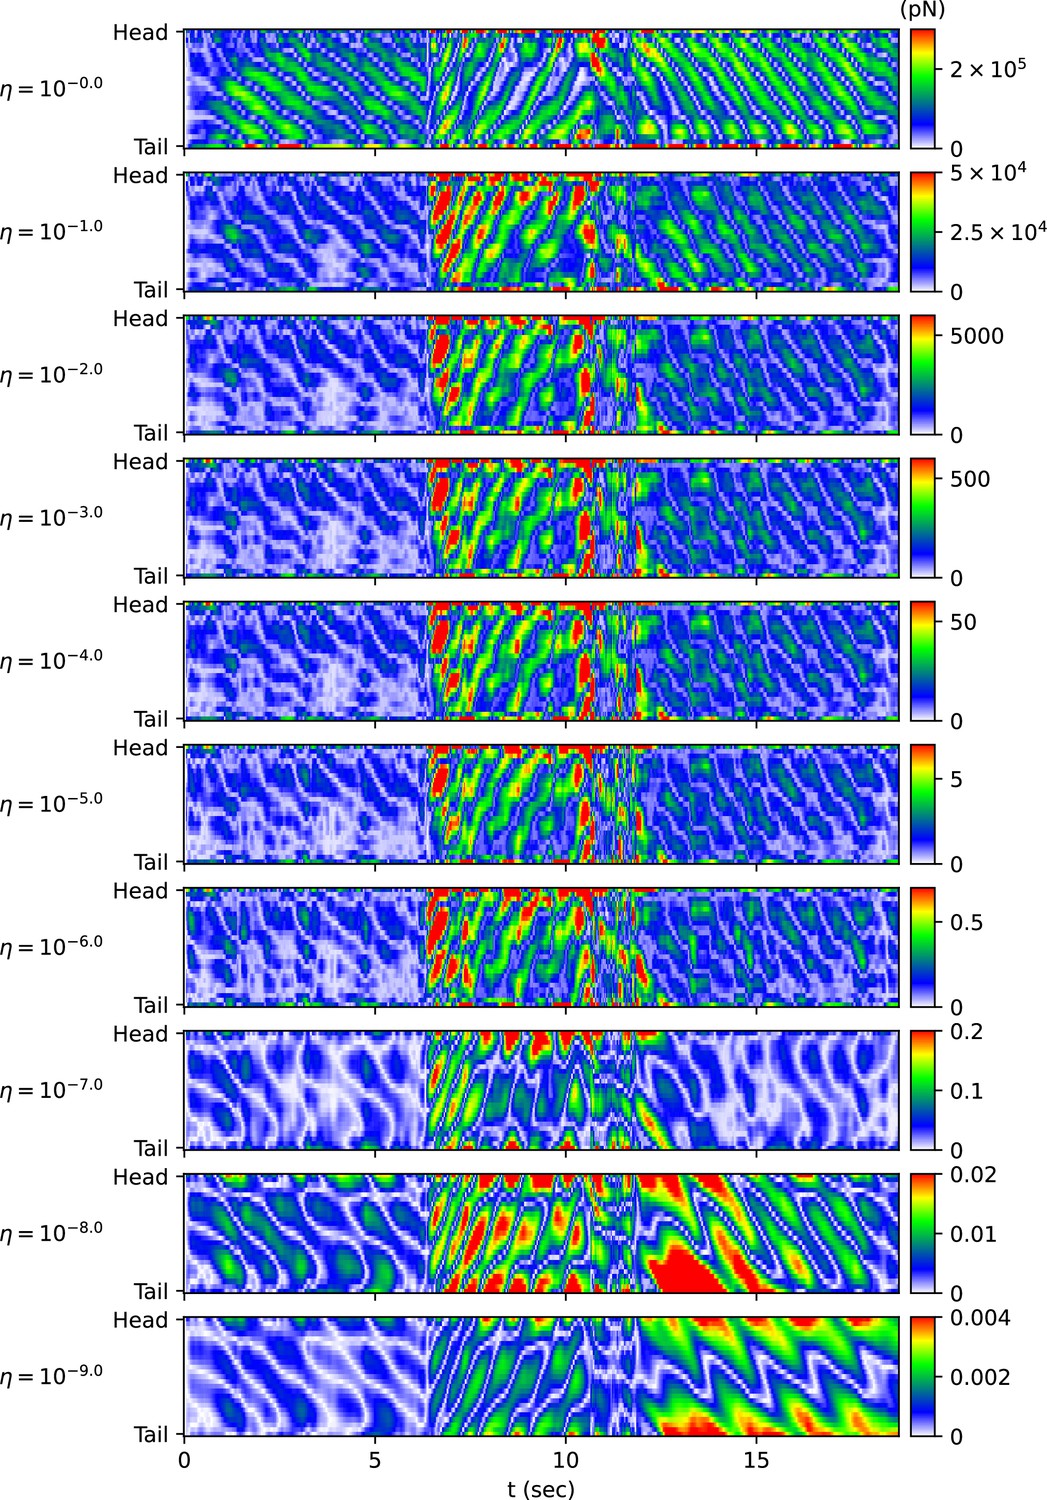
The magnitude of the frictional force during the escaping behavior depending on the scaling factor η of the friction coefficient.
The color of each point in the heatmap represents the value of .
Appendix 1—figure 5

The impact of the scaling factor η of the friction coefficients on the delta-turn.
(A) The trajectory of the worm for each scaling factor η. (B) Characteristics of the trajectory. The top graph represents . The middle graph shows the total traveled distance of the worm. The bottom graph represents the total absolute angle change ()
Appendix 1—figure 6

The magnitude of the frictional force during the delta-turn depending on the scaling factor η of the friction coefficient.
The color of each point in the heatmap represents the value of .
Additional files
Download links
A two-part list of links to download the article, or parts of the article, in various formats.
Downloads (link to download the article as PDF)
Open citations (links to open the citations from this article in various online reference manager services)
Cite this article (links to download the citations from this article in formats compatible with various reference manager tools)
Development of equation of motion deciphering locomotion including omega turns of Caenorhabditis elegans
eLife 12:RP92562.
https://doi.org/10.7554/eLife.92562.3


