Signatures of Bayesian inference emerge from energy-efficient synapses
- Faculty of Engineering, University of Bristol, United Kingdom
- Intelligent Systems Research Centre, School of Computing, Engineering, and Intelligent Systems, Ulster University, United Kingdom
Figures
Figure 1
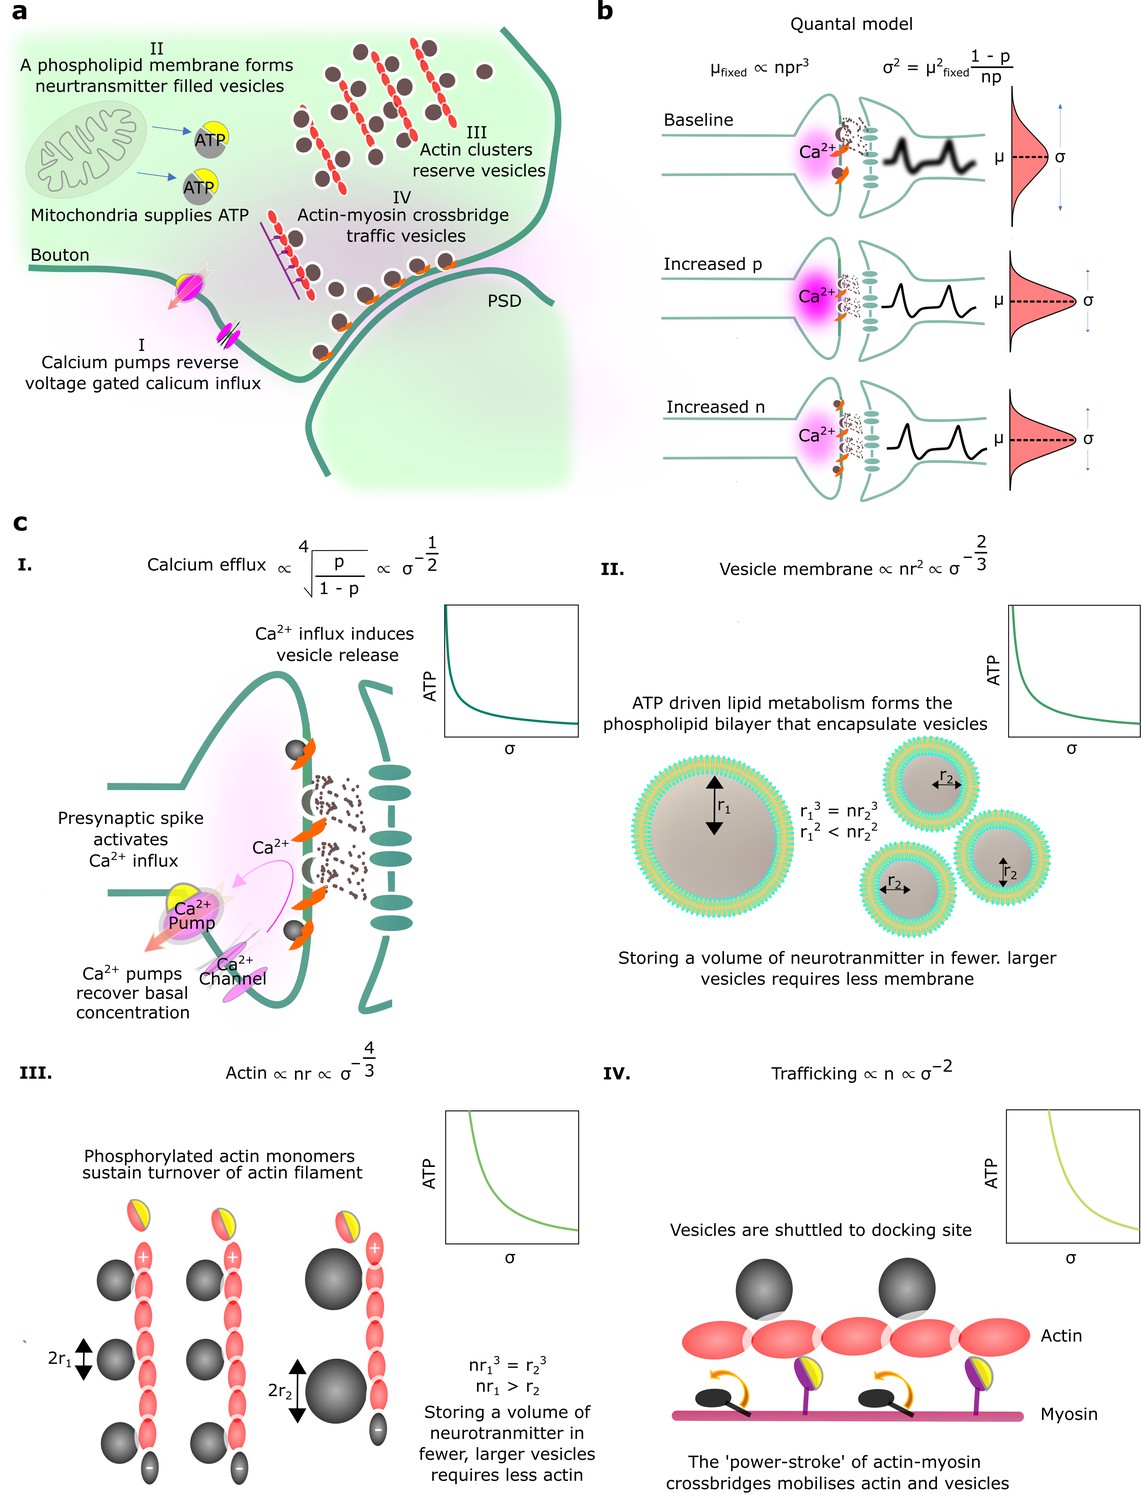
Physiological reliability costs.
(a) Physiological processes that influence postsynaptic potential (PSP) precision. (b) A binomial model of vesicle release. For fixed PSP mean, increasing or decreases PSP variance. We have substituted to reflect that vesicle volume scales quantal size (Karunanithi et al., 2002). (c) Four different biophysical costs of reliable synaptic transmission. (I) Calcium pumps reverse the calcium influx that triggers vesicle release. A high probability of vesicle release requires a large influx of calcium, and extruding this calcium is costly. Note that represents the vesicle radius. (II) An equivalent volume of neurotransmitter can be stored in few large vesicles or shared between many smaller vesicles. Sharing a fixed volume of neurotransmitter among many small vesicles reduces PSP variability but increases vesicle surface area, creating greater demand for phospholipid metabolism and hence greater energetic costs. (III) Actin filament supports the structure of vesicle clusters at the terminal. Many and large vesicles require more actin and higher rates of ATP-dependent actin turnover. (IV) There are biophysical costs that scale with the number of vesicles (Laughlin et al., 1998; Attwell and Laughlin, 2001), e.g., vesicle trafficking driven by myosin-V active transport along actin filaments.
Figure 2
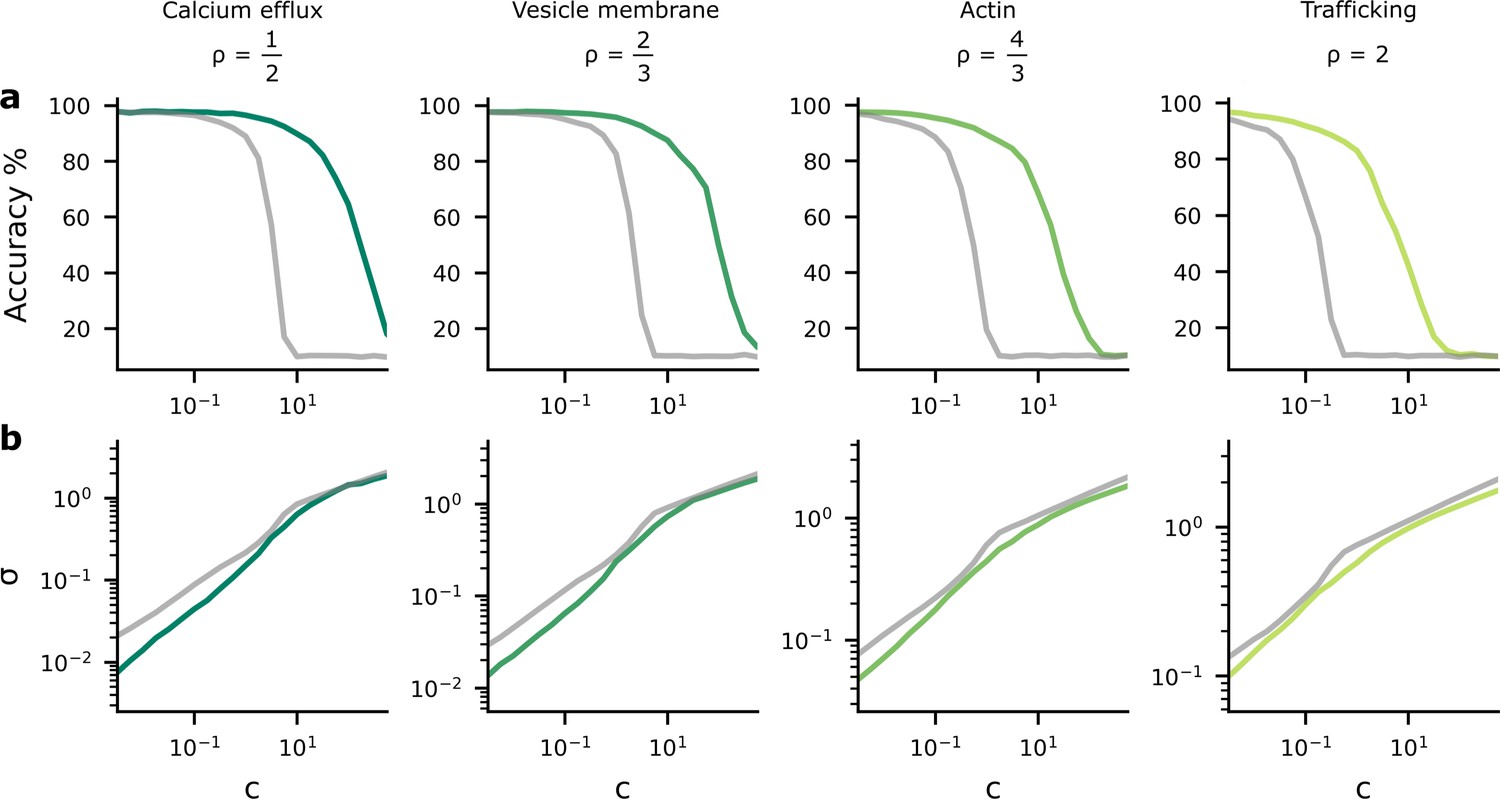
Accuracy and postsynaptic potential (PSP) variance as we change the tradeoff between reliability and performance costs.
We changed the tradeoff by modifying , in Equation 4, which multiplies the reliability cost. (a) As the reliability cost multiplier, , increases, the accuracy decreases considerably. The green lines show the heterogeneous noise setting where the noise level is optimised on a per-synapse basis, while the grey lines show the homogeneous noise setting, where the noise is optimised, but forced to be the same for all synapses. (b) When the reliability cost multiplier, , increases, the synaptic noise level (specifically, the average standard deviation, σ) increases.
Figure 3
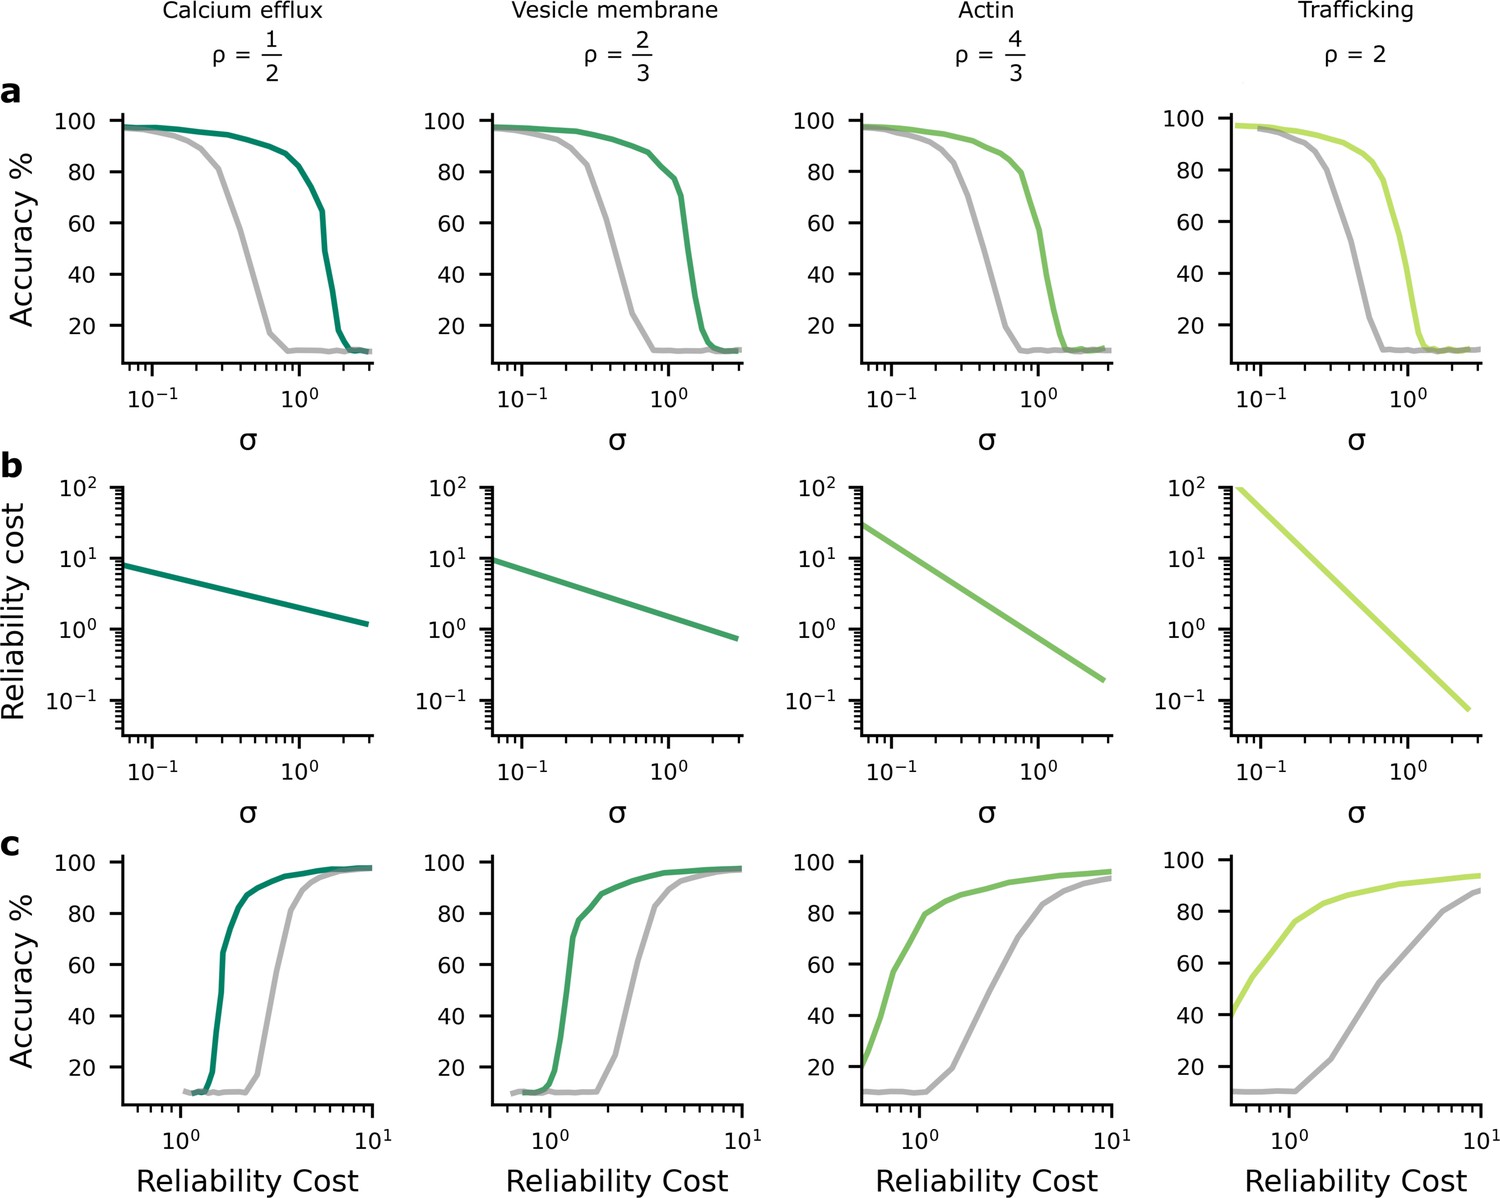
The performance-reliability cost tradeoff in artificial neural network (ANN) simulations.
(a) Accuracy decreases as the average postsynaptic potential (PSP) standard deviation, , increases. The grey lines are for the homogeneous noise setting where the PSP variance is optimised but isotropic (i.e. the same across all synapses), while the green lines are for the heterogeneous noise setting, where the PSP variances are optimised individually on a per-synapse basis. (b) Increasing reliability by reducing leads to greater reliability costs, and this relationship is different for different biophysical mechanisms and hence values for (columns). (c) Higher accuracy therefore implies larger reliability cost.
Figure 4
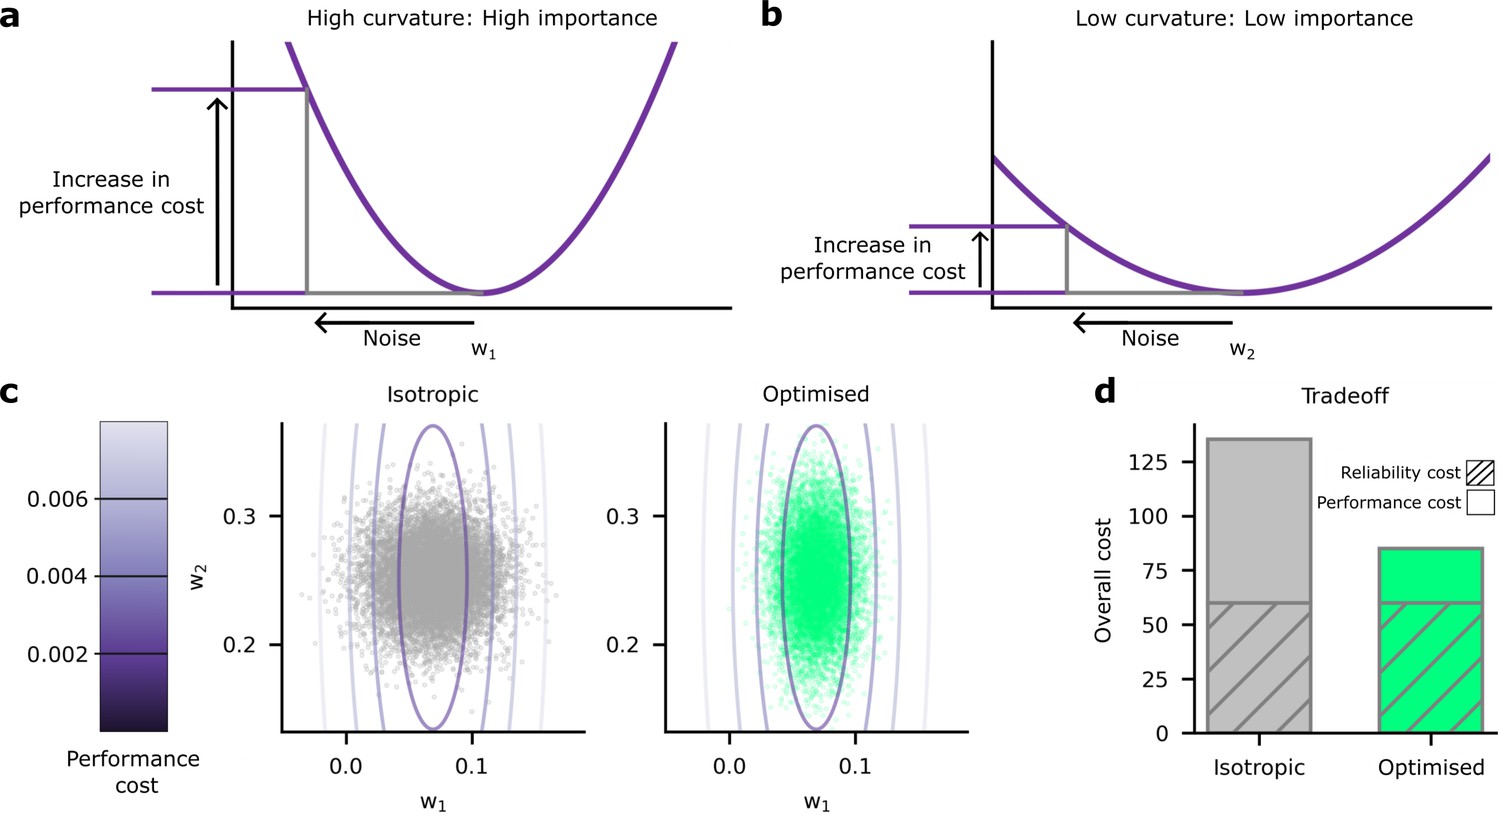
Schematic depiction of the impact of synaptic noise on synapses with different importance.
(a) First, we considered an important synapse for which small deviations in the weight, , e.g., driven by noise, imply a large increase in the performance cost. This can be understood as a high curvature of the performance cost as a function of . (b) Next we considered an unimportant synapse, for which deviations in the weights cause far less increase in performance cost. (c) A comparison of the impacts of homogeneous and optimised heterogeneous variability for synapses and from (a and b). The performance cost is depicted using the purple contours, and realisations of the postsynaptic potentials (PSPs) driven by synaptic variability are depicted in the grey/green points. The grey points (left) depict homogeneous noise while the green points (right) depict optimised, heterogeneous noise. (d) The noise distributions in panel c are chosen to keep the same reliability cost (diagonally hatched area); but the homogeneous noise setting has far a higher performance cost, primarily driven by larger noise in the important synapse, .
Figure 5
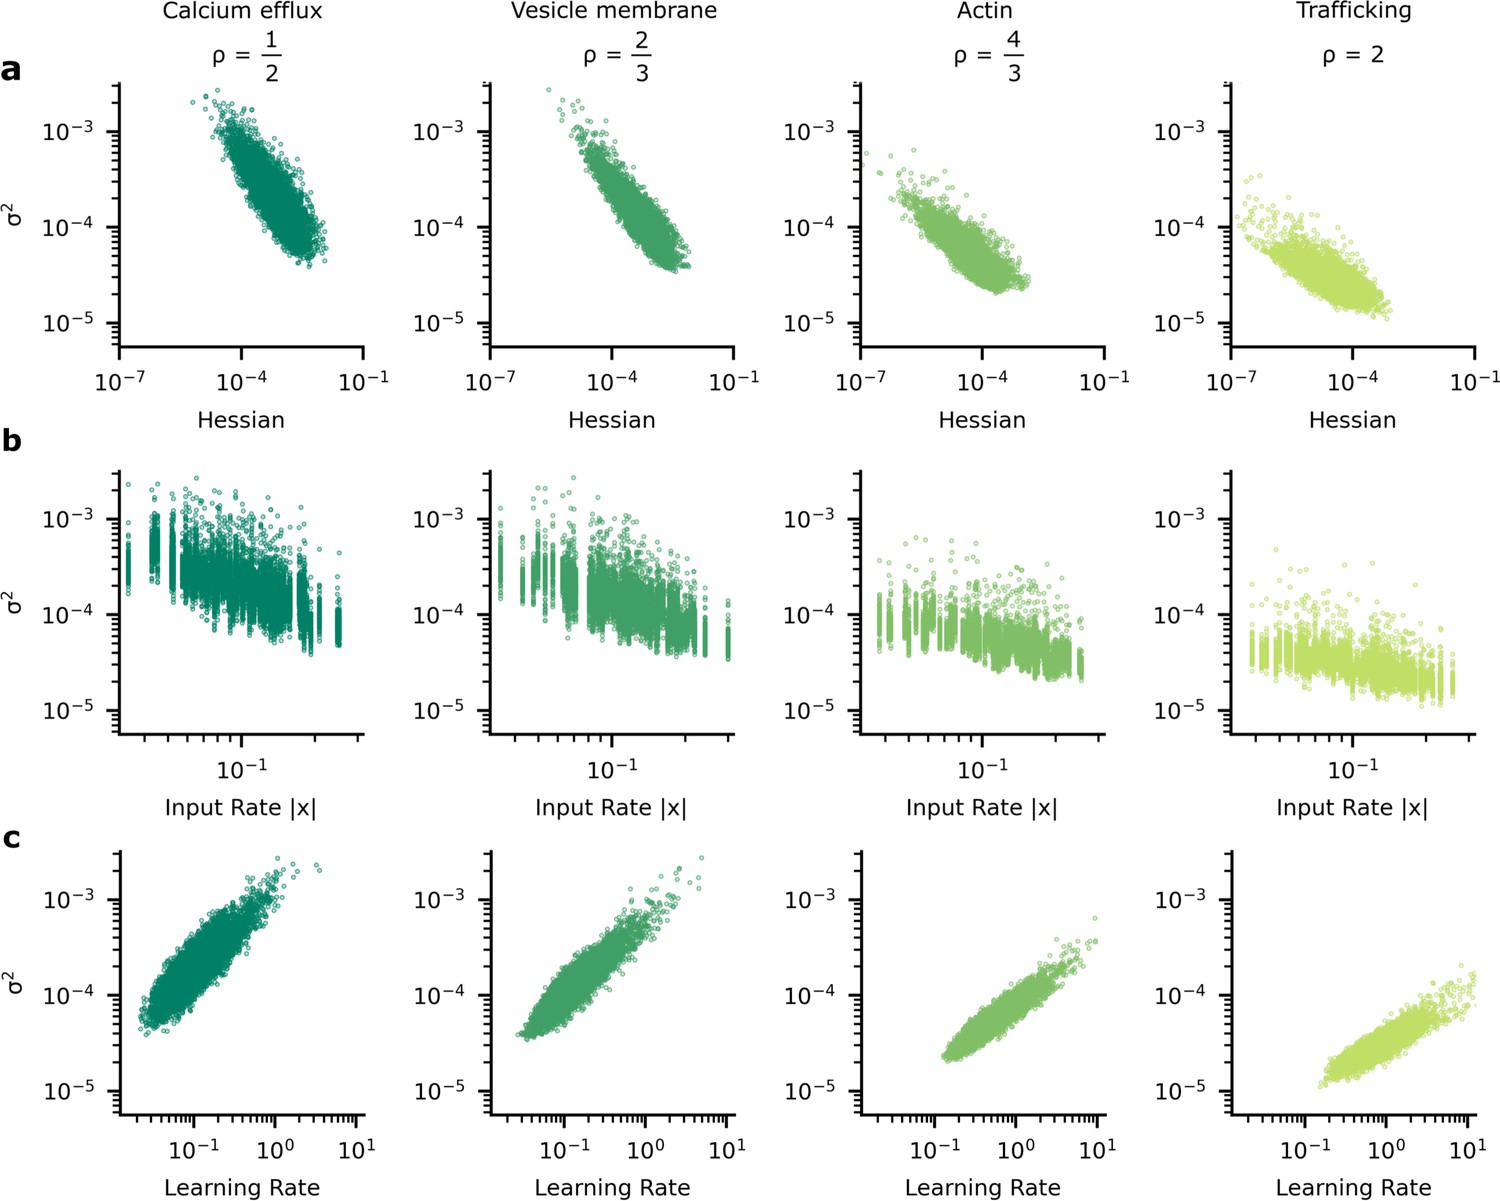
The heterogeneous patterns of synapse variability in artificial neural networks (ANNs) optimised by the tradeoff.
We present data patterns on logarithmic axis between signatures of synapse importance and variability for 10,000 (100 neuron units, each with 100 synapses) synapses that connect two hidden layers in our ANN. (a) Synapses whose corresponding diagonal entry in the Hessian is large have smaller variance. (b) Synapses with high variance have faster learning rates. (c) As input firing rate increases, synapse variance decreases.
Figure 6
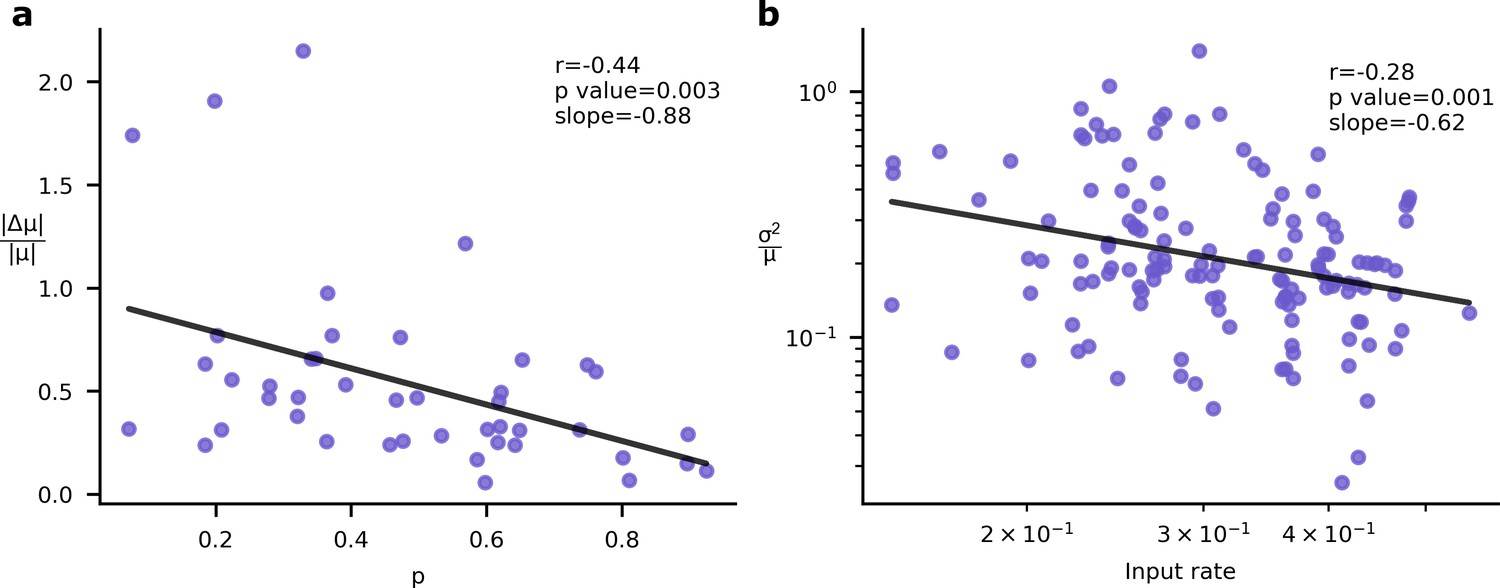
Experimental signatures of Bayesian synapses.
The Bayesian synapse hypothesis predicts relationships between synapse reliability, learning rate, and input rate. (a) Synapses with higher probability of release, , demonstrate smaller increases in synaptic mean following long-term plasticity (LTP) induction. This pattern was originally observed by Schug et al., 2021. (b) As input firing rates are increased, normalised EPSP variability decreases with (Aitchison et al., 2021).
Figure 7
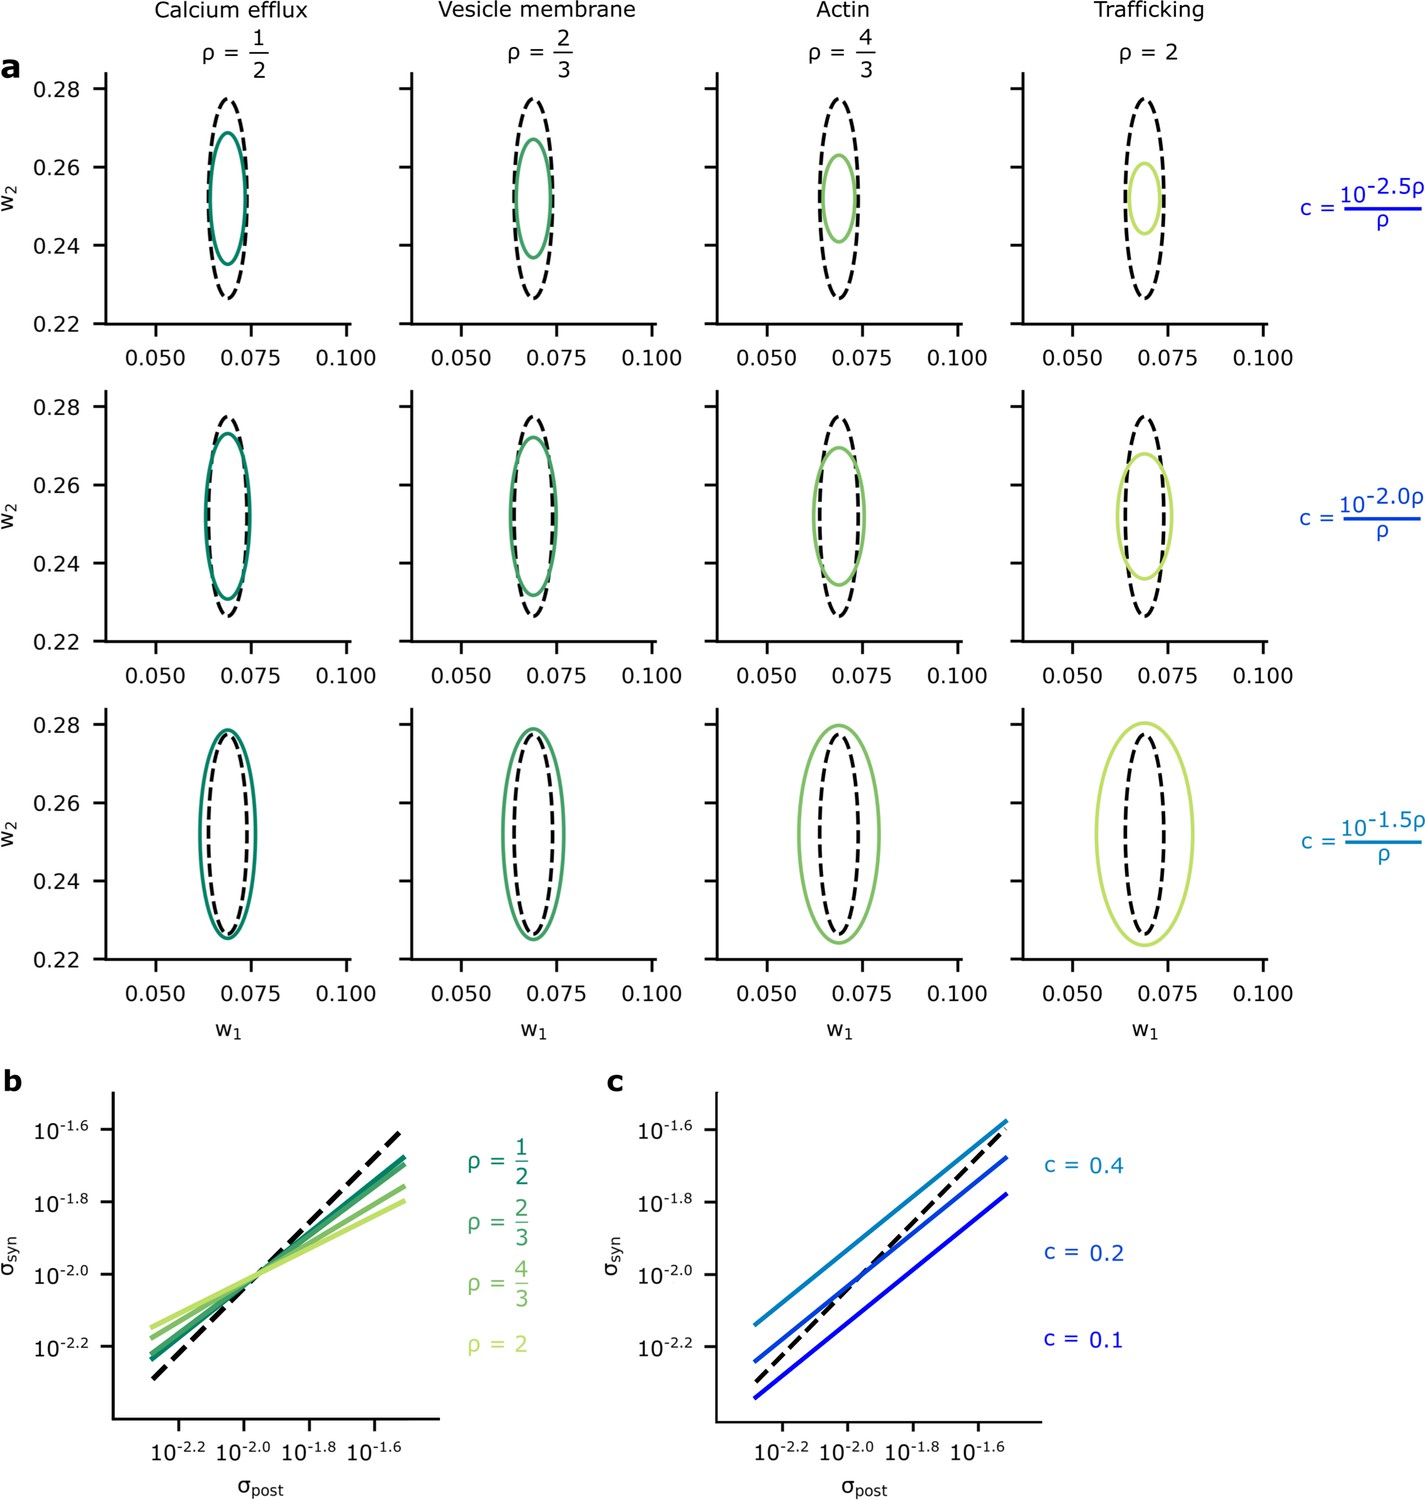
A comparison of optimised synaptic variability and posterior variance.
(a) Posterior variance (grey-dashed ellipses) plotted alongside optimised synaptic variability (green ellipses) for different values of (columns) and (rows) for an illustrative pair of synapses. Note that using fixed values of for different ’s dramatically changed the scale of the ellipses. Instead, we chose as a function of to ensure that the scale of the optimised noise variance was roughly equal across different . This allowed us to highlight the key pattern: that smaller values for give optimised variance closer to the true posterior variances, while higher values for tended to make the optimised synaptic variability more isotropic. (b) To understand this pattern more formally, we plotted the synaptic variability as a function of the posterior variance for different values of . Note that we set to to avoid large additive offsets (see Connecting the entropy and the biological reliability cost – Equation 48 for details). (c) The synaptic variability as a function of the posterior variance for different values of (3 DP). As increases (lighter blues) we penalise reliability more, and hence the optimised synaptic noise variability increases. (Here, we fixed across different settings for .)
Appendix 4—figure 1
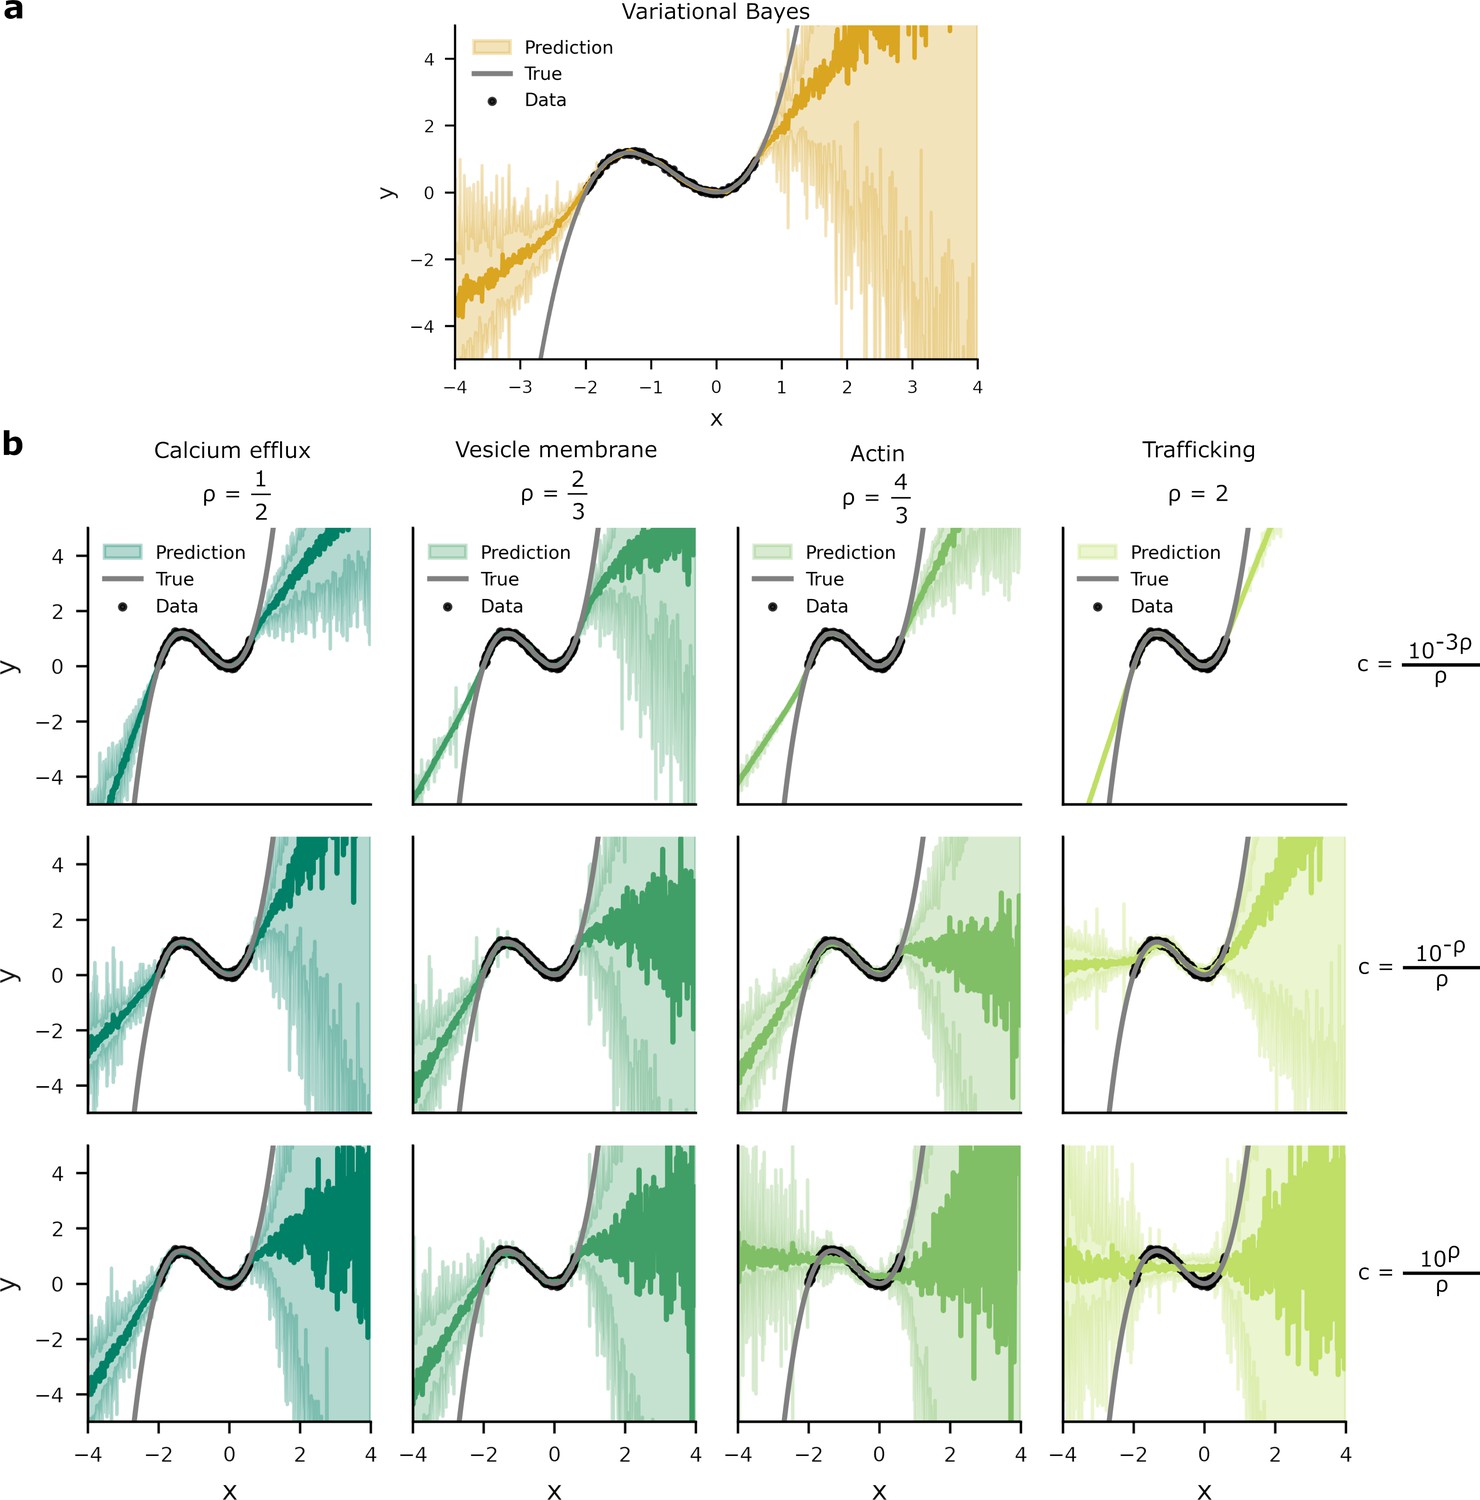
Predictive distributions from variational Bayes and our overall costs are similar.
We trained a one hidden layer network with 20 hidden units on data (black dots). Network targets, , were drawn from a ‘true’ function, (grey line) with additive Gaussian noise of variance . Two standard deviations of the predictive distributions are depicted in the shaded areas. (a) The predictive distribution produced by variational Bayes have a larger density of predictions where there is a higher probability of data. Where there is an absence of data, the model has to extrapolate and the spread of the predictive distribution increases. (b) Optimising the overall cost with small generates narrow response distributions. This is most noticeable in the upper-right panel, where the spread of predictive distribution is unrelated to the presence or absence of data. In contrast, while the predictive density for larger do vary according to the presence or absence of data, these distributions poorly predict . This is most apparent in the lower-right panel where the network’s predictive distribution transects the inflections of .
Appendix 5—figure 1
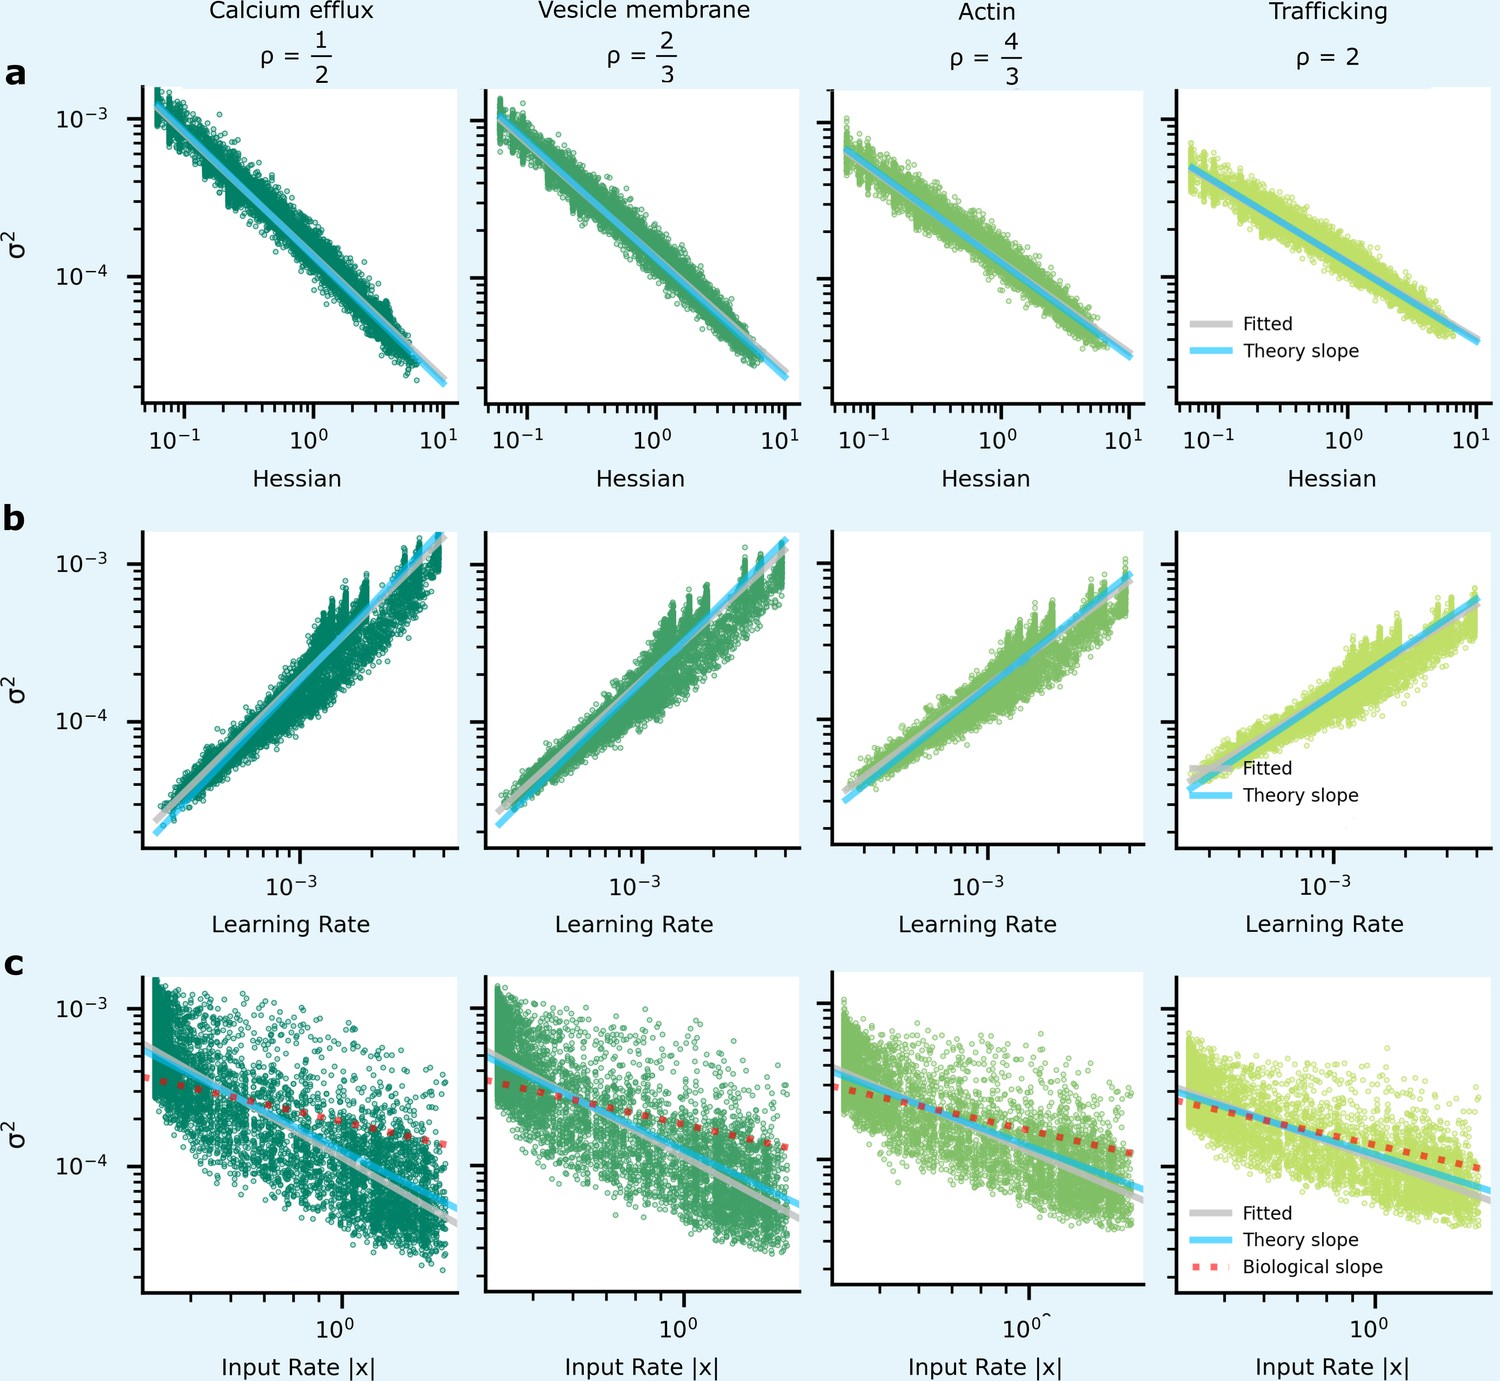
Comparing analytic predictions for synapse variability with simulations and experimental data in a zero hidden layer network for MNIST classification.
The green dots show simulated synapses, and the grey line is fitted to these simulated points. The blue line is from our analytic predictions, while the red-dashed line is taken from experimental data (Figure 6b).
Appendix 6—figure 1
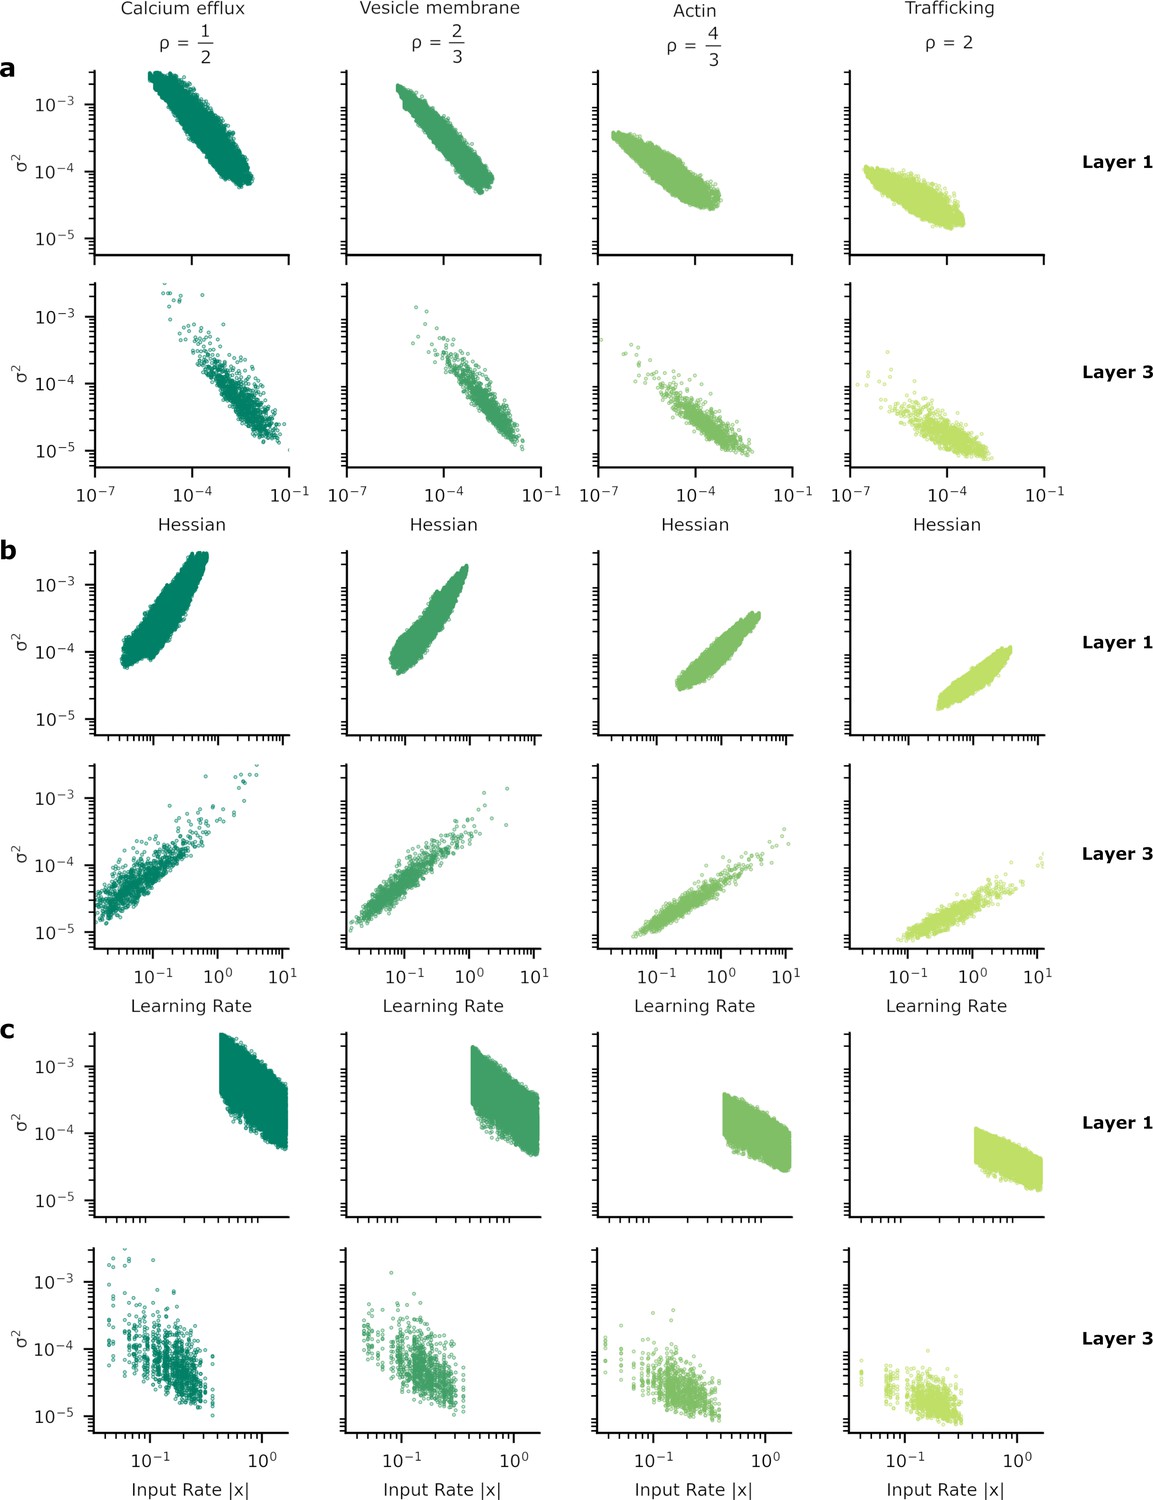
Patterns of synapse variability for the remaining layers of the neural network used to provide our results.
In Figure 5 we showed the heterogeneous patterns of synapse variability for the synapses connecting the two hidden layers of our artificial neural network (ANN). Here, we exhibit the equivalent plots for the other synapses, those between the input and the first hidden layer (layer 1) and from the final hidden layer to the output layer (layer 3). As in Figure 5 we show the relationship between synaptic variance and (a) the Hessian; (b) learning rate; and (c) input rate. The patterns do not appear substantially different from layer to layer.
Appendix 6—figure 2
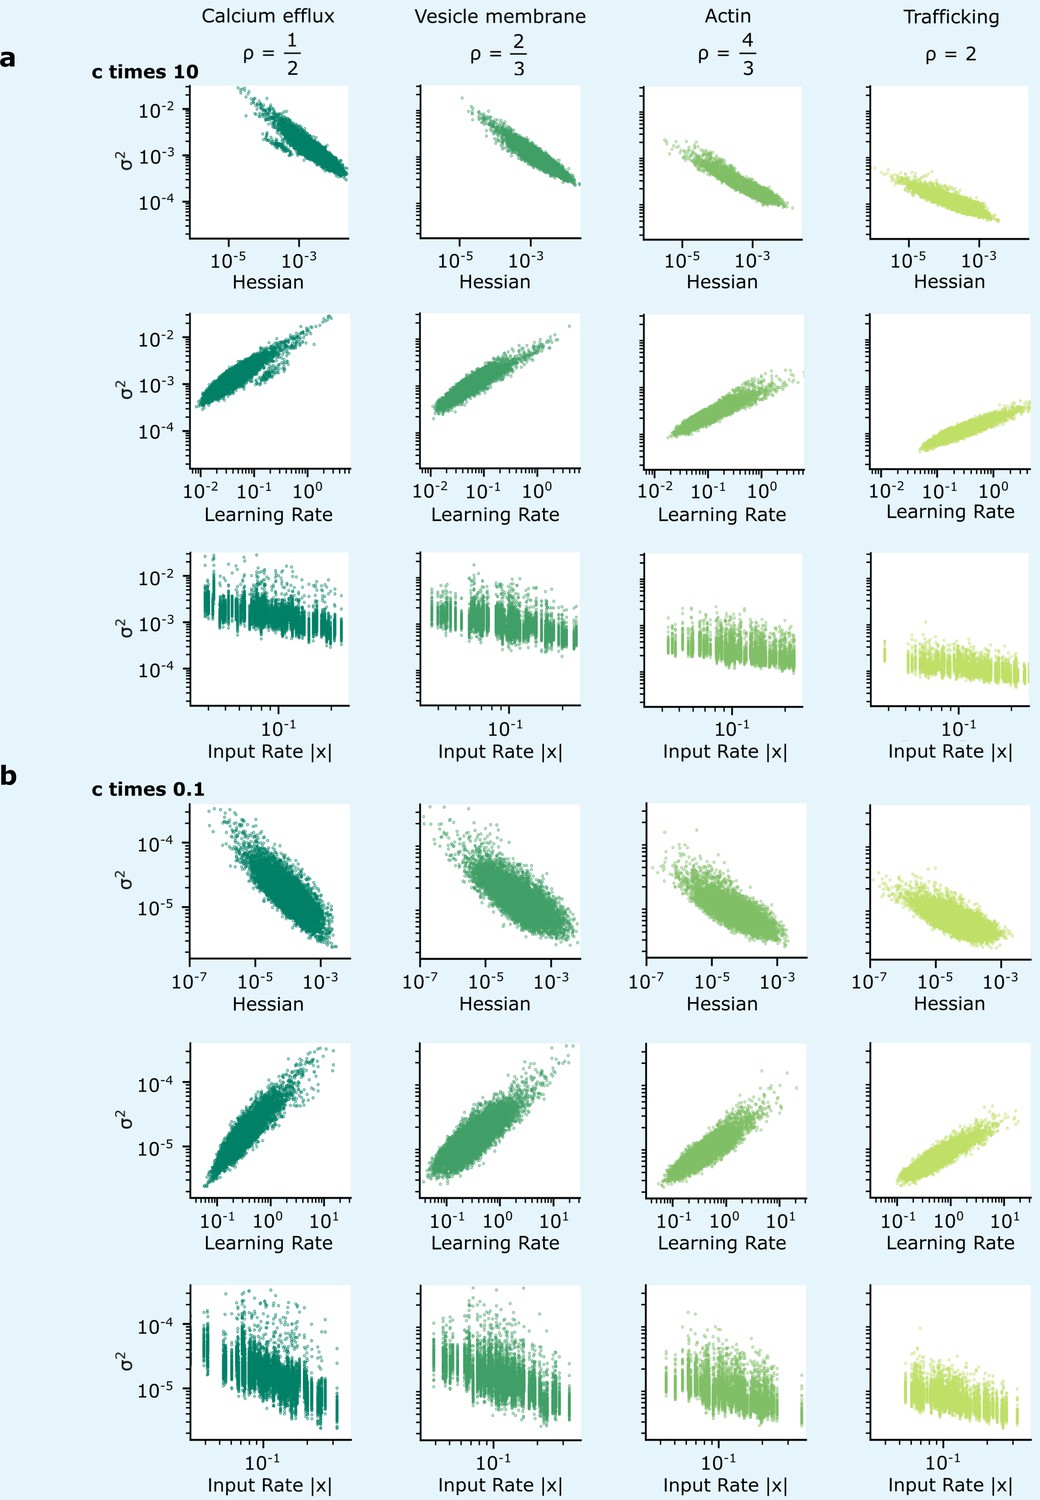
Patterns of synapse variability are robust to changes in the reliability.
We show that the patterns of variability of synapses connecting the two hidden layers presented in Figure 5 are preserved over a wide range of . (a, b) When the reliability cost multiplier, , is either increased (a) or decreased (b) by a factor of 10, overall synapse variability increases or decreases accordingly, but the qualitative correlations seen in Figure 5 are preserved.
Additional files
Download links
A two-part list of links to download the article, or parts of the article, in various formats.
Downloads (link to download the article as PDF)
Open citations (links to open the citations from this article in various online reference manager services)
Cite this article (links to download the citations from this article in formats compatible with various reference manager tools)
Signatures of Bayesian inference emerge from energy-efficient synapses
eLife 12:RP92595.
https://doi.org/10.7554/eLife.92595.3


