Epigenetic insights into GABAergic development in Dravet Syndrome iPSC and therapeutic implications
- Department of Immunology, Genetics and Pathology, Uppsala University and Science for Life Laboratory, Sweden
Figures
Figure 1 with 3 supplements
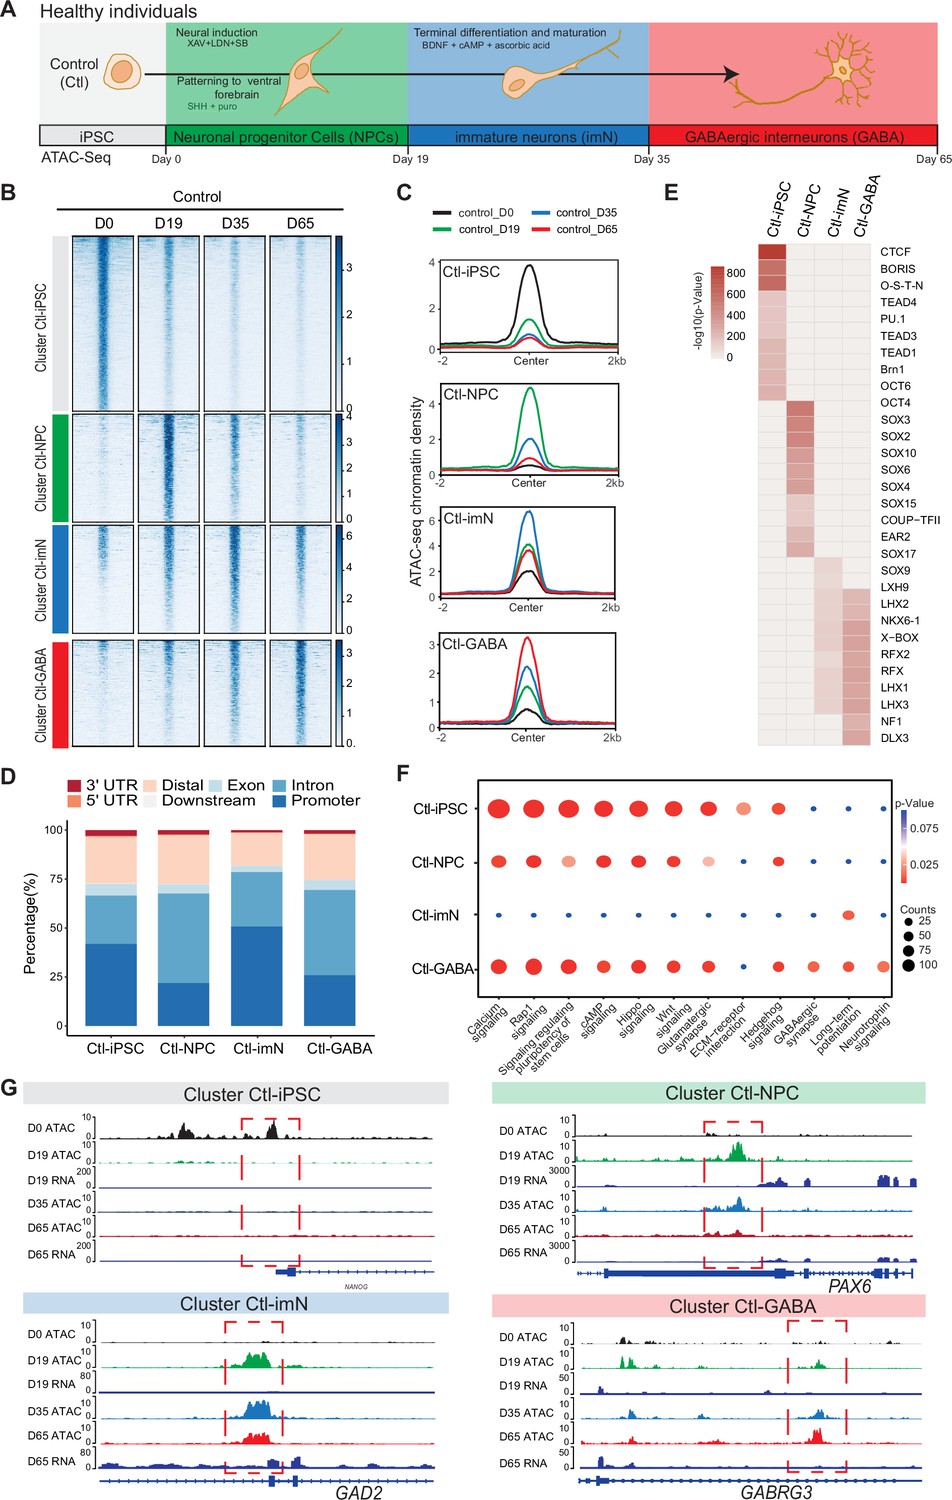
Chromatin accessibility dynamics during GABAeric interneuron differentiation of control induced pluripotent stem cells (iPSCs).
(A) Schematic illustration of GABAergic interneuron differentiation protocol. Cells from iPSC differentiation were collected for assay of transposase accessible chromatin sequencing (ATAC-Seq). Interneuron differentiation was grouped into four stages: iPSC (Day 0), neural progenitor cells; NPCs (Day 19), immature neurons, imN (Day 35), GABAergic interneurons, GABA (Day 65). (B) Heatmap of four Clusters identified by time series analysis using temporal changes in chromatin accessibility compared to D0 (Day 0) and other points. The signal strengths were denoted by color intensities. (C) Line plots showing chromatin accessibility at cluster-specific regions from each time point. (D) Barplot for genomic distribution of differential chromatin accessible regions for each cluster. (E) Heatmap for top 10 transcription factors (TFs) enrichment in each cluster. The significance was denoted by color intensities. O-S-E-N=OCT4-SOX2-TCF-NANOG. (F) Bubble plot of Kyoto Encyclopedia of Genes and Genomes (KEGG) pathway enrichment for each cluster. p-value and enrichment were indicated. The corresponding comprehensive list of enrichment terms can be found in Supplementary file 2. (G) Genome browser view showing representative differential chromatin accessible regions at the indicated gene loci. Additionally, RNA-seq data (Schuster et al., 2019b) is visualized at D19 and D65.
Figure 1—figure supplement 1
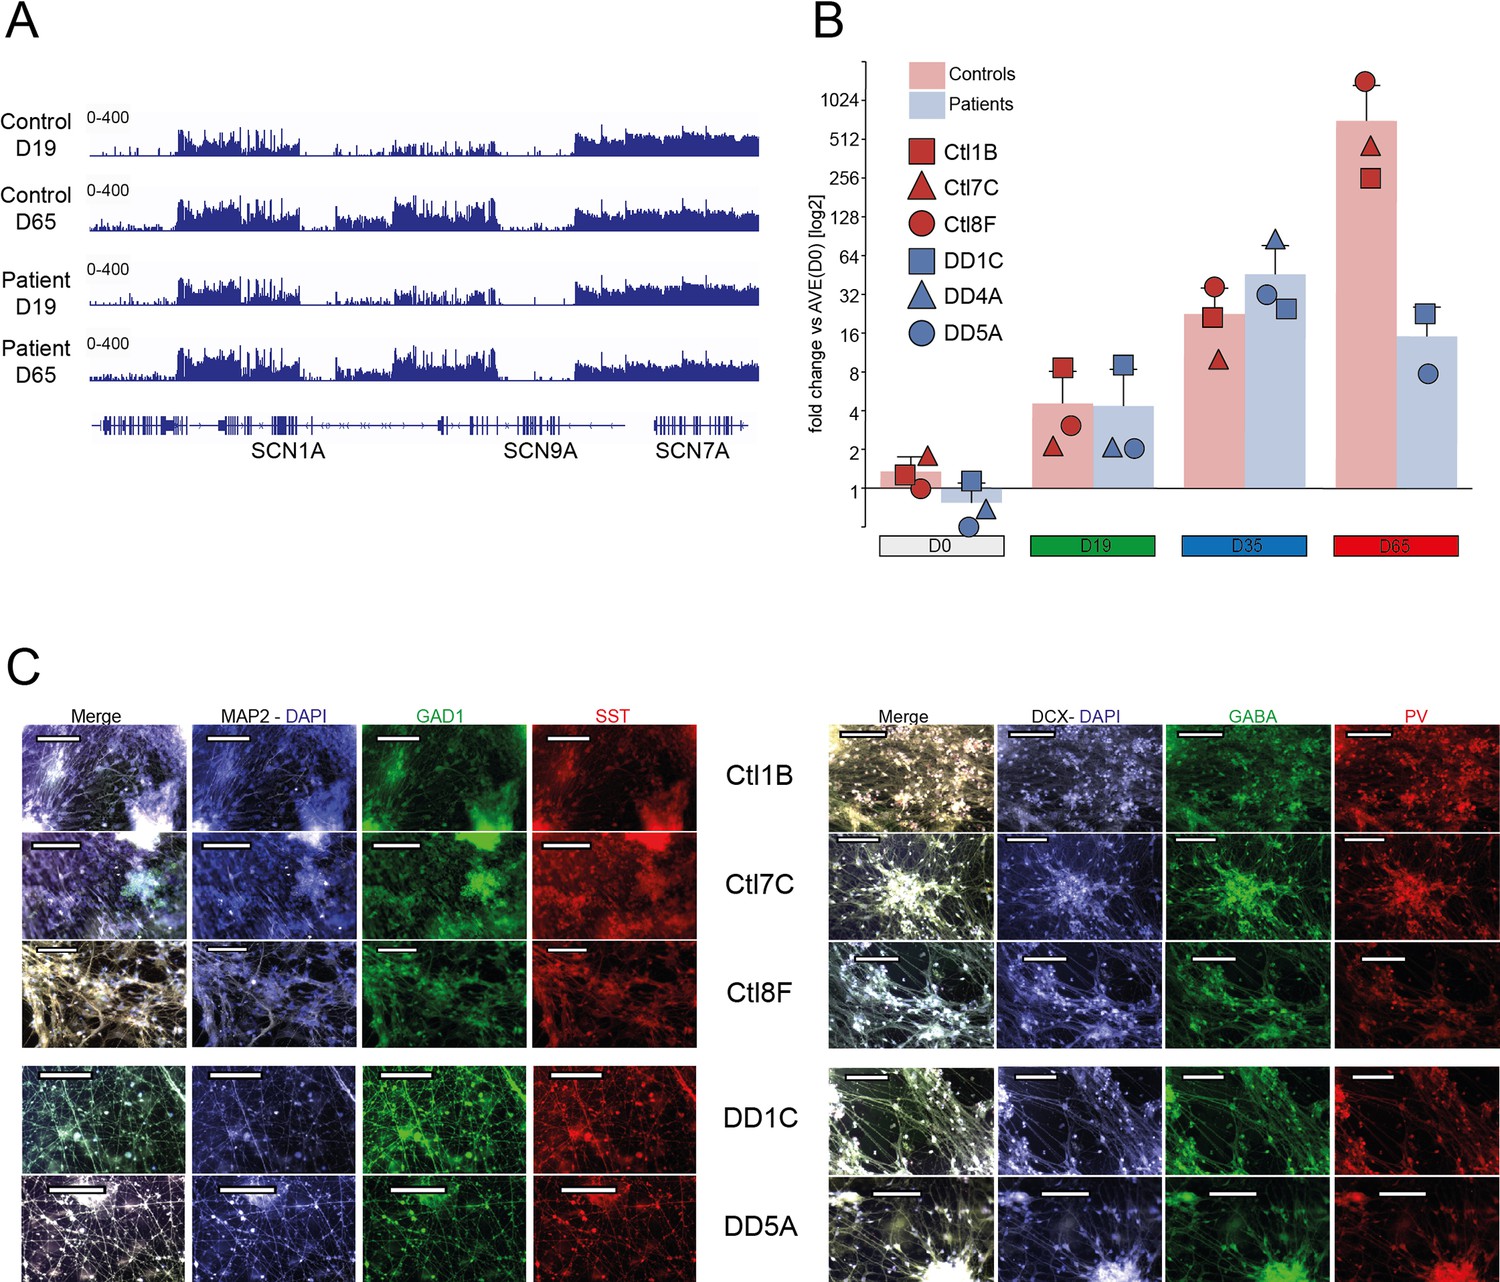
validation of GABAergic differentiation.
(A) SCN1A gene expression at day 19 and day 65 from RNAseq. (B) SCN1A expression levels quantified by qRT-PCR following GABAergic differentiation of control and patient induced pluripotent stem cells (iPSC) relative to expression of the housekeeping genes ACTB and GAPDH at D0, D19, D35 and D65. Fold change data are presented as log2 [mean ΔΔCT(day Y)] ± SD and individual data points for each cell line are indicated (Control lines in red: Ctl1B - square, Ctl7C - triangle, Ctl8F – circle; patient lines in blue: DD1C - square, DD4A - triangle, DD5A – circle; please see Methods for detail). Ctl1B, Ctl7C, Ctl8F, DD1C, DD4A, DD5A are names of cell lines. Three technical replicates were perfromed for each qRT-PCR.(C) Representative pictures of immunofluorescent staining of Ctl-iPSC and DS-iPSC derived GABAergic neurons at D65 (Ctl-GABA) of GABAergic interneuron differentiation. The GABA cells form networks and stain positive for the neuronal markers MAP2 and double cortin (DCX), the GABAergic marker γ-aminobutyric acid (GABA) and the interneuronal markers somatostatin (SST), parvalbumin (PV) and glutamate decarboxylase 1 (GAD1). Size bar 100 μm.
Figure 1—figure supplement 2
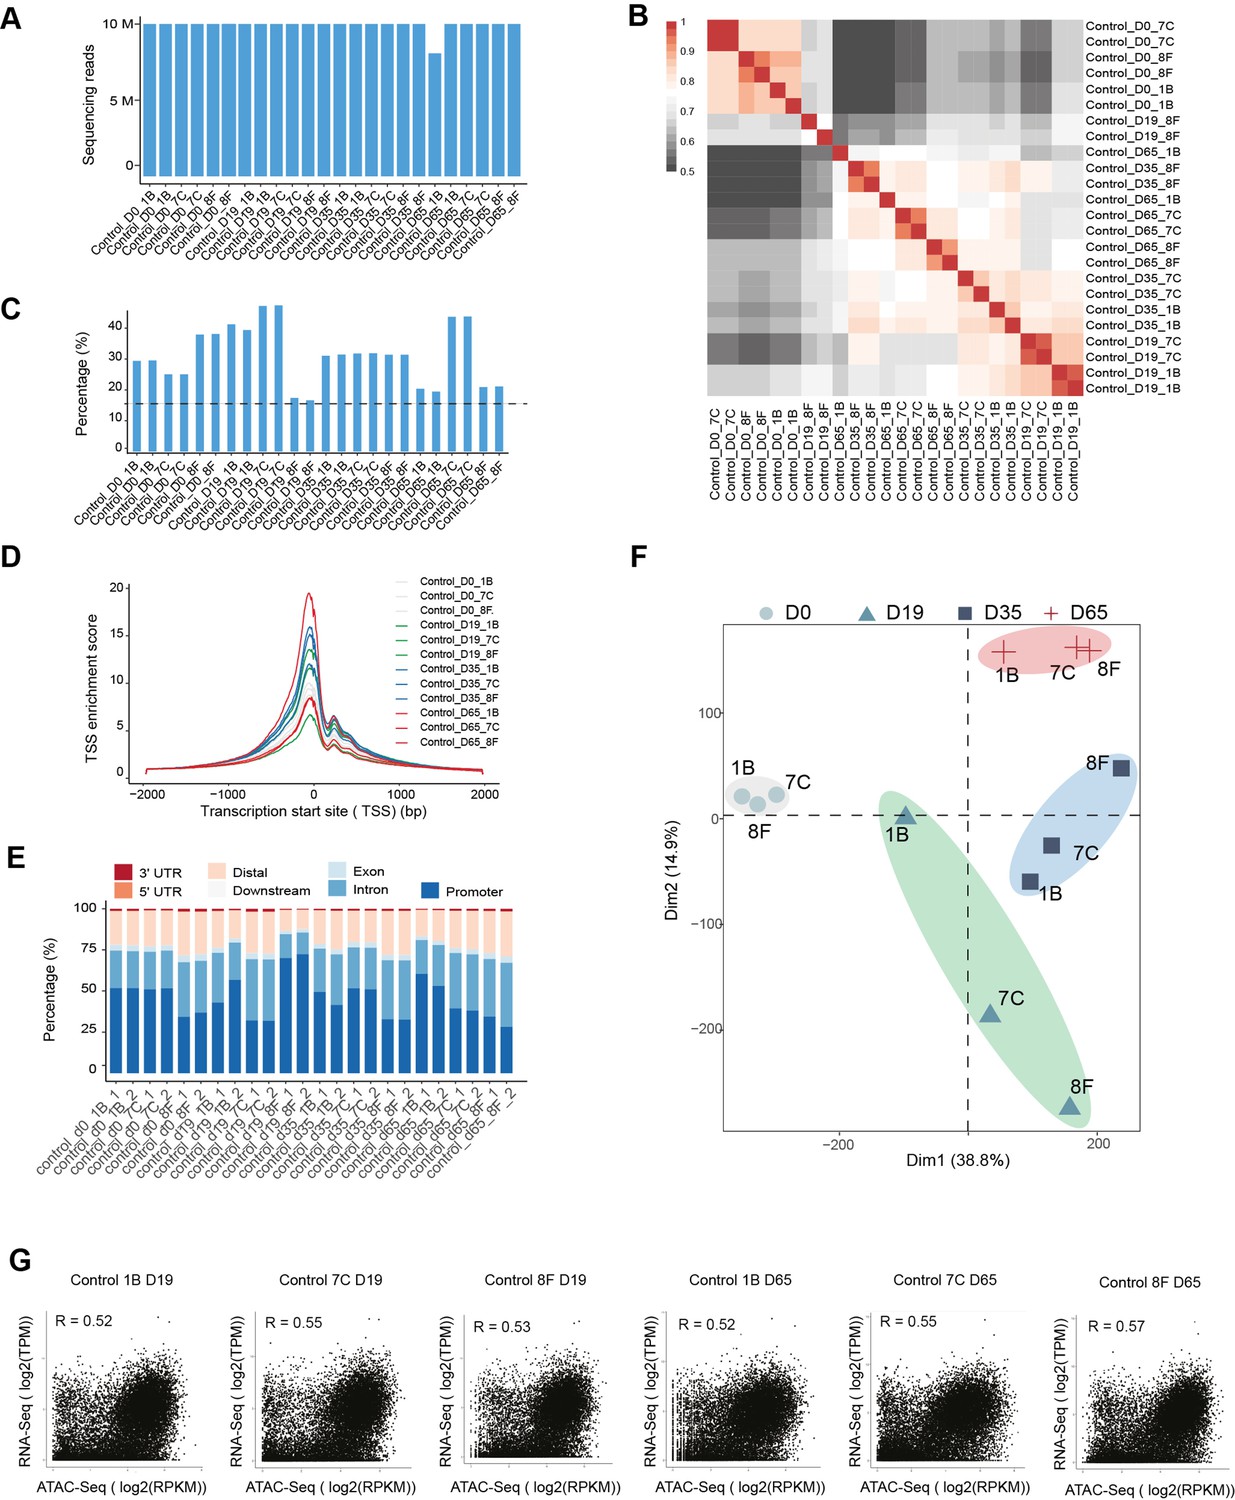
Quality control of assay of transposase accessible chromatin sequencing (ATAC-Seq) samples during GABAergic interneuron differentiation of Ctl-iPSC.
(A) Sequencing depth for each sample. (B) Pearson correlation matrix from technical duplicates of ATAC-Seq at different time points. (C) Quantification of fraction of reads in peaks (FRiP) of ATAC-Seq in each condition. The dotted line indicates the cutoff used. (D) Transcription start site (TSS) enrichment score of ATAC-Seq in each sample. (E) Genomic distribution of chromatin accessible peaks for each sample. (F) Principal component analysis of ATAC-Seq from each sample. (G) Pearson correlation of gene expression from RNA-Seq and chromatin accessibility from ATAC-Seq.
Figure 1—figure supplement 3
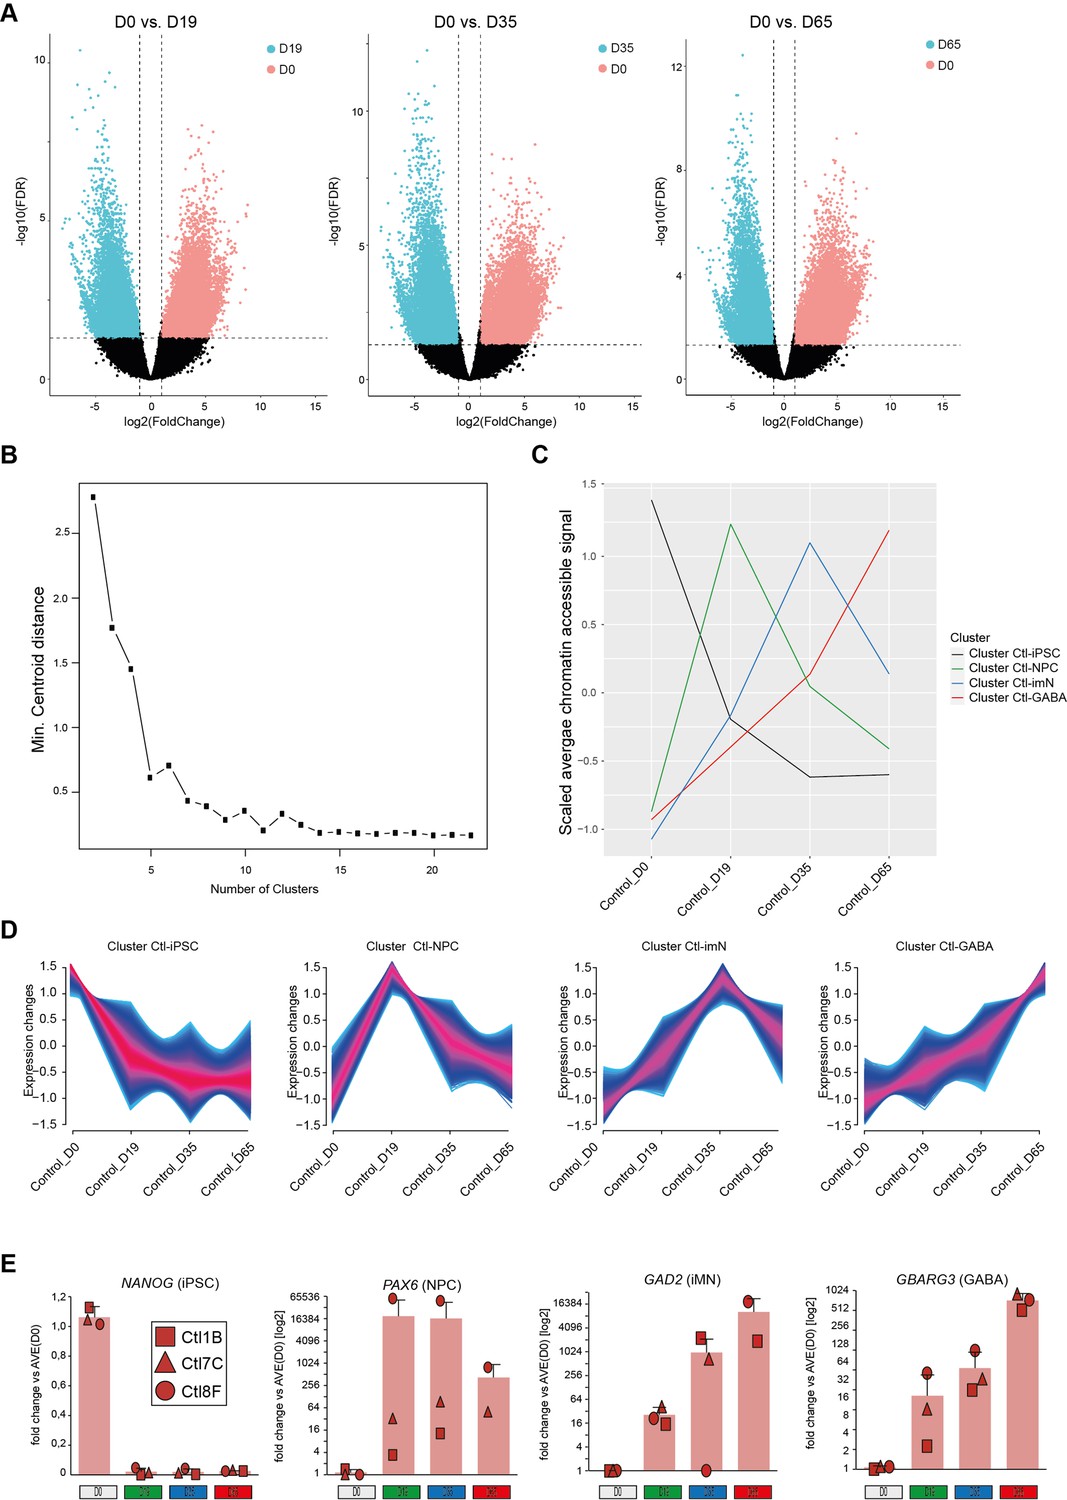
Chromatin accessibility cluster identification during GABAergic interneuron differentiation of Ctl-iPSC.
(A) Volcano plots show differential accessible chromatin peaks between D0 and different time points. D0 (n=6046) vs. D19 (n=3866); D0 (n=8880) vs. D35 (n=7865); D0 (n=7870) vs. D65 (n=7776). The dotted lines indicate the cutoff used to identify differential assay of transposase accessible chromatin sequencing (ATAC-Seq) peaks. (B) Variance with different numbers of clusters derived from chromatin accessibility during GABAergic interneuron differentiation. (C) The scaled average chromatin accessibility during GABAergic interneuron differentiation from each cluster. (D) The tendency of chromatin accessibility during GABAergic interneuron differentiation from each cluster. (E) Expression of the four cluster markers NANOG (iPSC; D0), PAX6 (PNC; D19), GAD2 (imN; D35), and BABRG3 (GABA; D65) quantified by qRT-PCR following GABAergic differentiation of control iPSC relative to expression of the housekeeping genes ACTB and GAPDH. Fold change data are presented as log2 [mean ΔΔCT(day Y)] ± SD and individual data points for each cell line are indicated (Control lines in red: Ctl1B - square, Ctl7C - triangle, Ctl8F – circle please see Methods for detail). Three technical replicates were perfromed for each qRT-PCR.
Figure 2 with 2 supplements
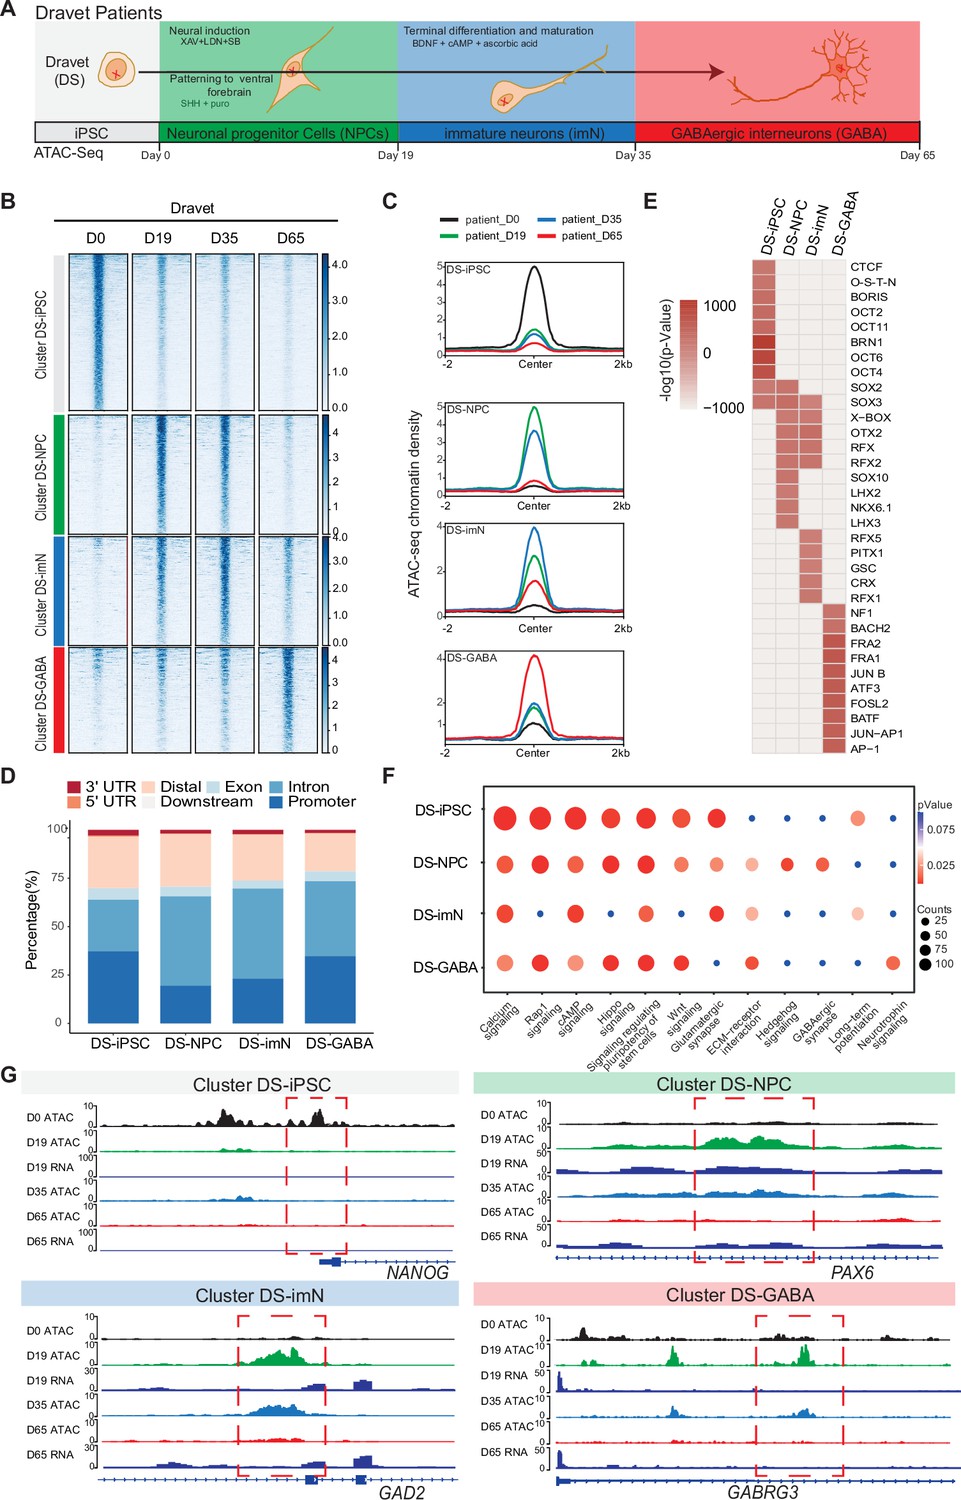
Chromatin accessibility dynamics during GABAergic differentiation of Dravet Syndrome patient induced pluripotent stem cells (iPSCs).
(A) Schematic Illustration of the design for GABAergic differentiation in Dravet syndrome patients. Cells from iPSC differentiation were collected for assay of transposase accessible chromatin sequencing (ATAC-Seq). GABAergic differentiation in Dravet Syndrome patients was grouped into four stages: iPSC (Day 0), NPCs (Day 19), imN (Day 35), GABA (Day 65). (B) Heatmap of four clusters identified by time series analysis using temporal changes in chromatin accessibility compared D0 (Day 0) and other points. The signal strengths were denoted by color intensities (C) Line plots showing chromatin accessibility at cluster-specific regions from each time point. (D) Barplot for genomic distribution of differential chromatin accessible regions for each cluster. (E) Heatmap for top 10 transcription factors (TFs) enrichment in each cluster. The significance was denoted by color intensities. O-S-E-N=OCT4-SOX2-TCF-NANOG. (F) Bubble plot of Kyoto Encyclopedia of Genes and Genomes (KEGG) pathway enrichment for each cluster. p-value and enrichment were indicated. The corresponding comprehensive list of enrichment terms can be found in Supplementary file 4. (G) Genome browser view showing representative differential chromatin accessible regions at the indicated gene loci. Additionally, RNA-seq data (Schuster et al., 2019b) is visualized at D19 and D65.
Figure 2—figure supplement 1
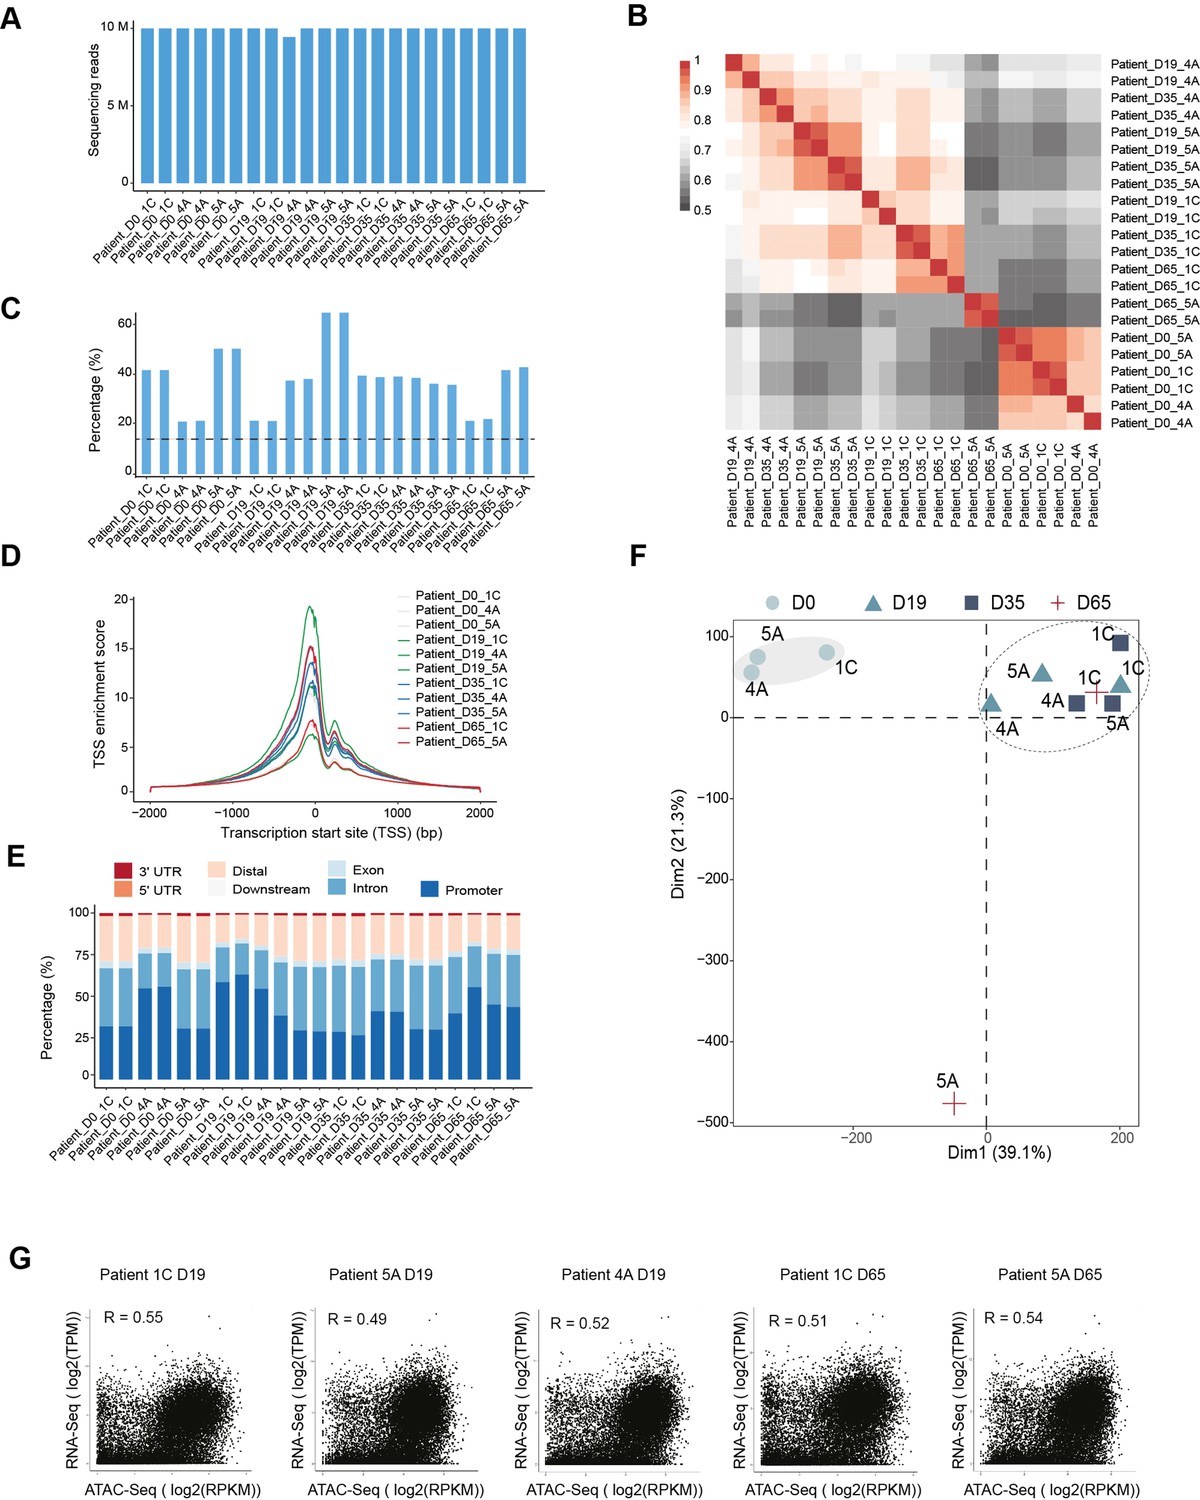
Quality control of assay of transposase accessible chromatin sequencing (ATAC-Seq) samples during GABAergic interneuron differentiation in Dravet Syndrome patient induced pluripotent stem cells (iPSCs).
(A) Sequencing depth comparison from each sample. (B) Pearson correlation matrix from technical duplicates of ATAC-Seq from all samples. (C) Quantification of fraction of reads in peaks (FRiP) of ATAC-Seq in each condition. The dotted line indicates the cutoff was used. (D) Transcription start site (TSS) enrichment score of ATAC-Seq in each sample. (E) Genomic distribution of chromatin accessible regions for each sample. (F) Principal component analysis of ATAC-Seq from each sample. (G) Pearson correlation of gene expression from RNA-Seq and chromatin accessibility from ATAC-Seq.
Figure 2—figure supplement 2
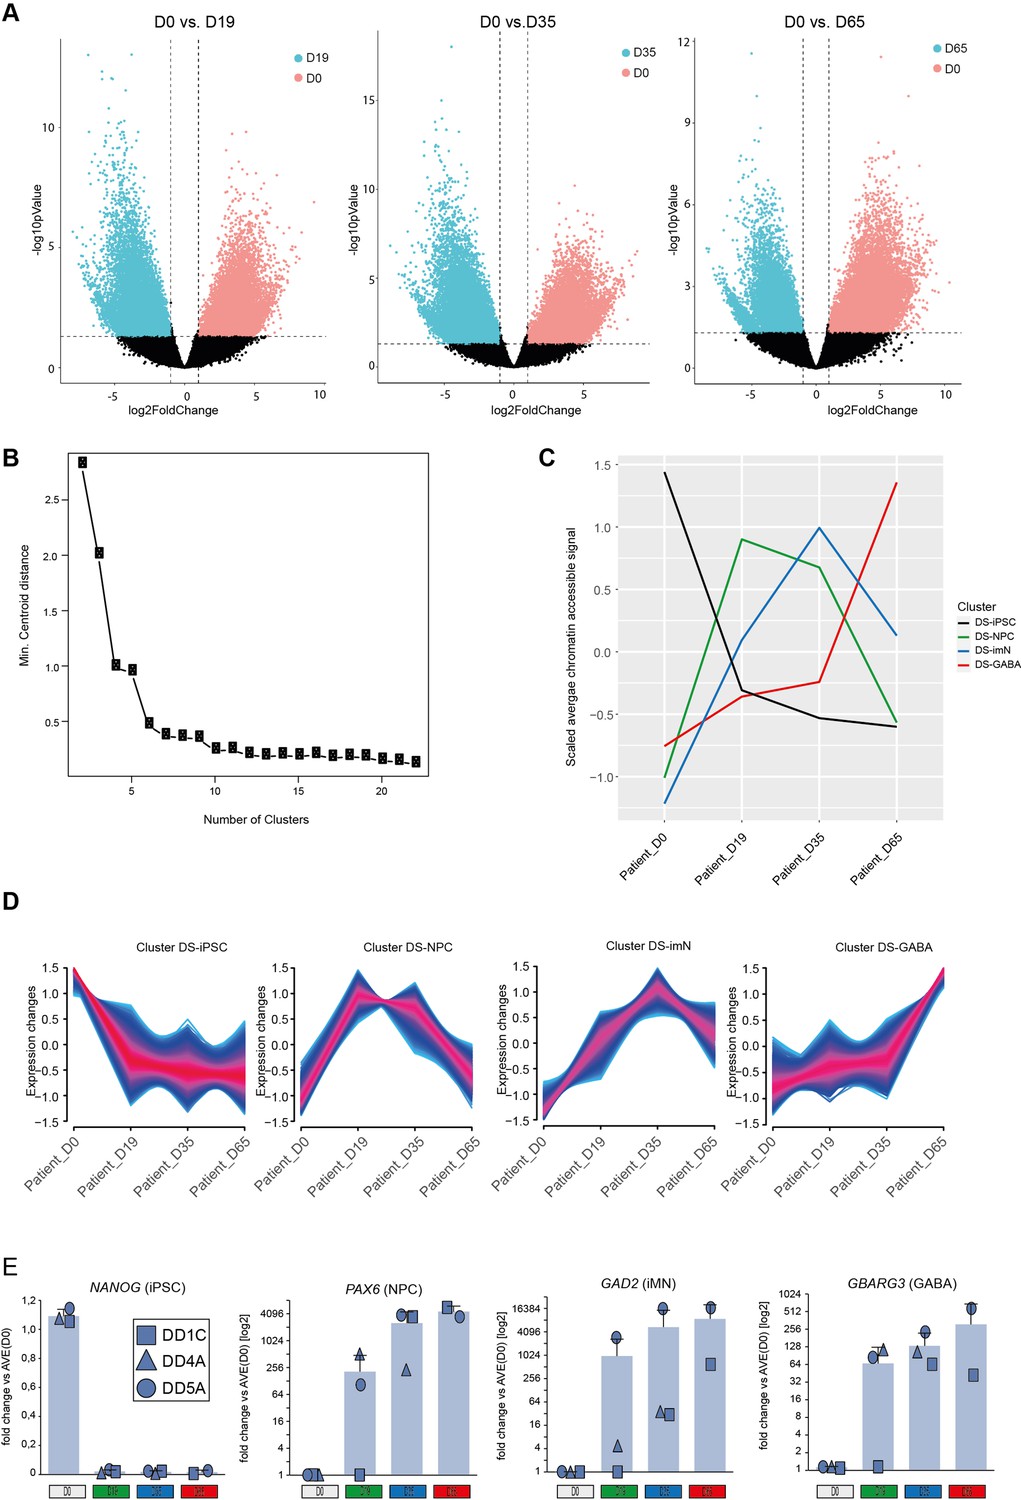
Chromatin accessibility cluster identification during GABAergic interneuron differentiation in Dravet Syndrome patient induced pluripotent stem cells (iPSCs).
(A) Volcano plots show differential accessible chromatin peaks between D0 and different time points. D0 (n=7798) vs. D19 (n=5183); D0 (n=10154) vs. D35 (n=7239); D0 (n=6909) vs. D65 (n=5667). The dotted lines indicate the cutoff used to identify differential assay of transposase accessible chromatin sequencing (ATAC-Seq) peaks. (B) Variance with different numbers of clusters derived from chromatin accessibility during GABAergic interneuron differentiation in Dravet Syndrome patients. (C) The scaled average chromatin accessibility during GABAergic interneuron differentiation from each cluster in Dravet Syndrome patients. (D) The tendency of chromatin accessibility during GABAergic interneuron differentiation from each cluster in Dravet Syndrome patients. (E) Expression of the four cluster markers NANOG (iPSC; D0), PAX6 (PNC; D19), GAD2 (imN; D35), and BABRG3 (GABA; D65) quantified by qRT-PCR following GABAergic differentiation of control iPSC relative to expression of the housekeeping genes ACTB and GAPDH. Fold change data are presented as log2 [mean ΔΔCT(day Y)] ± SD and individual data points for each cell line are indicated (Dravet syndrome, DS lines in blue: DD1C - square, DD4A - triangle, DD5A – circle please; see Methods for detail). Three technical replicates were perfromed for each qRT-PCR.
Figure 3 with 1 supplement
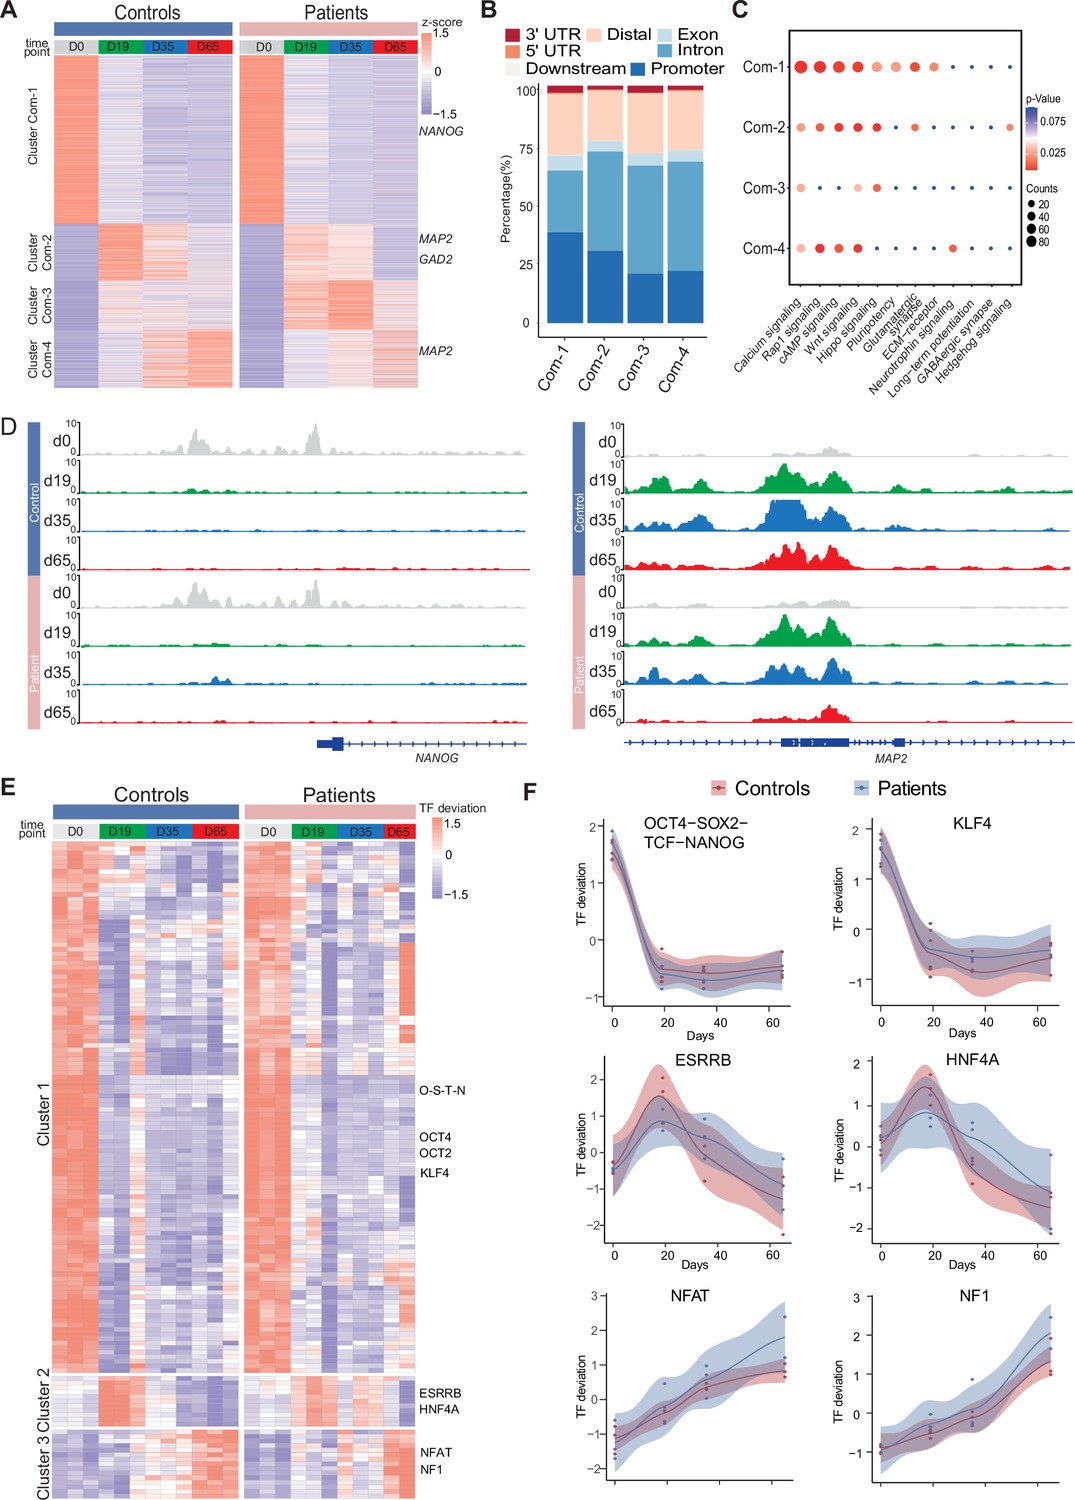
Common chromatin accessibility features of control and Dravet Syndrome patient induced pluripotent stem cells (iPSCs) during GABAergic differentiation.
(A) Heatmap for common chromatin accessible regions detected between control and Dravet Syndrome (DS) group during differentiation. Four clusters were obtained from time series analysis. Representative genes are labeled on the right side of heatmap. (B) Barplot for genomic distribution of chromatin accessible regions for each cluster. (C) Bubble plot of KEGG pathway enrichment for each cluster. p-value and enrichment were indicated. (D) Genome browser view showing representative chromatin accessible regions at the indicated gene loci. These genes represent common changing regions between control and patients groups. (E) Transcription factors (TFs) deviation Z scores heatmap for unique TF enriched in each cluster. Representative TFs are labeled on the right side of heatmap. (F) Representative TFs enrichment (deviation Z score) dynamics at ATAC-Seq peaks in control and Dravet Syndrome (DS) group during differentiation.
Figure 3—figure supplement 1
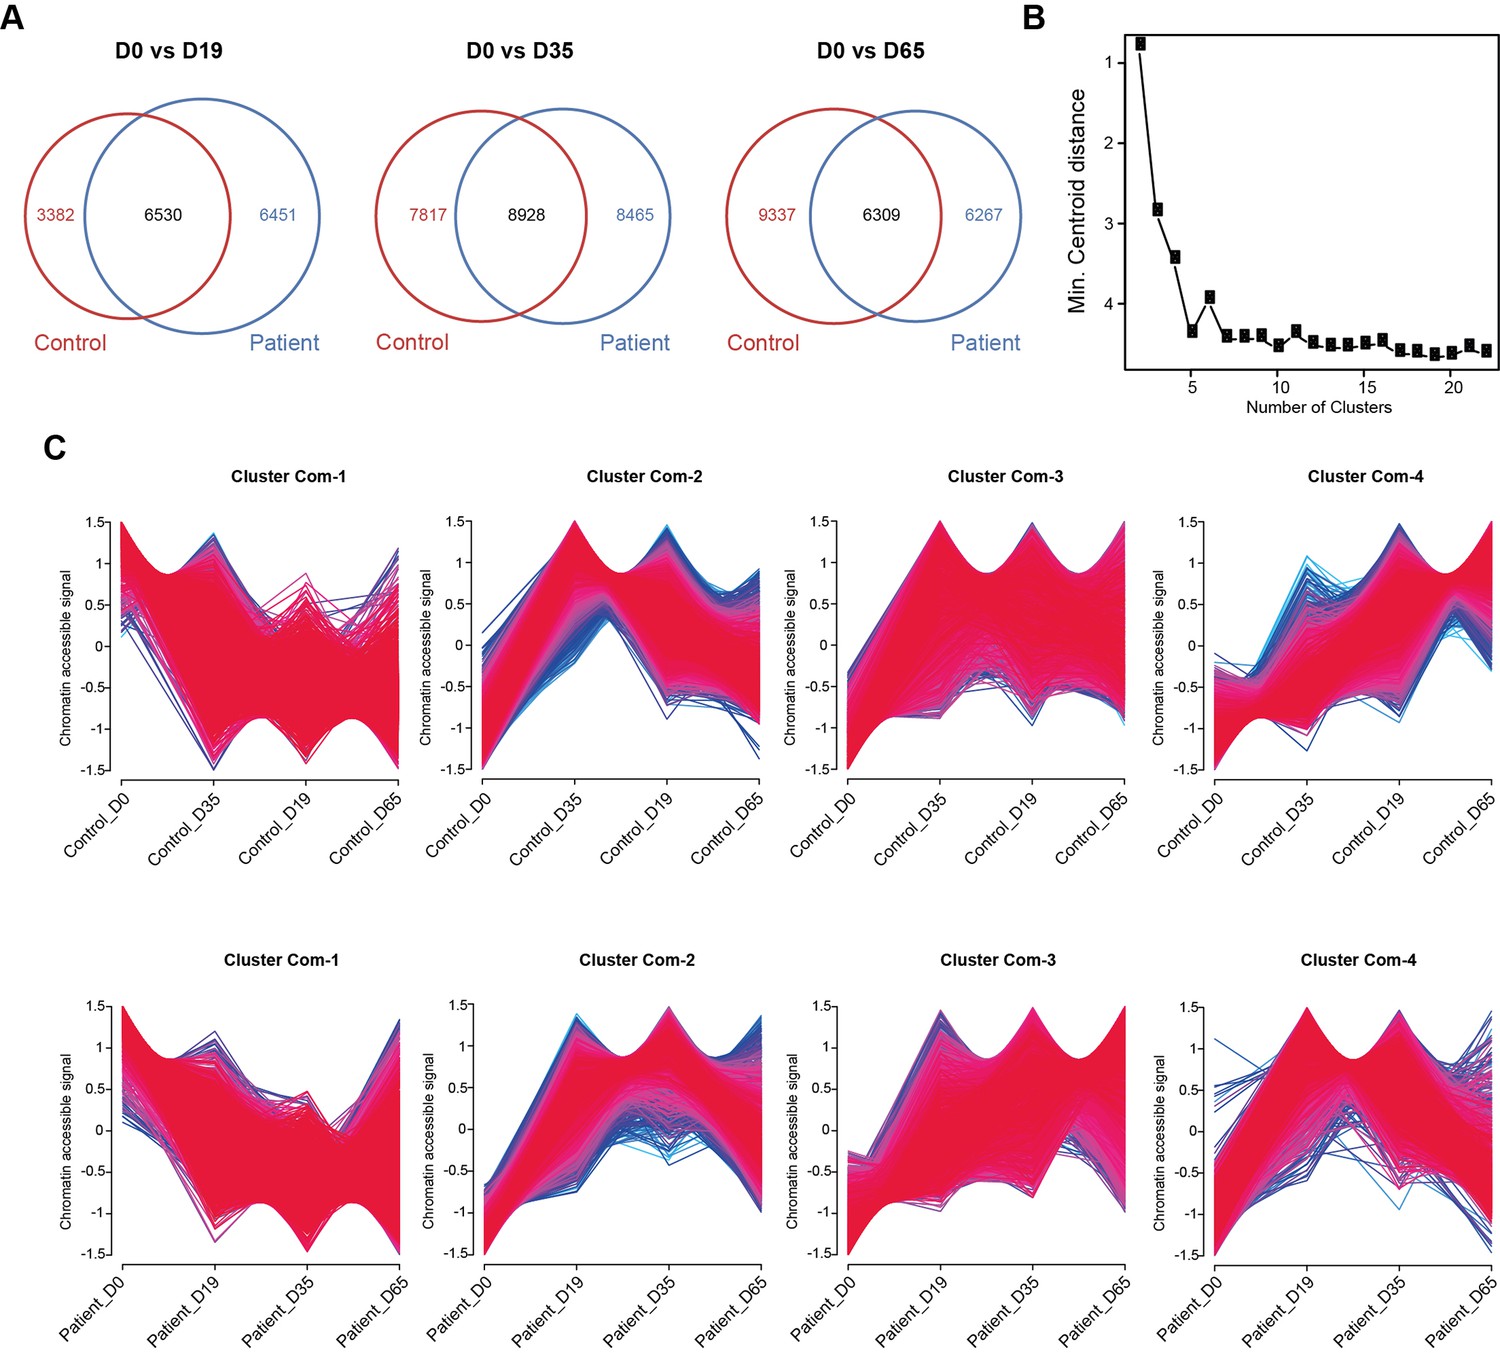
Identification of common chromatin accessibility between control and Dravet Syndrome patient induced pluripotent stem cells (iPSCs) during GABAergic interneuron differentiation.
(A) Venn diagrams showing the shared and distinct accessible chromatin peaks between control and patient samples. (B) Variance with different numbers of clusters derived from common accessible chromatin regions between control and Dravet Syndrome patients. (C) The tendency of chromatin accessibility from common accessible chromatin regions between control and Dravet Syndrome patients during GABAergic interneuron differentiation.
Figure 4 with 1 supplement
Unique chromatin accessibility features of control and Dravet Syndrome patient induced pluripotent stem cells (iPSCs) during GABAergic differentiation.
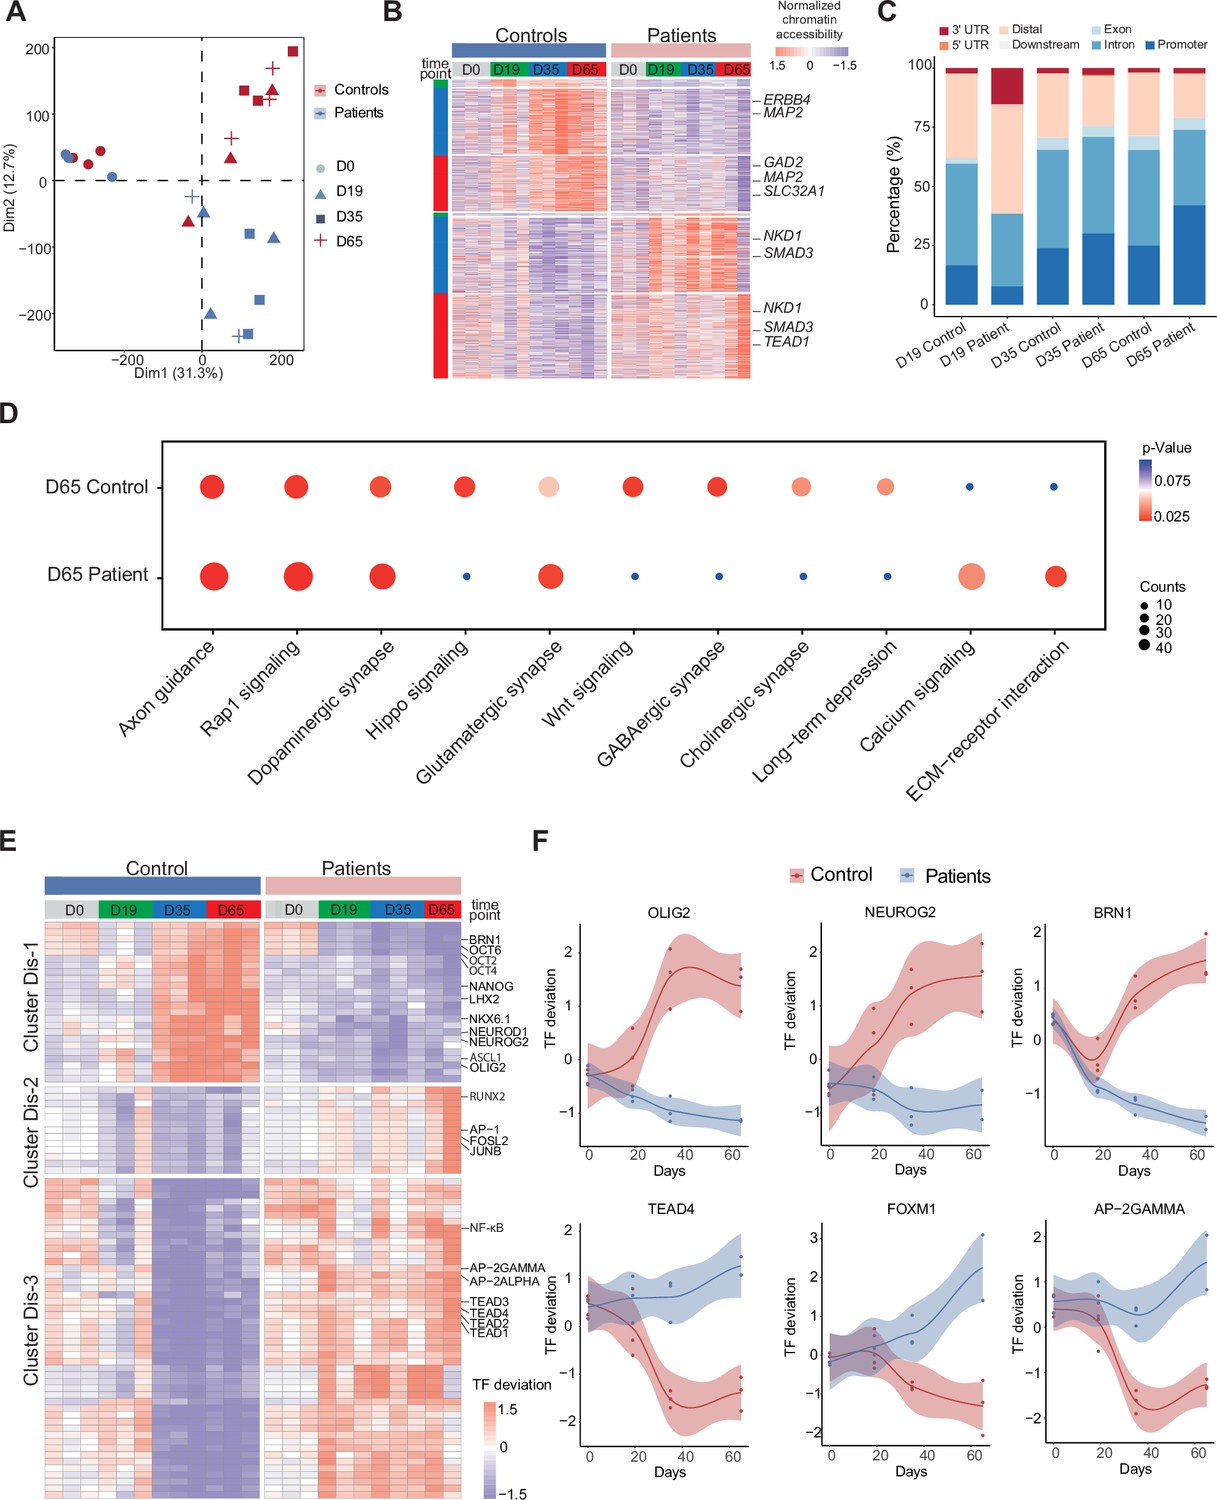
(A) Principal component analysis (PCA) plot of all assay of transposase accessible chromatin sequencing (ATAC-Seq) from control and Dravet Syndrome patients during GABAergic differentiation. (B) Heatmap showing the differential chromatin accessible peaks for comparison at each time point between the control and Dravet Syndrome (DS) patients. Representative genes are labeled on the right side of heatmap. (C) Barplot for genomic features of unique chromatin accessible regions at each time point for the control and DS patients. (D) Bubble plot of Kyoto Encyclopedia of Genes and Genomes (KEGG) pathway enrichment at GABAeric interneuron (Day 65) for the control and Dravet Syndrome (DS) patients. p-value and enrichment score were indicated. (E) Heatmap showing transcription factors (TFs) enrichment at differential chromatin accessible peaks for comparison at each time point between the control and DS patients. Representative TFs are labeled on the right side of heatmap. (F) Representative TFs enrichment (deviation Z score) dynamics at ATAC-Seq peaks in control and Dravet Syndrome (DS) group during differentiation.
Figure 4—figure supplement 1
Identification of unique accessible chromatin region between control and Dravet Syndrome patient induced pluripotent stem cells (iPSCs) during GABAergic interneuron differentiation.
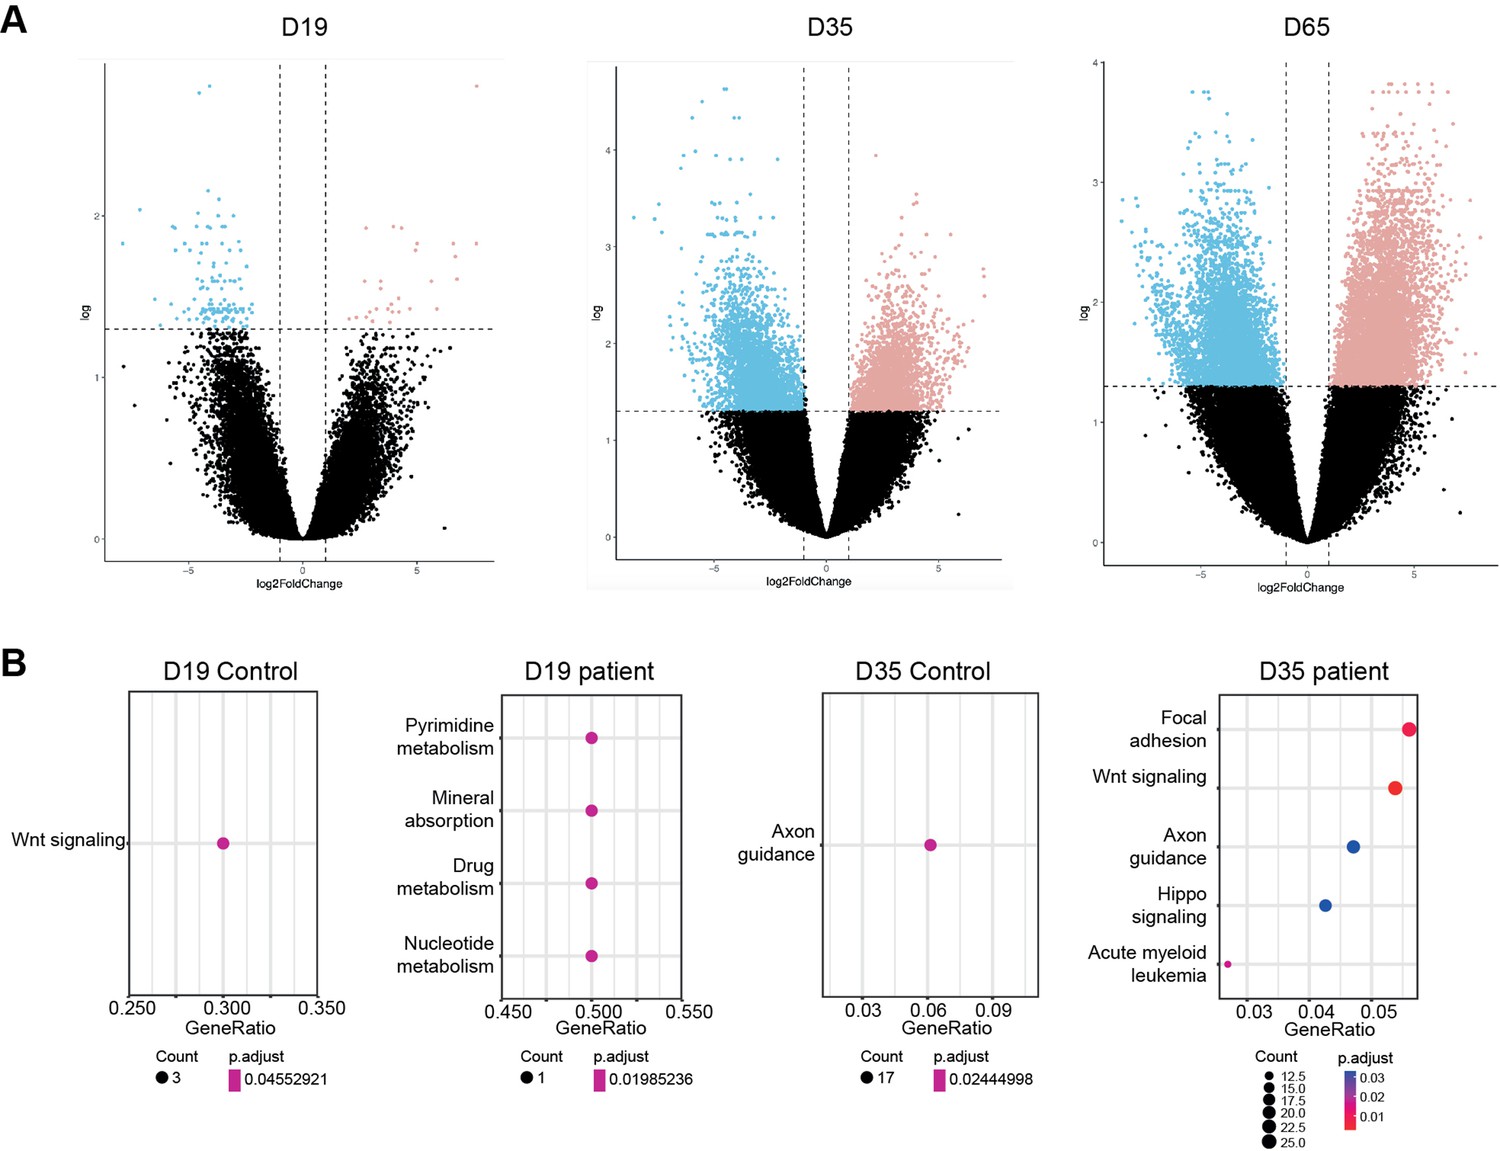
(A) Volcano plot of differential accessible chromatin peaks between control and Dravet Syndrome (DS) patients at different stage of differentiation (NPC (Day 19), imN (Day 35) and GABAergic interneuron (Day 65)). Dotted lines indicate cutoff from fold change and false discovery rate. (B) Kyoto Encyclopedia of Genes and Genomes (KEGG) signal pathway enrichments from unique accessible chromatin region in control and Dravet Syndrome patients at NPC (Day 19), imN (Day 35).
Figure 5 with 1 supplement
Chromatin accessibility response to Valproic acid treatment in GABAergic interneurons.
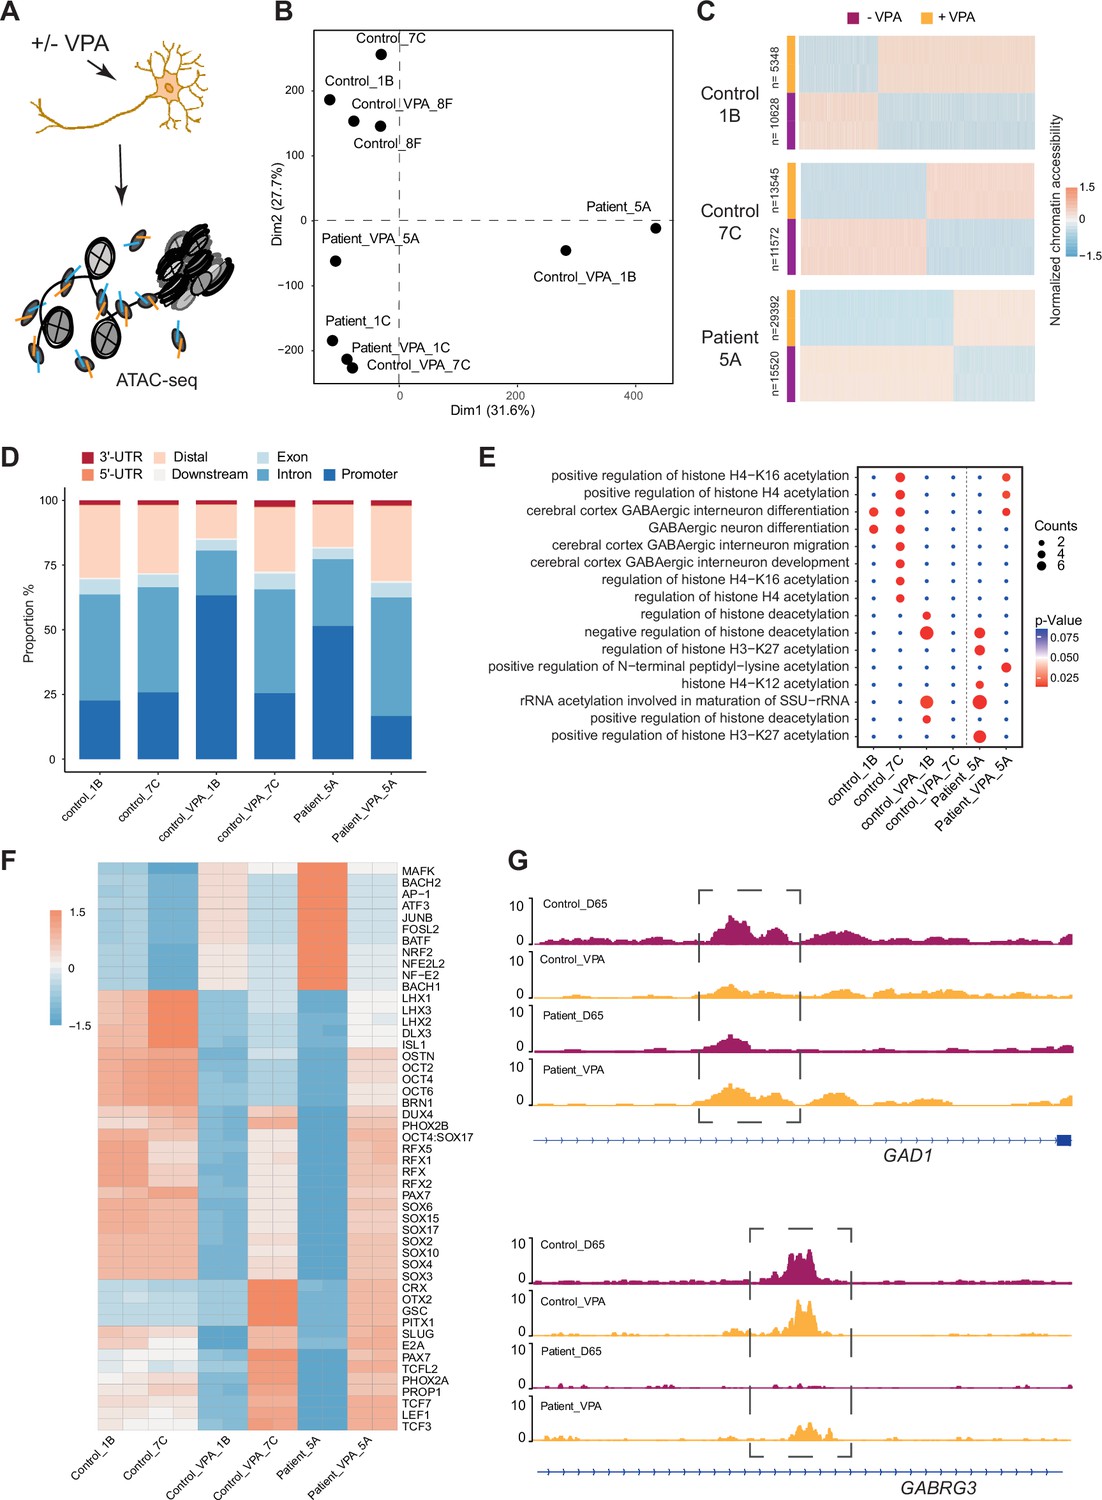
(A) Schematic illustration showing measurement of chromatin accessibility response in valproic acid (VPA) treatment of GABAergic interneurons. (B) Principal component analysis (PCA) plot of assay of transposase accessible chromatin sequencing (ATAC-Seq) with and without valproic acid (VPA) treatment of GABAergic interneuron in control and Dravet Syndrome patients. (C) Heatmap of differential chromatin accessible peaks from the VPA responsible group, consisting of two control samples and one Dravet Syndrome (DS) patient sample. (D) Barplot for genomic distribution of VPA responsible accessible regions from differential conditions. (E) Bubble plot of Kyoto Encyclopedia of Genes and Genomes (KEGG) pathway enrichment for each condition. p-value and enrichment were indicated. (F) TF deviation Z score heatmap for top 50 transcription factors (TFs) enriched at responsible chromatin regions from differential conditions. (G) Genome browser view showing representative VPA responsible chromatin accessible regions at the indicated gene loci.
Figure 5—figure supplement 1
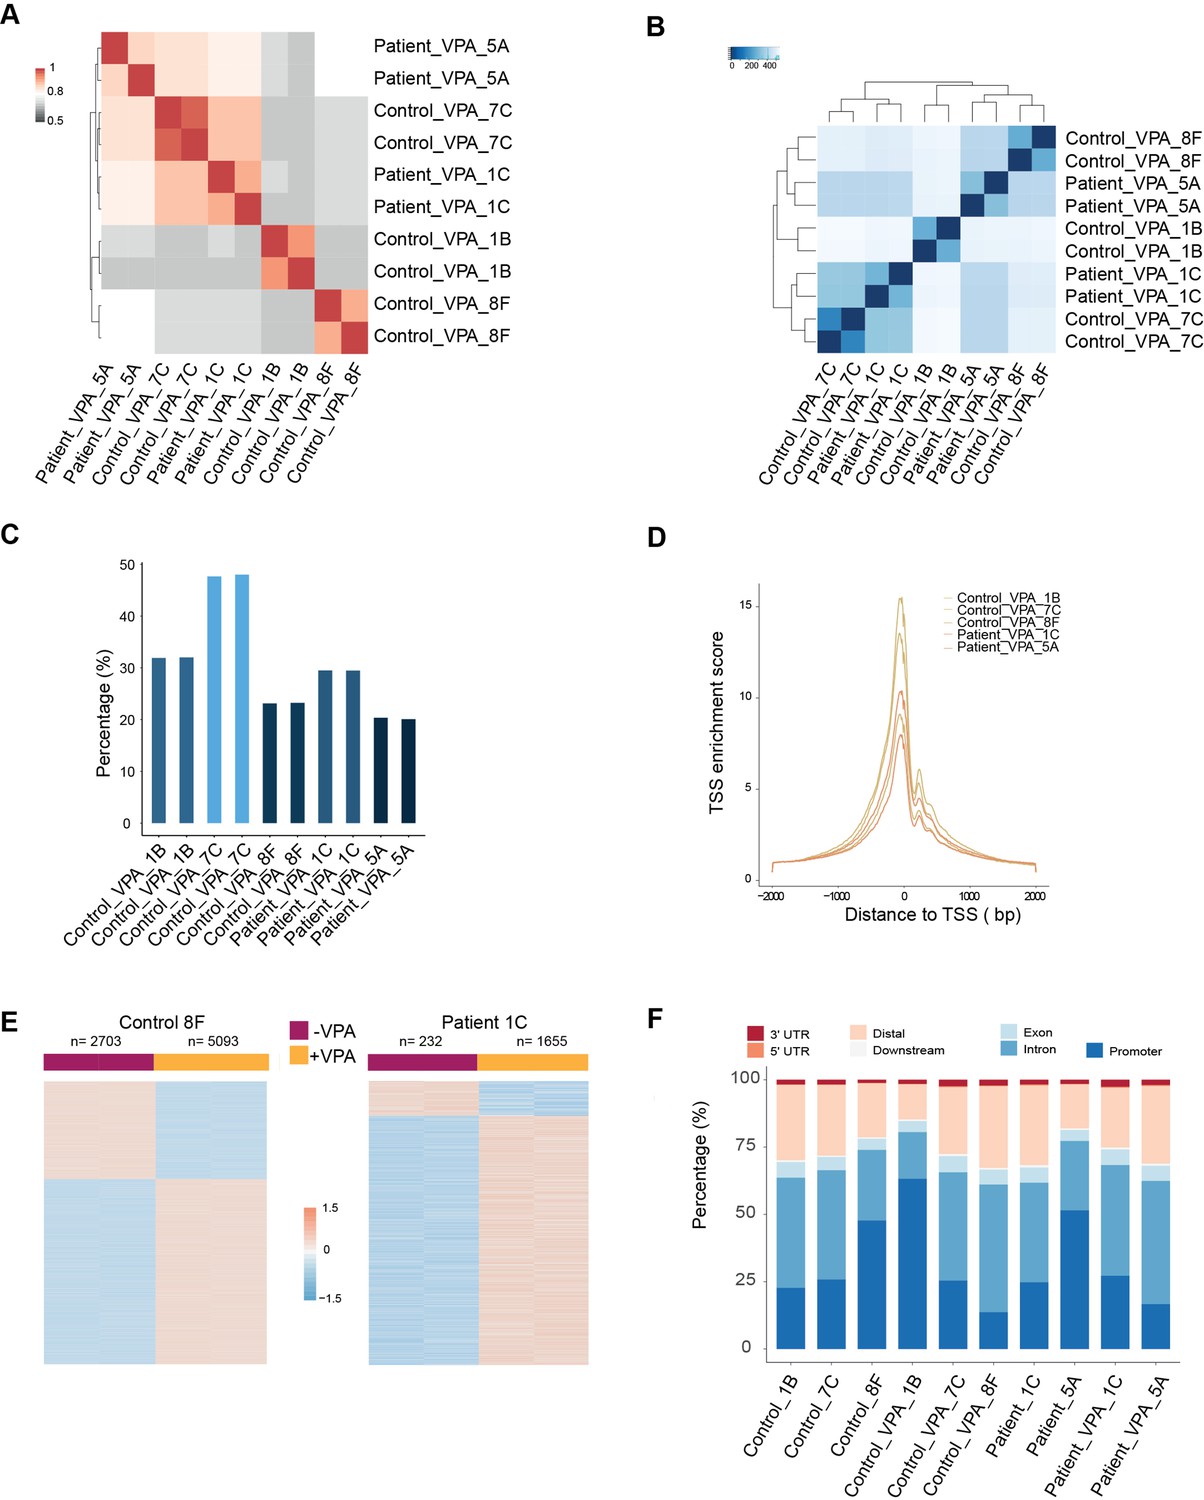
Valproic acid treatment reshapes chromatin accessibility of GABAergic interneurons.
(A) Pearson correlation matrix from technical duplicates of assay of transposase accessible chromatin sequencing (ATAC-Seq) of valproic acid (VPA) treated control and Dravet Syndrome patient group. (B) Distance matrix of ATAC-Seq from VPA treated control and Dravet Syndrome patient group. (C) Quantification of fraction of reads in peaks (FRiP) of ATAC-Seq in each condition. (D) Transcription start site (TSS) enrichment score of ATAC-Seq in each sample. (E) Heatmap of differential chromatin accessible regions from VPA non-responsible group, consisting of one control sample and one Dravet Syndrome (DS) patient sample. (F) Genomic distribution of chromatin accessible regions for each individual sample.
Additional files
-
Supplementary file 1
Identified differential assay of transposase accessible chromatin sequencing (ATAC-Seq) peaks during GABAergic interneuron differentiation of Ctl-iPSC.
Source data for Figure 1 and Figure 1—figure supplements 1–3.
- https://cdn.elifesciences.org/articles/92599/elife-92599-supp1-v1.xlsx
-
Supplementary file 2
Kyoto Encyclopedia of Genes and Genomes (KEGG) enrichment for each cluster during GABAergic interneuron differentiation of Ctl-iPSC.
Source data for Figure 1F.
- https://cdn.elifesciences.org/articles/92599/elife-92599-supp2-v1.xlsx
-
Supplementary file 3
Identified differential assay of transposase accessible chromatin sequencing (ATAC-Seq) peaks during during GABAergic interneuron differentiation in Dravet Syndrome patient induced pluripotent stem cells (iPSCs).
Source data for Figure 2 and Figure 2—figure supplements 1–2.
- https://cdn.elifesciences.org/articles/92599/elife-92599-supp3-v1.xlsx
-
Supplementary file 4
Kyoto Encyclopedia of Genes and Genomes (KEGG) enrichment for each cluster during GABAergic interneuron differentiation in Dravet Syndrome patient induced pluripotent stem cells (iPSCs).
Source data for Figure 2F.
- https://cdn.elifesciences.org/articles/92599/elife-92599-supp4-v1.xlsx
-
Supplementary file 5
Identified common assay of transposase accessible chromatin sequencing (ATAC-Seq) peaks during GABAergic interneuron differentiation between control and Dravet Syndrome patient induced pluripotent stem cells (iPSCs).
Source data for Figure 3 and Figure 3—figure supplement 1.
- https://cdn.elifesciences.org/articles/92599/elife-92599-supp5-v1.xlsx
-
Supplementary file 6
Identified distinct assay of transposase accessible chromatin sequencing (ATAC-Seq) peaks during GABAergic interneuron differentiation from control and Dravet Syndrome patient induced pluripotent stem cells (iPSCs).
Source data for Figure 4 and Figure 4—figure supplement 1
- https://cdn.elifesciences.org/articles/92599/elife-92599-supp6-v1.xlsx
-
Supplementary file 7
Identified differential assay of transposase accessible chromatin sequencing (ATAC-Seq) peaks between with and without valproic acid (VPA) treatment.
Source data for Figure 5 and Figure 5—figure supplement 1
- https://cdn.elifesciences.org/articles/92599/elife-92599-supp7-v1.xlsx
-
MDAR checklist
- https://cdn.elifesciences.org/articles/92599/elife-92599-mdarchecklist1-v1.docx
Download links
A two-part list of links to download the article, or parts of the article, in various formats.
Downloads (link to download the article as PDF)
Open citations (links to open the citations from this article in various online reference manager services)
Cite this article (links to download the citations from this article in formats compatible with various reference manager tools)
Epigenetic insights into GABAergic development in Dravet Syndrome iPSC and therapeutic implications
eLife 12:RP92599.
https://doi.org/10.7554/eLife.92599.3


