Progesterone induces meiosis through two obligate co-receptors with PLA2 activity
- Calcium Signaling Group, Research Department, Weill Cornell Medicine Qatar, Education City, Qatar Foundation, Qatar
- Department of Physiology and Biophysics, Weill Cornell Medicine, United States
- College of Health and Life Science, Hamad bin Khalifa University, Qatar
- Research Department, Weill Cornell Medicine Qatar, Education City, Qatar Foundation, Qatar
- Medical program, Weill Cornell Medicine Qatar, Education City, Qatar Foundation, Qatar
- Department of Pharmacology, Weill Cornell Medicine, United States
- Biological Sciences division, University of Chicago, United States
Figures
Figure 1 with 1 supplement
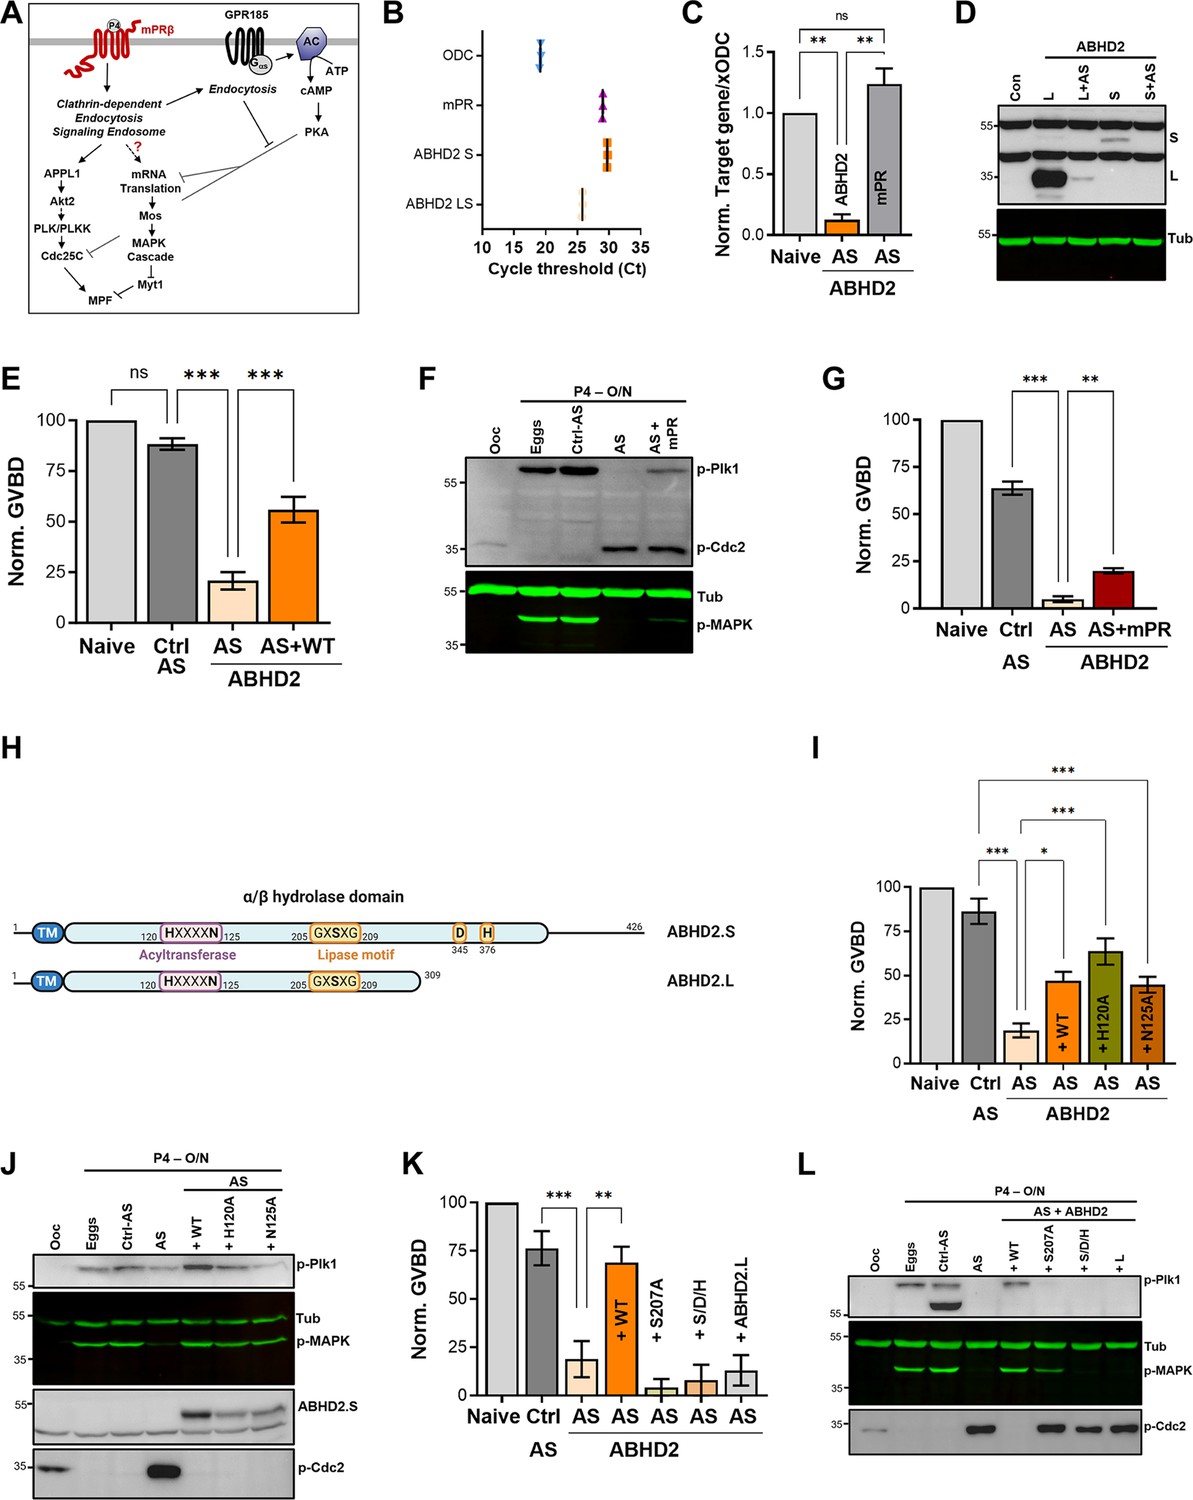
α/β hydrolase domain-containing protein 2 (ABHD2) is required for P4-induced oocyte maturation.
(A) Signaling events downstream of mPRβ after progesterone (P4), leading to oocyte maturation. The role of GPR185 is also depicted. (B) mRNAs transcripts levels of mPRβ, ABHD2.S, ABHD2.LS, and Xenopus Ornithine decarboxylase (xODC) in oocytes using the Cycle threshold (Ct) generated from real-time PCR. (C) ABHD2 knockdown experiments. Oocytes were injected with specific ABHD2 antisense (AS) oligonucleotides and incubated at 18 °C for 24 hr. RNAs were prepared and analyzed by RT-PCR to determine the efficacy of ABHD2 knockdown as compared to naïve oocytes and mPRβ RNAs levels. Data are expressed as relative RNAs levels of ABHD2 and mPRβ mRNA after normalizing to xODC as a house keeping gene. (D) Representative WB of ABHD2 in naive and oocytes over-expressing ABHD2.L or ABHD2.S, following ABHD2 antisense (AS) oligonucleotide injection. Tubulin is shown as a loading control. (E) Oocyte maturation following injection of control antisense (Ctrl AS) or ABHD2 antisense (AS) with or without overexpression of ABHD2.S (AS +WT) and normalized to P4-treated naïve oocytes condition (Naive), (mean ± SEM; n=7 independent female frogs, ordinary one-way ANOVA). (F) Representative WB of MAPK, Plk1, and Cdc2 phosphorylation from untreated oocytes, eggs matured by overnight (O/N) treatment with P4, oocytes injected with control antisense (Ctrl AS) or ABHD2 antisense (AS) with or without overexpression of mPRβ. Tubulin is shown as a loading control. (G) Oocyte maturation in oocytes injected with control antisense (Ctrl AS) or ABHD2 antisense (AS) with or without overexpression of mPRβ and normalized to P4-treated naïve oocytes (mean ± SEM; n=3 independent female frogs, ordinary one-way ANOVA). (H) Schematic representation of Xenopus ABHD2.S and.L domains, including the acyltransferase and lipase motifs. (I, K) Oocyte maturation in oocytes injected with control antisense (Ctrl AS) or ABHD2 antisense (AS) with or without overexpression of ABHD2.S wild type (AS +WT) and the different ABHD2.S mutants as indicated, and normalized to P4-treated naïve oocytes (mean ± SEM; n=3 independent female frogs, ordinary one-way ANOVA). (J,L) Representative WB of MAPK, Plk1, and Cdc2 phosphorylation from untreated oocytes, eggs matured by overnight (O/N) with P4, oocytes injected with control antisense (Ctrl AS) or ABHD2 antisense (AS) with or without overexpression of the different ABHD2.S mutants as indicated on the panel. Tubulin is shown as a loading control.
-
Figure 1—source data 1
Original files for western blot analysis displayed in Figure 1D,F,J,L.
- https://cdn.elifesciences.org/articles/92635/elife-92635-fig1-data1-v1.zip
-
Figure 1—source data 2
File containing labeled western blots for Figure 1D,F,J,L, indicating the relevant bands and treatments.
- https://cdn.elifesciences.org/articles/92635/elife-92635-fig1-data2-v1.zip
Figure 1—figure supplement 1
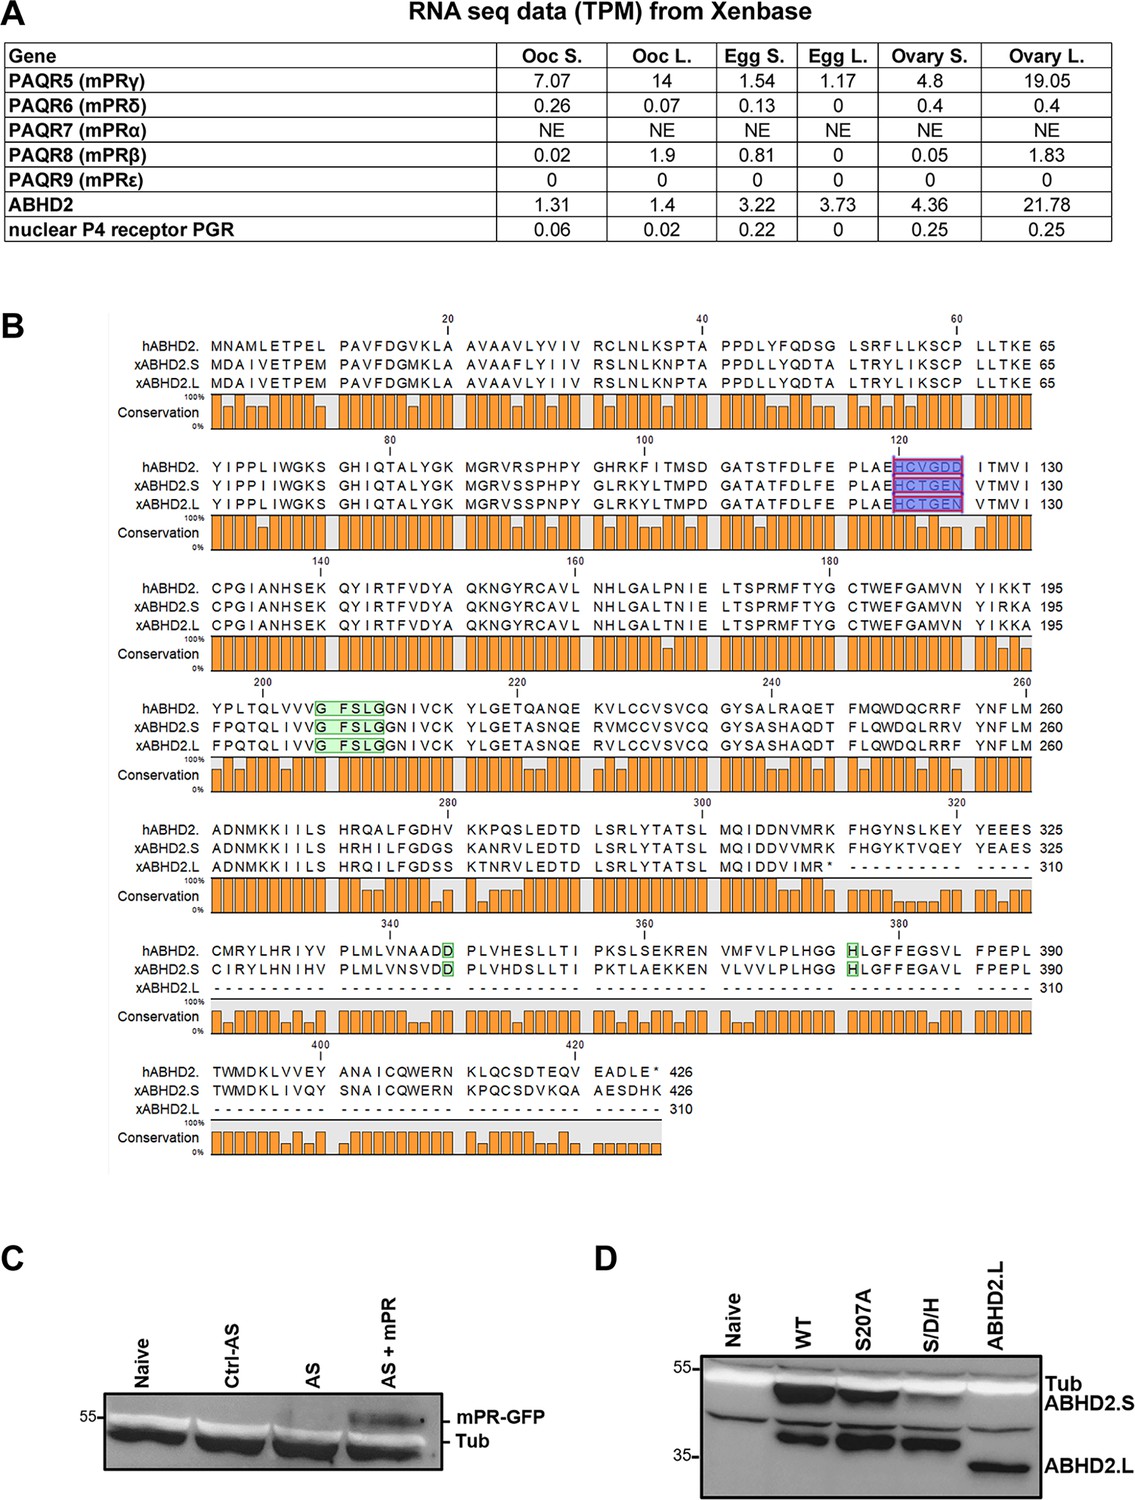
Progesterone receptors in Xenopus oocytes.
(A) Table representing the number of transcripts per million (TPM) of the different progesterone receptors in Xenopus laevis oocytes (Ooc. S., and Ooc.(L).), eggs (Egg S., and Egg L.), and the ovary. Being tetraploid, Xenopus laevis expresses two different versions of each gene; S and L. the data are retrieved from Xenbase. (B) Alignment of Xenopus laevis α/β hydrolase domain-containing protein 2 (ABHD2).L and ABHD2.S amino acids sequences with human ABHD2. Residues implicated in the lipase activity of ABHD2 are highlighted in green, whereas the acetyltransferase domain is highlighted in purple. (C) Representative western blot (WB) of mPR-GFP proteins expression in naïve, control antisense (Ctrl AS), ABHD2 antisense (AS), and AS +mPR GFP injected oocytes. Tubulin is shown as a loading control. (D) Representative WB of ABHD2.S protein expression levels in naïve oocytes and in oocytes injected with mRNA to overexpress ABHD2 wildtype (WT), ABHD2.S S207A, ABHD2.S S207A/D345A/H376A (S/D/H). Tubulin is shown as a loading control.
-
Figure 1—figure supplement 1—source data 1
Original files for western blot analysis are displayed in Figure 1C,D.
- https://cdn.elifesciences.org/articles/92635/elife-92635-fig1-figsupp1-data1-v1.zip
-
Figure 1—figure supplement 1—source data 2
File containing labeled western blots for Figure 1C,D, indicating the relevant bands and treatments.
- https://cdn.elifesciences.org/articles/92635/elife-92635-fig1-figsupp1-data2-v1.zip
Figure 2 with 1 supplement
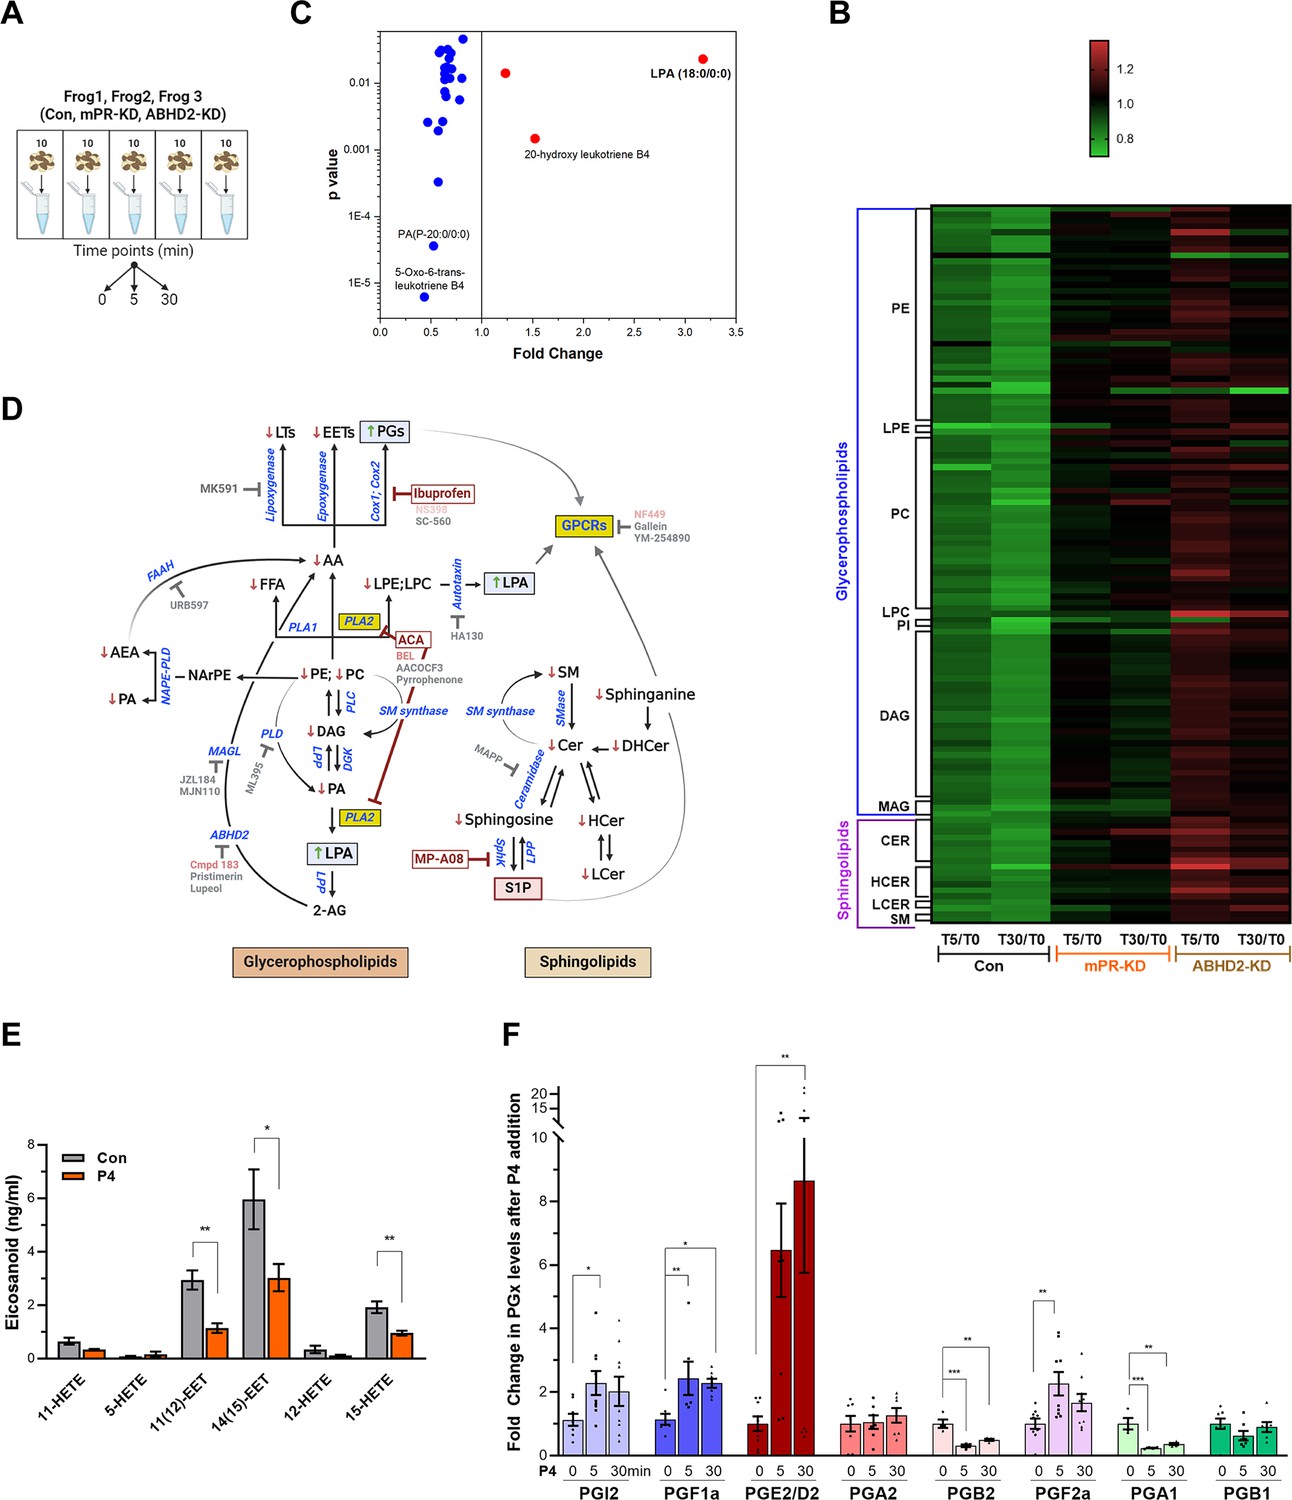
Metabolomics and lipidomics.
(A) Summary of the experimental setup. Naïve oocytes (Con) and oocytes injected with either mPR (mPR-KD) or α/β hydrolase domain-containing protein 2 (ABHD2) antisense (ABHD2-KD) were treated for 5 or 30 min with progesterone (P4). For each condition and time point, five replicates of 10 pooled oocytes each were collected. The experiment was repeated using three donor females. (B) Heatmap of fold changes for metabolites that were changed significantly (p<0.05) at either the 5 min (T5) or 30 min (T30) time points in response to P4 as compared to untreated oocytes (T5/T0 and T30/T0) for naive (Con), mPR-KD, and ABHD2-KD oocytes. Metabolites are clustered at the levels of glycerophospholipids and sphingolipids and then at the pathway level as follows: PE (Phosphatidylethanolamines), LPE (Lysophosphatidylethanolamines), PC (Phosphatidylcholines), LPC (Lysophosphatidylcholine), PI (Phosphatidylinositols), DAG (Diacylglycerols), MAG (Monoacylglycerols), CER (Ceramides), HCER (Hexosylceramides), LCER (Lactosylceramides), and SM (Sphingomyelins). Source data 3 Tables 1–6 show the means and p-value for each ratio fold change. (C) Distribution of metabolites that are reduced (blue) or increased (red) significantly in single naïve oocytes 30 min after P4. Fold change and p-values were calculated from 10 individual oocytes at each time point. The raw data is listed in Source data 3 Table 7. (D) Summary of the changes in sphingolipids and glycerophospholipids after progesterone treatment. Increase (upward green arrow) or decrease (downward red arrow) in metabolite levels is noted. Tested chemical inhibitors are also shown. Strong inhibitors are indicated in red, weak inhibitors in pink, and drugs that do not inhibit oocyte maturation in gray. Generated using Biorender. (E) Levels of EETs and HETEs before and after P4 treatment in single oocytes. Naïve oocytes were incubated with either ethanol or P4 10–5M for 30 min. 20 single oocytes per condition were collected and used for analysis. 5-oxoETE and 8 (9)-EET were detected in 1 or 2 samples, respectively, so they were not included in the statistical analyses although both were lower following P4 treatment. (F) Levels of prostaglandins before (0 min) and after P4 treatment at 5 min and 30 min time points in naïve oocytes. Per each condition, 10 replicates were collected containing 10 pooled oocytes each. The following eicosanoids were not detected in either group: 6kPGF1α, PGF2α, PGE2, TXB2, PGD2, PGA2, PGJ2, 15-deoxyPGJ2, 12-HHTrE, 11-dehydro TXB2, LTB4, LTC4, LTD4, LTE4, 20-hydroxy LTB4, 20-carboxy LTB4, 5 (6)-DiHETEs, LXA4, LXB4, 5 (6)-EET, 5 (6)-DiHET, 8 (9)-DiHET, 11 (Wendler and Wehling, 2022)-DiHET, 14 (Thomas, 2022)-DHET, 20-HETE. Similar results were obtained from individual oocyte samples (see Source data 3 Table 7). Data are normalized to the PG levels at time zero. Example of the raw abundance of individual PG species is shown in Figure 2—figure supplement 1C.
Figure 2—figure supplement 1
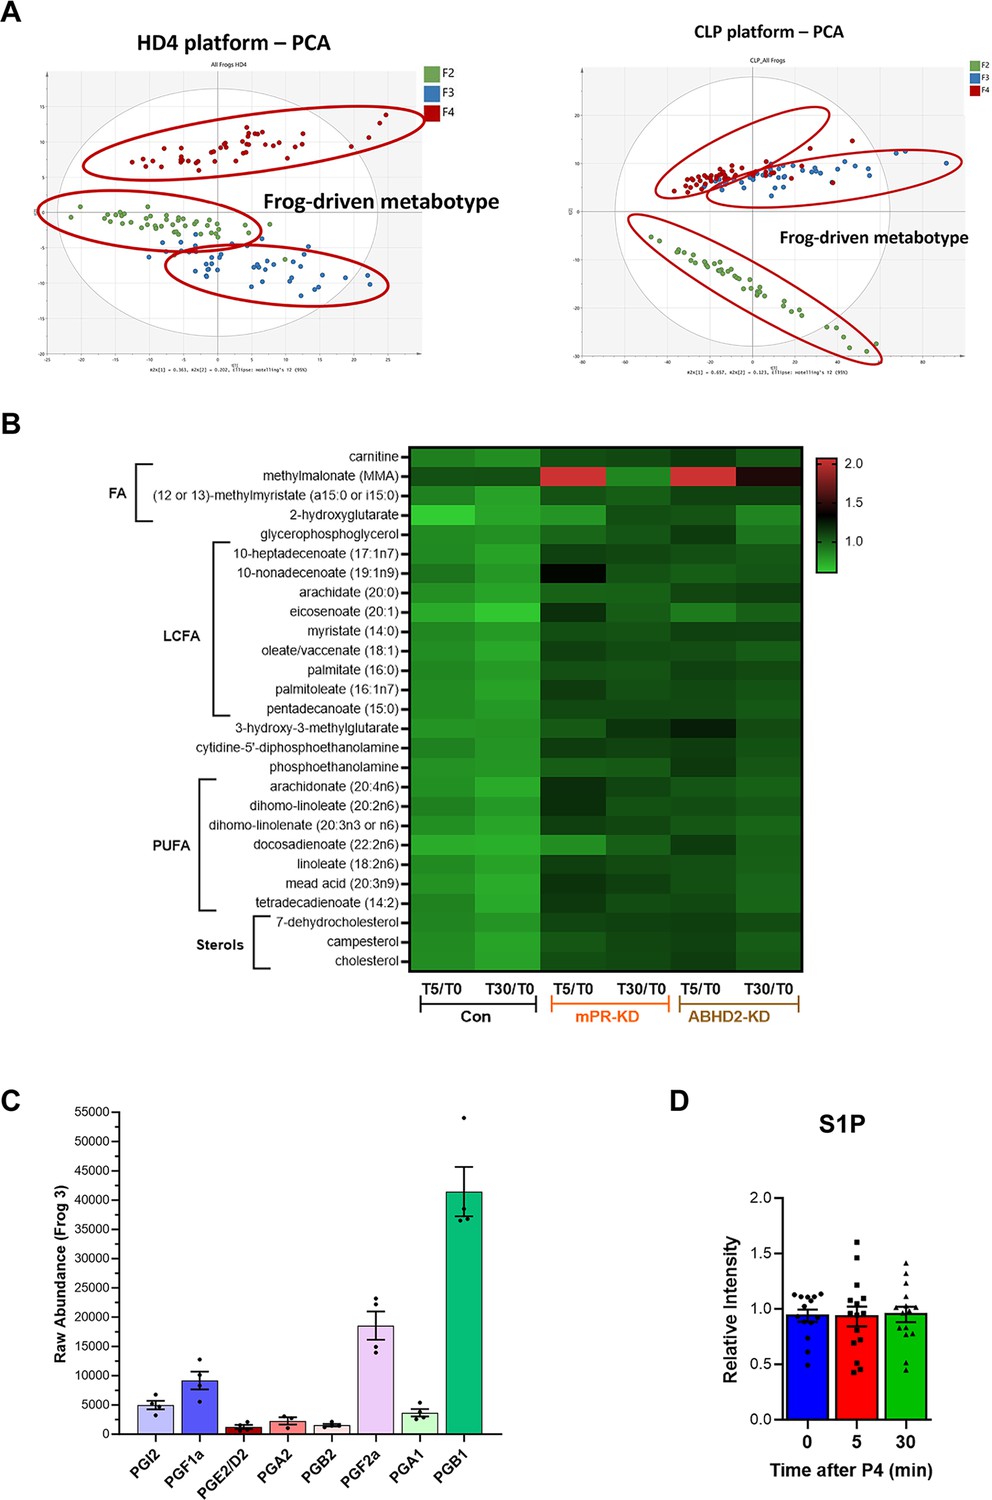
Metablomics profiles during oocyte maturation.
(A) Frog-driven metabotype as shown from the HD4 (left panel) and CLP platforms (right panel). (B) Data generated from the HD4 platform illustrated by the heatmap data of fold changes for individual metabolites that were changed significantly (p<0.05) at either the 5 min (T5) or 30 min (T30) time points in response to P4 as compared to untreated oocytes (T5/T0 and T30/T0) for naive (Con), mPR-KD, and ABHD2-KD oocytes. Metabolites are clustered at the levels of fatty acids (FA), long-chain fatty acids (LCFA), polyunsaturated fatty acids (PUFA), and sterols. (C) The raw abundance of individual prostaglandin species in pooled oocytes before treatment from a representative frog (#3) to illustrate relative abundance among the different PG species. (D) S1P measurements in pooled oocytes before treatment, and at 5 and 30 min after progesterone addition. The data are shown as relative intensity normalized to the average of before-treatment levels.
Figure 3 with 1 supplement
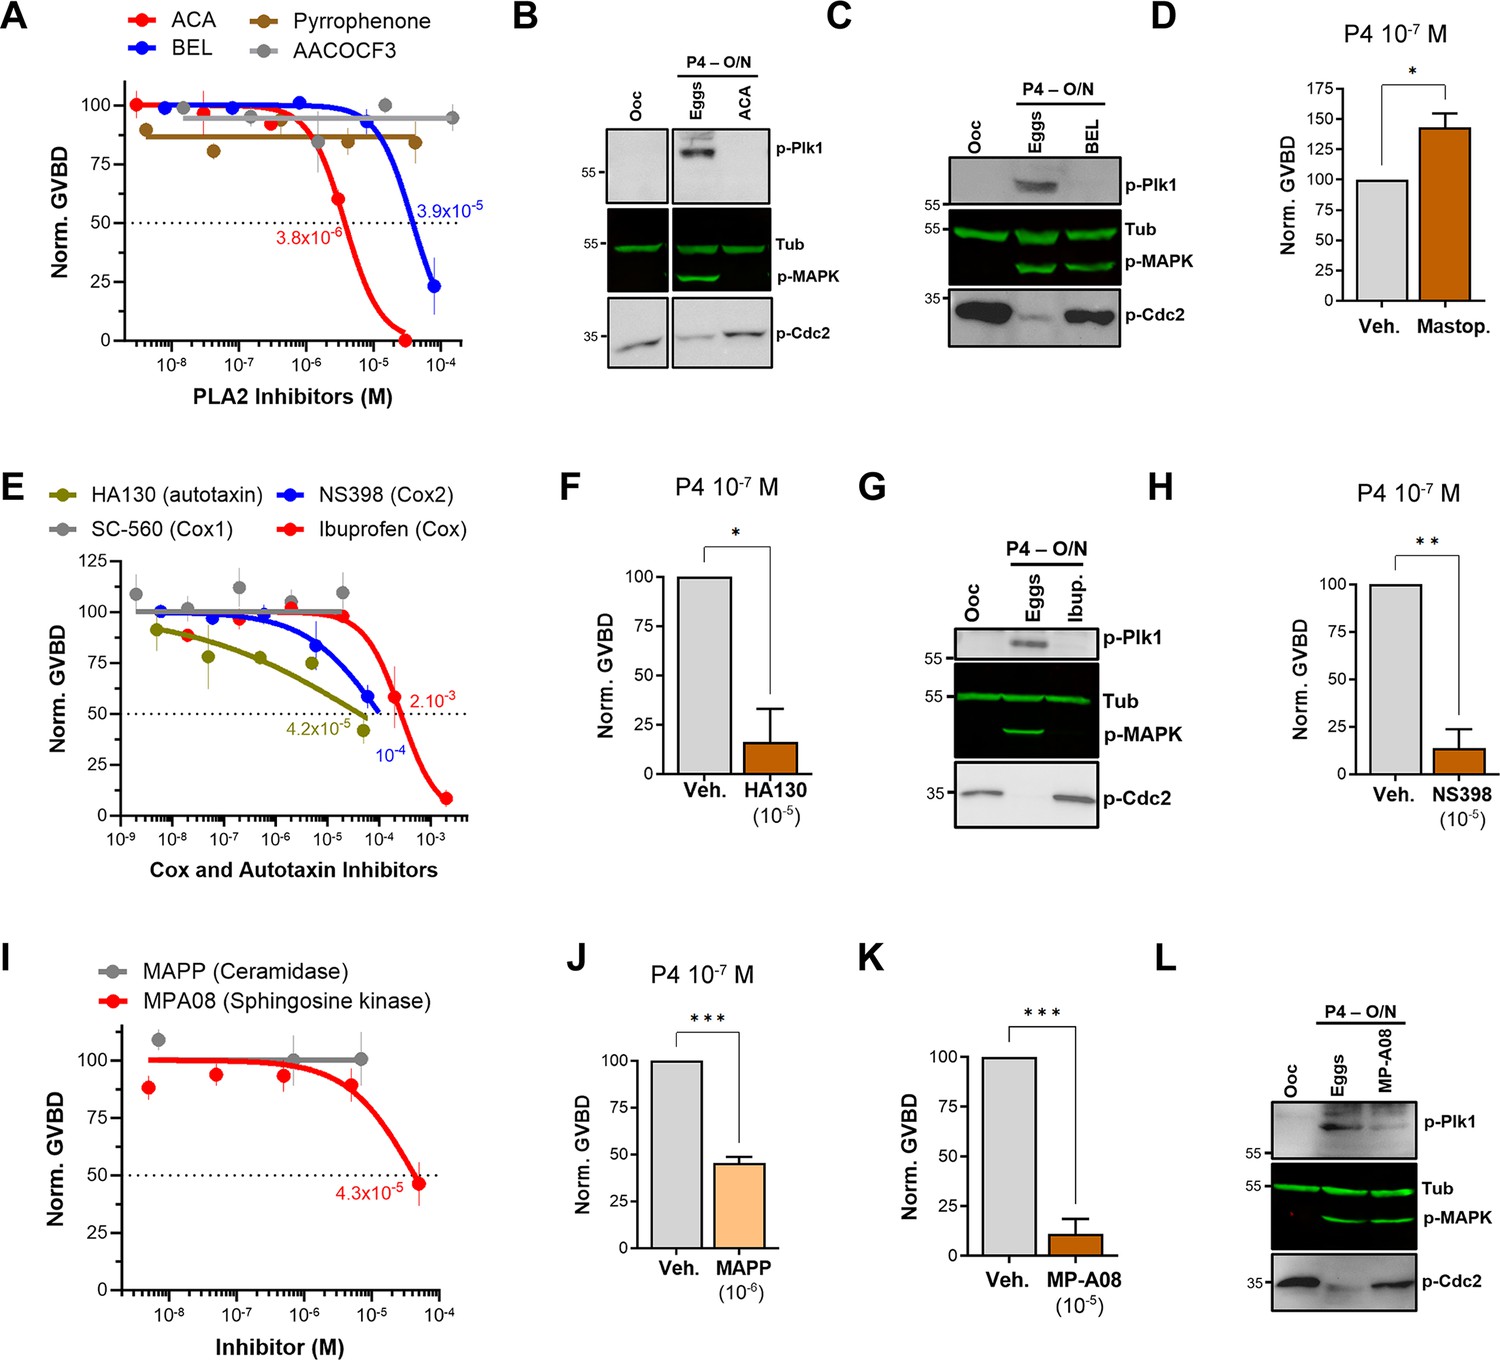
Pharmacological validation of the metabolomics findings.
(A, E, I) Dose-response of inhibition of oocyte maturation for the drugs tested. Oocytes were pre-treated for 2 hr with a vehicle or with increasing concentrations of the indicated drugs, followed by overnight treatment with progesterone (P4) at 10–5 M. IC50 was calculated using a nonlinear regression fit (mean ± SEM; n=3 independent female frogs). (D, F, H, J, K) Drug effect on oocyte maturation at low P4 concentration. Oocytes were pre-treated for 2 hr with the vehicle or with the highest drug concentration from the dose-response, followed by overnight treatment with P4 at 10–7 M. Oocyte maturation was normalized to control oocytes (treated with vehicle) (mean ± SEM; n=3 independent female frogs for each chemical compound experiment, unpaired t-test). (B, C, G, L) Representative WB of MAPK, Plk1, and Cdc2 phosphorylation from untreated oocytes, oocytes pretreated with vehicle or the indicated drug for 2 hr then matured overnight (O/N) with P4 (eggs). Tubulin is shown as a loading control.
-
Figure 3—source data 1
Original files for western blot analysis are displayed in Figure 3B,C,G,L.
- https://cdn.elifesciences.org/articles/92635/elife-92635-fig3-data1-v1.zip
-
Figure 3—source data 2
File containing labeled western blots for Figure 3B,C,G,L, indicating the relevant bands and treatments.
- https://cdn.elifesciences.org/articles/92635/elife-92635-fig3-data2-v1.zip
Figure 3—figure supplement 1
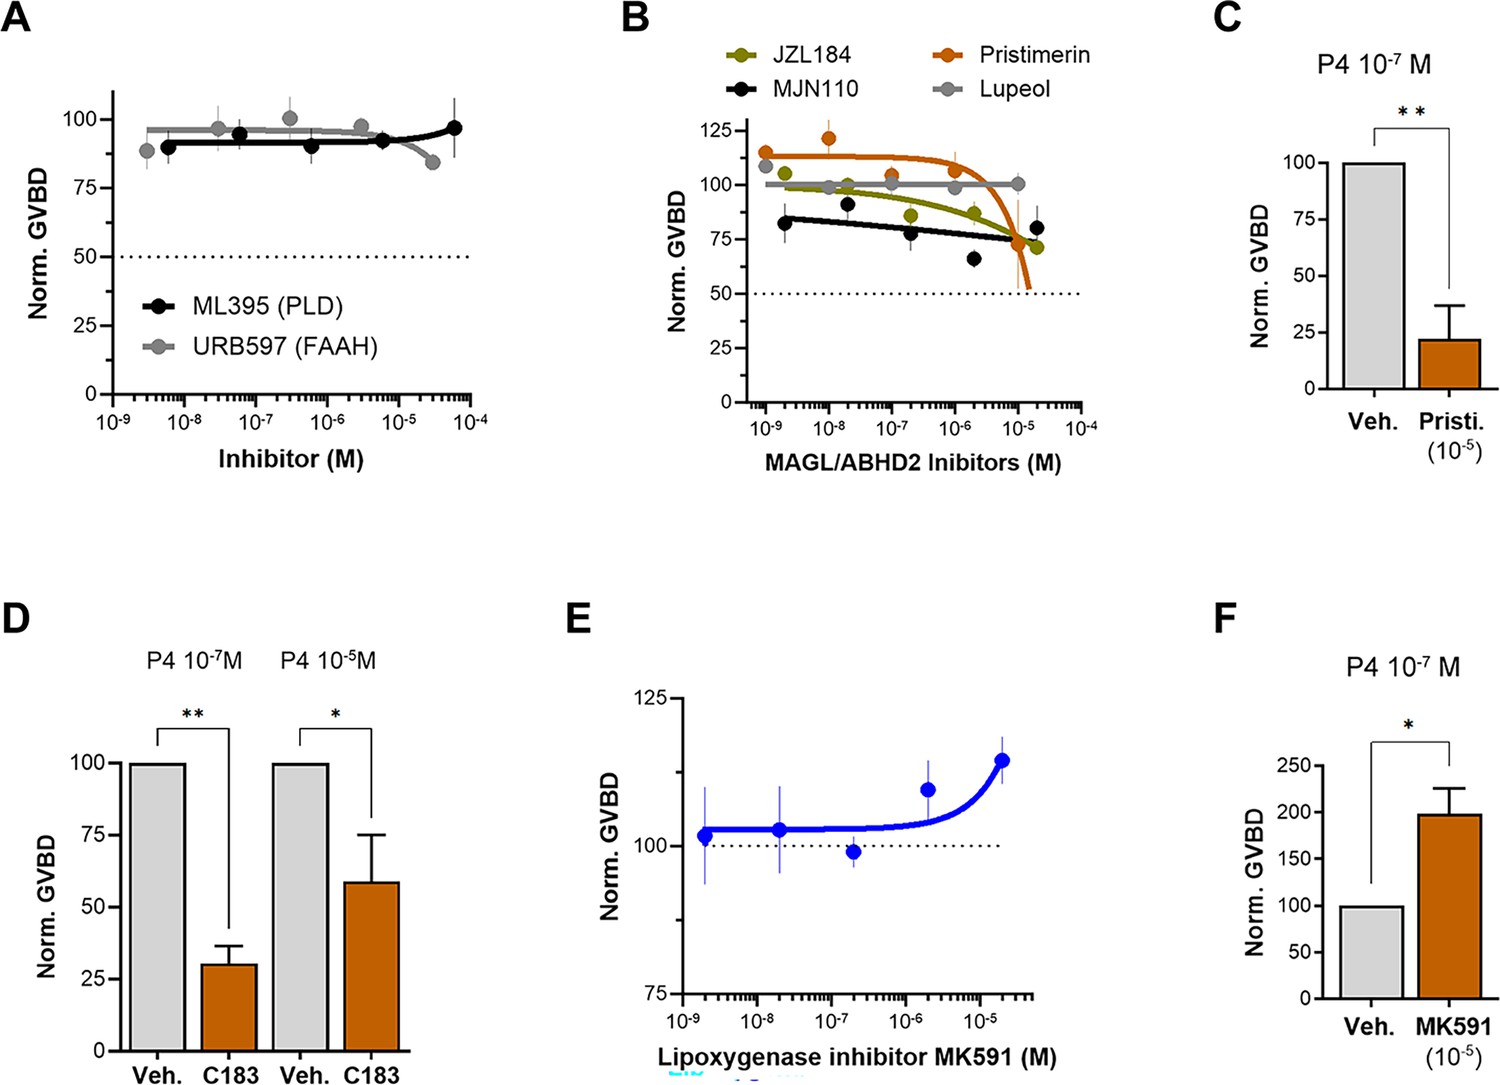
Effects of various pharmacological inhibitors on oocyte maturation.
(A, B, E) Oocyte maturation inhibition dose-response.Oocytes were pre-treated for 2 hr with vehicle or with a increasing concentrations of specified inhibitor, followed by overnight treatment with progesterone (P4) at 10–5M. Oocyte maturation normalized to vehicle P4-treated oocytes. IC50 of each chemical compound was calculated using a nonlinear regression fit (mean ± SEM; n=3 independent female frogs for each chemical compound experiment). (C, D, F) Effect of pristimerin (C), compound 183 (10–4 M) (D), and MK591 (F) on oocyte maturation at the indicated P4 concentration. Oocytes were pre-treated for 2 hr with the vehicle or indicated inhibitor, followed by overnight treatment with P4. Oocyte maturation was normalized to the control oocyte condition (treated with vehicle) (mean ± SEM; n=3 independent female frogs for each chemical compound experiment, unpaired t-test).
Figure 4 with 1 supplement
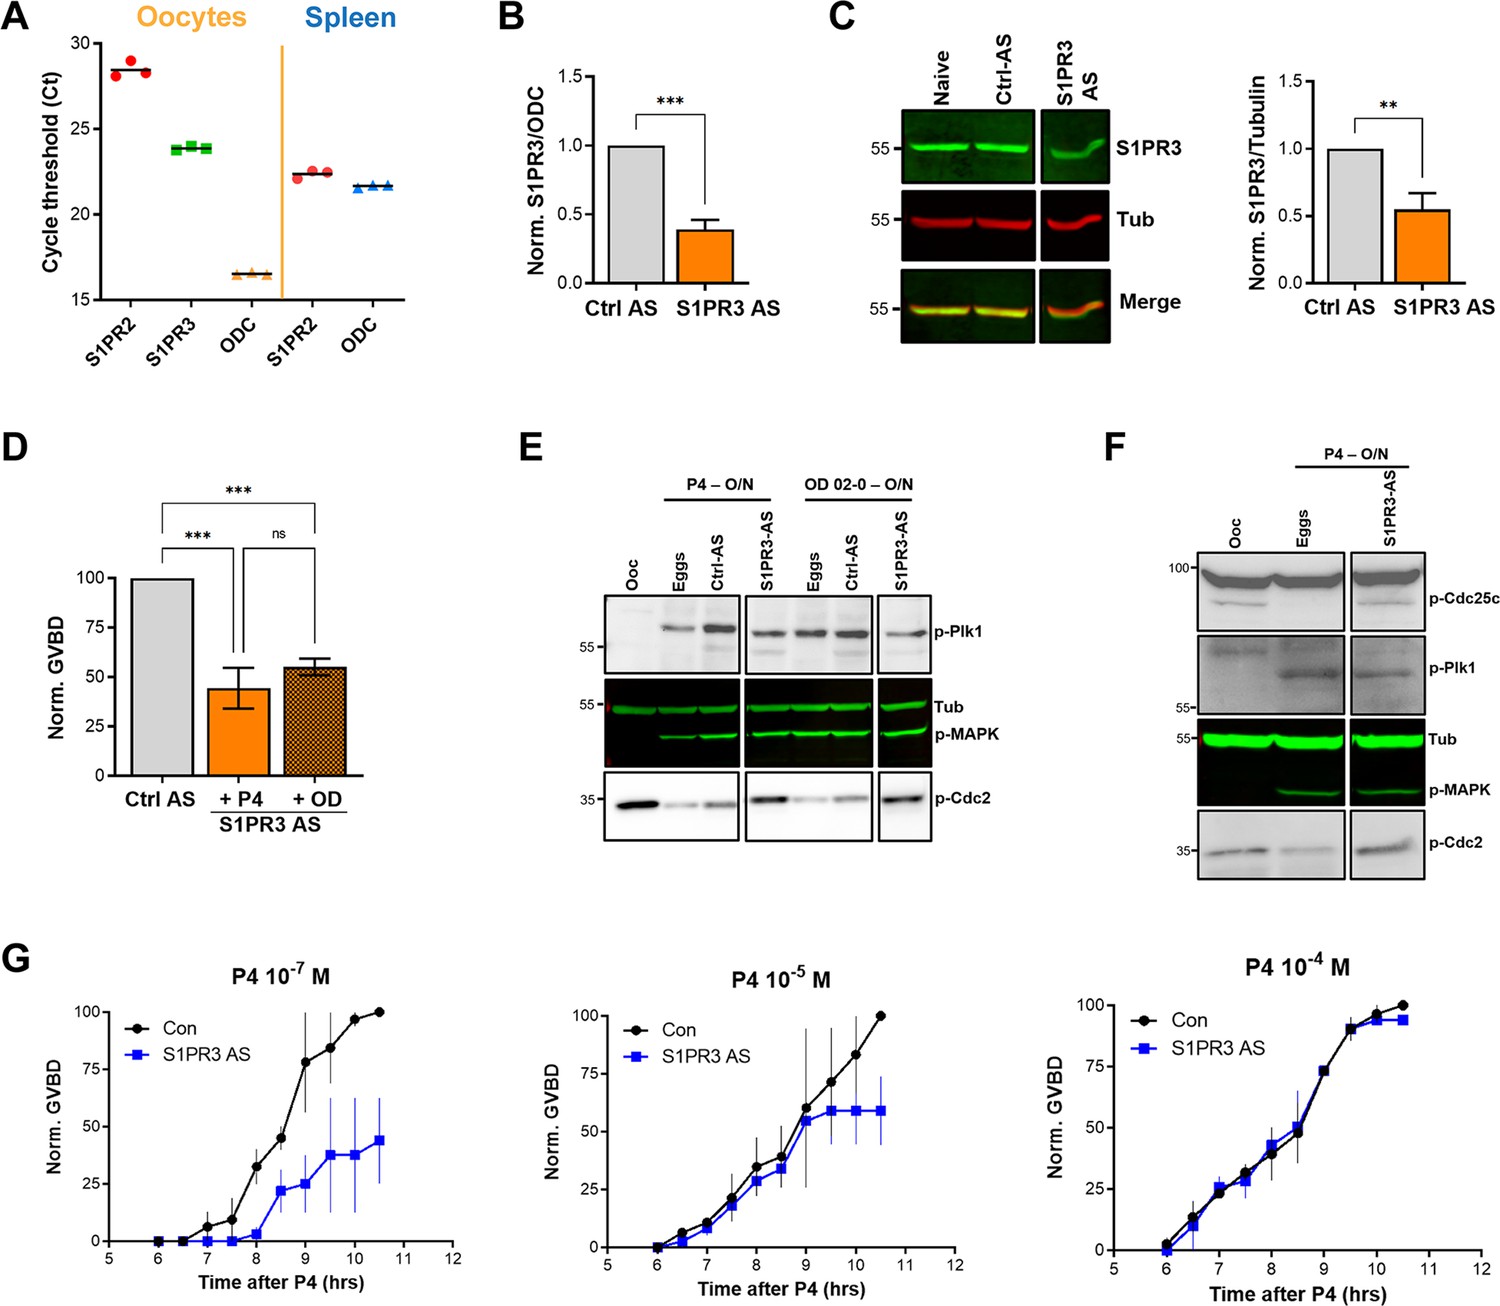
S1P signaling and oocyte maturation.
(A) mRNAs levels of S1PR2, S1PR3, and the housekeeping gene Ornithine decarboxylase (ODC) in oocytes and spleen measured as the Cycle threshold (Ct) from real-time PCR. (B–C) S1PR3 knockdown. Oocytes were injected with control antisense (Ctrl AS) or specific S1PR3 antisense oligonucleotides and incubated at 18 °C for 24 hr. RNAs and protein extracts were prepared and analyzed by RT-PCR and western blot (WB) to determine the efficacy of S1PR3 knockdown as compared to control oocytes (Ctrl AS). B. Histogram showing the relative RNAs levels of S1PR3 mRNA to xODC. (C) Representative WB (left panel) and normalized quantification (right panel) comparing S1PR3 protein levels between naïve, Ctrl AS and S1PR3 AS injected oocytes. Tubulin is shown as a loading control (mean ± SEM; n=6 independent female frogs). (D) Oocyte maturation following injection of S1PR3 antisense, normalized to progesterone (P4) or Org OD 02–0 (OD)-treated oocytes injected with control antisense (Ctrl AS) (mean ± SEM; n=7 independent female frogs, ordinary one-way ANOVA). (E/F) Representative WBs of MAPK, Plk1, and Cdc2 (E), as well as CDC25C (F) phosphorylation from untreated oocytes, P4 or OD, matured eggs (O/N)D, oocytes injected with control antisense (Ctrl AS) or S1PR3 antisense (S1PR3 AS) and treated O/N with P4 or OD. Tubulin is shown as a loading control.(G) GVBD-time course after treatment with P4 at the indicated concentrations in oocytes injected with water (Con) or with S1PR3 antisense (S1PR3 AS) (mean ± SEM; n=2 independent female frogs).
-
Figure 4—source data 1
Original files for western blot analysis are displayed in Figure 4C,E,F.
- https://cdn.elifesciences.org/articles/92635/elife-92635-fig4-data1-v1.zip
-
Figure 4—source data 2
File containing labeled western blots for Figure 4C,E,F, indicating the relevant bands and treatments.
- https://cdn.elifesciences.org/articles/92635/elife-92635-fig4-data2-v1.zip
Figure 4—figure supplement 1
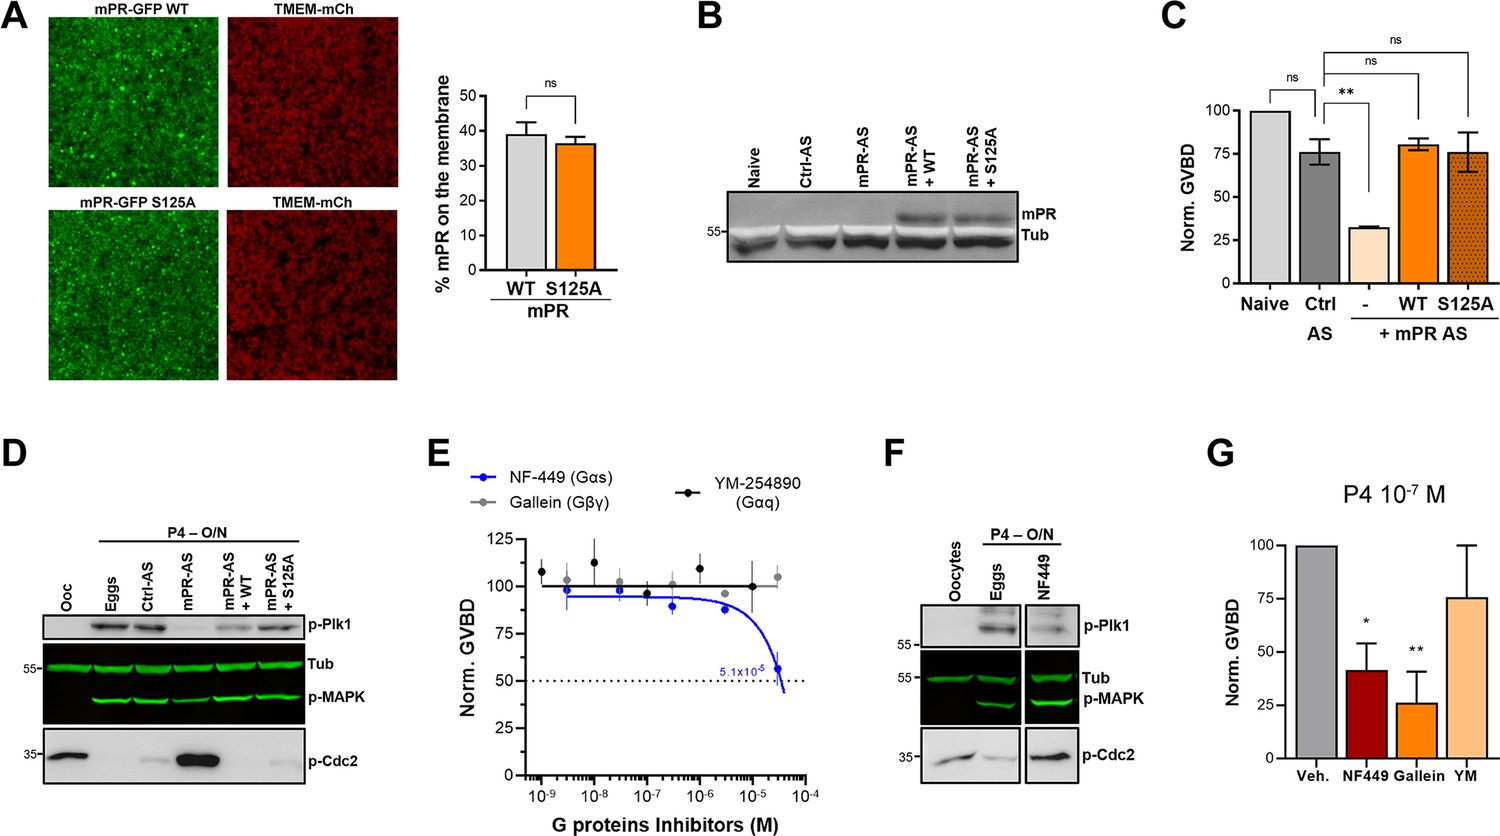
Role of GPCR signaling.
(A) mPR S125 plasma membrane localization. Oocytes were injected with mPR-GFP wild-type (WT) or the S125A mutant, along with TMEM-mCherry as a plasma membrane (PM) marker. Left panel, Representative confocal image of oocytes overexpression mPR-GFP WT or mPR-GFP S125A mutant along with TMEM-mCherry. Right panel, histogram showing the percentage of mPR-GFP WT or mPR-GFP S125A at the PM (mean ± SEM; n=10 oocytes per clone from two independent female frogs, unpaired t-test). (B) Representative WB of mPR-GFP protein expression in naïve, control antisense (Ctrl AS), mPRβ antisense (AS), and AS +mPR GFP WT or mPR-GFP S125A mutant injected oocytes. Tubulin is shown as a loading control. (C) Oocyte maturation in oocytes injected with control antisense (Ctrl AS) or mPRβ antisense (AS) with or without mPR-GFP WT or mPR-GFP S125A expression, and normalized to progesterone (P4)-treated naïve oocytes (Naive) (mean ± SEM; n=3 independent female frogs, ordinary one-way ANOVA). (D) Representative WB of MAPK, Plk1, and Cdc2 phosphorylation from untreated oocytes, P4 matured eggs, oocytes injected with control antisense (Ctrl AS) or mPRβ antisense (AS) with or without mPR-GFP WT or mPR-GFP S125A expression. Tubulin is shown as a loading control. (E) Inhibitor dose response. Oocytes were pre-treated for 2 hr with vehicle or with increasing concentrations of specified inhibitor, followed by overnight treatment with P4 at 10–5 M. Oocyte maturation normalized to vehicle P4-treated oocytes. IC50 was calculated using a nonlinear regression fit (mean ± SEM; n=3 independent female frogs for each chemical compound experiment). (F) Representative WB of MAPK, Plk1, and Cdc2 phosphorylation from untreated oocytes, oocytes pretreated with a vehicle for 2 hr then matured overnight (O/N) by P4 at 10–7 M (eggs), and oocytes pretreated for 2 hr with NF449 then treated O/N with P4 10–7 M. Tubulin is shown as a loading control. (G) Drug effect on oocyte maturation at low P4 concentration. Oocytes were pre-treated for 2 hr with vehicle or the specified inhibitor followed by overnight treatment with P4 at 10–7 M. Oocyte maturation was normalized to the control oocytes condition (treated with vehicle) (mean ± SEM; n=3 independent female frogs for each chemical compound experiment, unpaired t-test).
-
Figure 4—figure supplement 1—source data 1
Original files for western blot analysis are displayed in Figure 4—figure supplement 1B,D,F.
- https://cdn.elifesciences.org/articles/92635/elife-92635-fig4-figsupp1-data1-v1.zip
-
Figure 4—figure supplement 1—source data 2
File containing labeled western blots for Figure 4—figure supplement 1B,D,F, indicating the relevant bands and treatments.
- https://cdn.elifesciences.org/articles/92635/elife-92635-fig4-figsupp1-data2-v1.zip
Figure 5 with 1 supplement
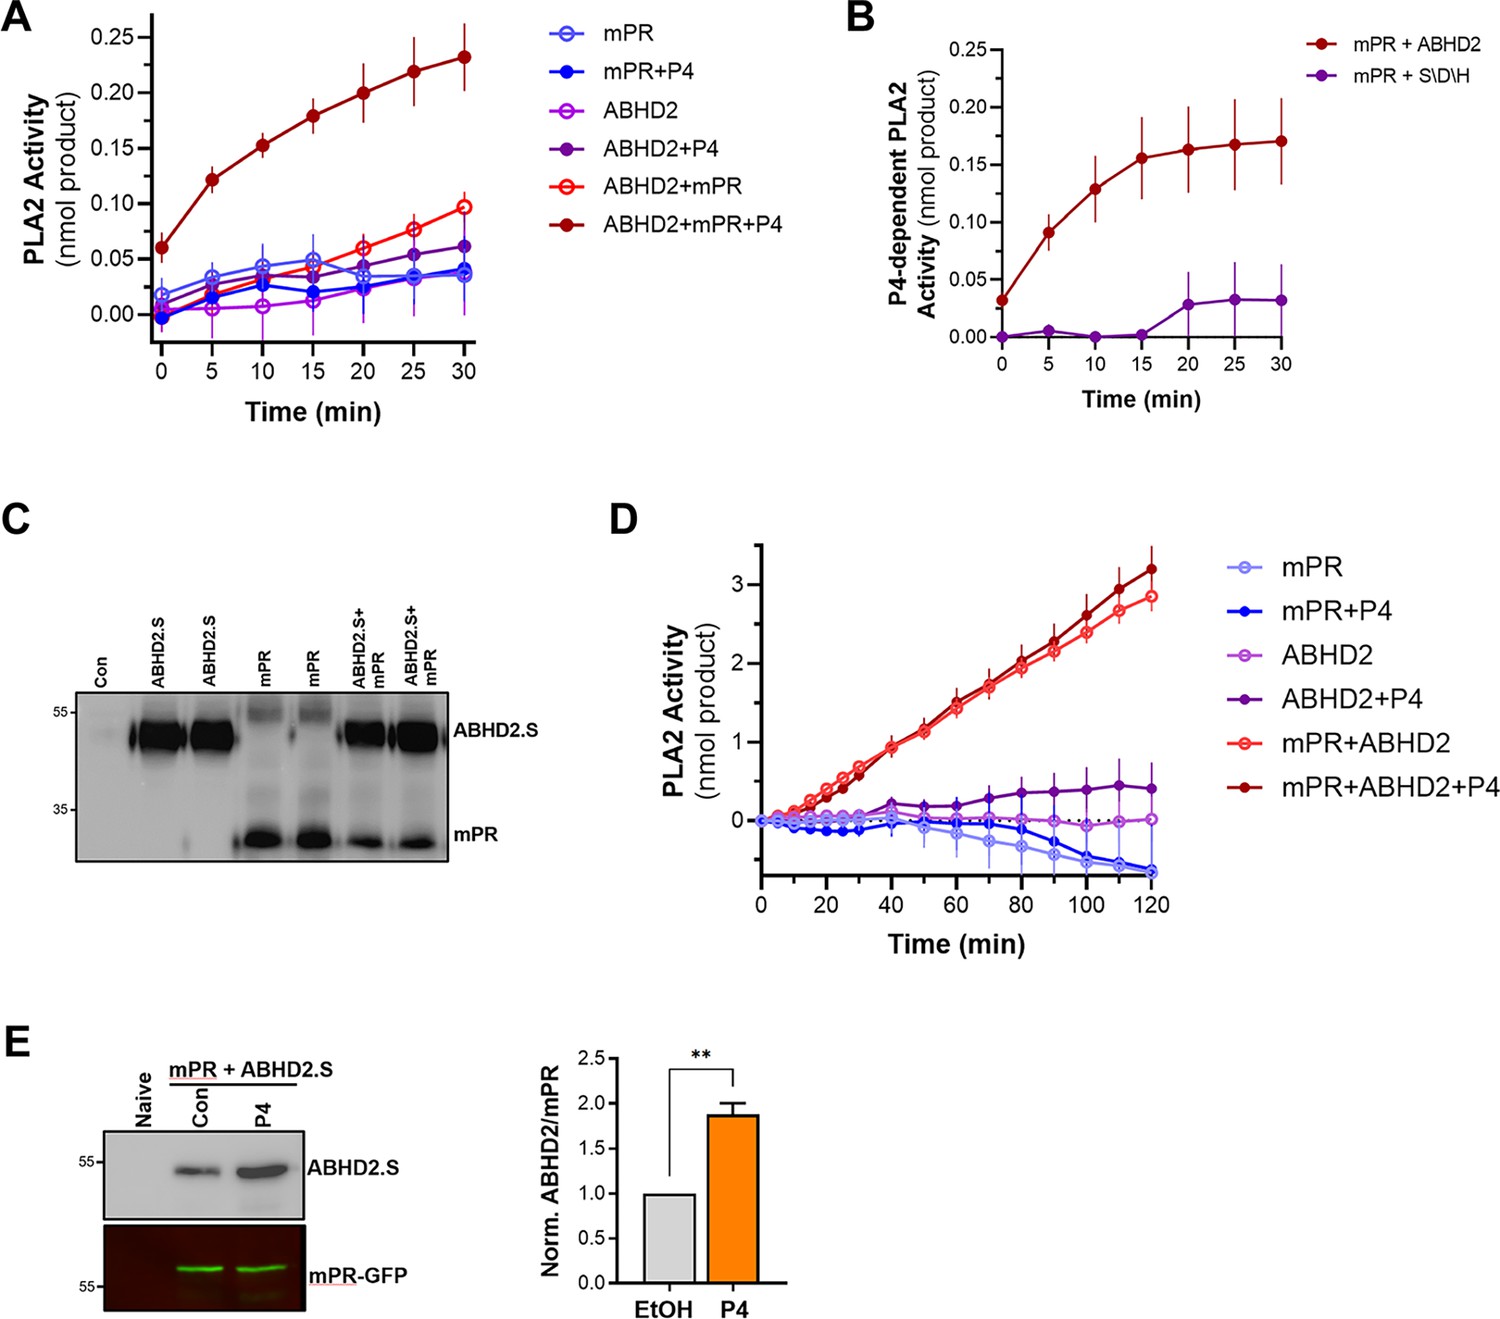
Phospholipase A2 (PLA2) activity of the membrane progesterone receptor β (mPRβ)-α/β hydrolase domain-containing protein 2 (ABHD2) co-receptor complex.
(A) Time-dependent PLA2 activity from reticulocyte lysates expressing mPR, ABHD2.S, or ABHD2.S+mPR in the presence of ethanol as vehicle or P4 10–5 M (mean ± SEM; n=3). (B) Time course of progesterone (P4)-dependent PLA2 activity in reticulocyte lysates expressing mPRβ with either wild-type ABHD2 (ABHD2) or the ABHD2 S207A/D345A/H376A mutant (S/D/H). P4-dependent PLA2 is plotted as the difference in activity in the presence and absence of P4 (Mean ± SEM; n=3). (C) Example western blot (WB) probed with anti-His antibody from tobacco lysates (ALiCE) alone (Con) and lysates expressing mPRβ or ABHD2 alone or both proteins in duplicated as indicated. (D) Time-dependent PLA2 activity from ALiCE lysates overexpressing mPR, ABHD2.S, or ABHD2.S+mPR in the presence of the vehicle ethanol or P4 10–5 M (mean ± SEM; n=3). Data are plotted as the rate of production of the lysothiophospholipid product from the beginning of the experiment (0 min) with the rate of the lysates alone subtracted. (E) Representative immunoprecipitation (IP) WB and quantification of mPR-GFP from oocyte lysates from un-injected oocytes (Naive) or oocytes over-expressing mPR-GFP and ABHD2.S treated for 40 min with Ethanol (EtOH) or P4. Left panel, the representative WB membrane is probed for ABHD2 and GFP (mean ± SEM; n=3 independent female frogs, unpaired t-test).
-
Figure 5—source data 1
Original files for western blot analysis are displayed in Figure 5C,E.
- https://cdn.elifesciences.org/articles/92635/elife-92635-fig5-data1-v1.zip
-
Figure 5—source data 2
File containing labeled western blots for Figure 5C,E, indicating the relevant bands and treatments.
- https://cdn.elifesciences.org/articles/92635/elife-92635-fig5-data2-v1.zip
Figure 5—figure supplement 1
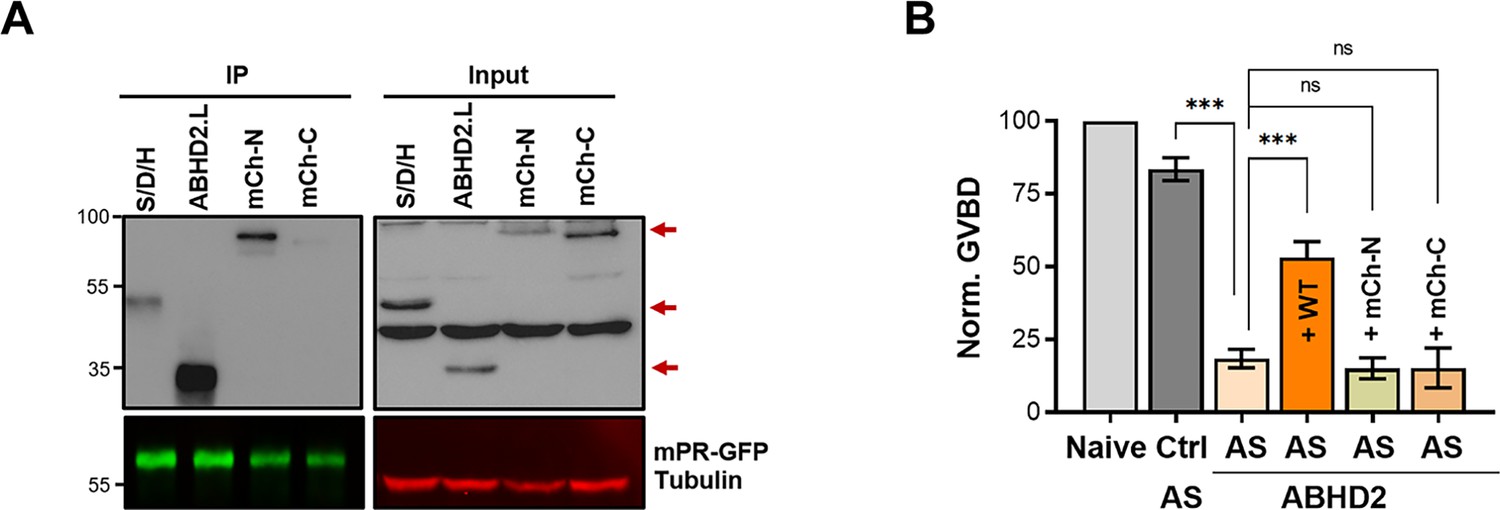
ABHD2 mutants interaction with mPRβ.
(A) Representative western blot (WB) of the immunoprecipitation (IP) of mPR-GFP using lysates from oocytes over-expressing mPR-GFP with α/β hydrolase domain-containing protein 2 (ABHD2). L, mCherry tagged ABHD2.S at its C-terminal (mCh-C) or N-terminal (mCh-N), and ABHD2.S S/D/H. The input represents expression levels of the different clones before the IP. Tubulin is shown as a loading control. The red arrows point to ABHD2.S different clones. (B) Oocyte maturation measured in oocytes injected with control antisense (Ctrl AS) or ABHD2 antisense (AS) with or without ABHD2.S wild type (AS +WT) or the mCherry tagged ABHD2.S clones and normalized to progesterone (P4)-treated naïve oocytes (Naive) (mean ± SEM; n=3–5 independent female frogs, ordinary one-way ANOVA).
-
Figure 5—figure supplement 1—source data 1
Original files for western blot analysis are displayed in Figure 5A.
- https://cdn.elifesciences.org/articles/92635/elife-92635-fig5-figsupp1-data1-v1.zip
-
Figure 5—figure supplement 1—source data 2
File containing labeled western blots for Figure 5A, indicating the relevant bands and treatments.
- https://cdn.elifesciences.org/articles/92635/elife-92635-fig5-figsupp1-data2-v1.zip
Figure 6
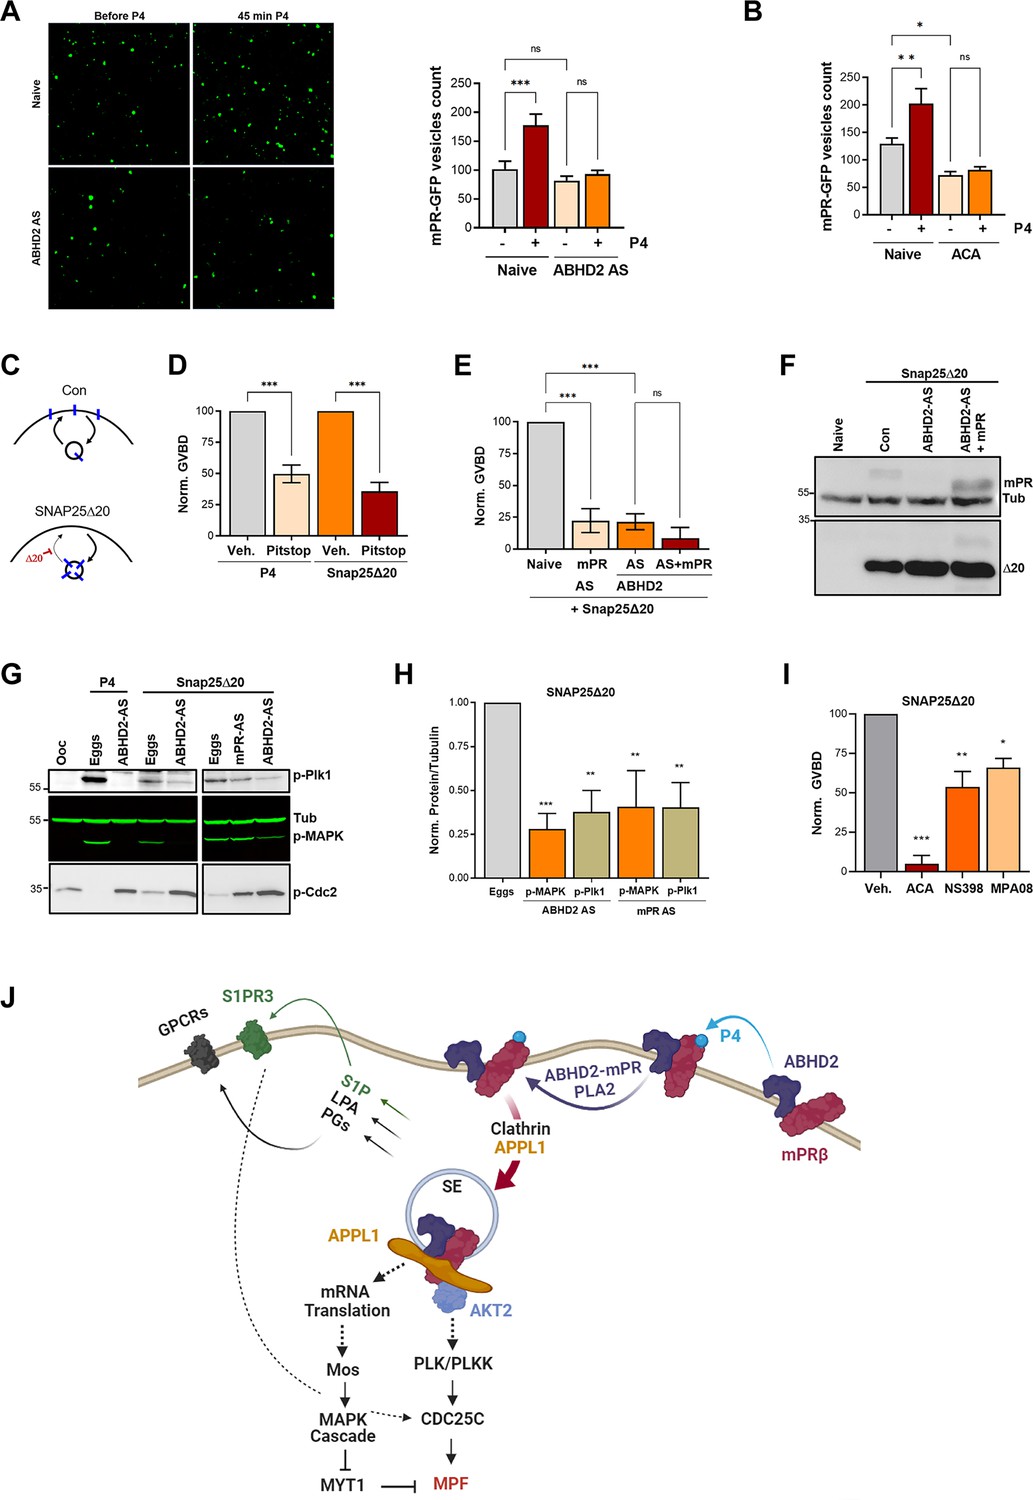
α/β hydrolase domain-containing protein 2 (ABHD2) and phospholipase A2 (PLA2) activity are required for membrane progesterone receptor β (mPRβ) endocytosis and signaling.
(A) Effect of ABHD2 knockdown on mPR-P4 mediated endocytosis. Oocytes were injected with mPR-GFP RNA (Naïve) and 48 hr later either left untreated or injected with ABHD2 antisense (ABHD2 AS). The following day oocytes were imaged, before and 45 min after progesterone (P4) treatment. Left panel, representative confocal image of mPR-GFP positive vesicles in naïve and ABHD2 AS oocytes, before and after P4. Right panel, histogram of mPR-GFP positive vesicle count before and after P4 (mean ± SEM; n=20–21 oocytes per condition, from three independent female frogs, ordinary one-way ANOVA). (B) PLA2 inhibition blocks P4-mediated endocytosis. Vesicle count from oocytes expressing mPR-GFP for 72 hr was pretreated with vehicle (naïve) or ACA for 2 hr, followed by imaging, before and 45 min after P4 treatment (mean ± SEM; n=16–18 oocytes per condition, from two independent female frogs, ordinary one-way ANOVA). (C) Cartoon depicting the role of SNAP25Δ20 in blocking exocytosis. (D) SNAP25Δ20-induced oocyte maturation requires clathrin-dependent endocytosis. Naïve oocytes were pretreated with vehicle or Pitstop (10–5 M), followed by overnight treatment with P4 or SNAP25Δ20-mRNA injection. Oocyte maturation in P4 or SNAP25Δ20 injected oocytes normalized to the vehicle condition (mean ± SEM; n=4 independent female frogs, ordinary one-way ANOVA). (E) SNAP25Δ20-induced maturation requires ABHD2. Oocytes were injected with mPR antisense (mPR AS) or ABHD2 antisense (AS) with or without mPRβ mRNA (AS +mPR). 48 hr later, oocytes were injected with mRNA to overexpress SNAP25Δ20. The following day, oocyte maturation was measured in mPR AS, ABHD2 AS, and ABHD2 AS +mPR oocytes normalized to naive oocytes injected with SNAP25Δ20 (mean ± SEM; n=3 independent female frogs, ordinary one-way ANOVA). (F) Representative WB of mPR and SNAP25Δ20 proteins expression in naïve, ABHD2 AS and ABHD2 AS +mPR oocytes. Tubulin is shown as a loading control. (G) Representative WB of MAPK, Plk1, and Cdc2 phosphorylation from untreated oocytes, P4 matured eggs, or SNAP25Δ20 mRNA injection, and oocytes injected with mPR (mPR AS) or ABHD2 antisense (ABHD2 AS) and treated O/N with P4 or SNAP25Δ20 mRNA injection. Tubulin is shown as a loading control. (H) Quantification of p-Plk as the ratio of p-PLK/Tubulin and p-MAPK as the ratio of p-MAPK/Tubulin normalized to the ratios in naive eggs (mean ± SEM; n=4 independent female frogs, ordinary one-way ANOVA). (I) Oocyte maturation in oocytes pretreated for 2 hr with ACA, NS398, and MP-A08 followed by SNAP25Δ20-mRNA injection and normalized to GVBD in oocytes pre-treated with vehicle followed by SNAP25Δ20-mRNA injection (Veh.) (mean ± SEM; n=3 independent female frogs, ordinary one-way ANOVA). (J) Model of the signaling cascade triggered in response to P4 (generated using Biorender).
-
Figure 6—source data 1
Original files for western blot analysis are displayed in Figure 6F,G.
- https://cdn.elifesciences.org/articles/92635/elife-92635-fig6-data1-v1.zip
-
Figure 6—source data 2
File containing labeled western blots for Figure 6F,G, indicating the relevant bands and treatments.
- https://cdn.elifesciences.org/articles/92635/elife-92635-fig6-data2-v1.zip
Author response image 1

ABHD2 knockdown and rescue.
Oocytes were injected with control antisense (Ctrl AS) or specific ABHD2 antisense (AS) oligonucleotides and incubated at 18 oC for 24 hr. Oocytes were then injected with mRNA to overexpress ABHD.S for 48 hr and then treated with P4 overnight. The histogram shows % GVBD in naïve, oocytes injected with control or ABHD2 antisense with or without mRNA to overexpress ABHD2.S.
Author response image 2

Metabolite levels from 5 replicates of 10 oocytes each at each time point were measured and averaged per frog and per time point.
Fold change was measured as the ratio at the 5- and 30-min time points relative to untreated oocytes (T0). FCs that are not statistically significant are shown as faded. Oocytes with mPR knockdown (KD) are boxed in green and ABHD2-KD in purple.
Author response image 3

The effect of MJN110 and JZL184 compounds on oocyte maturation at low P4 concentration.
Oocytes were pre-treated for 2 hours with the vehicle or with the highest concentration of 2.10--5 M for both JZL184 or MJN110, followed by overnight treatment with P4 at 10-7M. Oocyte maturation was measured as % GVBD normalized to control oocytes (treated with vehicle) (mean + SEM; n = 2 independent female frogs for each compound).
Tables
Table 1
Pharmacological inhibitors potency.
| Inhibitor | Target | IC50 ± SEM Oocyte maturation (M) | IC50 (M) Representative study | Ratio (Ooc/Lit) |
|---|---|---|---|---|
| ACA | PLA2 | 3.8E-6±5.8E-7 | 5E-6 Liu, 1999 | 0.76 |
| BEL | PLA2 | 3.9E-5±8E-6 | 8E-6 Balsinde and Dennis, 1996 | 4.9 |
| MP-A08 | Sphingosine Kinase 1 | 4.3E-5±1E-5 | 2.7E-5 Pitman et al., 2015 | 1.6 |
| HA130 | Autotaxin | 4.2E-5±4.8E-5 | 2.8E-8 Albers et al., 2010 | 1,522 |
| Ibuprofen | Cox-2 | 2.7E-4±6E-5 | 3.7E-4 Noreen et al., 1998 | 0.73 |
| NS398 | Cox-2 | 1E-4±5E-5 | 3.8E-6 Futaki et al., 1994 | 26.3 |
| NF-449 | GαS | 5.2E-5±3E-5 | 7.9E-6 Hohenegger et al., 1998 | 6.5 |
Additional files
-
Supplementary file 1
List of reagents.
(a) List of antibodies, chemicals, and reagents. (b) List of antisense oligonucleotides and primers.
- https://cdn.elifesciences.org/articles/92635/elife-92635-supp1-v1.xlsx
-
MDAR checklist
- https://cdn.elifesciences.org/articles/92635/elife-92635-mdarchecklist1-v1.docx
-
Source data 1
Full Western blots.
- https://cdn.elifesciences.org/articles/92635/elife-92635-data1-v1.zip
-
Source data 2
Labelled full Western Blots.
- https://cdn.elifesciences.org/articles/92635/elife-92635-data2-v1.zip
-
Source data 3
Means and p-values for ratio fold changes for lipids analyzed on the CLP platform at 5 min time point after treatment with progesterone (P4).
Means and p-values for ratio fold changes for lipids analyzed on the CLP platform at 30 min time point after treatment with P4. Means and p-values for ratio fold changes for lipids analyzed on the HD4 platform at 5 min time point after treatment with P4. Means and p-values for ratio fold changes for other metabolites analyzed on the HD4 platform at 5 min time point after treatment with P4. Means and p-values for ratio fold changes for lipids analyzed on the HD4 platform at 30 min time point after treatment with P4. Means and p-values for ratio fold changes for other metabolites analyzed on the HD4 platform at 30 min time point after treatment with P4. Means and p-values for ratio fold changes for different compounds at 30 min time point after treatment with P4 in single oocyte metabolomics.
- https://cdn.elifesciences.org/articles/92635/elife-92635-data3-v1.xlsx
Download links
A two-part list of links to download the article, or parts of the article, in various formats.
Downloads (link to download the article as PDF)
Open citations (links to open the citations from this article in various online reference manager services)
Cite this article (links to download the citations from this article in formats compatible with various reference manager tools)
Progesterone induces meiosis through two obligate co-receptors with PLA2 activity
eLife 13:RP92635.
https://doi.org/10.7554/eLife.92635.3


