Tissue-resident natural killer cells support survival in pancreatic cancer through promotion of cDC1-CD8 T activity
- Department of Oncology, University of Oxford, United Kingdom
- Experimental Medicine Division, University of Oxford, United Kingdom
- University of Oxford Medical School, United Kingdom
- Department of Biochemistry, University of Oxford, United Kingdom
- Oxford University Hospitals NHS Foundation Trust, United Kingdom
- CRUK Beatson Institute, United Kingdom
- School of Cancer Sciences, University of Glasgow, United Kingdom
- Nuffield Department of Surgical Sciences, University of Oxford, United Kingdom
Figures
Figure 1 with 1 supplement
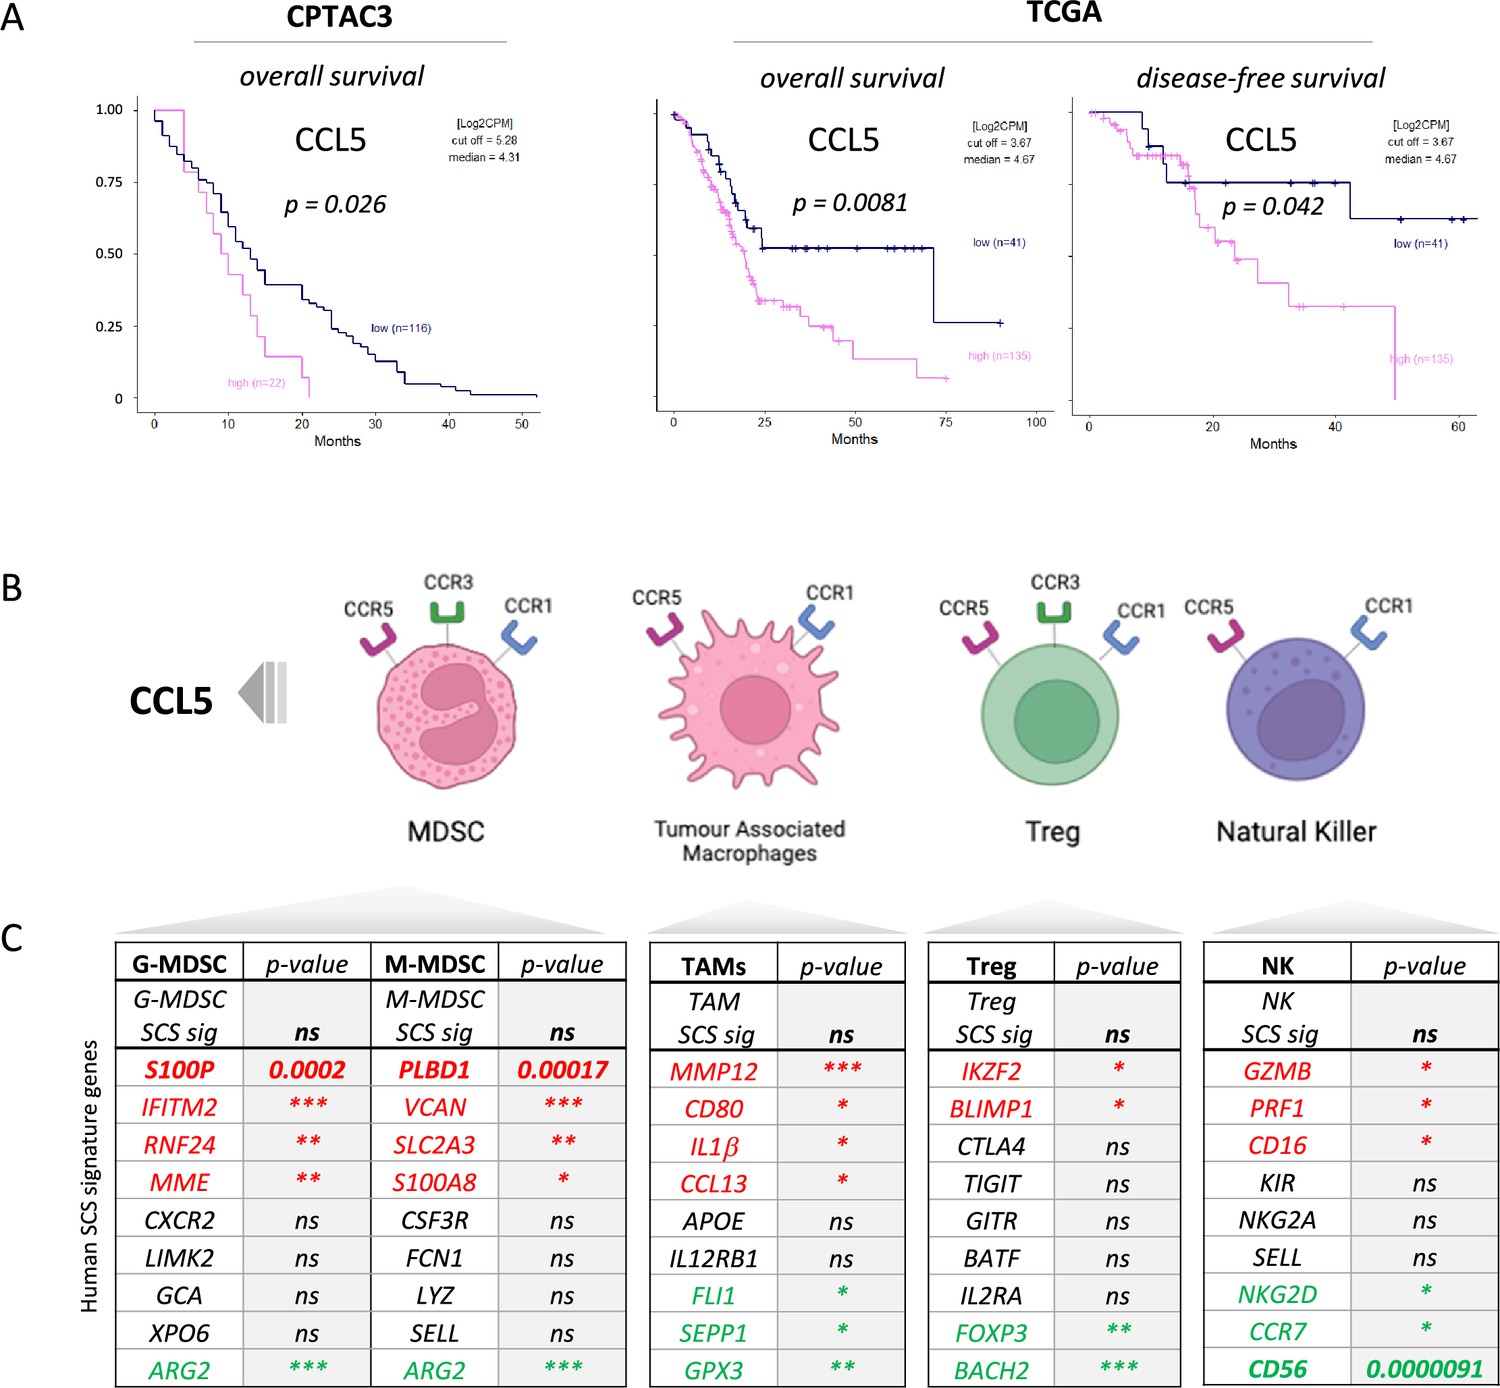
CCL5 is clinically significant in pancreatic cancer.
(A) Overall and disease-free Kaplan-Meier survival plots of pancreatic ductal adenocarcinoma (PDAC) patients segregated into high or low CCL5 gene expression levels within pancreatic tumors. Data are derived from CTPAC3 and TCGA cohorts and optimal cut-off values were calculated using the max-stat method for each respective cohort. (B) Schematic overview of CCL5-responsive immune cells and corresponding CCL5 receptor repertoire expression. (C) Correlation between overall and single-cell gene signatures of CCL5-responsive immune cells with overall PDAC prognosis. Color depicts positive (green), negative (red), or neutral (black) prognostic outcomes (*p<0.05, **p<0.01, ***p<0.005). Data are derived from the Pathology Dataset of the Human Protein Atlas and based on human tissue micro arrays and correlated log-rank p-value for Kaplan-Meier analysis αPD1/CCR5i/IR (n=8).
Figure 1—figure supplement 1
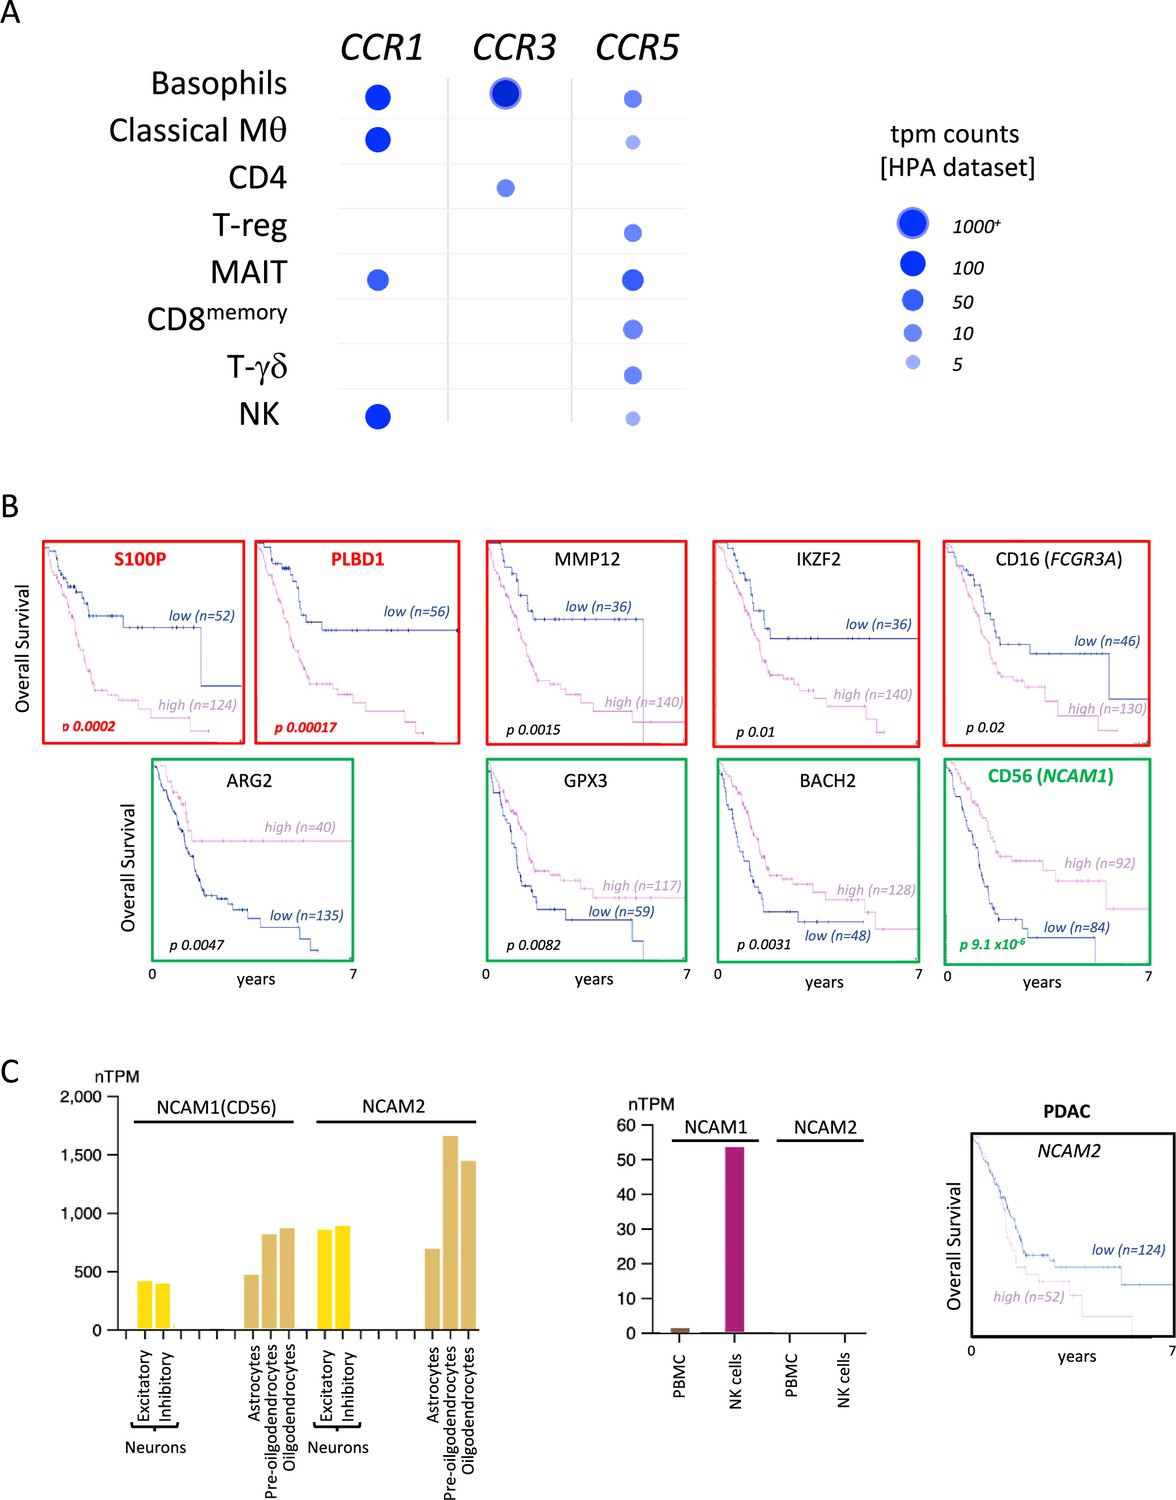
CCL5 receptors are distributed across different immune cells.
(A) Human Protein Atlas-derived single-cell RNA-seq data of immune cells and relative CCL5 receptor expression. (B) Overall Kaplan-Meier survival curves of pancreatic ductal adenocarcinoma (PDAC) patients (derived from TCGA cohorts) correlated to single specific immune gene signatures with the most opposing correlations (as shown in Figure 1C). Color depicts positive (green) or negative (red) correlations. (C) Normalized expression of NCAM1, encoding neural cell adhesion molecule 1 (more commonly known as CD56); and NCAM2, encoding neural cell adhesion molecule 2, in different cells from the brain and immune cells. Data are derived from the Human Protein Atlas-derived single-cell RNA sequencing dataset (left). Overall Kaplan-Meijer survival curve of PDAC does not significantly correlate with NCAM2 expression (right).
Figure 2 with 1 supplement
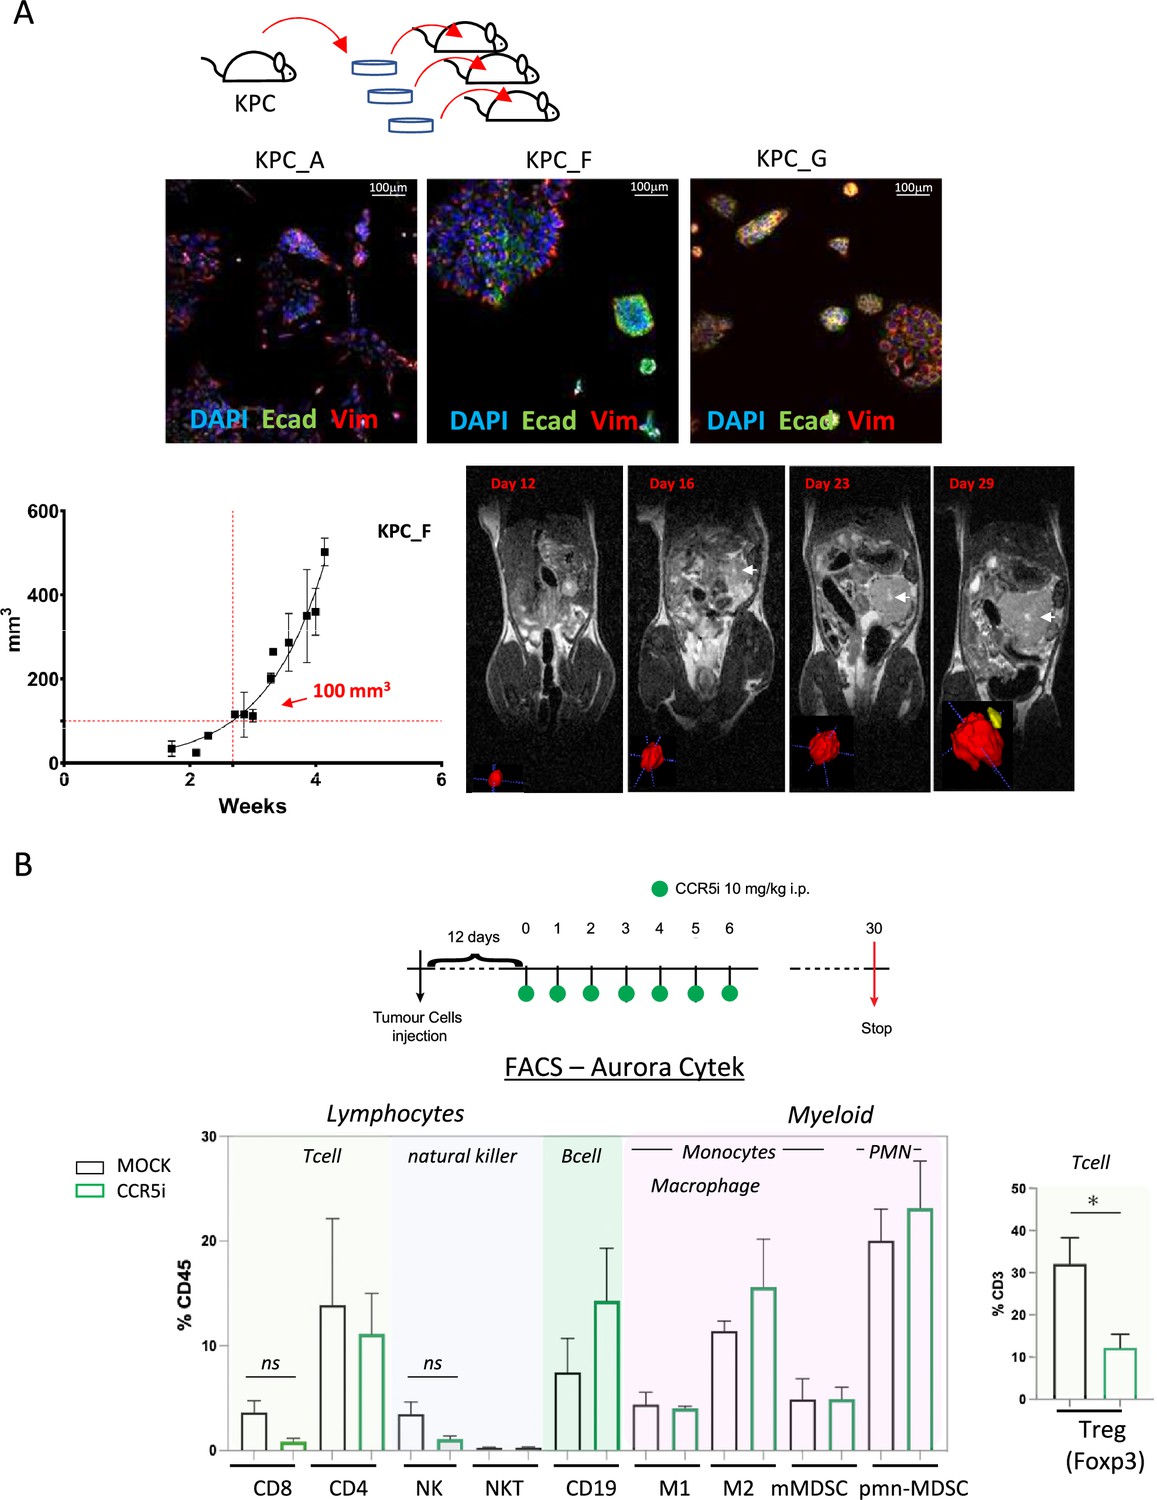
CCR5i restricts Tregs in a pancreatic ductal adenocarcinoma (PDAC) orthotopic tumor model.
(A) Three different lineages of KPC pancreatic tumor cells (derived from KrasG12Dp53R172HPdx1-Cre mice) were obtained and stained for DAPI (blue; nucleus), E-cadherin (green; epithelial), and vimentin (red; mesenchymal). Growth curve of orthotopically injected KPC-F cells (500cells) into the pancreas of wildtype C57BL/6 over time in weeks. Tumor volume was measured using MRI. Representative MRI images over time are displayed, white arrow denotes tumor mass. (B) Timeline of maraviroc (CCR5 inhibitor [CCR5i]) treatment regimen. A total of 12 days post-orthotopic injection, tumor-bearing mice were treated daily with maraviroc (10 mg/kg via intraperitoneal injection) for 6 days and followed for up to 30 days after starting treatment. Frequencies of pancreatic tumor-infiltrating immune cells harvested at day 30 with or without maraviroc using spectral flow cytometry are shown. Data are represented as mean percentage positive cells of Live/CD45+ cells ± SD. For Tregs, the mean percentage positive cells of Live/CD45+ CD3+ cells ± SD are shown. Significance was tested using the Welch and Brown-Forsythe ANOVA for parametric data or Kruskal-Wallis test for non-parametric data. Mock (n=6), IR (n=3), aPD1 (n=8), aPD1+IR (n=8), CCR5i (n=3), CCR5i+IR (n=8), aPD1+CCR5i (n=5), αPD1/CCR5i/IR (n=8). *p<0.05.
Figure 2—figure supplement 1
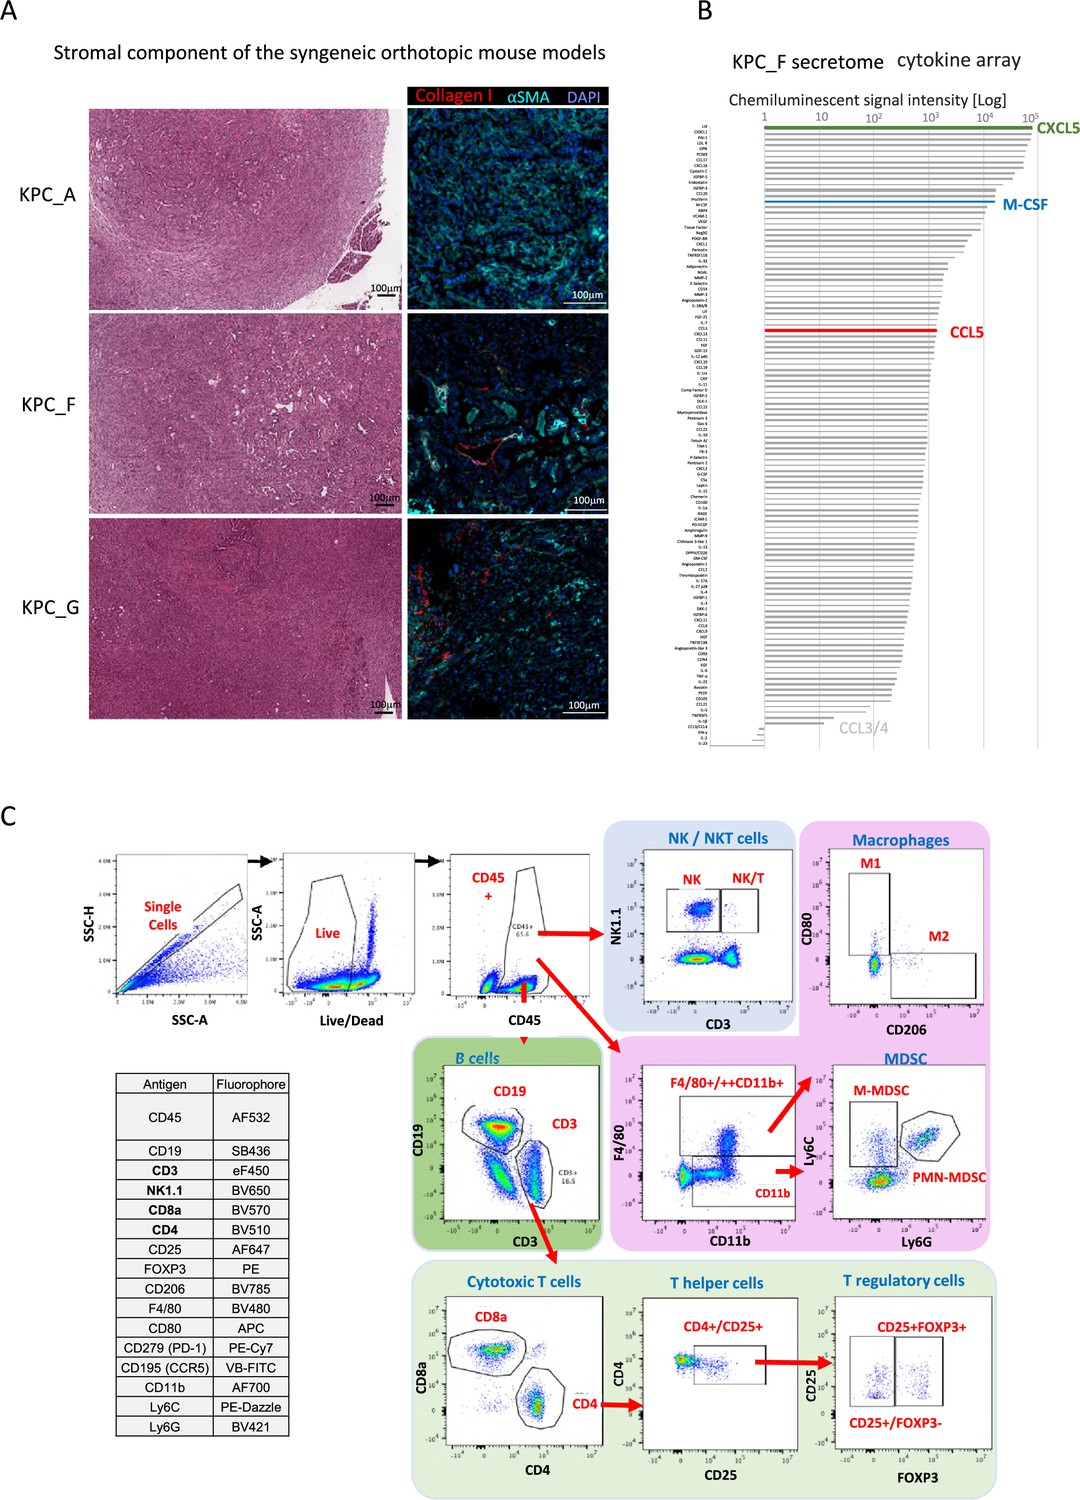
Set up for the mouse orthotopic model immune monitoring.
(A) Representative H&E staining of pancreatic tumors derived from orthotopically injected KPC-A, KPC-F, and KPC-G cells 30 days post-injection (left). Representative immunofluorescence of KPC_A, KPC_F, and KPC_G in vitro cultured cells stained with DAPI (blue; nucleus) and stromal markers (Collagen I; red, αSMA; cyan). (B) Chemiluminescent cytokine array for KPF_F cell line. (C) Optimized panel for immune profiling using multispectral flow cytometry (Aurora Cytek) and gating strategy of respective cells as shown in Figure 2B.
Figure 3 with 1 supplement
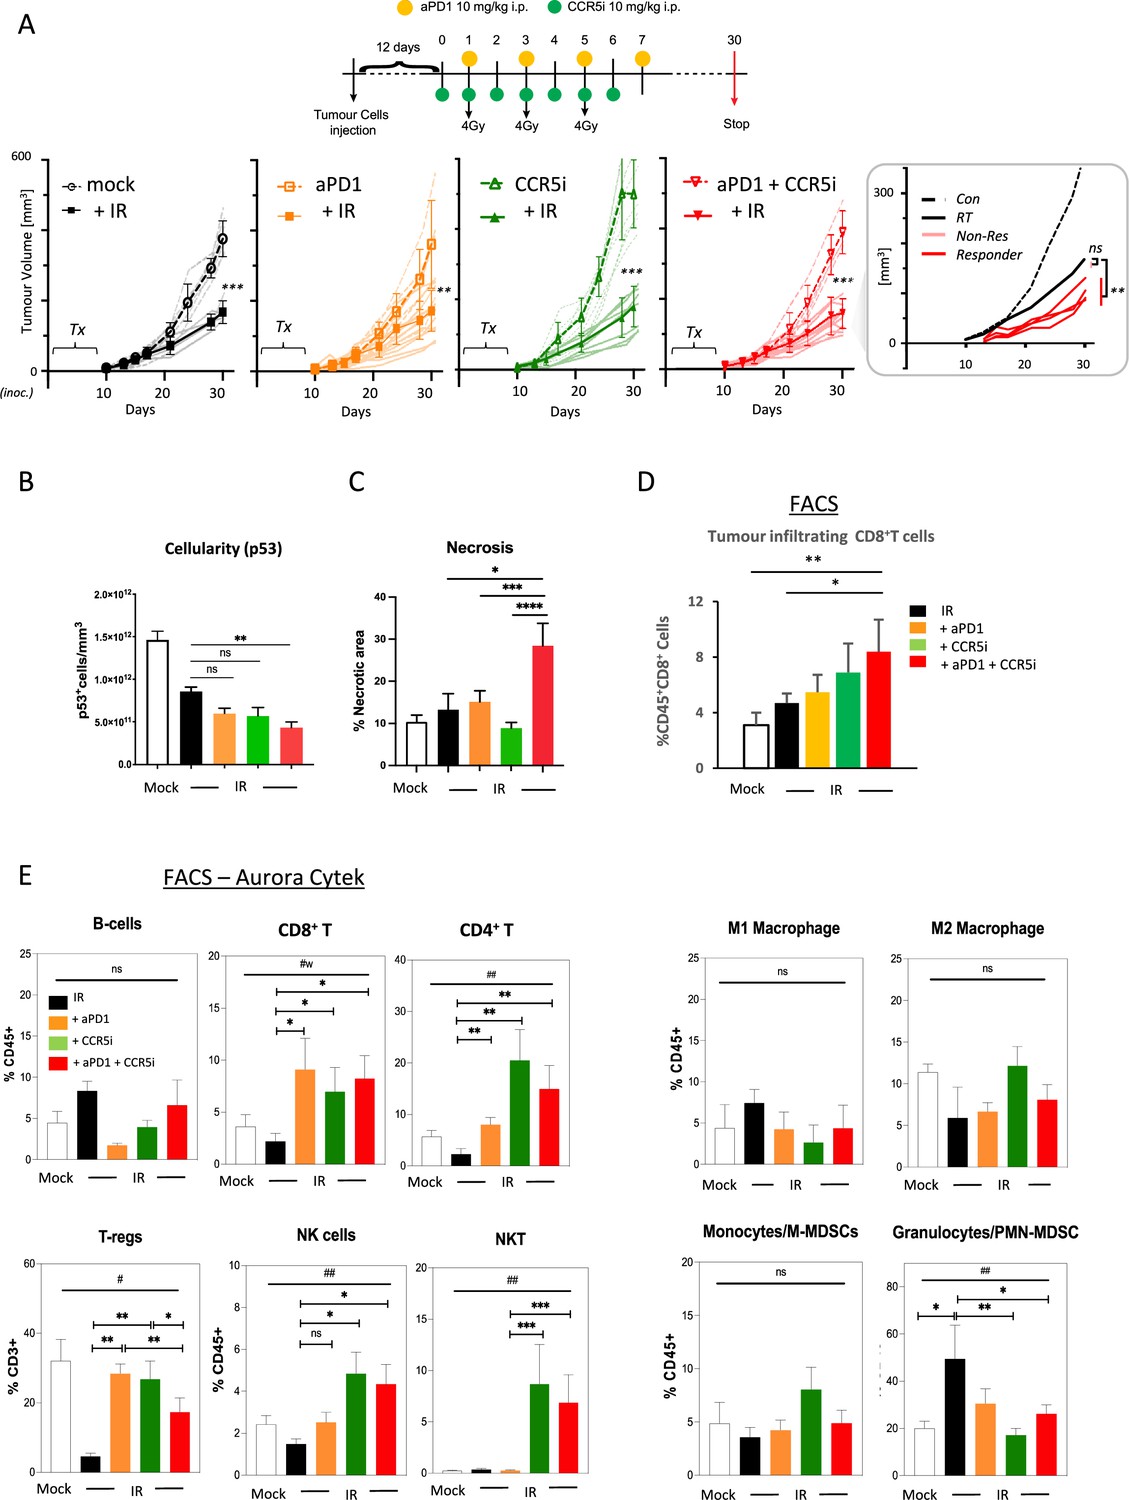
Immune profiling of pancreatic ductal adenocarcinoma (PDAC) orthotopic tumours in response to therapy.
(A) Timeline of triple treatment regimen (maraviroc, αPD1, and radiotherapy) following orthotopic injection of KPC-F cells. A total of 12 days post-orthotopic injection of 500 KPC-F cells in the pancreas of wildtype C57BL/6 mice, mice were treated as follows: 7 consecutive days of 10 mg/kg intraperitoneal injection of maraviroc and 4 alternating days of 10 mg/kg intraperitoneal injection of αPD1. Mice were followed for up to 30 days following the start of the treatment regimen. Tumor volumes were measured by MRI and growth curves of individual treatment groups are plotted with or without radiotherapy as measured by MRI. Average growth curves ± SD are depicted in bold, individual mice are shaded (without IR; dashed, with IR; solid). Insert: expanded view of triple combination to show ‘responders’ display a significant benefit over RT alone. (B) Quantification of pancreatic tumors derived from (A) stained by IHC for p53. (C) Quantification of necrotic areas in pancreatic tumors derived from (A) based on H&E staining. (D) Quantification of infiltrating CD8 T-cells in pancreatic tumors derived from (A) by flow cytometry. (E) Profiling of infiltrating immune cells in pancreatic tumors derived from (A) by flow cytometry as in Figure 2B. Single, live cells were included for analysis and are represented as frequencies of Live/CD45+ cells or total CD3+ for FoxP3+ Tregs. Significance was tested using the Welch and Brown-Forsythe ANOVA for parametric data. #p<0.05, ##p<0.01, or Kruskal-Wallis test for non-parametric data #p<0.01; pairwise comparisons (Student’s t-test). *p<0.05, **p<0.01, ***p<0.005, ****p<0.001.
Figure 3—figure supplement 1
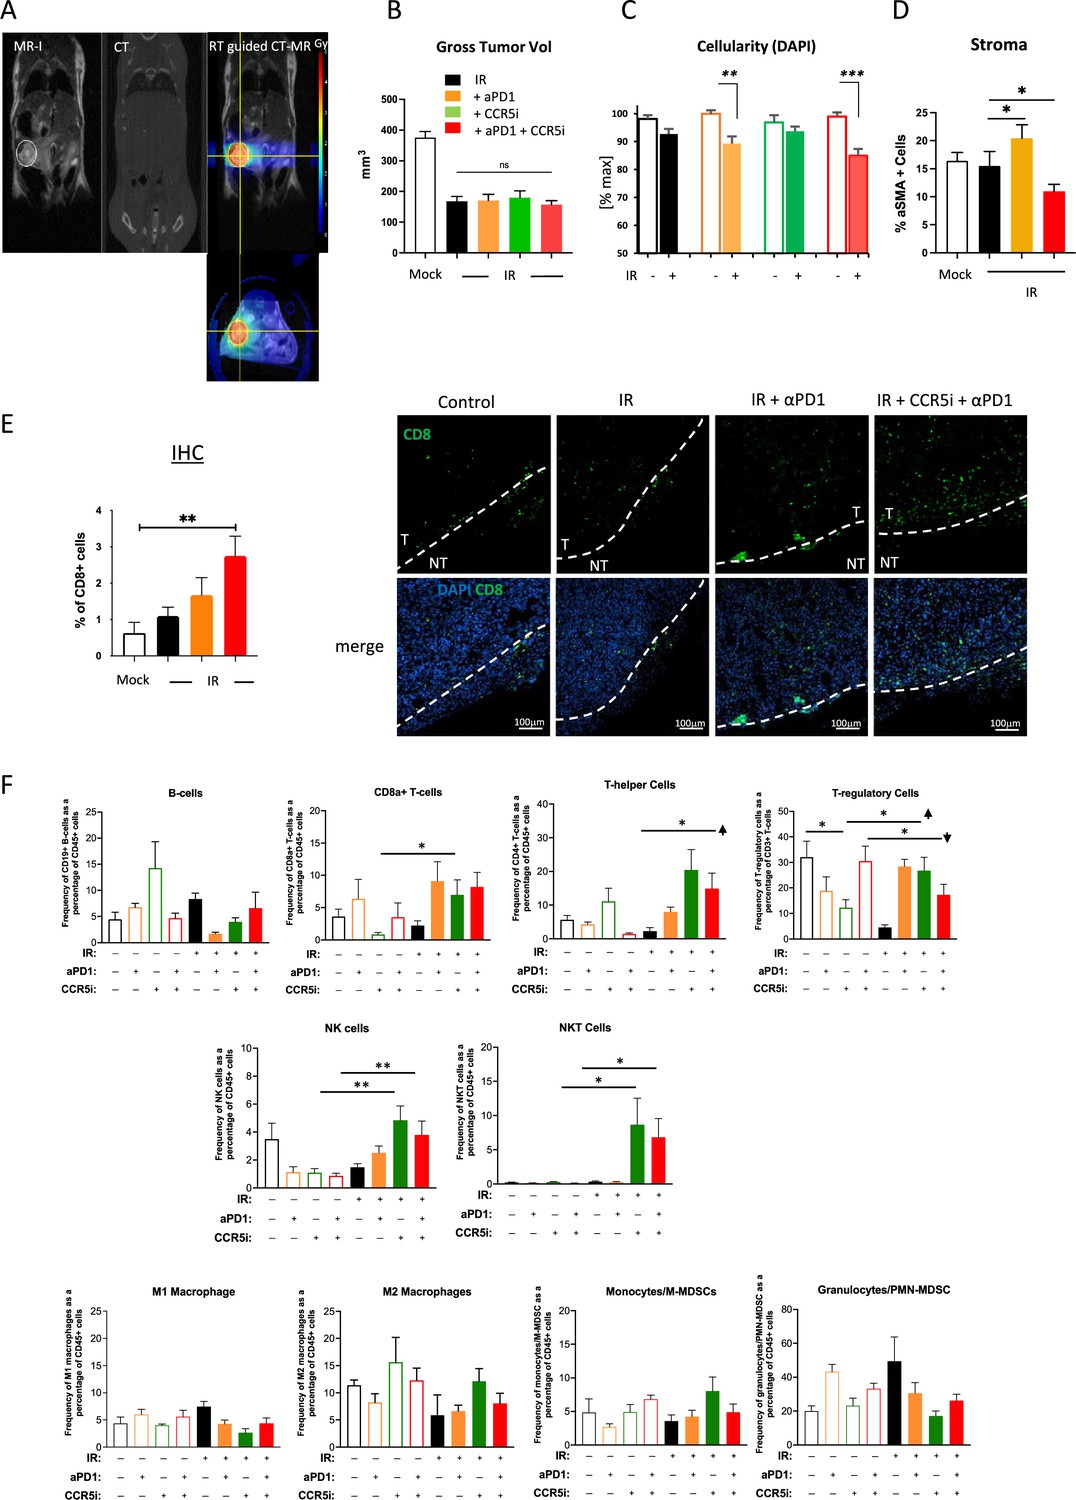
Accessory data to support pancreatic ductal adenocarcinoma (PDAC) tumour model immune monitoring.
(A) Representative images of cross-sectional anatomy of a mouse abdomen, obtained through respiratory gated MRI (left), SARRP (center; labeled CT), and an overlay of the MRI and CT images for tumor-specific dosage of 4 Gy (right). (B) Gross tumor volume at day 30 post-treatment as measured by MRI of mice as treated in Figure 3A. Data are represented as mean tumor volume ± SD. (C) Quantitative measurement of DAPI+ cells based on H&E staining of mice treated as in Figure 3A. (D) Percentage of αSMA+ cells based on IHC. (E) Quantification of IHC slides showing the percentage of CD8+ T-cell infiltrating the tumor (left). Tumor borders are marked as dashed lines. T=tumor, NT=non-tumor (right). (F) Profiles of infiltrating immune cells in pancreatic tumors by all treatments including single control treatments as measured by Aurora Cytek. Single, live cells were included for analysis and represented as frequencies of CD45+ cells in percentage. *p<0.05, **p<0.01, ***p<0.005.
Figure 4 with 1 supplement
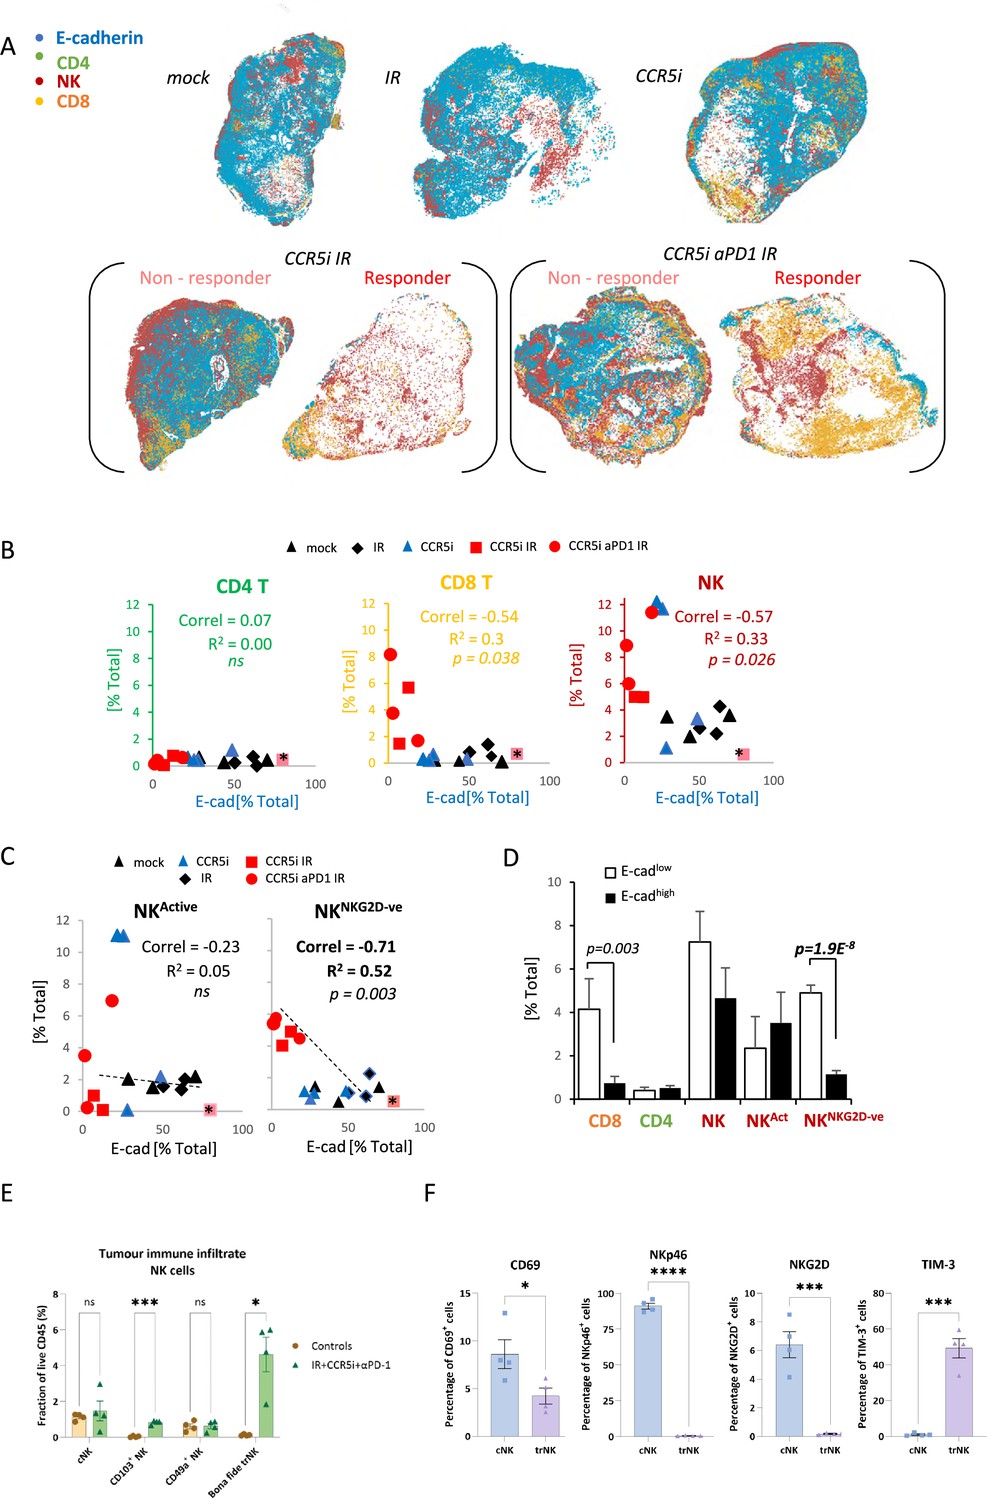
Non-cytotoxic natural killer (NK) cells associate with tumor control.
(A) Spatial plots of individual cells identified using HALO software of scanned multiplex immunofluorescence murine orthotopic pancreatic tumor slices. Positive staining is identified as the marker of interest and DAPI+ (nucleus stain) signal. Responders and non-responders to treatment are based on loss of E-cadherin staining. (B) Correlations of total CD4 T (CD3+CD8-), CD8 T (CD3+CD8+), and NK cells (CD3-NK1.1+) plotted against %positive E-cadherin+ cells as derived from (A). (C) Correlation of %positive segregated NK cells plotted against %positive E-cadherin+ cells as derived from (A). K cells were segregated based on expression of NKG2D; NKActive; NK1.1+NKG2D+; NKNKG2D-ve; NK1.1+NKG2D-. (D) Intra-tumoral immune cells of stratified pancreatic tumors based on low or high E-cadherin percentage (cut-off: 20%). Significance was tested for p<0.05 with a two-tailed Student’s t-test. *Censored non-responder. (E) Proportion of infiltrating tissue-resident NK (trNK) (Live/CD45+CD3-CD19-NK1.1+CD103+CD49a+), conventional NK cells (Live/CD45+CD3-CD19-NK1.1+CD103-CD49a-), CD103+ NK, and CD49a+ NK cells isolated from orthotopic pancreatic tumors of mice treated with the IR+IT regimen and controls, as a percentage of CD45+ cells. Significance was tested for p<0.05 with a Student’s t-test. (F) Comparative surface expression of activation marker (CD69), activating receptors (NKp46, NKG2D), and exhaustion marker (TIM-3) on conventional NK (cNK) cells and trNK cells isolated from orthotopic pancreatic tumors. Significance was tested for p<0.05 with a Student’s t-test. *p<0.05, ***p<0.005, ****p<0.001.
Figure 4—figure supplement 1
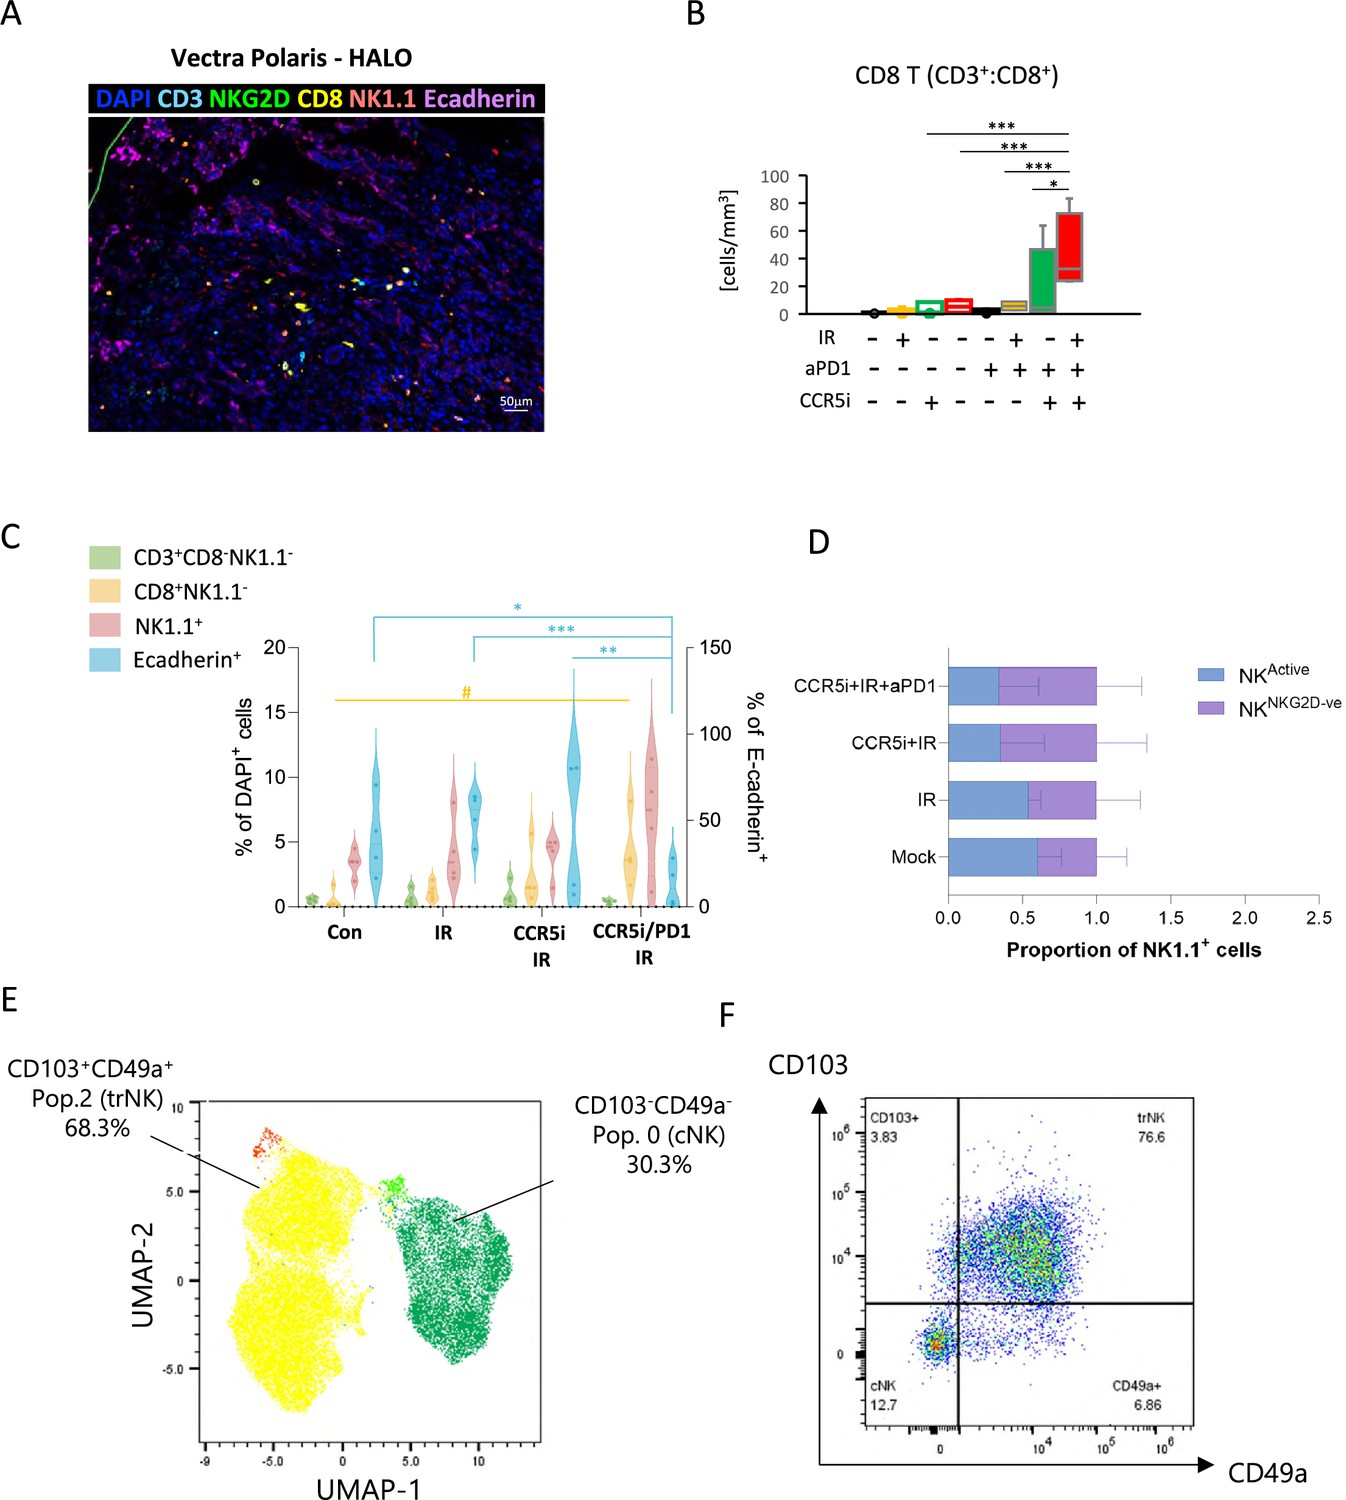
Identification of a tissue-resident natural killer (trNK) population in mice.
(A) Representative image of a multiplex immunofluorescence staining of a pancreatic tumor. (B) Quantification of CD8+ cells (identified as DAPI+CD3+CD8+) across the different treatment groups. Markers are as indicated. Significance was tested for p<0.05 with a two-way ANOVA, *p>0.05, ***p>0.005. (C) Percentages of total DAPI+ immune cells (left) and E-cadherin+ tumor cells (right) derived from Figure 4A following treatment. Significance was tested using two-way ANOVA with Tukey multiple comparison (blue significance lines), or one-way ANOVA with Tukey multiple comparison (yellow significance lines) using a p<0.05. (D) Percentage of NKG2D+ and NKG2D- cells as a proportion of NK1.1+ cells as derived from Figure 4A. (E) Uniform manifold approximation and projection (UMAP) of intra-tumoral natural killer (NK) cells (NK1.1+CD3-CD19-) in mice treated with the IR/CCR5i+αPD1 combination. (F) Representative example of gating strategy for the identification of tissue-resident (CD103+CD49a+) and conventional (CD103-CD49a-) NK cells. (G) Proportion of trNK, conventional NK (cNK), CD103+ NK, and CD49a+ NK in mice treated with the IR+IT regimen and control (mock), as a fraction of total NK cells.
Figure 5 with 1 supplement
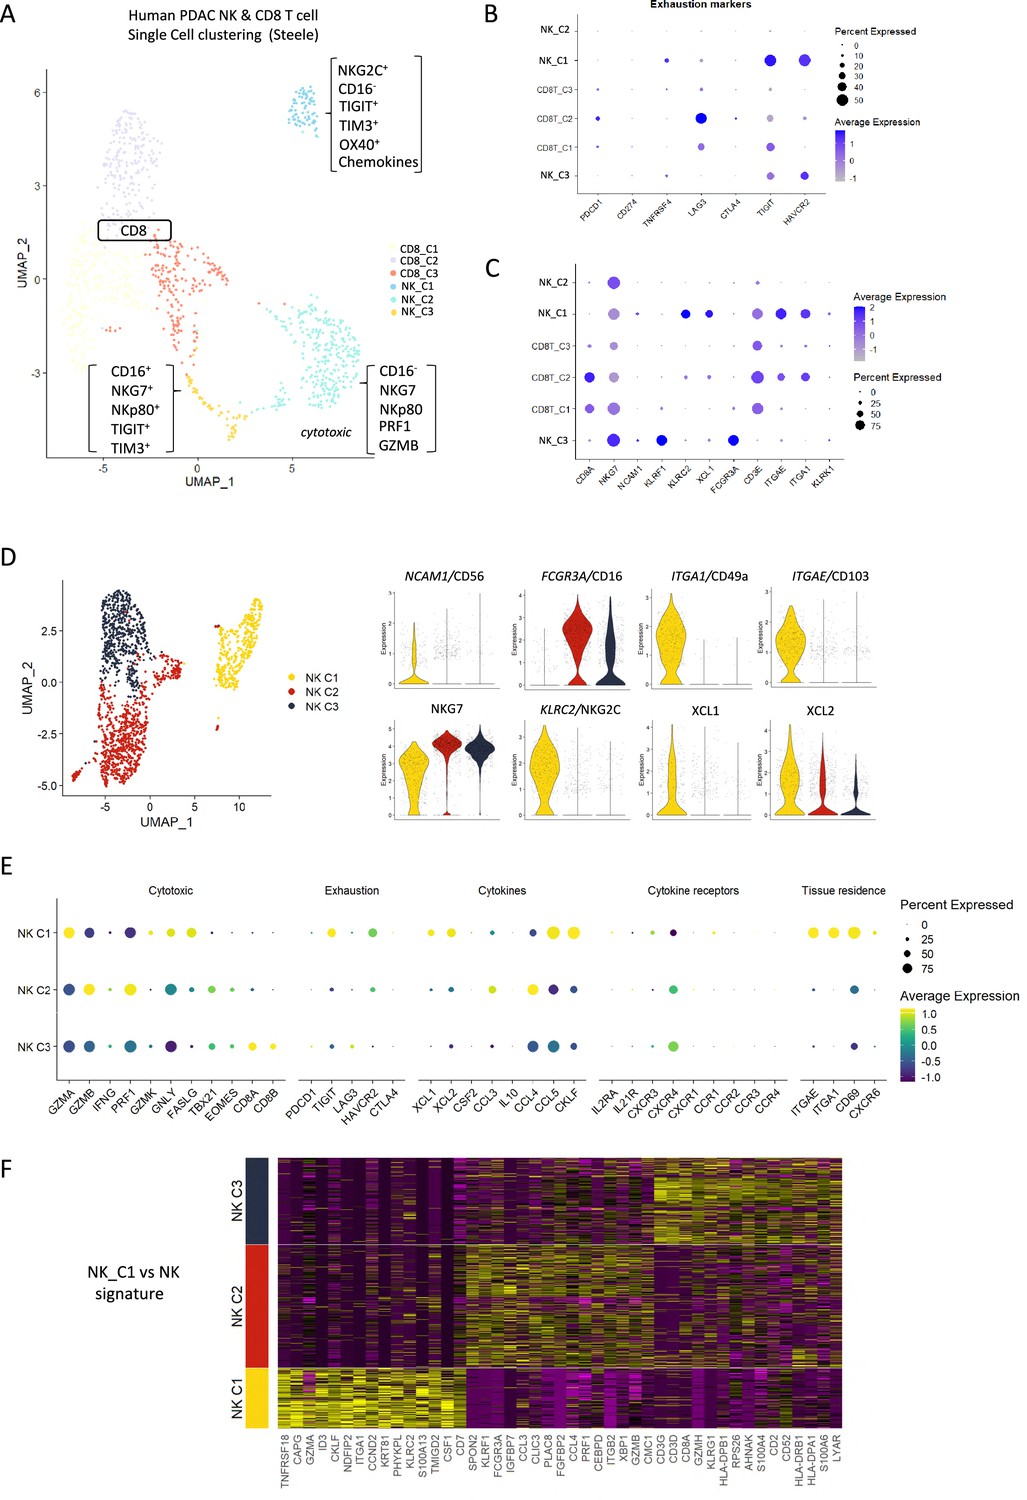
Identification of a tissue-resident natural killer (trNK) signature from single cell data of pancreatic ductal adenocarcinoma (PDAC) patients.
(A) Uniform manifold approximation and projection (UMAP) of the CD8+ T and natural killer (NK) sub-clusters from Steele et al. (B) Dot plot showing the expression of exhaustion-related genes across CD8+ T- and NK cell sub-clusters. (C) Dot plot showing highly expressed genes for each sub-cluster. (D) UMAP of the three NK sub-clusters (left), and violin plots comparing the expression of NK subtype-associated genes between the sub-clusters (right). (E) Dot plot showing the different gene expression programs across the three NK sub-clusters. (F) Heatmap showing the top 15 upregulated markers for each NK sub-cluster compared against total NK cluster.
Figure 5—figure supplement 1
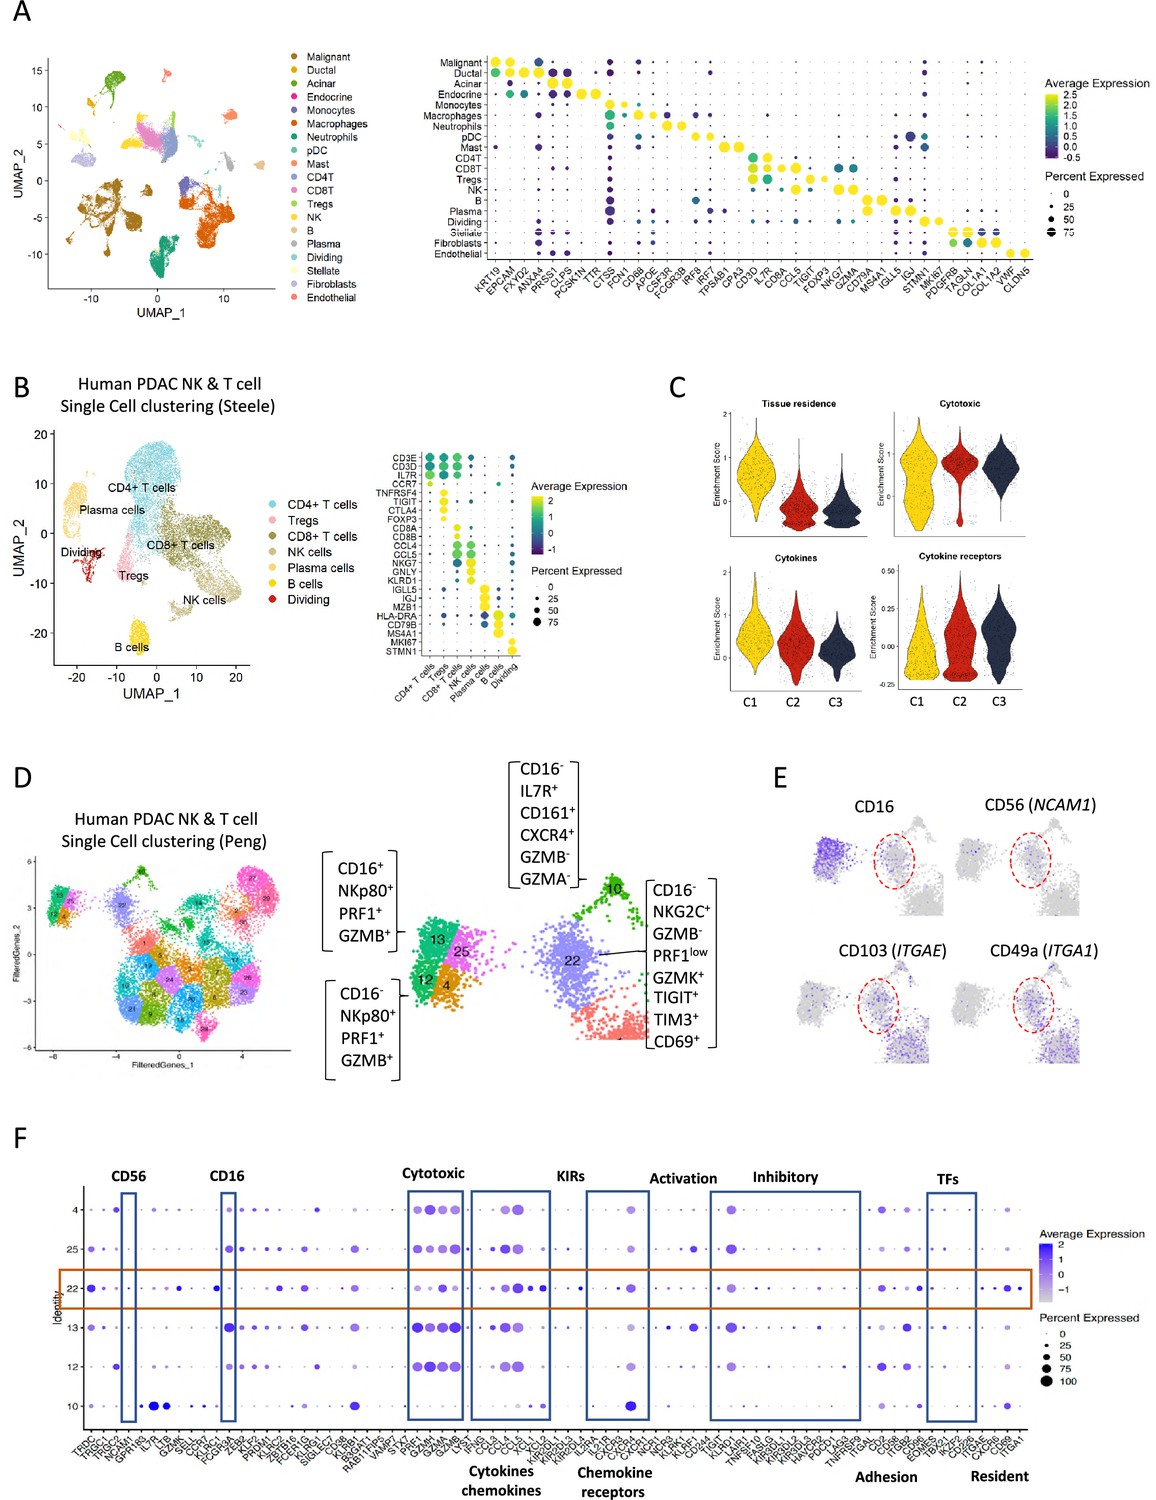
Human single cell data indicating a non-cytotoxic population of natural killer (NK) cells.
(A) Uniform manifold approximation and projection (UMAP) of the main cell types from the integrated single-cell RNA sequencing (scRNA-seq) Steele dataset (left) and dot plot showing canonical marker expression for each respective cell type (right). Color indicates average normalized expression; dot size represents percentage of cells of each cell type expressing the respective gene. (B) UMAP plot of lymphocyte sub-clusters from the Steele dataset (left) and their marker expressions (dot plot, right). (C) Violin plots showing NK-related gene signatures for each NK sub-cluster. (D) UMAP plot of lymphocyte sub-clusters from the Peng dataset, with the arrows representing the proposed functional development. (E) UMAP showing the expression levels of CD16(FCGR3a), CD56 (NCAM1), CD103 (ITGAE), and CD49a (ITGA1) across the NK sub-clusters. (F) Dot plot showing the different gene expression programs across the NK sub-clusters from the Peng dataset.
Figure 6 with 1 supplement
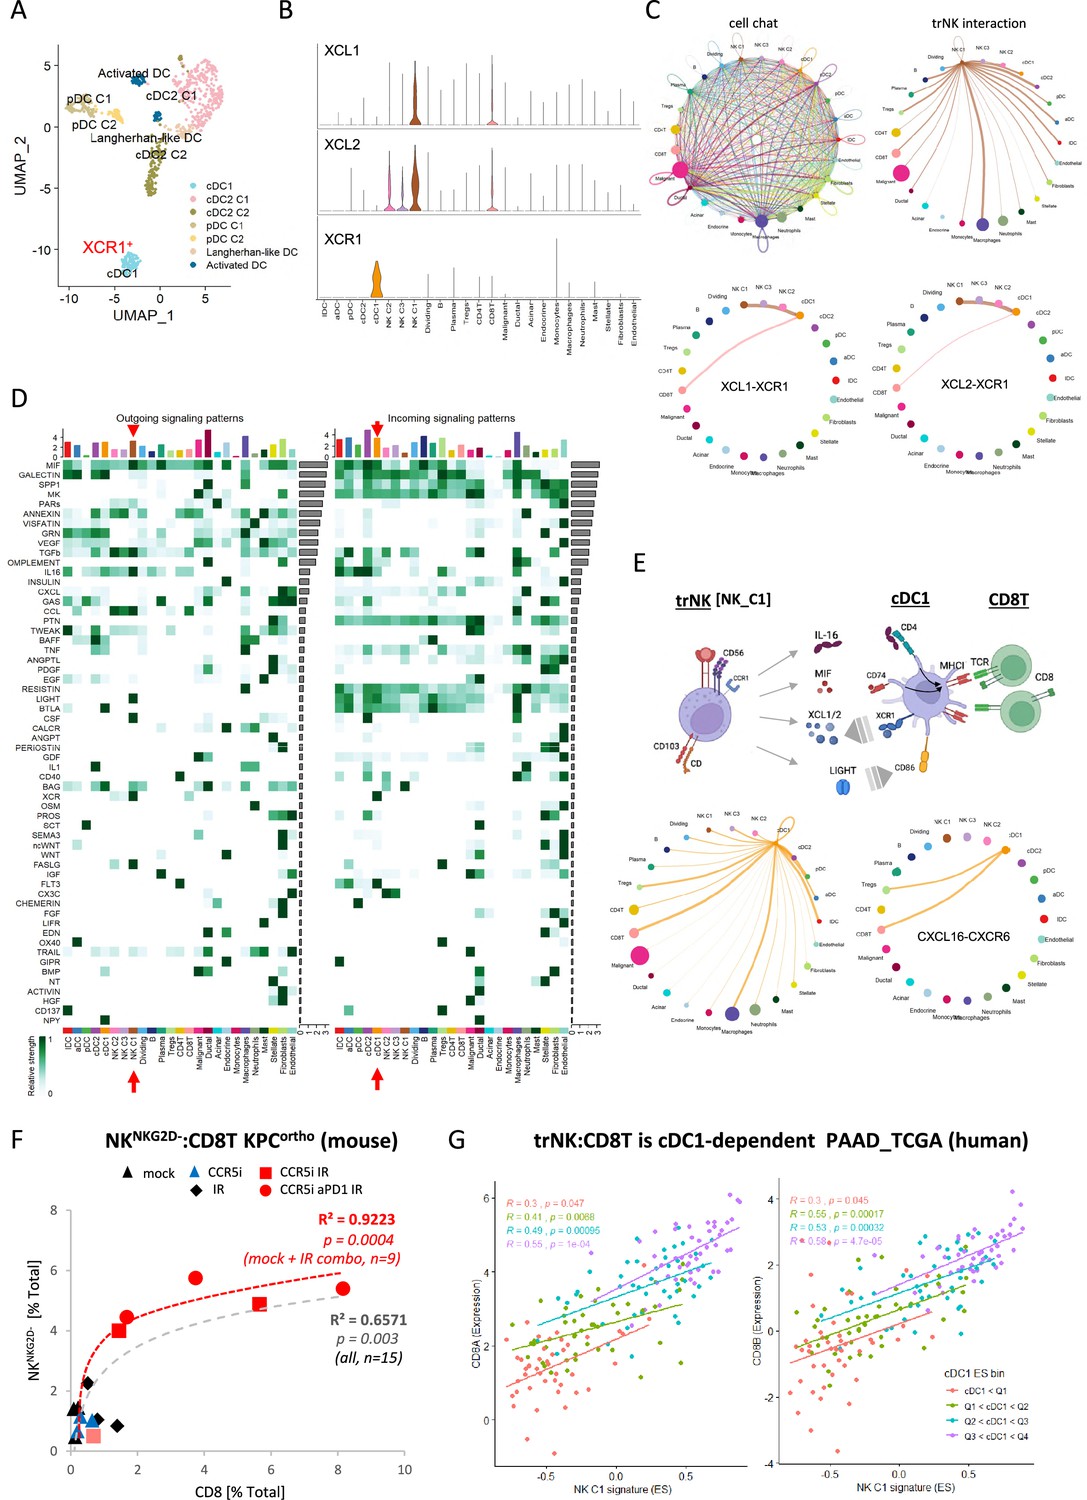
CellChat communication indicates tissue-resident natural killer (trNK) communicate directly to cDCs.
(A) Uniform manifold approximation and projection (UMAP) of the dendritic cell sub-clusters from the Steele dataset. (B) Violin plot showing the expression of XCL1, XCL2, and XCR1 across all cell types. (C) Circle plots showing interactions across all cell types (top left), signals coming from the tissue-resident natural killer (trNK) cells (top right), the XCL1-XCR1 interaction (bottom left), and the XCL2-XCR1 interaction (bottom right). The width of edges represents the communication strength. (D) Heatmap showing the summary of secreted signaling communications of outgoing (left) and incoming (right) signals. The color bar represents the communication strength, and the size of the bars represents the sum of signaling strength for each pathway or cell type. (E) Schematic overview of the trNK to type 1 conventional dendritic cell (cDC1) and cDC1 to CD8 T-cell communication axis (top). Circle plots of all outgoing signals from cDC1 (bottom left) and the CXCL16-CXCR6 signaling (bottom right). (F) Correlation of HALO data on total NKNKG2D-ve NK cells (CD3-NK1.1+NKG2D-) with CD8 T-cells (CD3+CD8+) from stained sections of treated KPC_F orthotopic tumors, R2 and p-values indicate positive correlation across all tumors (gray, n=15) or limited to mock, CCR5i+IR and IR/CCR5i/αPD1 combination (red, n=9). (G) Correlation of trNK signature with CD8A (left) or CD8B (right) in bulk RNA-seq from TCGA_PAAD and binned into quartiles based on extent of cDC1 involvement as assumed by cDC1 signature (Figure 6—source data 1).
-
Figure 6—source data 1
Gene signatures for trNK and cDC1.
- https://cdn.elifesciences.org/articles/92672/elife-92672-fig6-data1-v1.xlsx
Figure 6—figure supplement 1
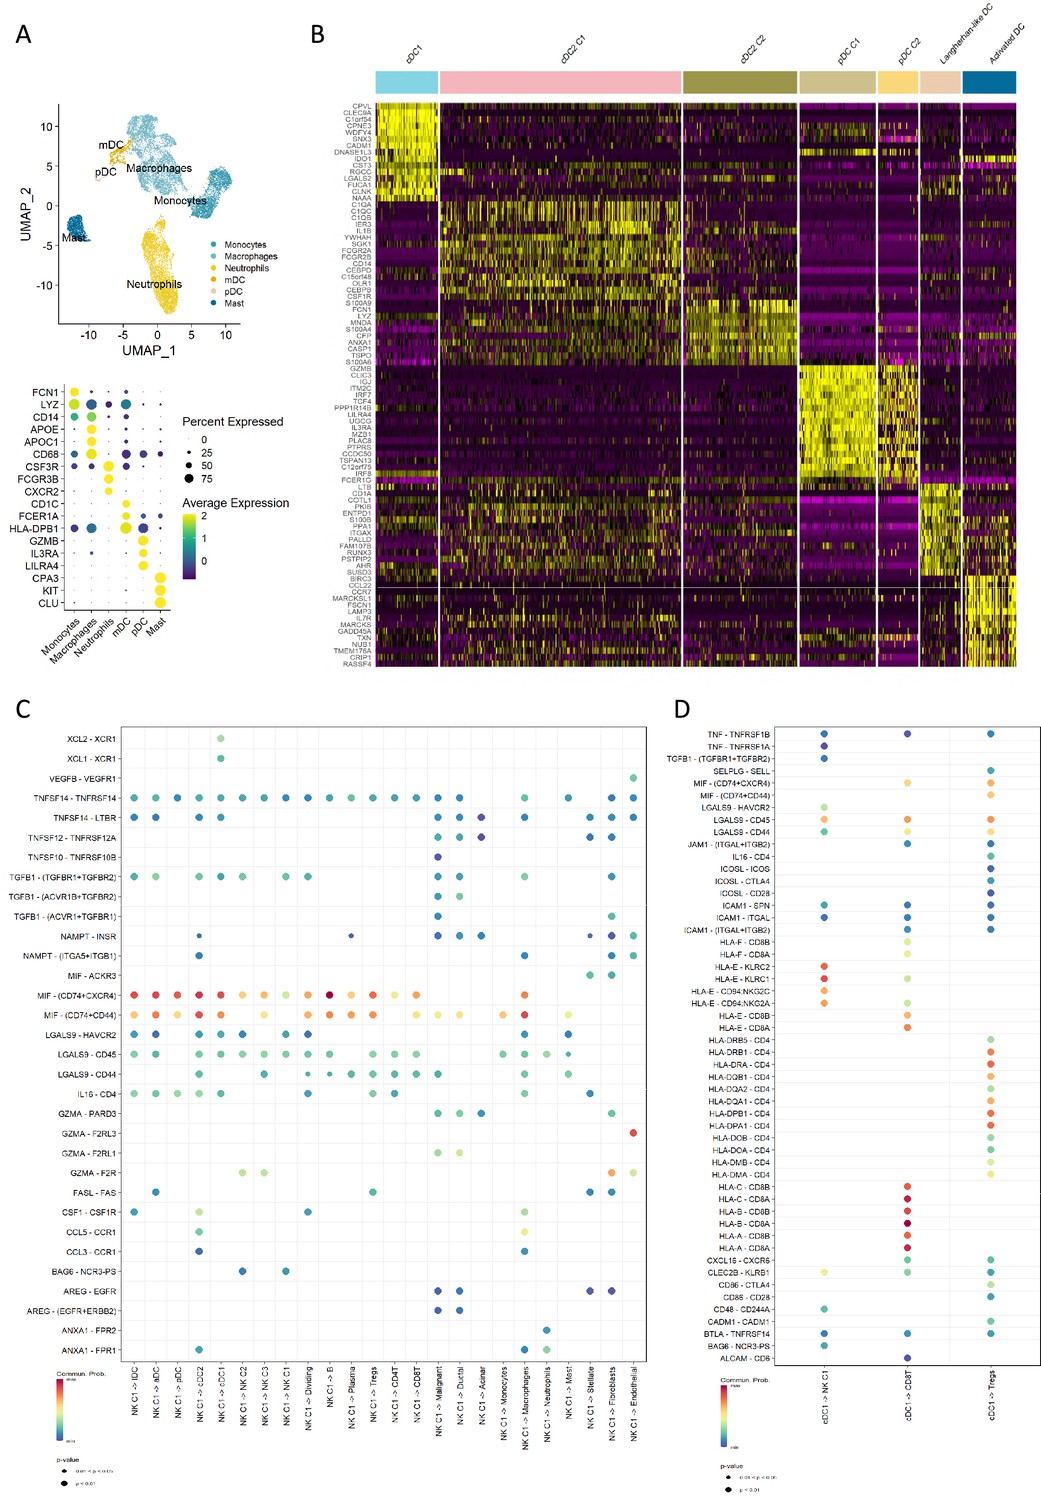
Profiling of dendritic cells indicates specific communication.
(A) Uniform manifold approximation and projection (UMAP) of the myeloid cell types from the Steele dataset (top) and the dot plot showing the canonical cell markers (bottom). (B) Heatmap of the top 15 markers for each DC sub-cluster. (C) Dot plot showing the estimated outgoing secreted signals from the natural killer (NK) C1 cell population. (D) Dot plot showing the estimated secreted and cell-cell contact signals from the type 1 conventional dendritic cell (cDC1) cell population. Color of the dots represents the communication probability, and the size of the dot represents the significance level.
Figure 7 with 1 supplement
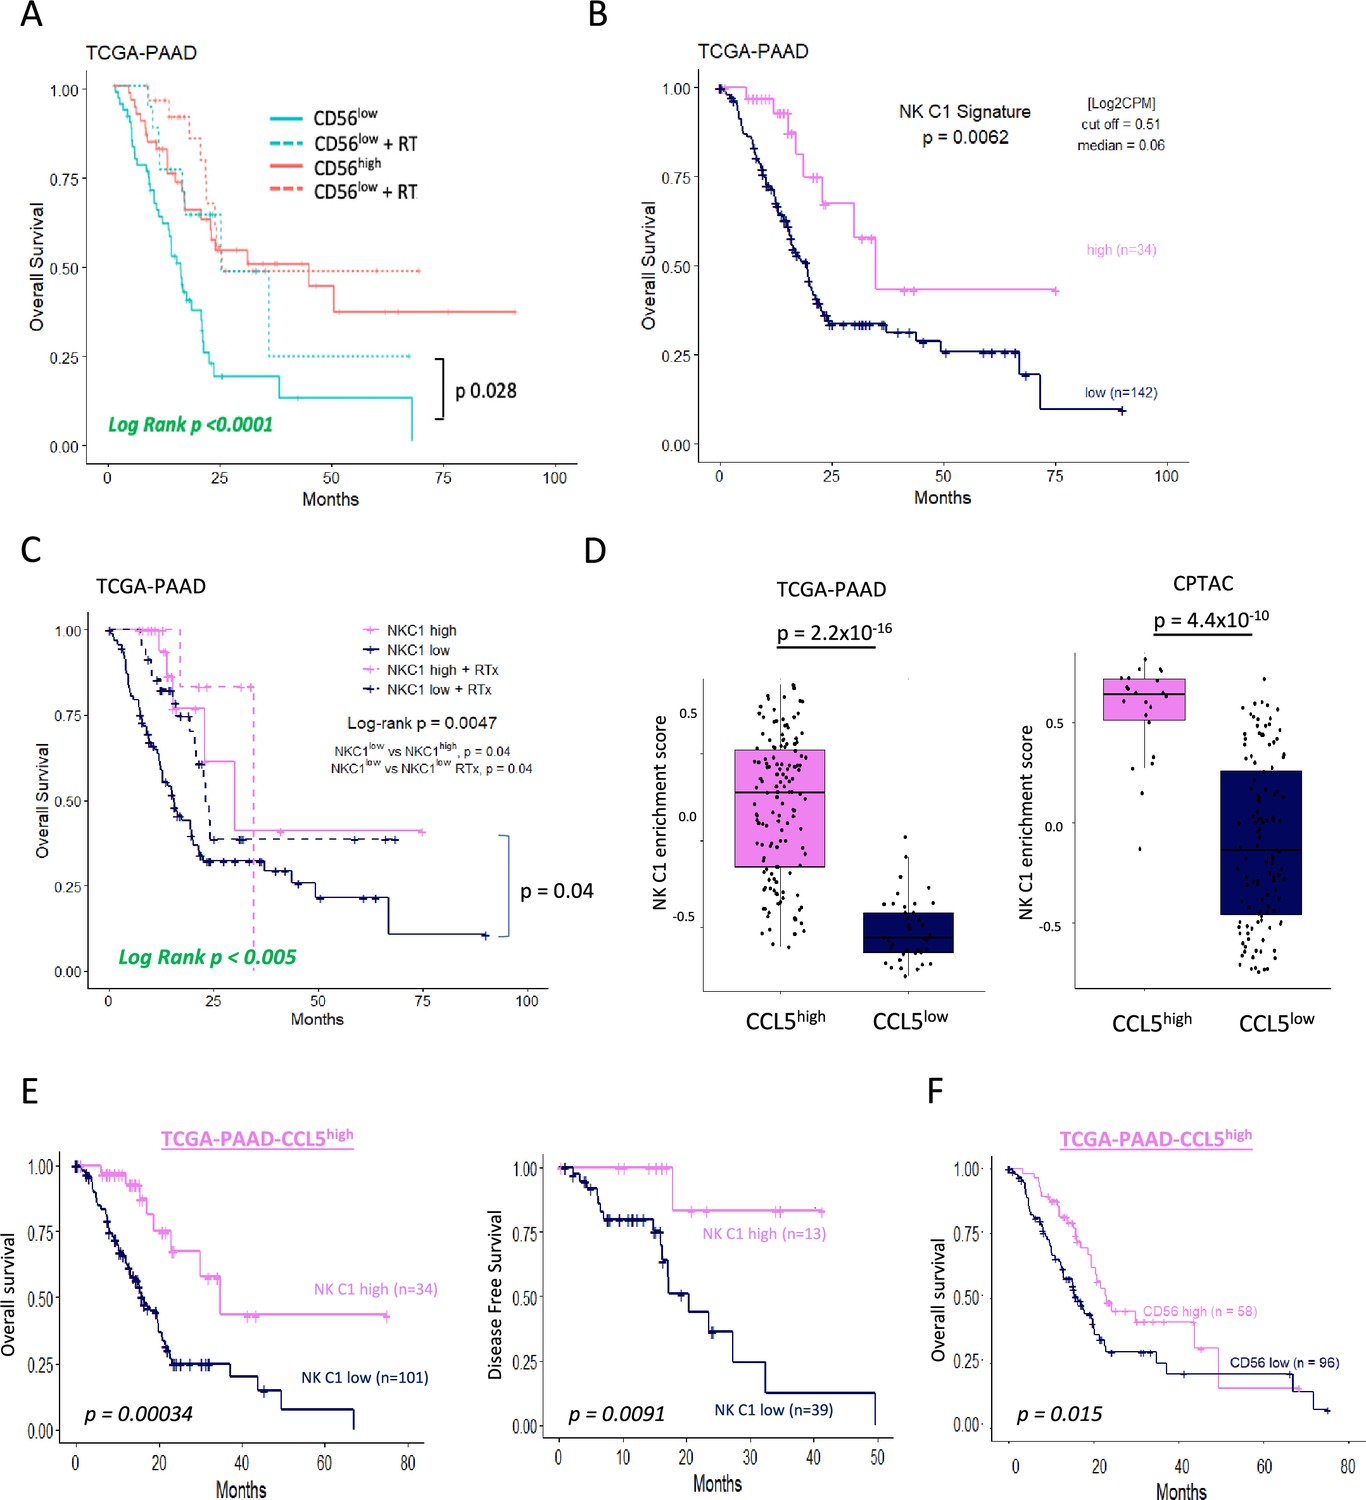
Tissue-resident natural killer (trNK) associate with better survival in pancreatic ductal adenocarcinoma (PDAC).
Figure 7—figure supplement 1
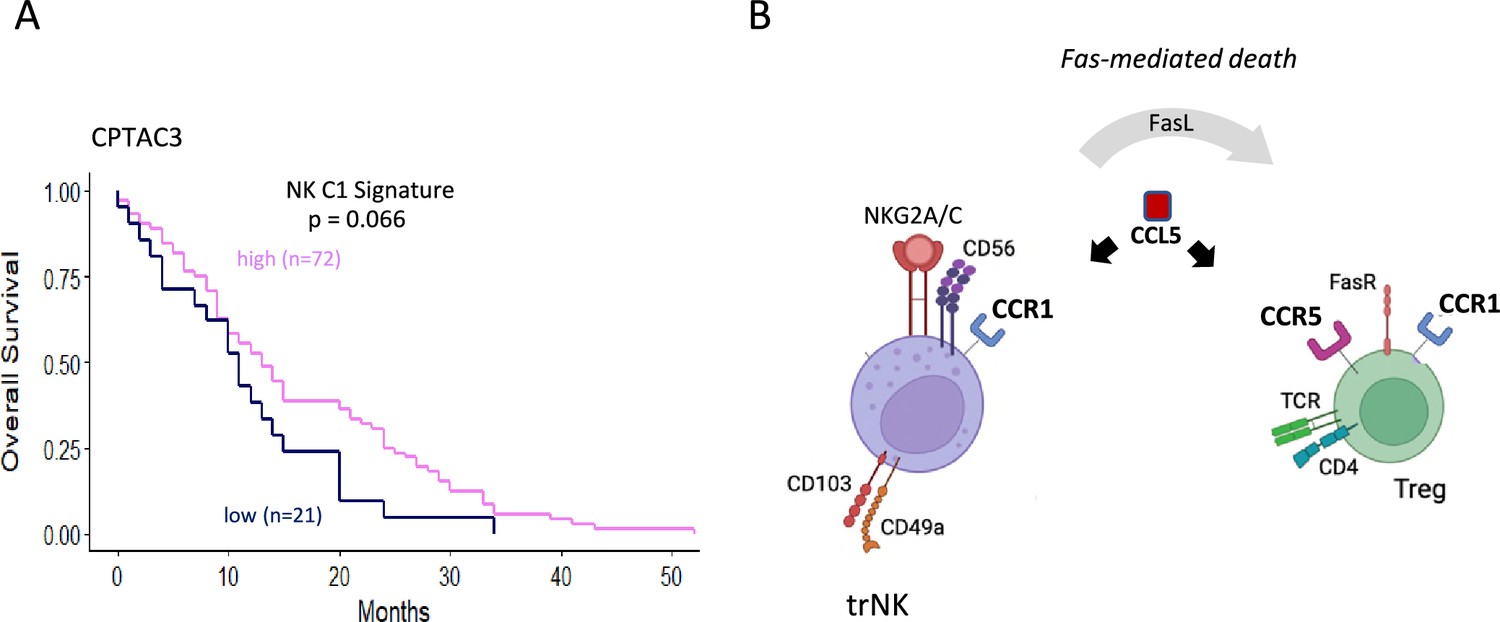
Model for CCL5 mediated recruitment of immune cells in the presence of CCR5i.
(A) Tissue-resident natural killer (trNK) cell (NK_C1) signature and overall survival in pancreatic ductal adenocarcinoma (PDAC) using the CPTAC3 dataset. (B) Schematic overview of proposed mode of action of CCL5 gradients: CCL5 leads to the recruitment of CCR5+ immune cells, including regulatory T-cells (Tregs). Blockade of the CCL5-CCR5 axis, however by CCR5 antagonists, allows recruitment of trNK cells via CCL5-CCR1 signaling while Tregs recruited into the microenvironment are killed off via FasL-mediated trNK killing.
Figure 8 with 1 supplement
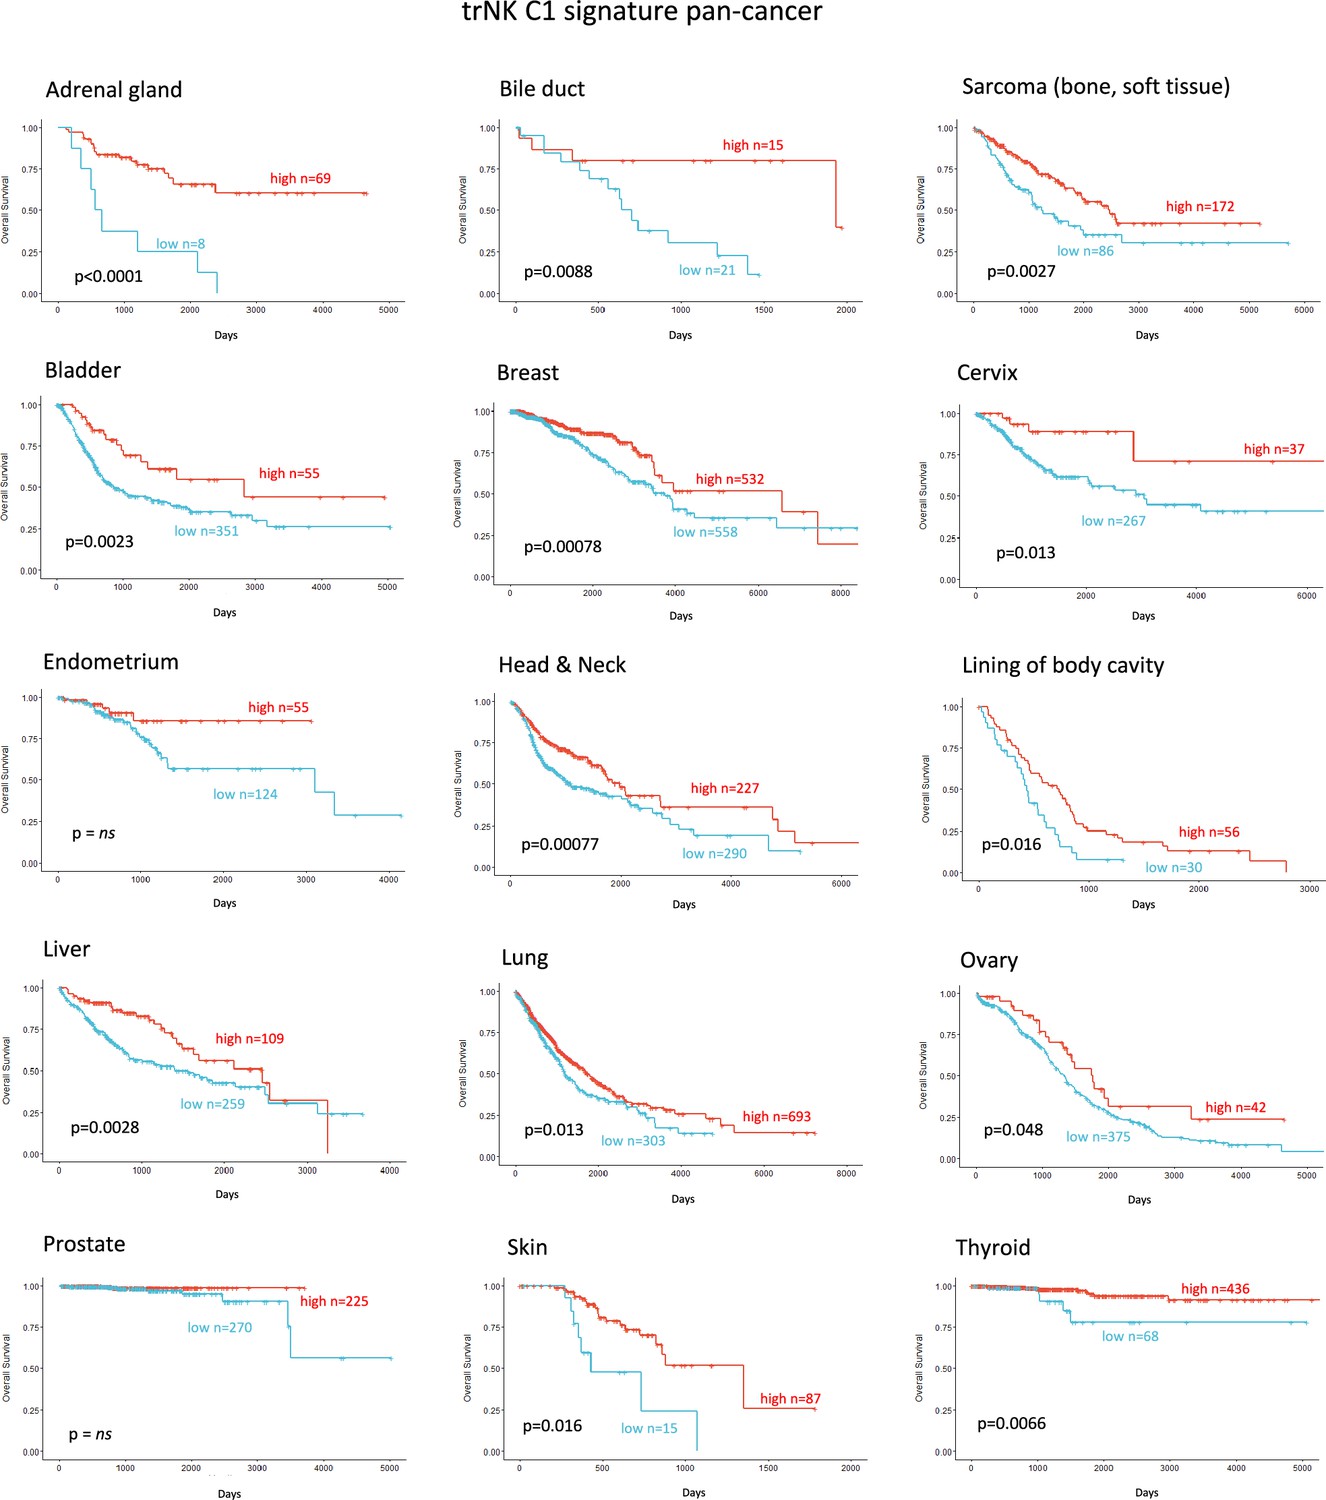
Tissue-resident natural killer signature associates with survival pan cancer.
Figure 8—figure supplement 1
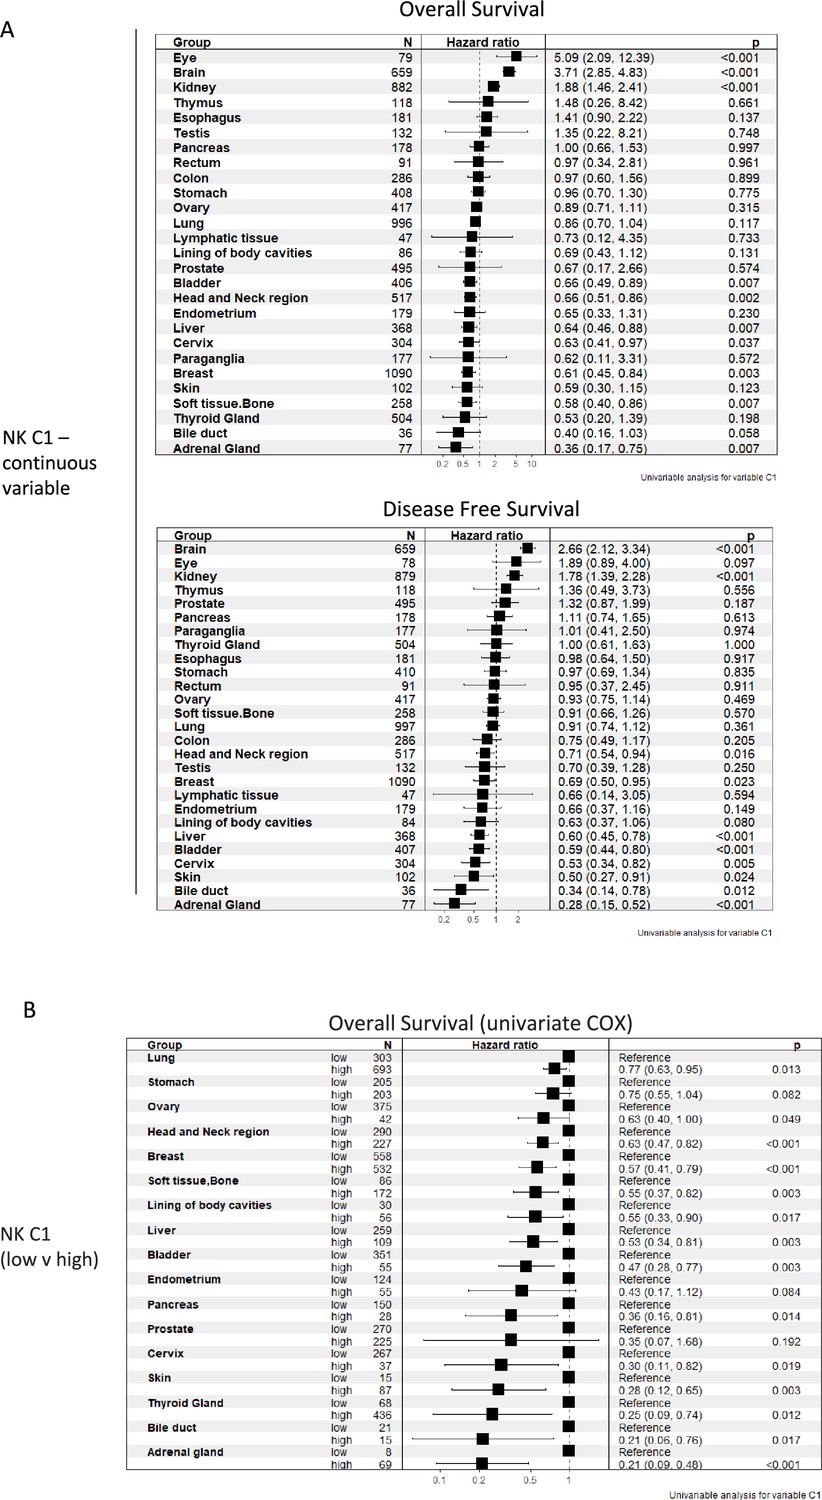
Tissue-resident natural killer cell signature survival hazard ratios.
(A) Cox regression of tissue-resident natural killer cell signature vs overall survival and disease-free survival across indicated malignancies as a continuous variable (B) or segregated into low/high NK_C1.
Author response image 1

Overall survival of CCL5high versus CCL5low patients stratified into groups with and without radiotherapy using TCGA-PAAD.
Log-rank p-value indicates the significance level across all groups while individual significant comparisons are shown as indicated.
Tables
Table 1
Aurora spectral panel and antibodies list.
| Antigen | Clone | Fluorochrome | Company, catalogue number | Dilution |
|---|---|---|---|---|
| Live/dead | – | Blue | Thermo Fisher, L23105 | 1:1000 |
| CD45 | 30-F11 | AF532 | Thermo Fisher, 58-0451-80 | 1:50 |
| CD19 | 1D3 | SB436 | Thermo Fisher, 62-0193-80 | 1:50 |
| CD3 | 17A2 | eF450 | BioLegend, 48-0032-80 | 1:50 |
| NK1.1 | PK136 | BV650 | BioLegend, 108735 | 1:25 |
| CD8a | 53–6.7 | BV570 | BioLegend, 100739 | 1:25 |
| CD4 | RM4-5 | BV510 | BD Biosciences, 100553 | 1:100 |
| CD25 | 7D4 | AF647 | BD Biosciences, 563598 | 1:100 |
| FOXP3 | FJK-16s | PE | Thermo Fisher, 12-5773-80 | 1:20 |
| CD206 | C068C2 | BV785 | BD Biosciences, 141729 | 1:25 |
| F4/80 | T45-2342 | BV480 | BD Biosciences, 565635 | 1:100 |
| CD80 | REA983 | APC | Miltenyi Biotech, 130-116-46 | 1:100 |
| CD279 (PD-1) | J43 | PE-Cy7 | Thermo Fisher, 25-9985-82 | 1:25 |
| CD195 (CCR5) | REA354 | VB-FITC | Miltenyi Biotech, 30-105-141 | 1:20 |
| CD11b | M1/70 | AF700 | BioLegend, 101222 | 1:100 |
| Ly6C | HK1.4 | PE-Dazzle | BioLegend, 128043 | 1:200 |
| Ly6G | 1A8 | BV421 | BioLegend, 127627 | 1:25 |
Table 2
Multiplex IF panel.
| Antigen | Coupled to | Company, catalogue number | Dilution |
|---|---|---|---|
| NKG2D | Opal 520 | Abcam, ab203353 | 1:600 |
| CD161/NK1.1 | Opal 620 | Abcam, ab234107 | 1:20,000 |
| CD3 | Opal 480 | Abcam, ab5690 | 1:300 |
| CD8 | Opal 570 | Cell Signaling, 98941 | 1:800 |
| E-cadherin | Opal 780 | Cell Signaling, 3195 | 1:500 |
Additional files
Download links
A two-part list of links to download the article, or parts of the article, in various formats.
Downloads (link to download the article as PDF)
Open citations (links to open the citations from this article in various online reference manager services)
Cite this article (links to download the citations from this article in formats compatible with various reference manager tools)
Tissue-resident natural killer cells support survival in pancreatic cancer through promotion of cDC1-CD8 T activity
eLife 13:RP92672.
https://doi.org/10.7554/eLife.92672.3


