Structural and dynamic changes in P-Rex1 upon activation by PIP3 and inhibition by IP4
- Departments of Biological Sciences and of Medicinal Chemistry and Molecular Pharmacology, Purdue University, United States
- Department of Pharmacology and Moores Cancer Center, University of California, San Diego, United States
- Department of Medicine, University of California, San Diego, United States
- Department of Biological Chemistry, University of Michigan, United States
- Department of Molecular and Cellular Biology, University of California, Davis, United States
Figures
Figure 1 with 1 supplement
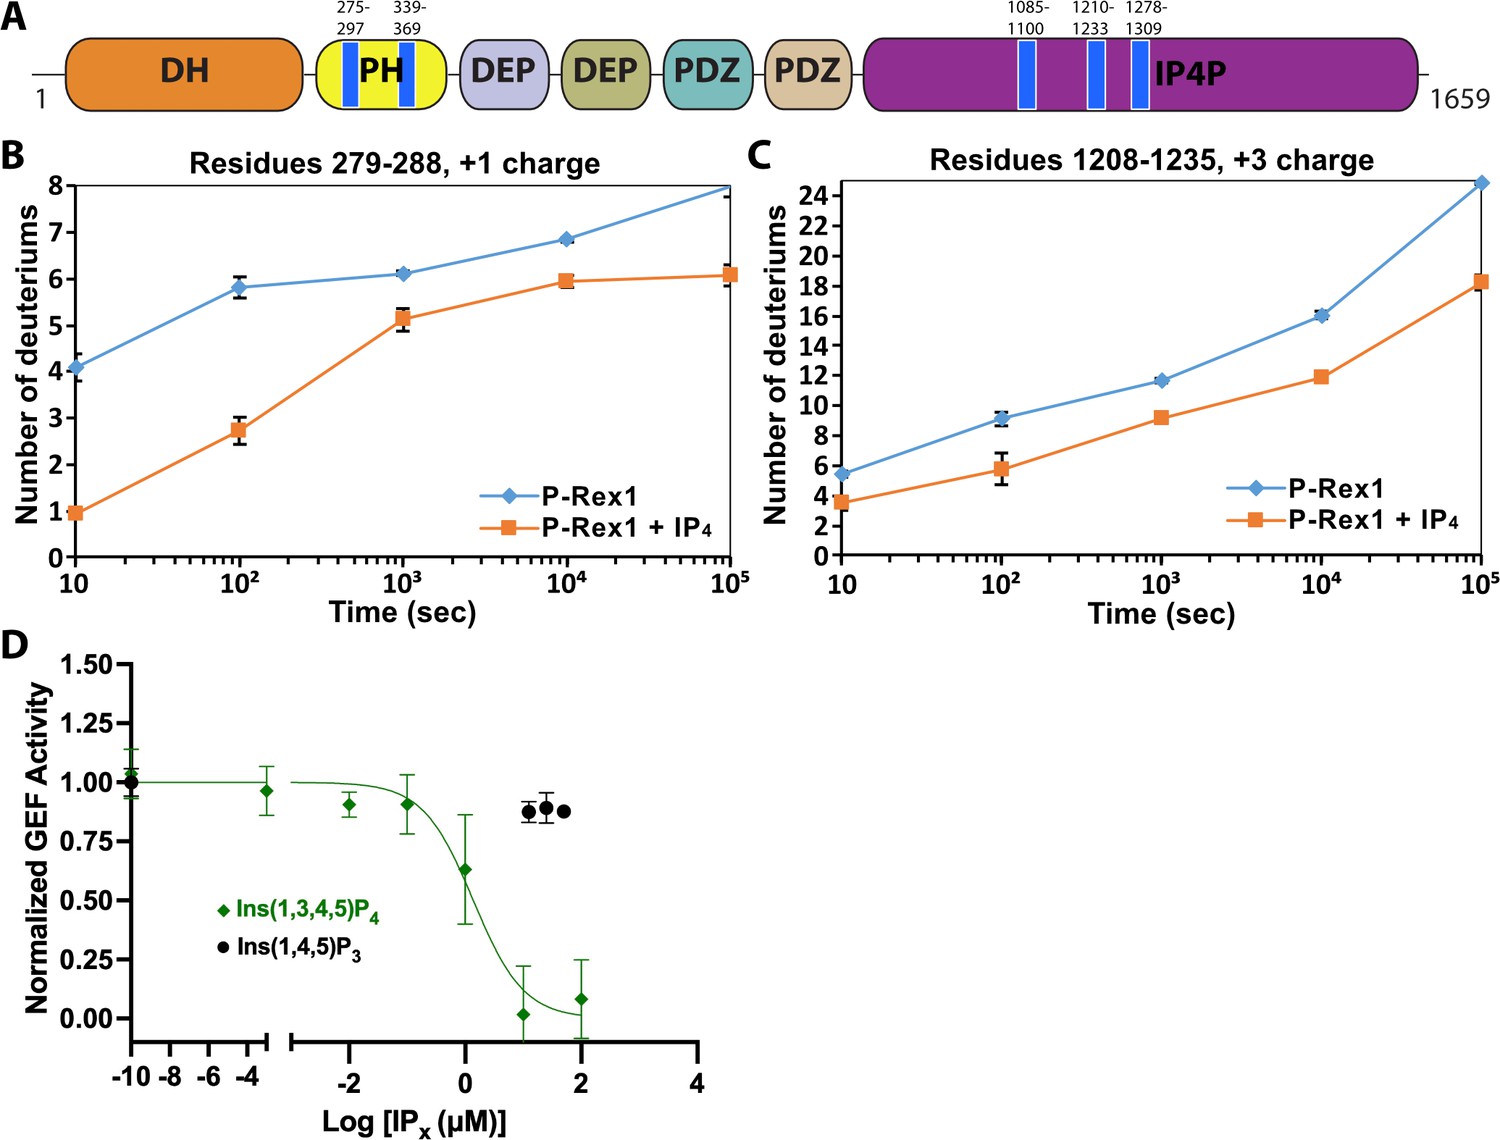
IP4 binding causes dynamic changes in multiple domains of P-Rex1 and inhibits PIP3-induced activation.
(A) Difference hydrogen-deuterium exchange mass spectrometry (HDX-MS) data plotted onto the domain layout of P-Rex1. Blue regions indicate less deuterium uptake upon IP4 binding. Graphs show the exchange over time for select regions in the P-Rex1 (B) PH domain and (C) an IP4P region that was disordered in the P-Rex1–Gβγ structure. The average of two experiments is plotted with the bars representing the range of each time point. (D) In vitro GEF activity of P-Rex1 evaluated on liposomes containing 2.5 μM PIP3 in the presence of varying IP4 concentrations (0–100 μM). Data were fit to exponentials to get rate constants by constraining the span to be shared. The resulting rates for each experiment were normalized by averaging two PIP3 data points and two PC/PS data points to represent the top and bottom of the binding curve. The resulting normalized rates (min–1) were fit with a one-phase binding curve wherein the top and bottom were constrained to 1 and 0, respectively, and the Hill coefficient fixed at –1. The resulting IC50 was 1.4 µM with a confidence interval of 0.81–2.3. Data represent 4–5 independent experiments. Error bars represent the mean ± S.D.
Figure 1—figure supplement 1
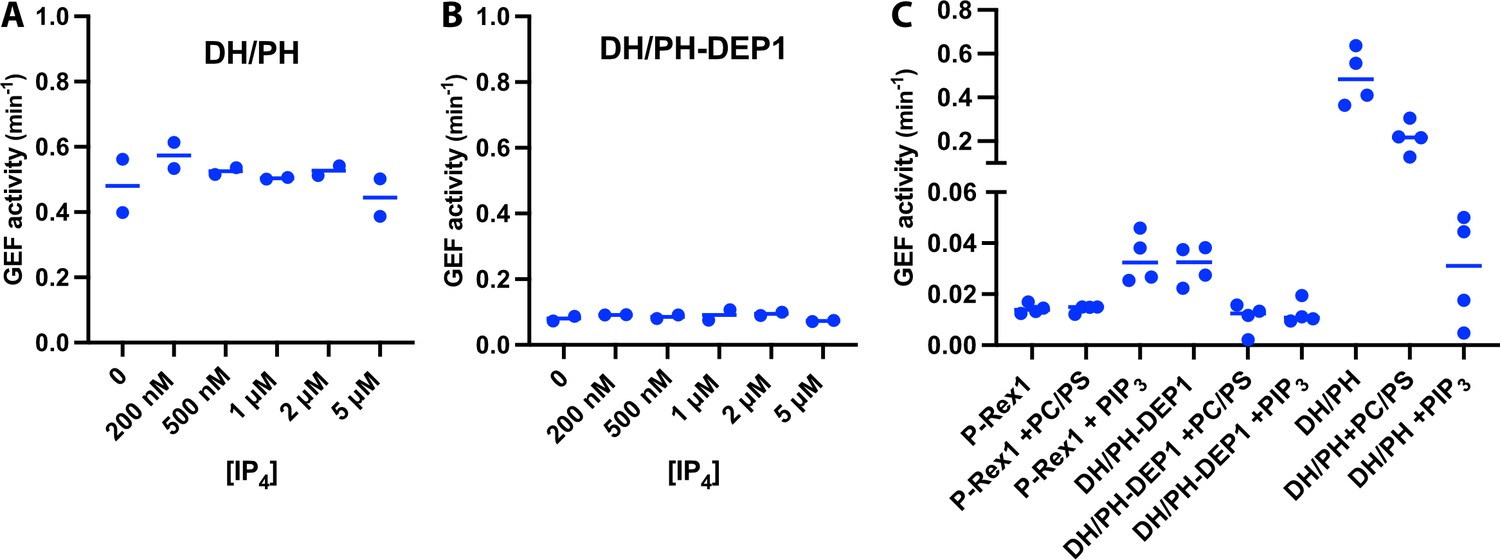
P-Rex1 GEF activity assays show that truncated constructs are not inhibited by IP4 and are not activated by PIP3-containing liposomes.
(A, B) Fluorescence-based in vitro GEF activity assays with purified P-Rex1 DH/PH and DH/PH-DEP1 proteins (100 nM). Proteins were incubated with varying concentrations (0–5 μM) of IP4 for 10 min at room temperature (RT) before adding soluble Cdc42 to measure activity. (C) In vitro GEF activity of full-length P-Rex1, DH/PH, and DH/PH-DEP1 in the absence or presence of liposomes (±2.5 μM PIP3). The proteins were incubated with the liposomes for 20 min at RT before adding soluble Cdc42 to measure activity.
Figure 2 with 3 supplements
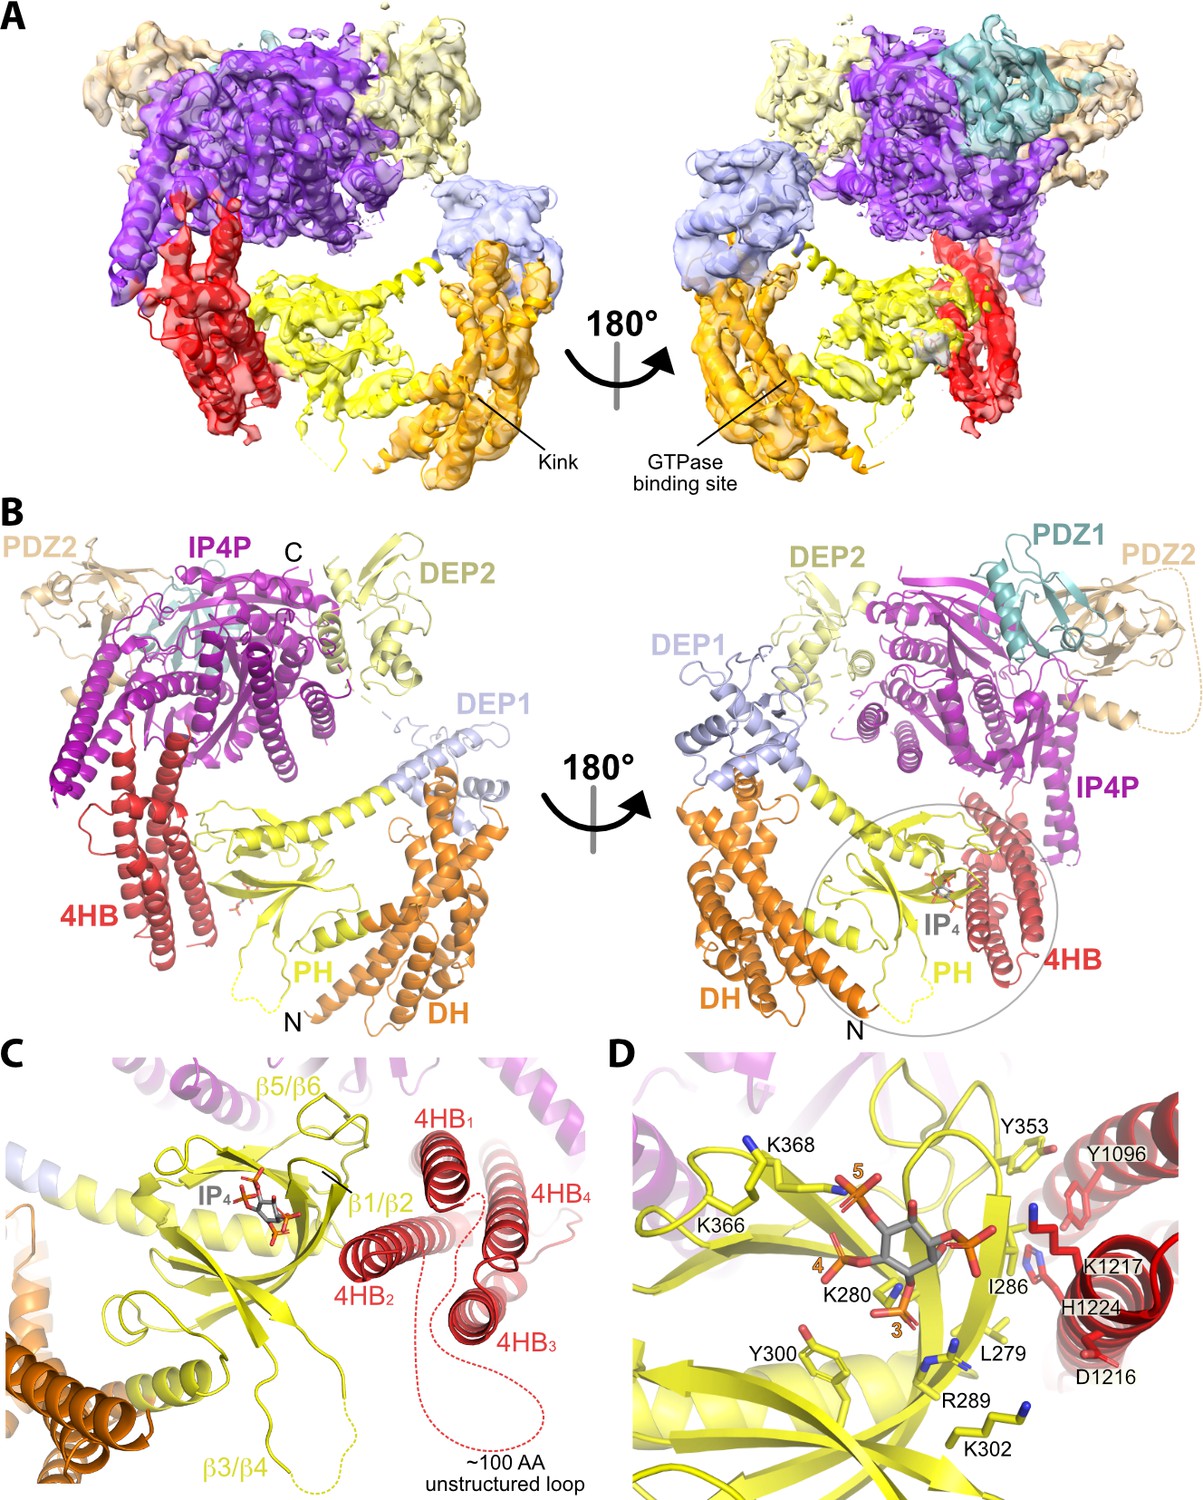
Structure of the P-Rex1·IP4 complex in an autoinhibited conformation.
(A) Cryo-EM reconstruction with atomic model superimposed. The kink between the DH and PH domains and the GTPase binding site is labeled. (B) Atomic model without the cryo-EM map. (C) The PH–4HB interface primarily involves the β1/β2 and β5/β6 loops of the PH domain, which were previously shown to be involved in protein-protein interactions in crystal structures (Cash et al., 2016), and the 4HB1 and 4HB2 helices of the 4HB domain. Flexible loops, including the basic β3/β4 loop of the PH domain involved in membrane binding (Cash et al., 2016), are shown as dashed lines. We speculate that this loop could interact with phosphorylated residues in the adjacent 4HB unstructured loop. (D) Side chains in the PH–4HB interface. The 3-, 4-, and 5-position phosphates of bound IP4 are labeled. Note that PIP3 could not bind to the PH domain in this state due to steric blockade by the 4HB domain. The area of focus in (C) and (D) is circled in gray in (B).
Figure 2—figure supplement 1
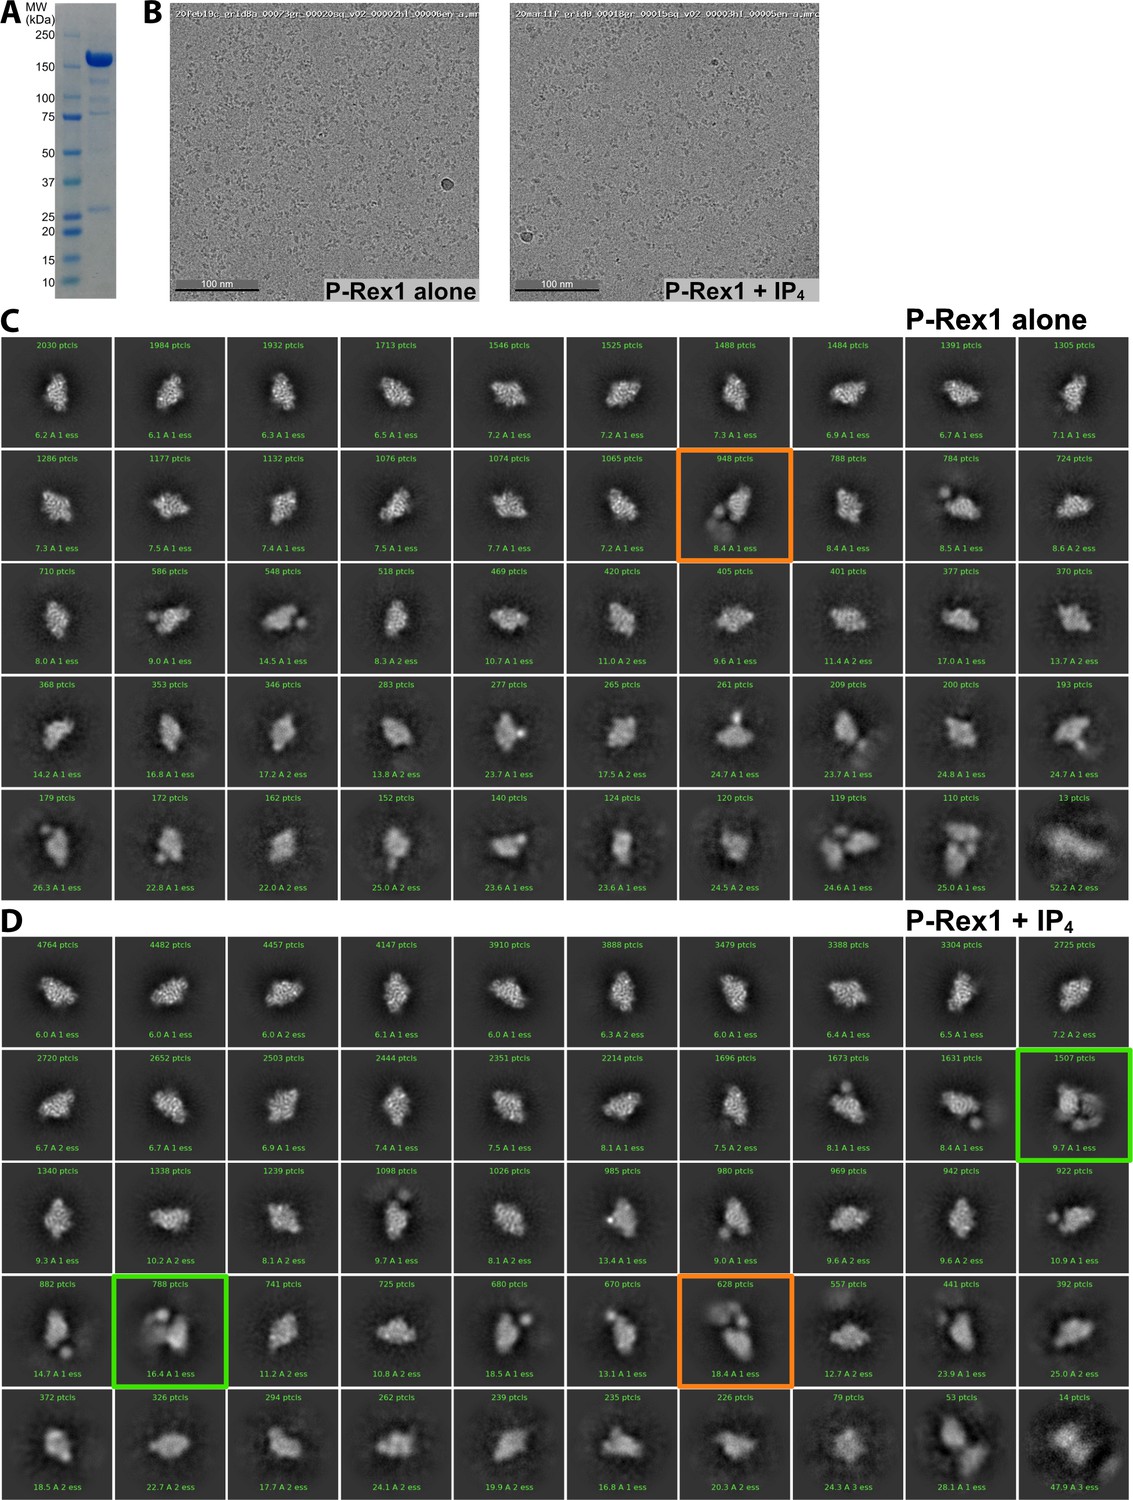
Samples of P-Rex1 ± IP4 imaged on a Glacios microscope highlight a conformation of P-Rex1 that is stabilized by IP4.
(A) SDS-PAGE of a sample of purified P-Rex1 that was frozen on grids shown with a molecular weight marker. See also Figure 2—figure supplement 1—source data 1. (B) Representative micrographs of P-Rex1 samples. (C) Particles of unliganded P-Rex1. These 2D classes represent the best particles (35,302 total) in this dataset. (D) Particles of P-Rex1·IP4. These 2D classes represent the best particles (79,378 total) in this dataset. 2D classification was performed similarly for the two datasets to select particles that showed the highest resolution features. Pixel size was 1.054 Å, and box size was 288 pixels. Classes that were obviously centered between two separate particles were excluded. Approximately twice as many micrographs were collected for the P-Rex1·IP4 sample. The number of particles in each class is shown in green text in the box with each class. Orange boxes indicate particles with extra mass to the side of the Gβγ-binding core while green boxes indicate particles with extra mass opposite the Gβγ-binding site on the core.
-
Figure 2—figure supplement 1—source data 1
Original SDS-PAGE gel.
- https://cdn.elifesciences.org/articles/92822/elife-92822-fig2-figsupp1-data1-v1.zip
Figure 2—figure supplement 2
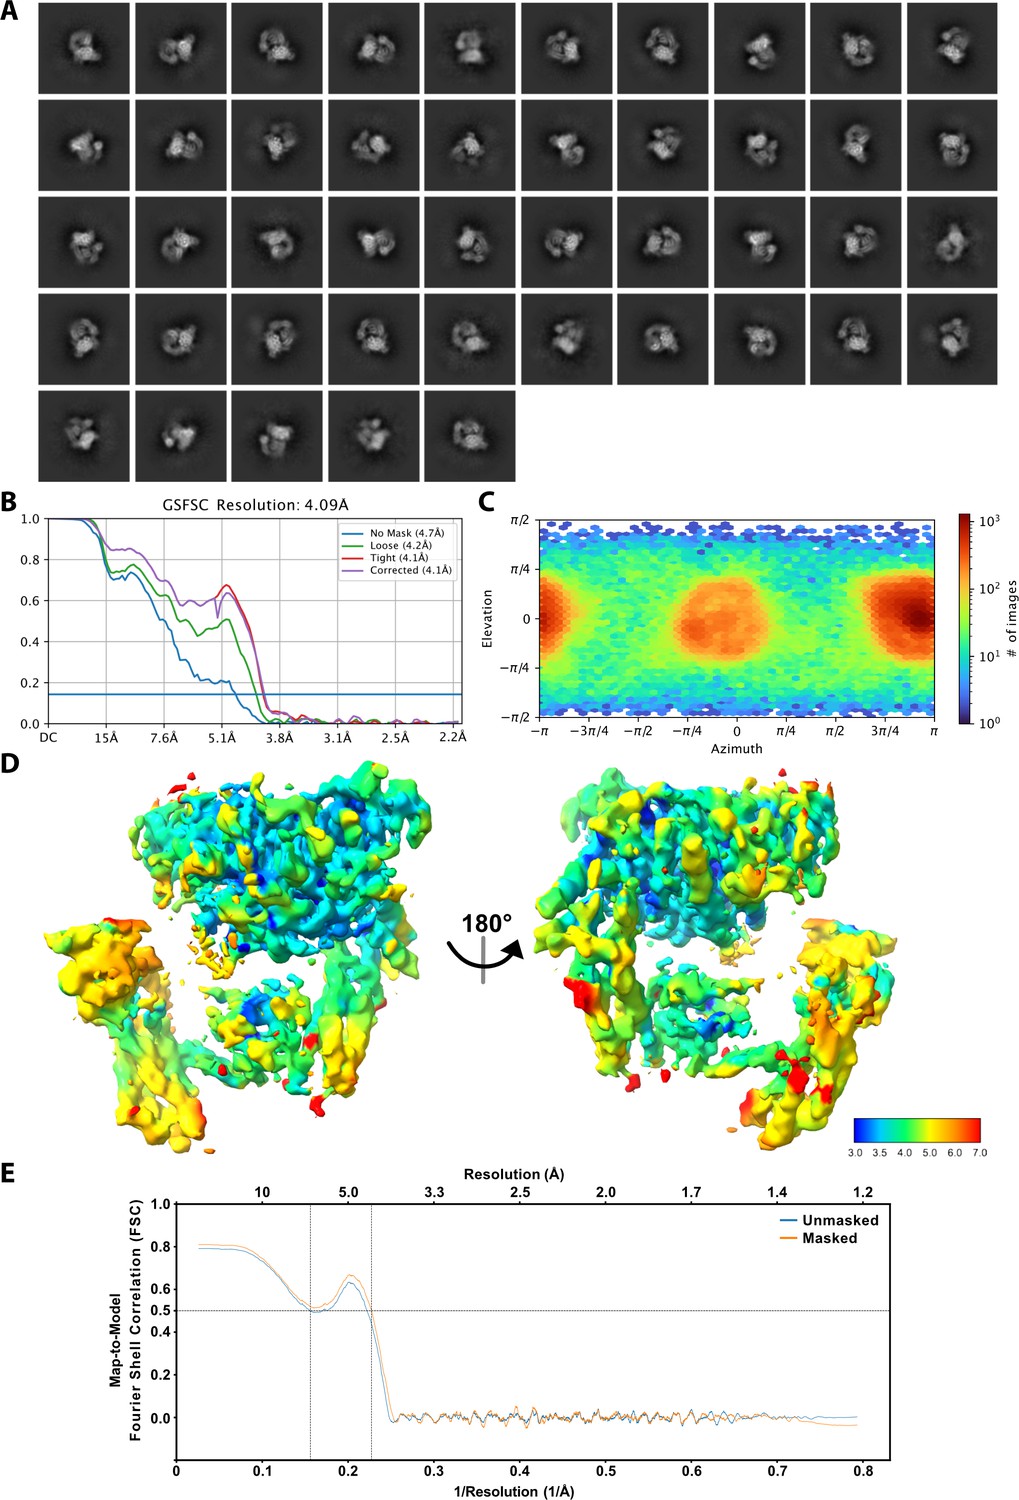
Cryo-EM 2D classification and 3D reconstruction.
(A) 2D class averages of all particles included in the cryo-EM reconstruction. (B) Fourier shell correlation (FSC) curve for the final 3D reconstruction. (C) Euler angle distribution of the final cryo-EM structure. (D) Cryo-EM map of the P-Rex1·IP4 complex colored according to local resolution calculated by CryoSPARC using a 0.143 FSC cutoff. (E) Map-to-model FSC calculated between the atomic model and 3D reconstruction using Phenix showing that the refined model represents the 3D reconstruction.
Figure 2—figure supplement 3
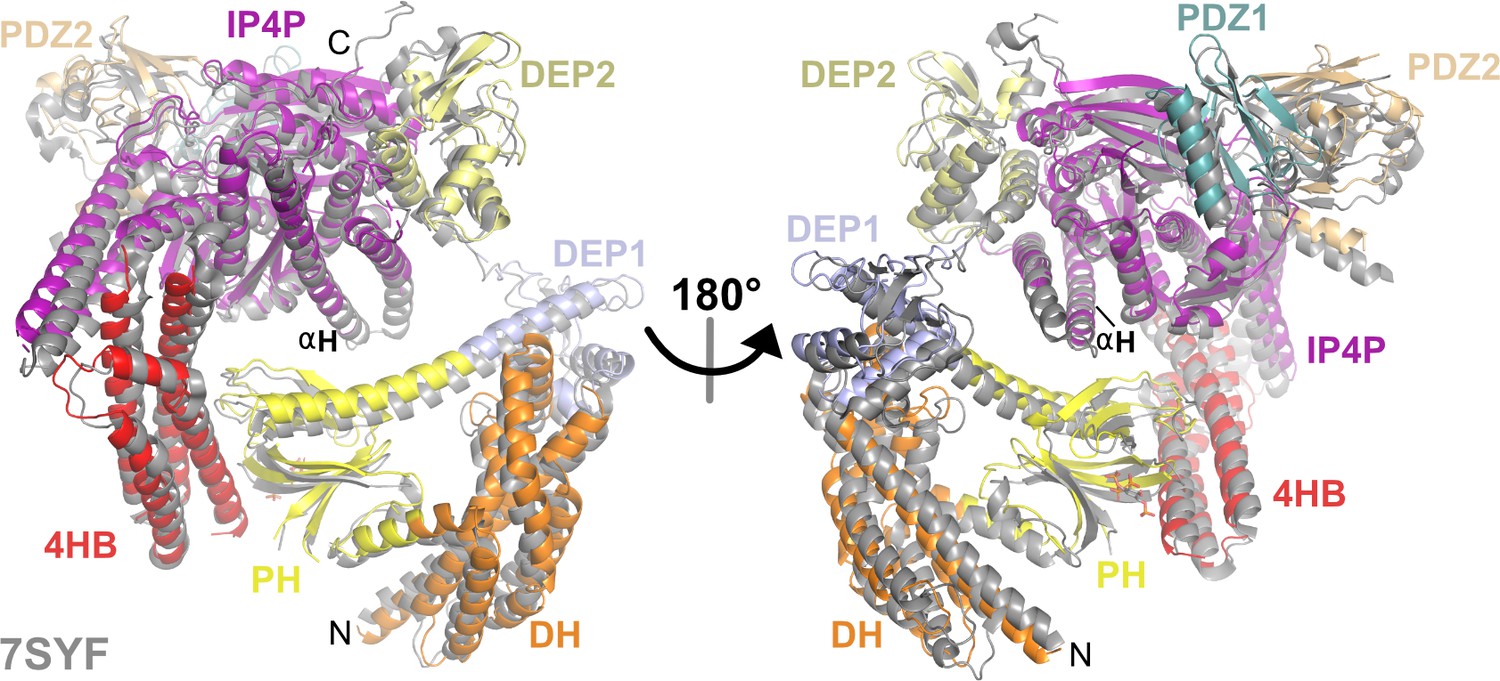
The overall structure of the P-Rex1·IP4 complex is similar to that of unliganded P-Rex1.
Alignment of the P-Rex1·IP4 complex with the previously determined structure of unliganded P-Rex1 (gray, PDB entry 7SYF). Here, the αH helix of the IP4P domain (residues 1482–1514) in each structure was aligned.
Figure 3 with 2 supplements
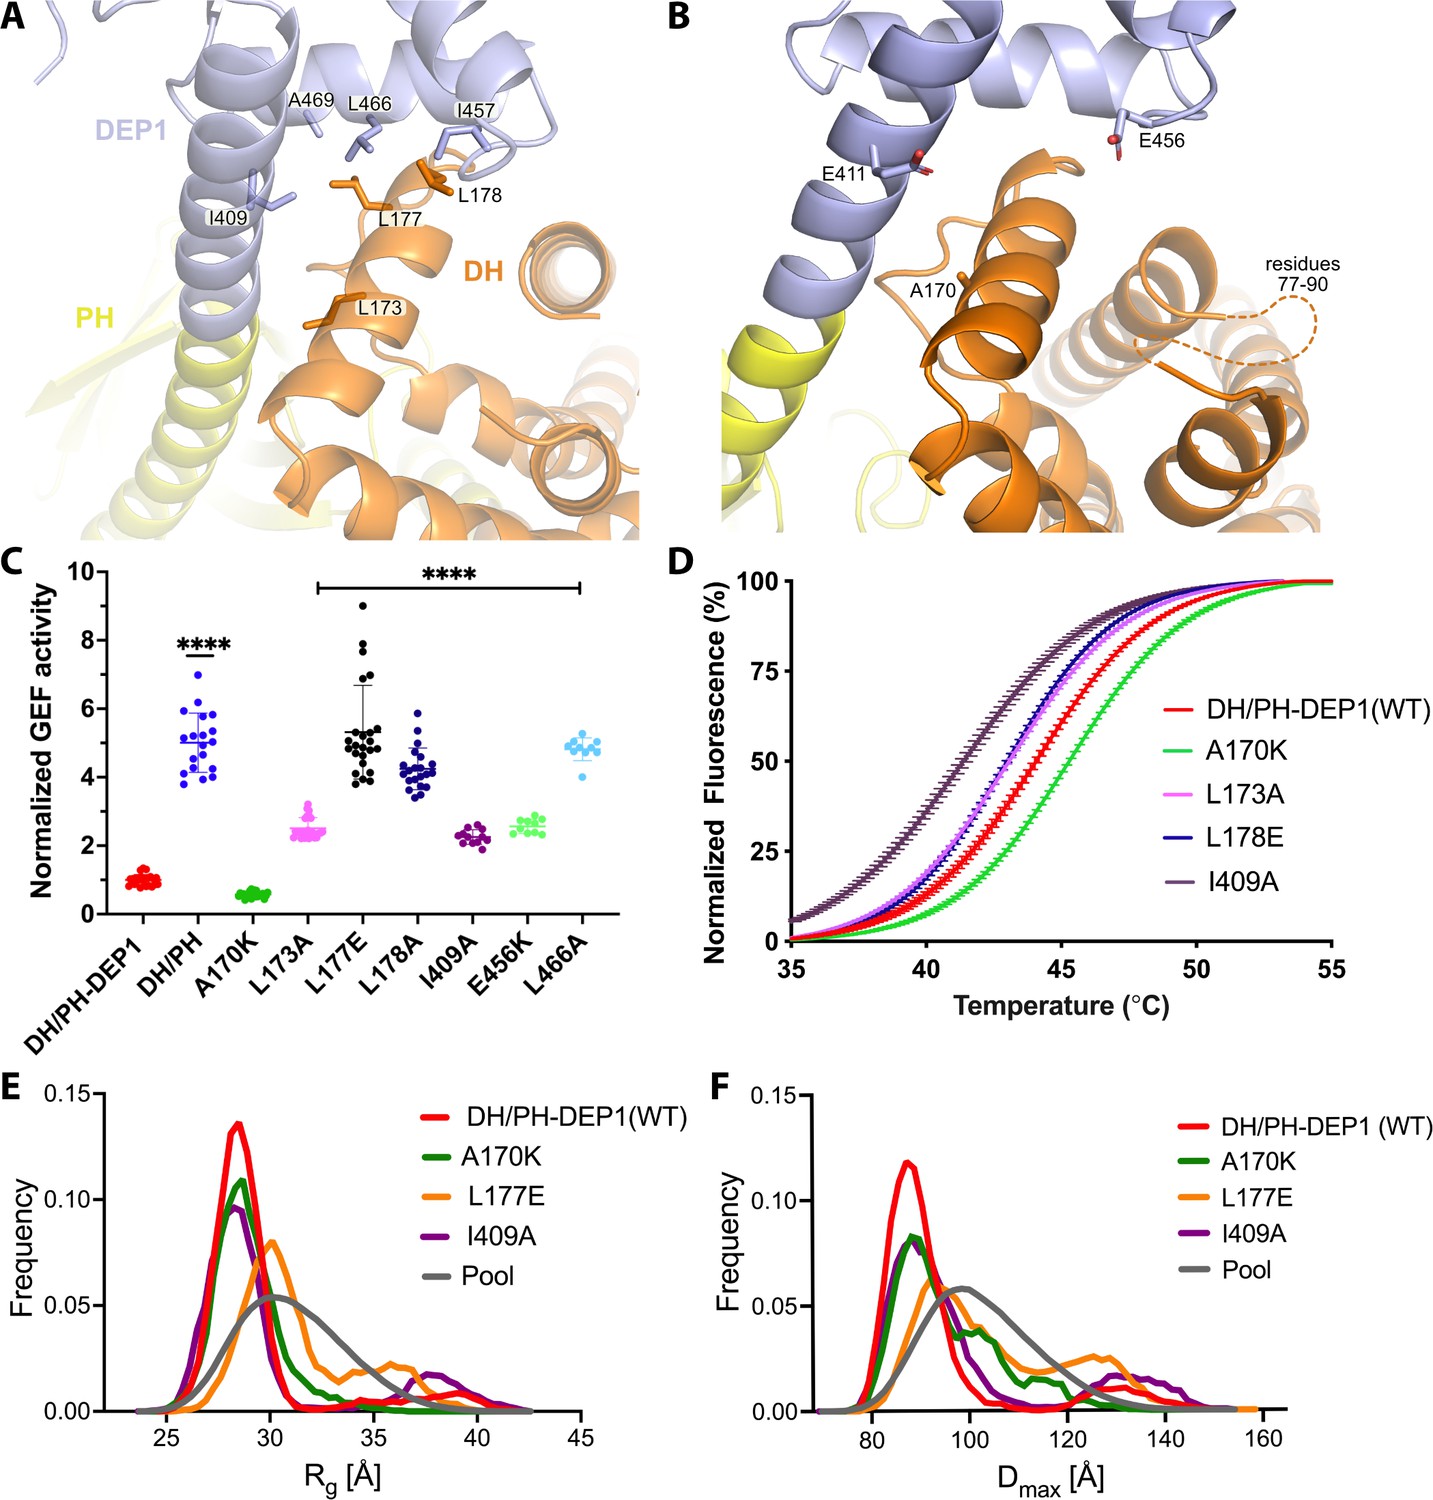
Mutations at the DH–DEP1 interface alter stability, conformation, and activity of DH/PH-DEP1.
(A) Side chains that contribute to the hydrophobic interface formed between the DH and DEP1 domains. (B) Electrostatic interactions contributing the DH–DEP1 interface. The dotted line indicates a disordered region on the DH domain containing positively charged residues that may interact with Glu456. The A170K mutant is expected to form a salt bridge with Glu411 and strengthen the interface. (C) Fluorescence-based in vitro GEF activity assay on soluble Cdc42 with variants of the purified DH/PH-DEP1 fragment. GEF activity in this experiment was fit to a one-phase exponential decay normalized to that of DH/PH-DEP1 (WT). ****p<0.0001. (D) Representative ThermoFluor analyses showing that mutations that disrupt the DH–DEP1 interface also destabilize the protein, as evidenced by decreased Tm values for each variant (see Table 2). Data are normalized from 0 to 100% representing lowest and highest fluorescence values. Note that A170K, which inhibits activity in panel (C), increases stability. (E, F) Ensemble optimization method (EOM) analysis of small-angle X-ray scattering (SAXS) data collected from mutations disrupting the DH–DEP1 interface indicate that these variants exhibit more extended conformations (see Table 3). EOM analyses provide the Rg and Dmax distributions derived from selected ensembles. The gray curves correspond to the Rg and Dmax distributions for the pool of structures used for each analysis.
Figure 3—figure supplement 1
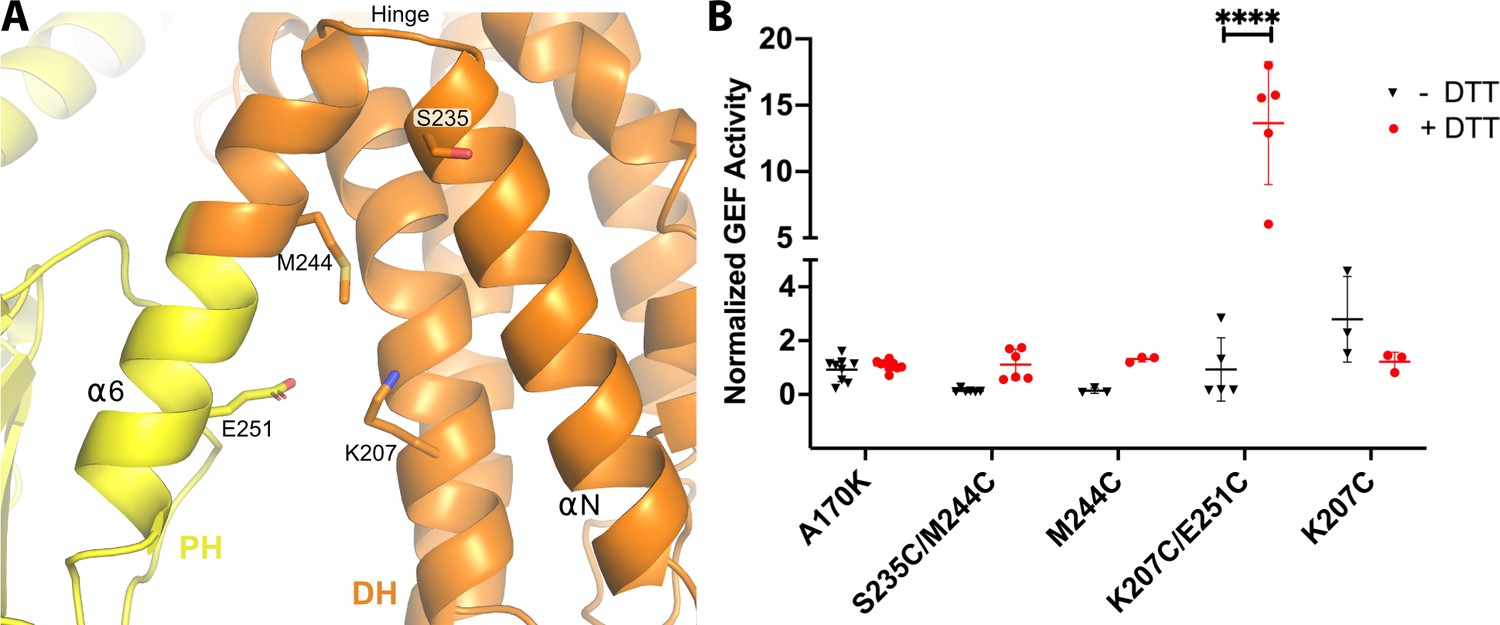
Introduction of a disulfide bridge in the DH/PH hinge reduces DH/PH-DEP1 activity.
(A) Atomic structure of the hinge between the DH and PH domains. Side chains of residues mutated to cysteine are shown. (B) GEF activity of DH/PH-DEP1 Cys variants in the background of the A170K mutation. The rate of nucleotide exchange on soluble Cdc42 was normalized to that of the A170K DH/PH-DEP1 variant. Residues were mutated and activities measured under reducing (+DTT) and non-reducing (-DTT) conditions. Similar results were obtained when using FeCN6- as an alternative oxidation strategy (data not shown). Data are from at least three independent experiments with error bars representing the mean ± S.D. ****p<0.0001.
Figure 3—figure supplement 2
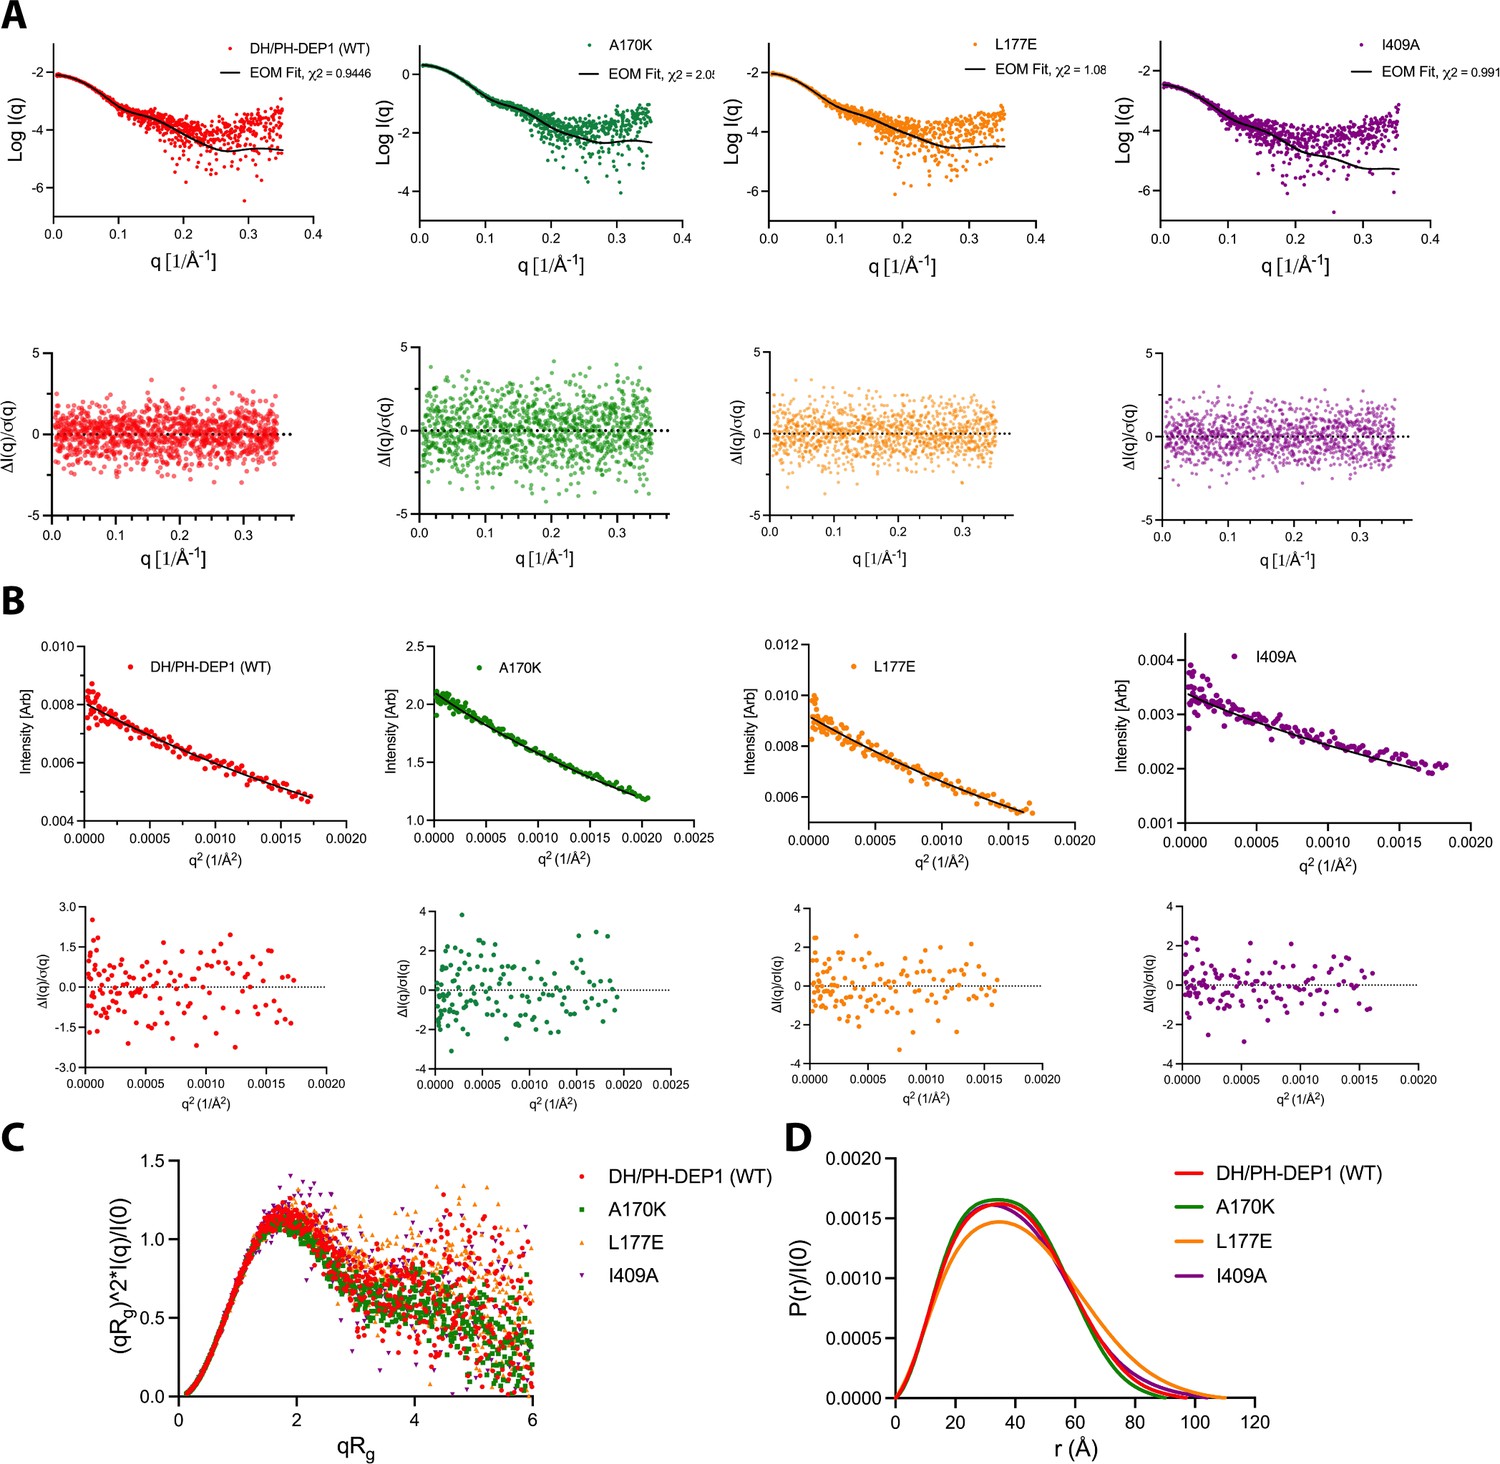
Small-angle X-ray scattering (SAXS) analyses of DH/PH-DEP1 variants.
(A) SAXS data (points) and ensemble optimization method (EOM) fit (line) for WT DH/PH-DEP1 and variants with mutations at the DH–DEP1 interface. A170K, L177E, and I409A are the variants. Normalized fit residuals are shown in the bottom panel. (B) Guinier analysis with residuals of fit (below). (C) Dimensionless Kratky plots suggest that all the samples have significant degrees of heterogeneity that will not permit rigid body fits. (D) Pair distance distribution (P(r)) functions, normalized by I(0). All curves were non-Gaussian, indicating the presence of some flexibility or extended conformations.
Figure 4
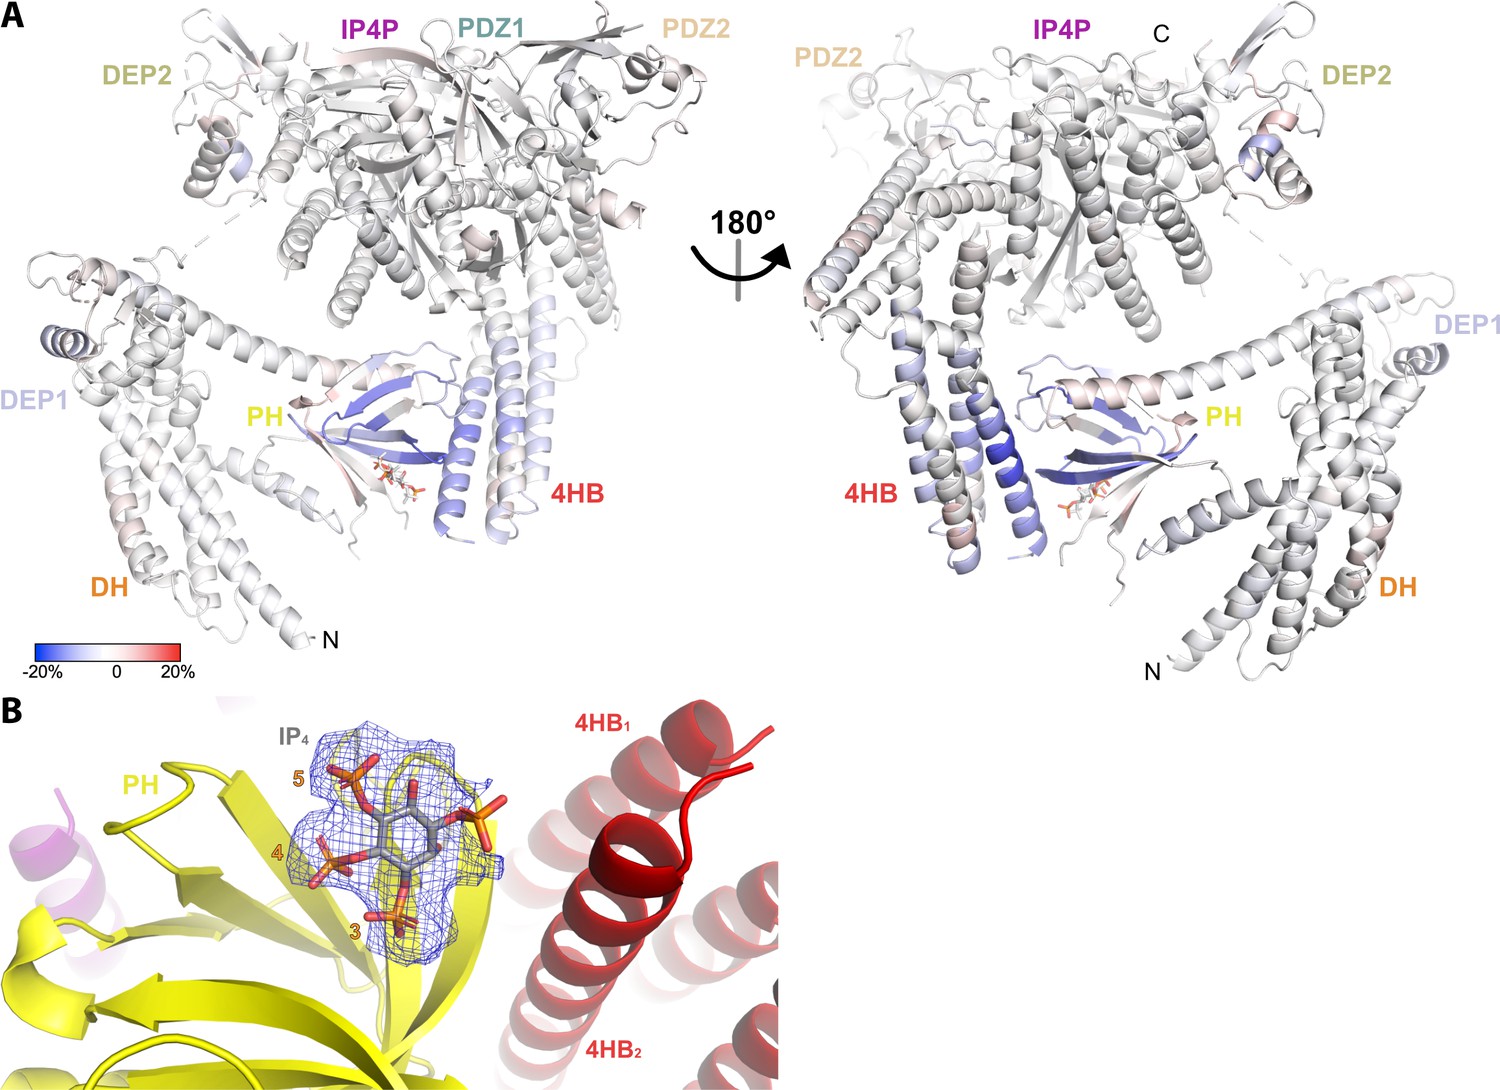
Hydrogen-deuterium exchange mass spectrometry (HDX-MS) and cryo-EM data support the conclusion that IP4 stabilizes a closed conformation of P-Rex1.
(A) Difference HDX-MS data plotted onto the structure of the P-Rex1 bound to IP4. Blue regions indicate more protection upon IP4 binding, whereas red regions indicate less. See also Figure 4—source data 1. (B) Map representing IP4 bound in the PIP3-binding site of the PH domain. The 3-, 4-, and 5-phosphates of IP4 are reasonably well-ordered.
-
Figure 4—source data 1
HDX-MS data on P-Rex1–IP4 with time points.
- https://cdn.elifesciences.org/articles/92822/elife-92822-fig4-data1-v1.pdf
Figure 5 with 1 supplement
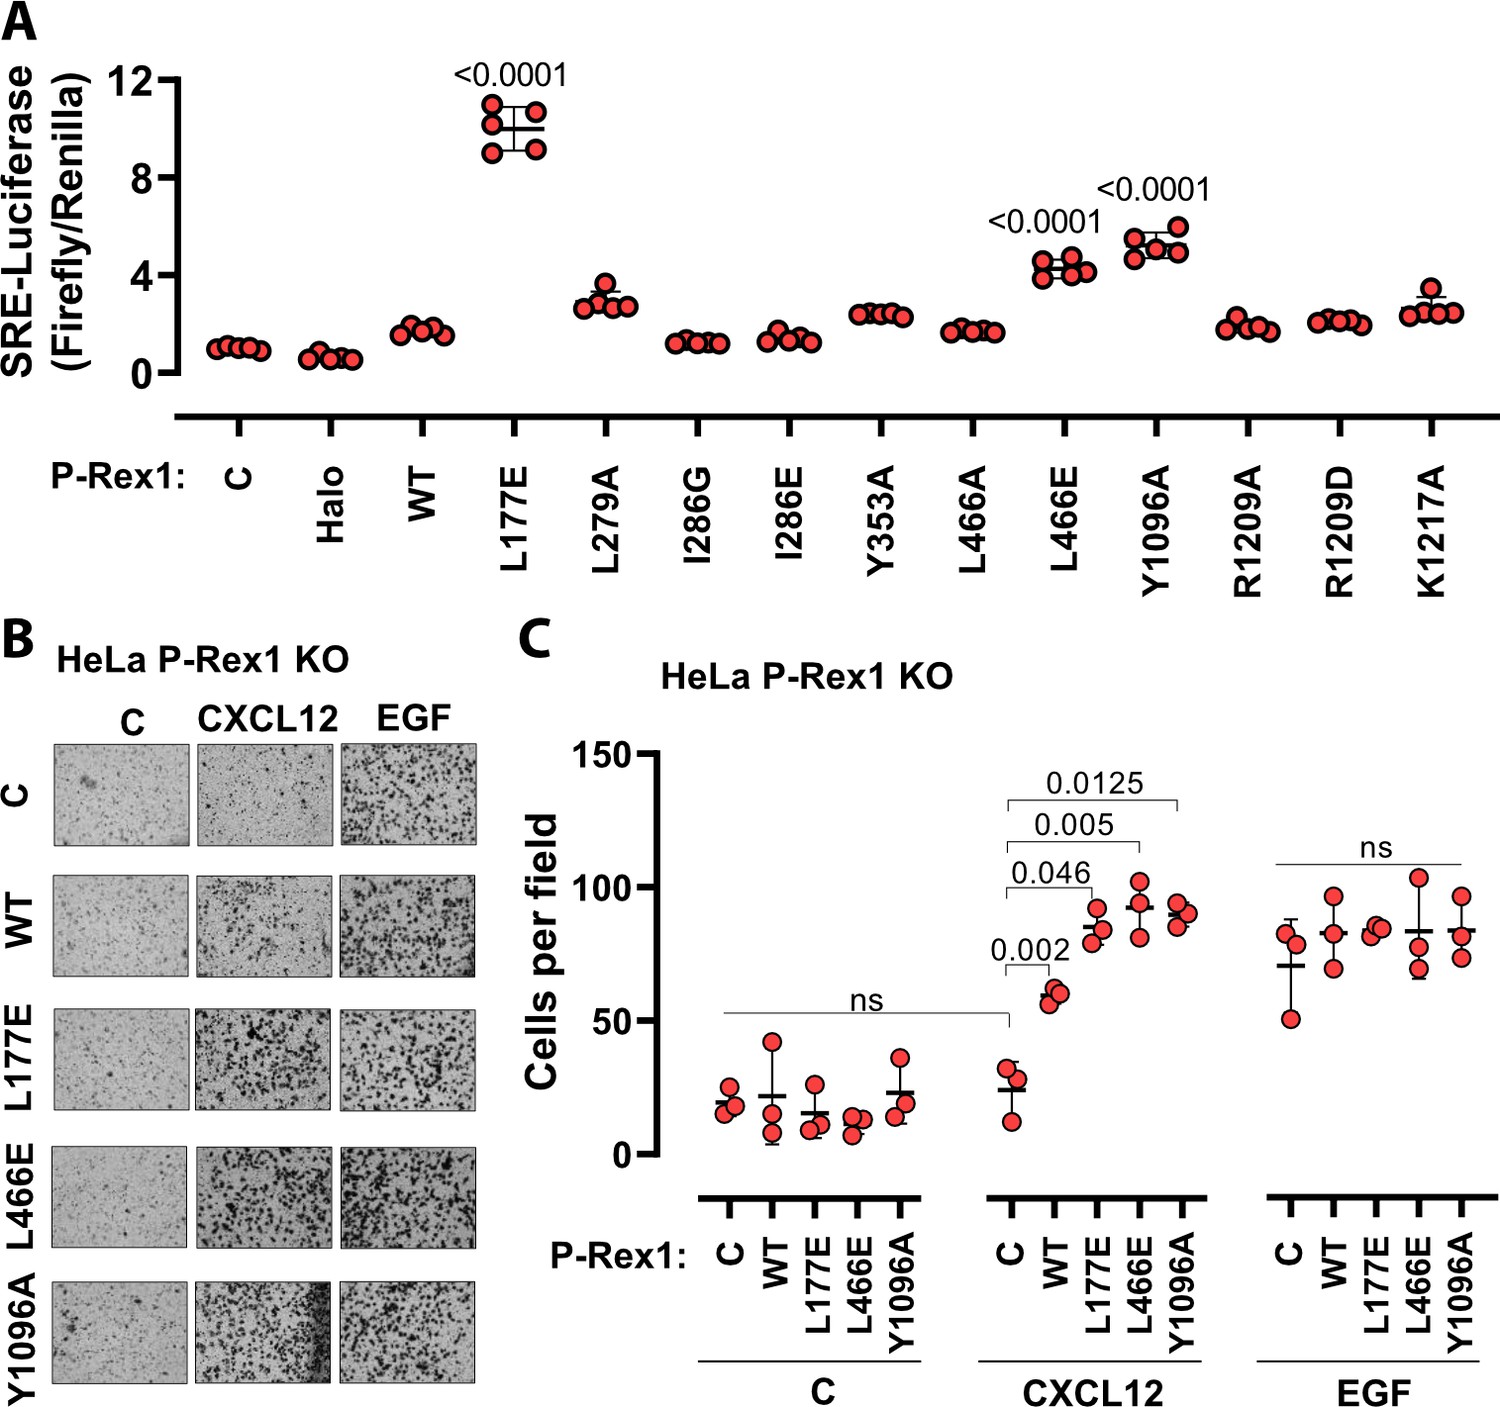
Disruption of the DH–DEP1 and PH–4HB interfaces leads to increased P-Rex1 activity in cells.
(A) SRE luciferase-gene reporter assays. Mutations were cloned into full-length P-Rex1 in the pCEFL-HA-HaloTag vector, and these constructs, along with luciferase reporter genes, were co-transfected into HEK293T cells. Results depicted here are representative of three independent experiments, and error bars represent S.D. Non-transfected control (C) and empty vector transfected control (Halo) are shown. (B, C) Mutations which led to enhanced P-Rex1 activity in luciferase reporter assays were evaluated for their effect on chemotaxis of HeLa cells with endogenous P-Rex1 knocked out (HeLa P-Rex1 KO; see Figure 5—figure supplement 1). P-Rex1 constructs were transfected into HeLa P-Rex1 KO cells, and cell migration was evaluated in a trans-well migration assay upon stimulation with CXCL12 (50 ng/ml) or EGF (50 ng/ml). Data is presented as mean ± S.D. Significance (brackets) was determined using multiple comparison ANOVA followed by Šidák statistic test.
Figure 5—figure supplement 1

P-Rex1 is required for CXCL12-stimulated cell migration downstream of the CXCR4 chemokine receptor.
(A) Crystal violet staining of trans-well migration inserts showing HeLa cell migration. Chemotaxis was evaluated under conditions without stimulation and after stimulation with CXCL12 (50 ng/ml) or EGF (50 ng/ml) and compared to cells transfected with a WT P-Rex1 construct. (B) Quantification of (A), representing results from at least three independent experiments. Error bars show S.D. Significance was determined using Šidák statistic test. ns, not significant. (C) Western blot analysis of P-Rex1 protein levels in HeLa P-Rex1 KO cells and with wild-type P-Rex1 transfected back in. (D) Western blot analysis of P-Rex1 wild-type and variant expression levels in HeLa P-Rex1 KO cells. GAPDH expression level was used as an internal control. P-Rex1 and GAPDH were detected using anti-P-Rex1 and anti-GAPDH antibodies, respectively.
-
Figure 5—figure supplement 1—source data 1
Raw images of western blots.
- https://cdn.elifesciences.org/articles/92822/elife-92822-fig5-figsupp1-data1-v1.zip
Figure 6 with 1 supplement
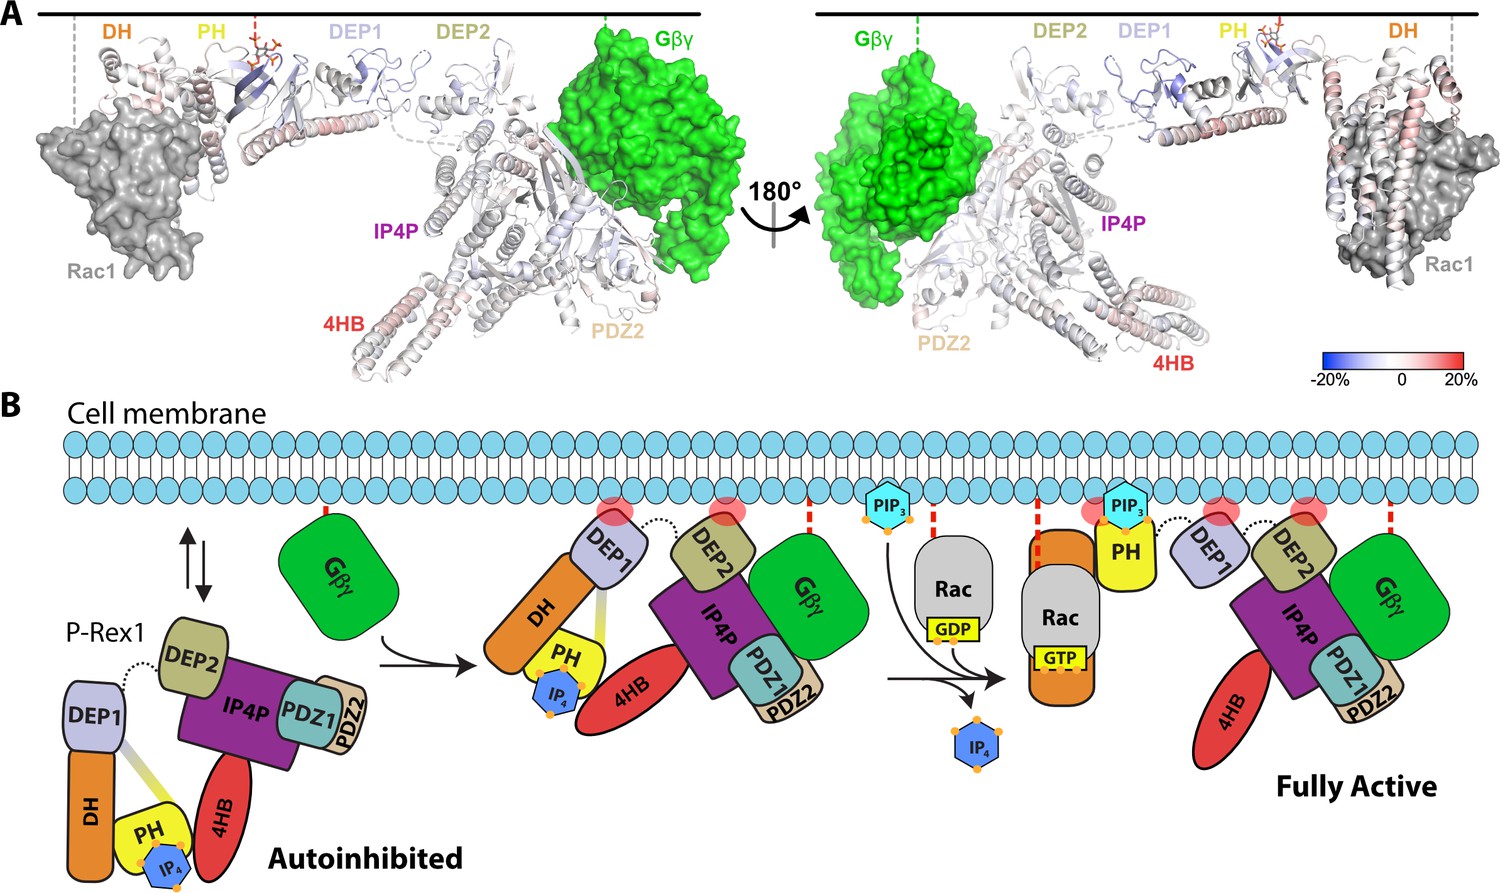
Hydrogen-deuterium exchange mass spectrometry (HDX-MS) supports that P-Rex1 undergoes long-range conformational changes when binding PIP3-containing liposomes.
(A) HDX-MS of P-Rex1 in the presence of PIP3-containing liposomes. A model of P-Rex1 in an open conformation bound to a membrane containing PIP3 was created and is shown colored according to difference HDX-MS data plotted onto the coordinates. HDX-MS data were collected in the presence of liposomes containing PIP3 and compared to data collected on P-Rex1 alone. Blue and red regions indicate less and more protection, respectively, upon PIP3-containing liposome binding. These changes occur specifically in the presence of PIP3. See also Figure 6—source data 1. The black line at the top represents a membrane surface and the dashed lines represent covalent lipid modifications. Using available structural information, Gβγ and Rac1 were docked into this model (although neither were present in this HDX-MS experiment). (B) Cartoon schematic of our model of the steps involved in the activation of P-Rex1.
-
Figure 6—source data 1
HDX-MS data on P-Rex1 plus liposomes with time points.
- https://cdn.elifesciences.org/articles/92822/elife-92822-fig6-data1-v1.pdf
Figure 6—figure supplement 1
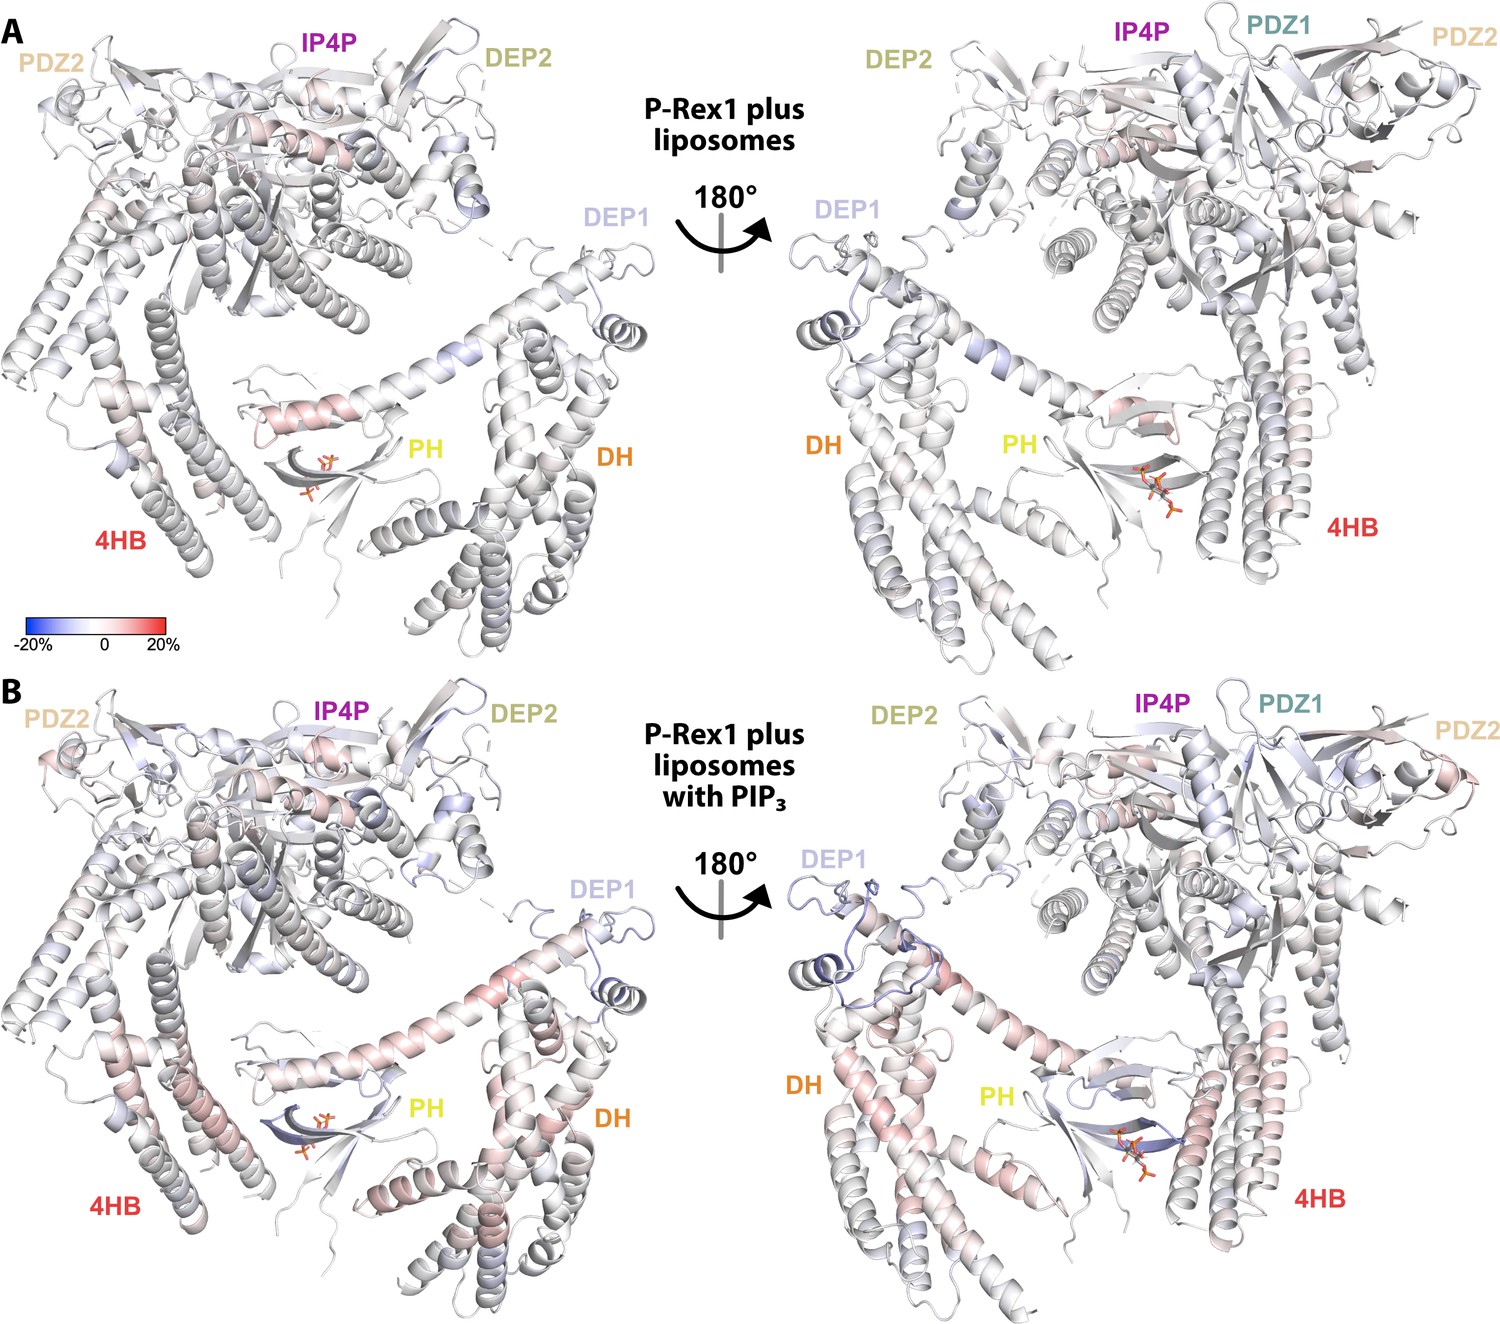
Regions across the length of P-Rex1 become more exposed upon binding liposomes specifically containing PIP3.
(A) Hydrogen-deuterium exchange mass spectrometry (HDX-MS) data collected in the presence of liposomes without PIP3 and compared to data collected on P-Rex1 alone. Blue regions indicate less dynamic behavior or protection upon liposome binding while red regions indicate more. (B) HDX-MS data was collected in the presence of liposomes containing PIP3 and compared to data collected on P-Rex1 alone. Blue regions indicate less dynamic behavior or protection upon PIP3-containing liposome binding while red regions indicate more. See also Figure 6—source data 1.
Tables
Table 1
Cryo-EM data collection, refinement, and validation statistics.
| Structure: P-Rex1–IP4(EMDB: EMD-41621)(PDB: 8TUA)(EMPIAR: EMPIAR-11967) | ||
|---|---|---|
| Untilted | Tilted | |
| Data collection | ||
| Grids | Carbon Quantifoil | Carbon Quantifoil |
| Vitrification method | FEI Vitrobot | FEI Vitrobot |
| Microscope | Titan Krios | Titan Krios |
| Magnification | 81,000 | 81,000 |
| Voltage (kV) | 300 | 300 |
| Stage tilt (°) | 0 | 30 |
| Detector | K3 DED | K3 DED |
| Recording mode | Counting | Counting |
| Total electron exposure (e–/Å2) | 57.8 | 57.8 |
| Number of frames | 40 | 40 |
| Defocus range (μm) | 0.2–2.0 | 0.2–2.0 |
| Pixel size (Å) | 1.054 | 1.054 |
| Data processing | ||
| Number of micrographs | 2127 | 3069 |
| Initial particle images (no.) | 806,067 | 1,620,545 |
| Final particle images (no.) | 89,450 | 119,739 |
| Initial particle images merged (no.) | 209,189 | |
| Final total particle images (no.) | 187,734 | |
| Symmetry | C1 | |
| Map resolution (Å) | 4.1 | |
| Refinement | ||
| Initial model used (PDB code) | 6PCV, 6VSK, 5D3X, 5FI1, 7RX9 | |
| Model resolution (Å) Fourier shell correlation threshold | 4.1 0.143 | |
| Map sharpening B factor (Å2) | –176 | |
| Model composition Non-hydrogen atoms Hydrogens Protein residues Ligands | 10,693 10,720 1,330 1 (4IP) | |
| B factors (Å2; min/max/mean) Protein Ligand | 30.9/202/123 143/143/143 | |
| R.m.s. deviations Bond lengths (Å) Bond angles (°) | 0.003 0.505 | |
| Validation MolProbity score Clashscore Rotamer outliers (%) CaBLAM outliers (%) | 2.03 13.88 0.94 2.2 | |
| Ramachandran plot (%) Favored Allowed Outliers | 94.5 5.5 0 | |
| Model vs. data CC mask CC box CC peaks CC volume Mean CC for ligand | 0.67 0.73 0.58 0.66 0.67 | |
Table 2
ThermoFluor measurements of DH/PH-DEP1 variants.
| DH/PH-DEP1 | Tm (°C) |
|---|---|
| WT | 44.0 ± 0.2 |
| A170K | 45.4 ± 0.3 (p<0.0001) |
| L173A | 43.0 ± 0.06 (p<0.0001) |
| L177A | 43.4 ± 0.4 (p=0.0076) |
| L177E | 43.4 ± 0.3 (p=0.0041) |
| L178A | 43.1 ± 0.1 (p<0.0001) |
| L178E I409A | 42.9 ± 0.1 (p<0.0001) 41.7 ± 0.8 (p<0.0001) |
| E411K | 43.9 ± 0.1 ns |
| K415A L451A E456K | 43.2 ± 0.5 (p=0.0047) 41.3 ± 0.5 (p<0.0001) ND |
| L466A | ND |
-
From two independent experiments performed in triplicate.
-
p-values are from one-way ANOVA comparisons with WT.
-
ND = not determined because inflection point not observed; ns = not significant.
Table 3
SAXS parameters for DH/PH-DEP1 variants.
| WT | A170K | L177E | I409A | |
|---|---|---|---|---|
| Guinier analysis | ||||
| I(0)* | 0.0081 ± 0.00004 | 0.0021 ± 0.003 | 0.0092 ± 0.00004 | 0.0034 ± 0.00002 |
| Rg (Å) | 30 ± 0.3 | 29 ± 0.08 | 31 ± 0.02 | 30 ± 0.4 |
| Qmin (Å–1) | 0.0047 | 0.005 | 0.0047 | 0.0047 |
| Qmax (Å–1) | 0.353 | 0.353 | 0.353 | 0.353 |
| P(r) analysis | ||||
| Dmax (Å) | 97 | 90 | 110 | 104 |
| Volume (Å3) | 73,900 | 75,000 | 72,500 | 74,900 |
| MMexp(MMcal) (kDa) | 54 (54) | 56 (54) | 54 (54) | 55 (55) |
| EOM analysis | ||||
| Crystal structures | 5FI1;6VSK | 5FI1;6VSK | 5FI1;6VSK | 5FI1;6VSK |
| q-range (Å–1) | .00475–0.353 | 0.00446–0.353 | .00475–0.353 | 00475–0.353 |
| Rflex | 70.1% (82.6%) | 71.9% (85.3%) | 82.9% (84.9%) | 79.1% (84.9%) |
| Rσ | 1.18 | 0.60 | 1.08 | 1.56 |
| Skewness | 2.39/0.41 | 1.11/0.40 | 0.85/0.42 | 1.50/0.40 |
| Kurtosis | 4.86/–0.08 | 2.09/–0.14 | –0.27/–0.12 | 0.77/–0.14 |
-
SAXS = small-angle X-ray scattering; EOM = ensemble optimization method.
-
*
SAXS parameters I(0), Rg, Dmax, qmin, qmax, MMexp, MMcal, Rflex, and Rσ are the experimentally determined intensity at zero scattering angle, radius of gyration, maximum particle dimension, minimum scattering angle, maximum scattering angle, molecular mass calculated from scattering data, molecular mass calculated based on amino acid sequence, flexibility metric of ensemble in comparison (pool value in parentheses), and ratio of standard deviation for the distribution of selected ensemble to that of pool, respectively. The values for EOM analysis are from the last run of the genetic algorithm.
Additional files
Download links
A two-part list of links to download the article, or parts of the article, in various formats.
Downloads (link to download the article as PDF)
Open citations (links to open the citations from this article in various online reference manager services)
Cite this article (links to download the citations from this article in formats compatible with various reference manager tools)
Structural and dynamic changes in P-Rex1 upon activation by PIP3 and inhibition by IP4
eLife 12:RP92822.
https://doi.org/10.7554/eLife.92822.4


