Hyperglycemia induced cathepsin L maturation linked to diabetic comorbidities and COVID-19 mortality
- Department of Endocrinology, Beijing Diabetes Institute, Beijing Tongren Hospital, Capital Medical University, China
- Department of Respiratory and Critical Care Medicine, Beijing Tongren Hospital, Capital Medical University, China
- Department of Science and Technology, Beijing Youan Hospital, Capital Medical University, China
- Division of HIV/AIDS and Sex-Transmitted Virus Vaccines, Institute for Biological Product Control, National Institutes for Food and Drug Control (NIFDC), Beijing, China, China
- Laboratory for Clinical Medicine, Capital Medical University, China
Figures
Figure 1
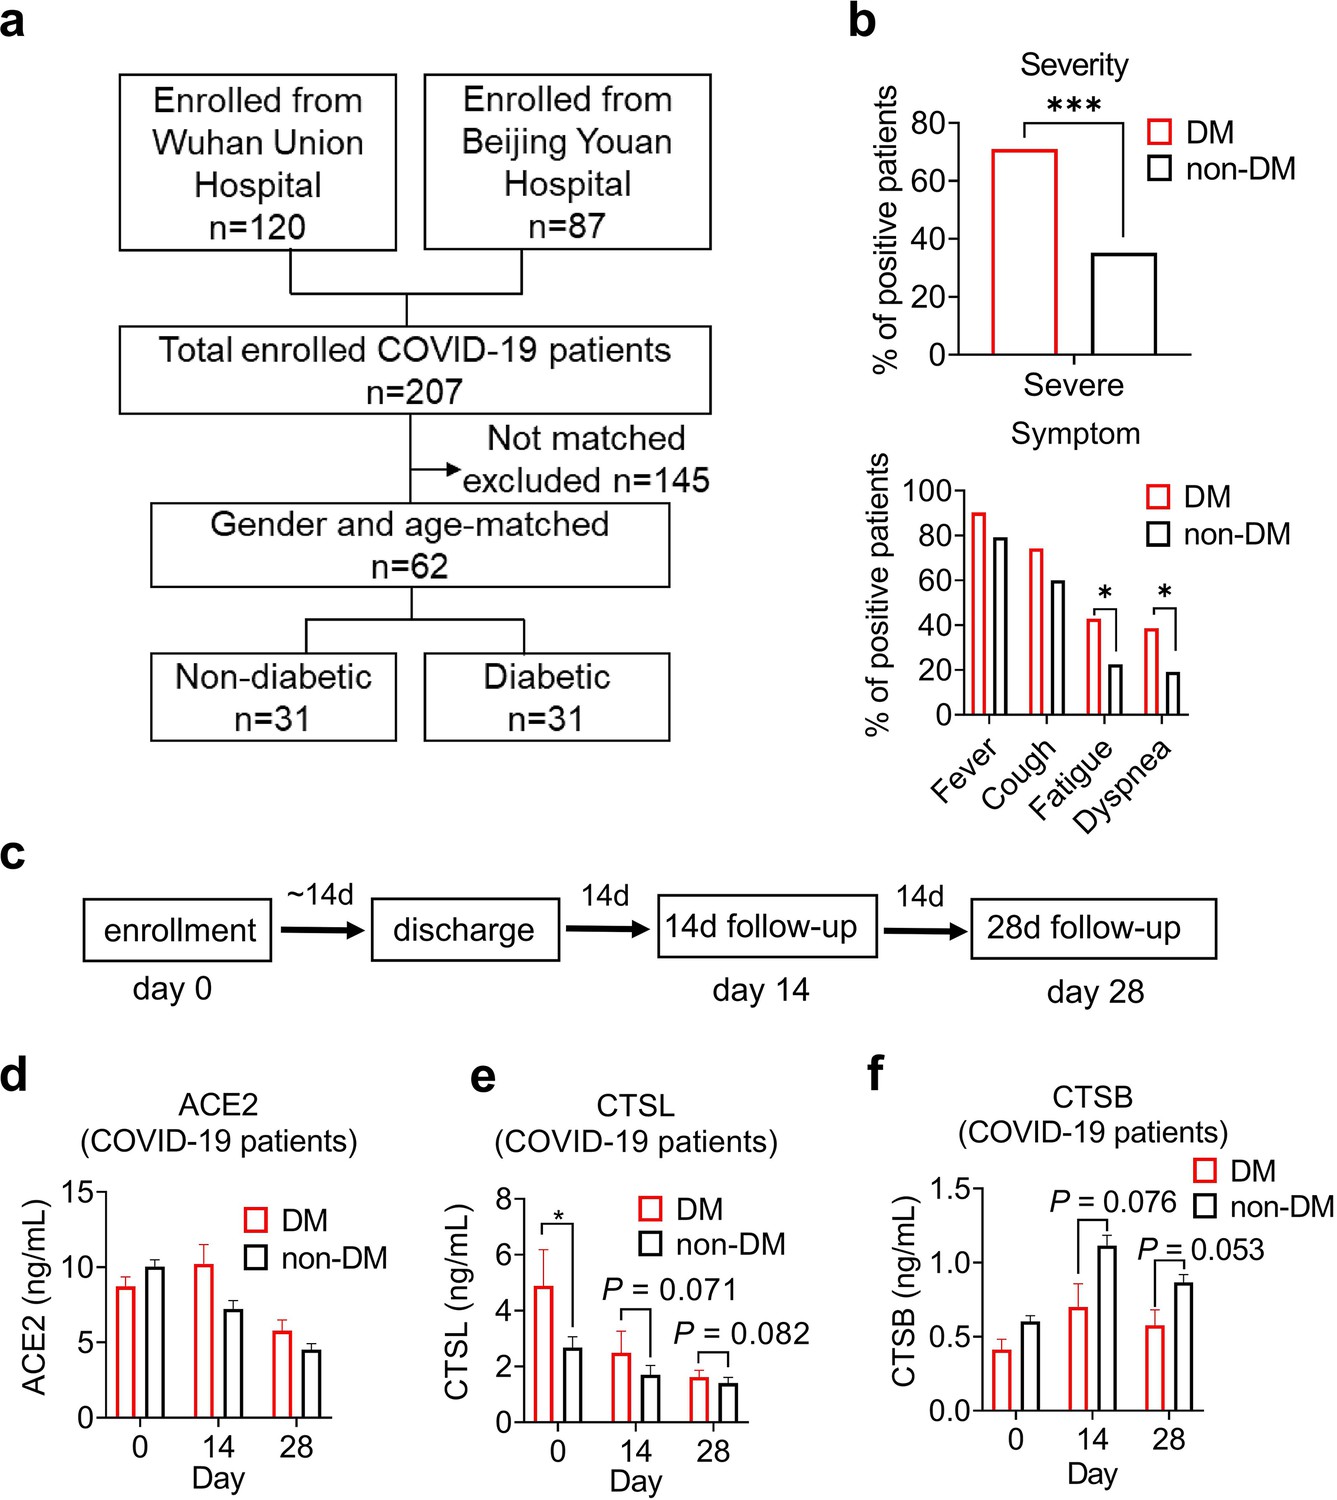
Disease severity and CTSL levels in COVID-19 patients with or without diabetes.
(a) Design and inclusion flowchart of the case-control study. Out of 207 COVID-19 patients from two hospitals, 62 were included in the study after matching for gender and age, 31 with diabetes and 31 without. (b) Comparison of symptom severity and prevalence between diabetic and non-diabetic COVID-19 patients. (c) Study design and timeline of the enrollment and follow-up study. After admitted to the hospital (Day 0), patients were hospitalized for a mean duration of 14 days, followed up 14 days (Day 14) and 28 days (Day 28) after discharge, and blood samples were collected at each time point. (d-f) Plasma levels of COVID-19-related proteins were measured in diabetic and non-diabetic COVID-19 patients on Day 0, Day 14, and Day 28. Statistical significance was assessed by unpaired t-test (b) and Mann-Whitney U-test (d-f). The data are presented as the means ± SEM. *p<0.05, ***p<0.001.
-
Figure 1—source data 1
The dataset of COVID-19 patients with or without diabetes.
- https://cdn.elifesciences.org/articles/92826/elife-92826-fig1-data1-v1.xlsx
Figure 2
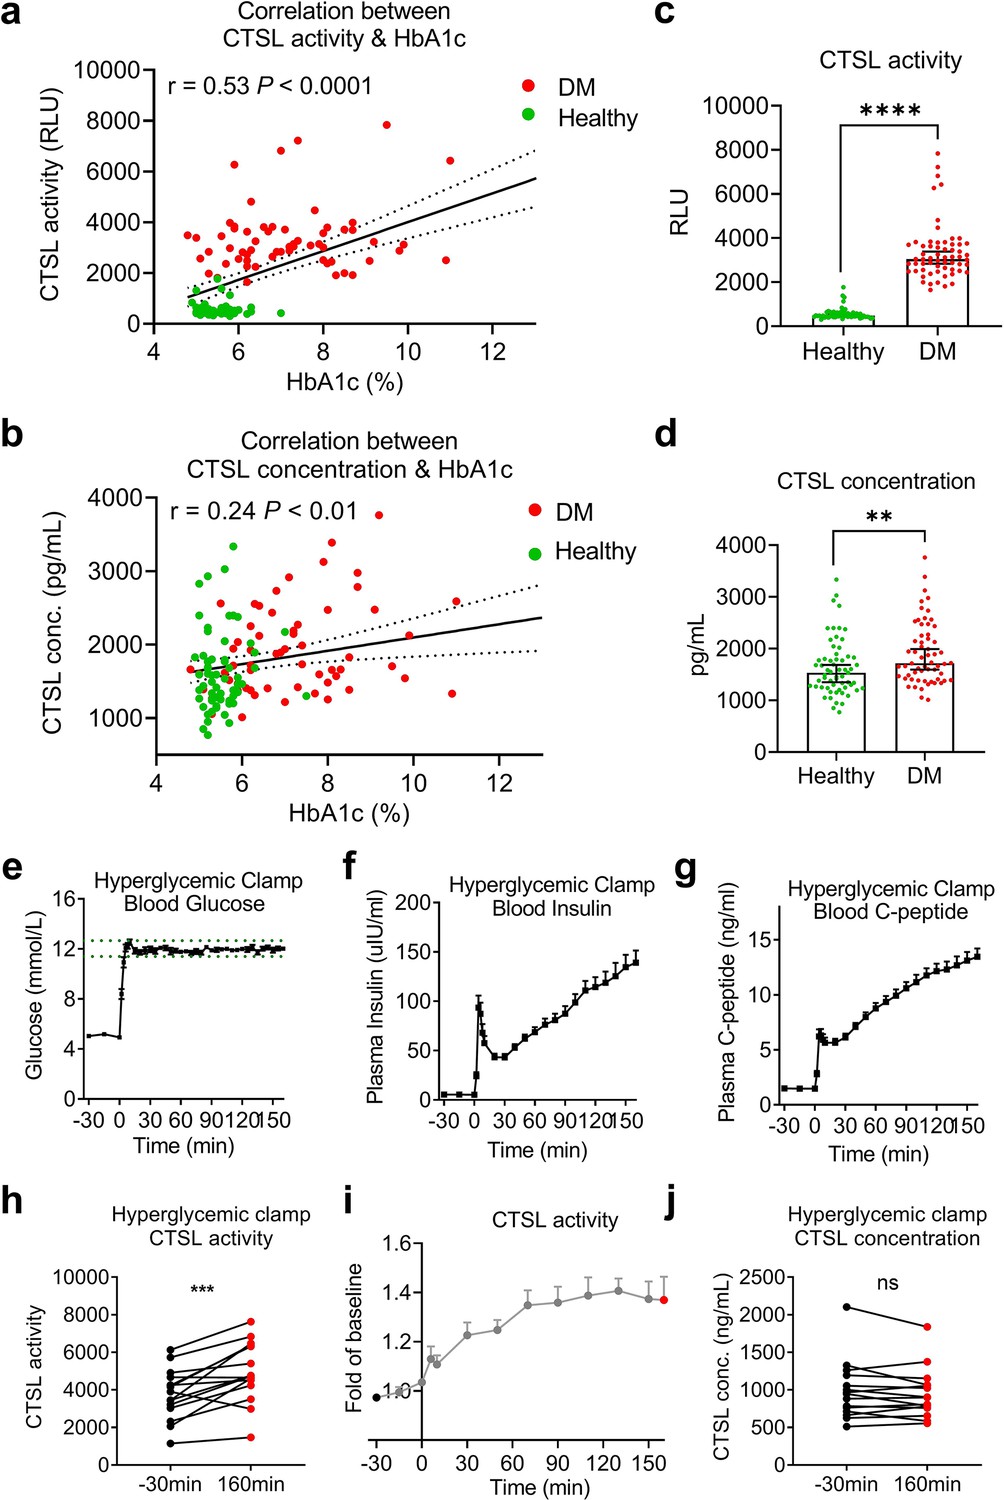
Impact of chronic and acute hyperglycemia on CTSL concentration and activity.
(a–d) Effects of chronic hyperglycemia on CTSL activity and concentration in 122 gender- and age-matched individuals without COVID-19, including 61 euglycemic volunteers and 61 diabetic patients. (a) Correlation between plasma CTSL activity and blood glucose level indicated by HbA1c. (b) Correlation between plasma CTSL concentration and HbA1c. The dashed line represents the 95% CI in (a and b). (c) Comparison of plasma CTSL activity between the euglycemic and diabetic groups. (d) Comparison of plasma CTSL concentration between the euglycemic and diabetic groups. The data are presented as the median with 95% CI in (c and d). (e-g) Hyperglycemic clamp study performed in 15 healthy male subjects. (e) Plasma glucose levels in subjects throughout the clamp study. The dashed lines represent the range of ±5% of the hyperglycemic target level (basal blood glucose level +6.9 mmol/L). (f) Insulin levels and (g) proinsulin C-peptide levels throughout the clamp study. (h–j) Effects of acute hyperglycemia on CTSL concentration and activity in 15 healthy male volunteers. (h) Plasma CTSL activity at the beginning and the end of the clamp study. (i) Plasma CTSL activity throughout the clamp study. (j) Plasma CTSL concentration at the beginning and the end of the clamp study. Statistical significance was assessed by Spearman correlation analysis (a and b), unpaired t-test (c and d) and paired t-test (h and j). The data are presented as the means ± SEM. **p<0.01, ***p<0.001, ****p<0.0001.
-
Figure 2—source data 1
The dataset of healthy individuals with or without diabetes and the original data of the hyperglycemic clamp study.
- https://cdn.elifesciences.org/articles/92826/elife-92826-fig2-data1-v1.xlsx
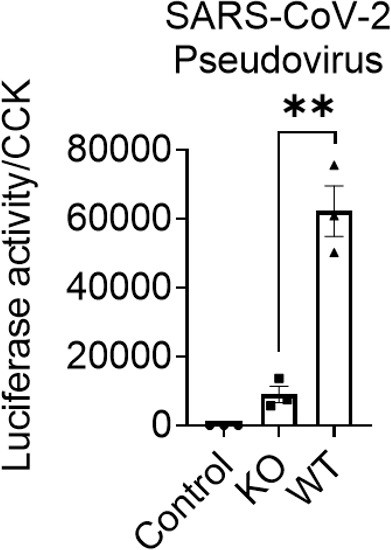
Figure 3
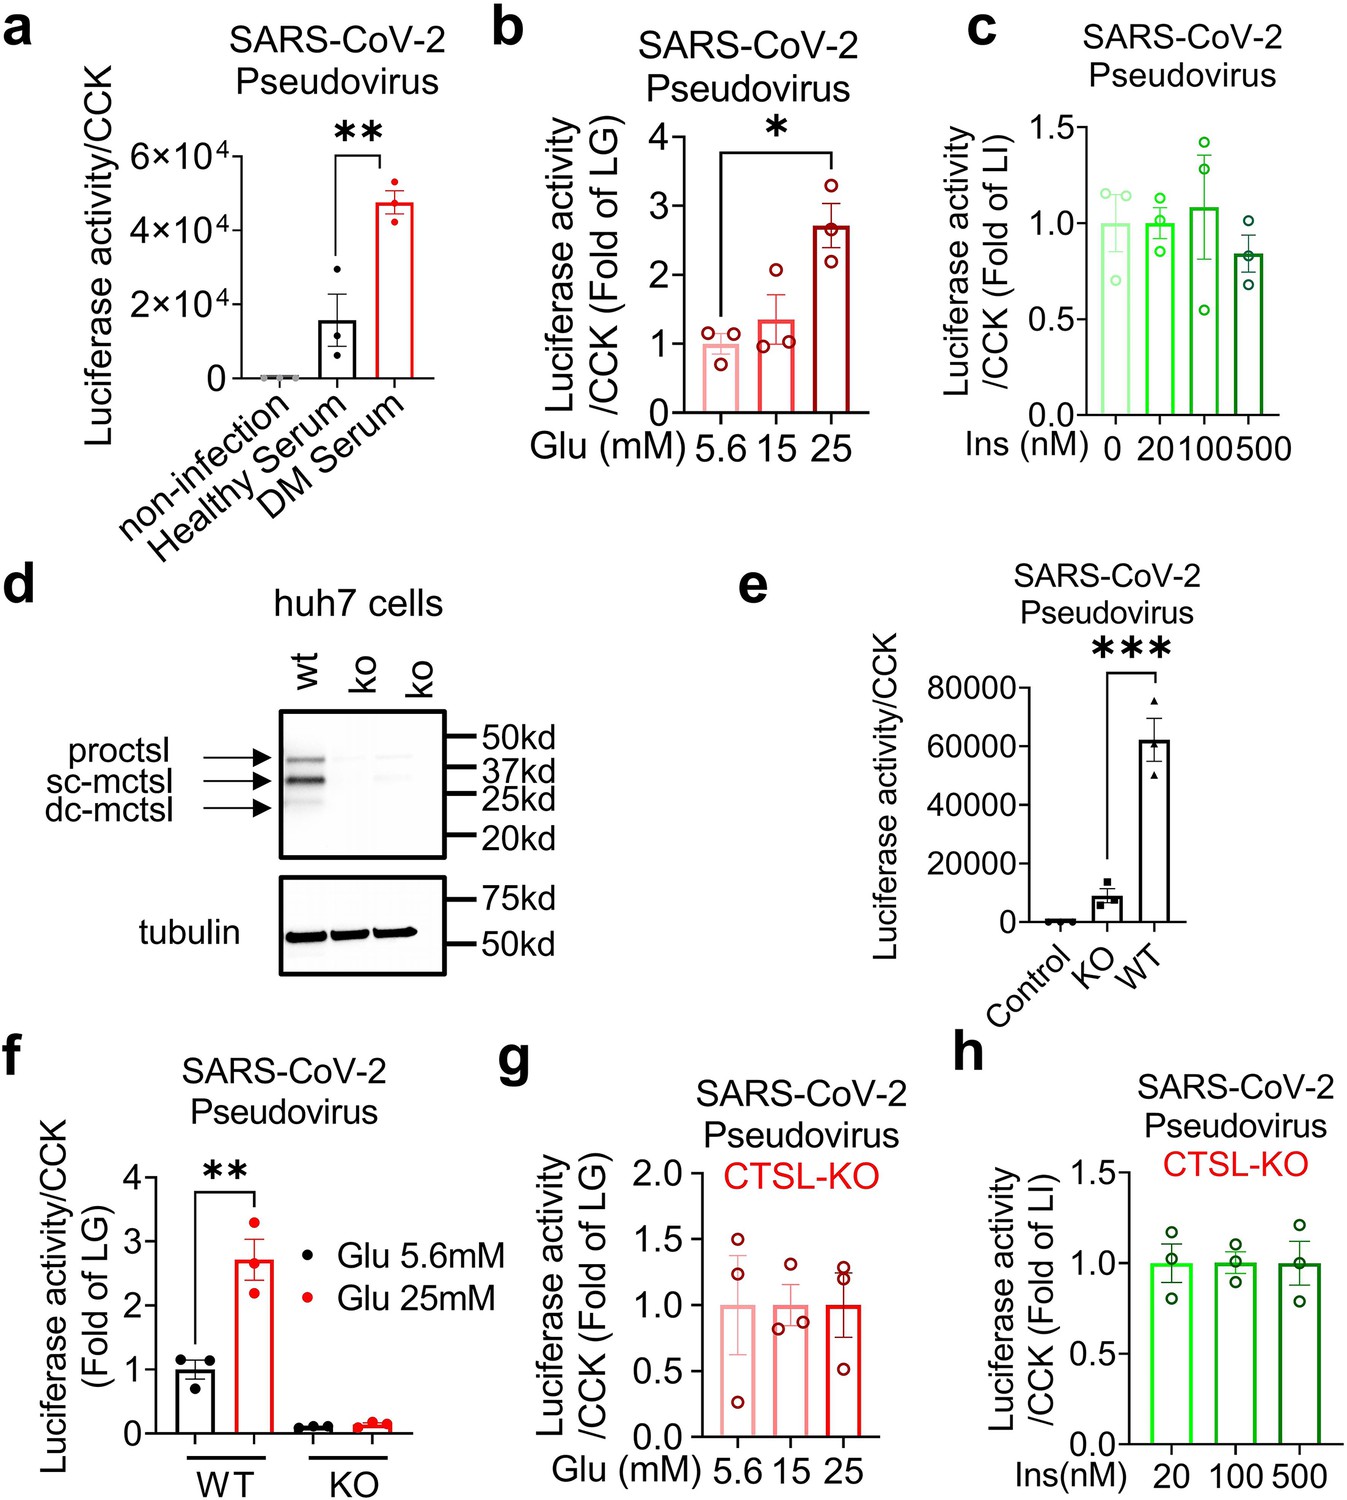
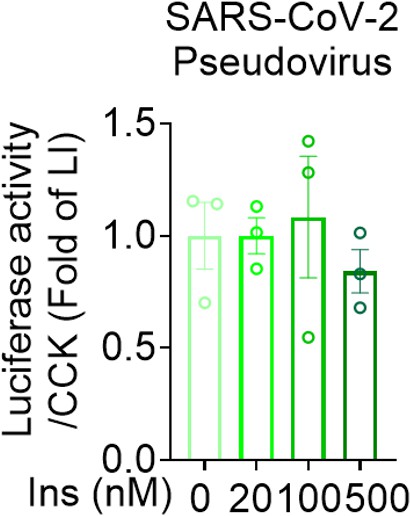
Hyperglycemia enhances SARS-CoV-2 infection through CTSL.
Huh7 cells were infected with SARS-CoV-2 pseudovirus. (a) Wildtype (WT) cells cultured in sera from healthy and diabetic individuals were infected with SARS-CoV-2 pseudovirus (1.3×10⁴ TCID50/ml). Non-infected cells are used as control. The infection levels, as indicated by luciferase activities, were adjusted by cell viability, as indicated by CCK (n=3). (b) The SARS-CoV-2 infection rate of WT cells after being cultured in different doses of glucose (5.6 mM, 15 mM and 25 mM) (n=3). (c) The SARS-CoV-2 infection rate of WT cells after being cultured in different doses of insulin (0 nM, 20 nM, 100 nM and 500 nM) (n=3). (d) Comparison of CTSL expression in WT and CTSL knockout (KO) cell lines. (e–h) The SARS-CoV-2 pseudovirus infection of WT and CTSL KO cells. € The SARS-CoV-2 infection rate of control, CTSL KO, and WT cells (n=3). (f) The SARS-CoV-2 infection rate of WT and CTSL KO Huh7 cells cultured in different doses of glucose (5.6 mM and 25 mM) (n=3). (g) The SARS-CoV-2 infection rate of CTSL KO Huh7 cells cultured in different doses of glucose (5.6 mM, 15 mM and 25 mM) (n=3). (h) The SARS-CoV-2 infection rate of CTSL KO Huh7 cells cultured in different doses of insulin (20 nM, 100 nM and 500 nM) (n=3). Statistical significance was assessed by one-way ANOVA with Tukey’s post hoc test (a–c, e–h). The data are presented as the means ± SEM. *p<0.05, **p<0.01, ***p<0.001.
-
Figure 3—source data 1
The original data supporting Figure 3.
- https://cdn.elifesciences.org/articles/92826/elife-92826-fig3-data1-v1.xlsx
-
Figure 3—source data 2
Raw western blots shown in Figure 3.
- https://cdn.elifesciences.org/articles/92826/elife-92826-fig3-data2-v1.zip
Figure 4
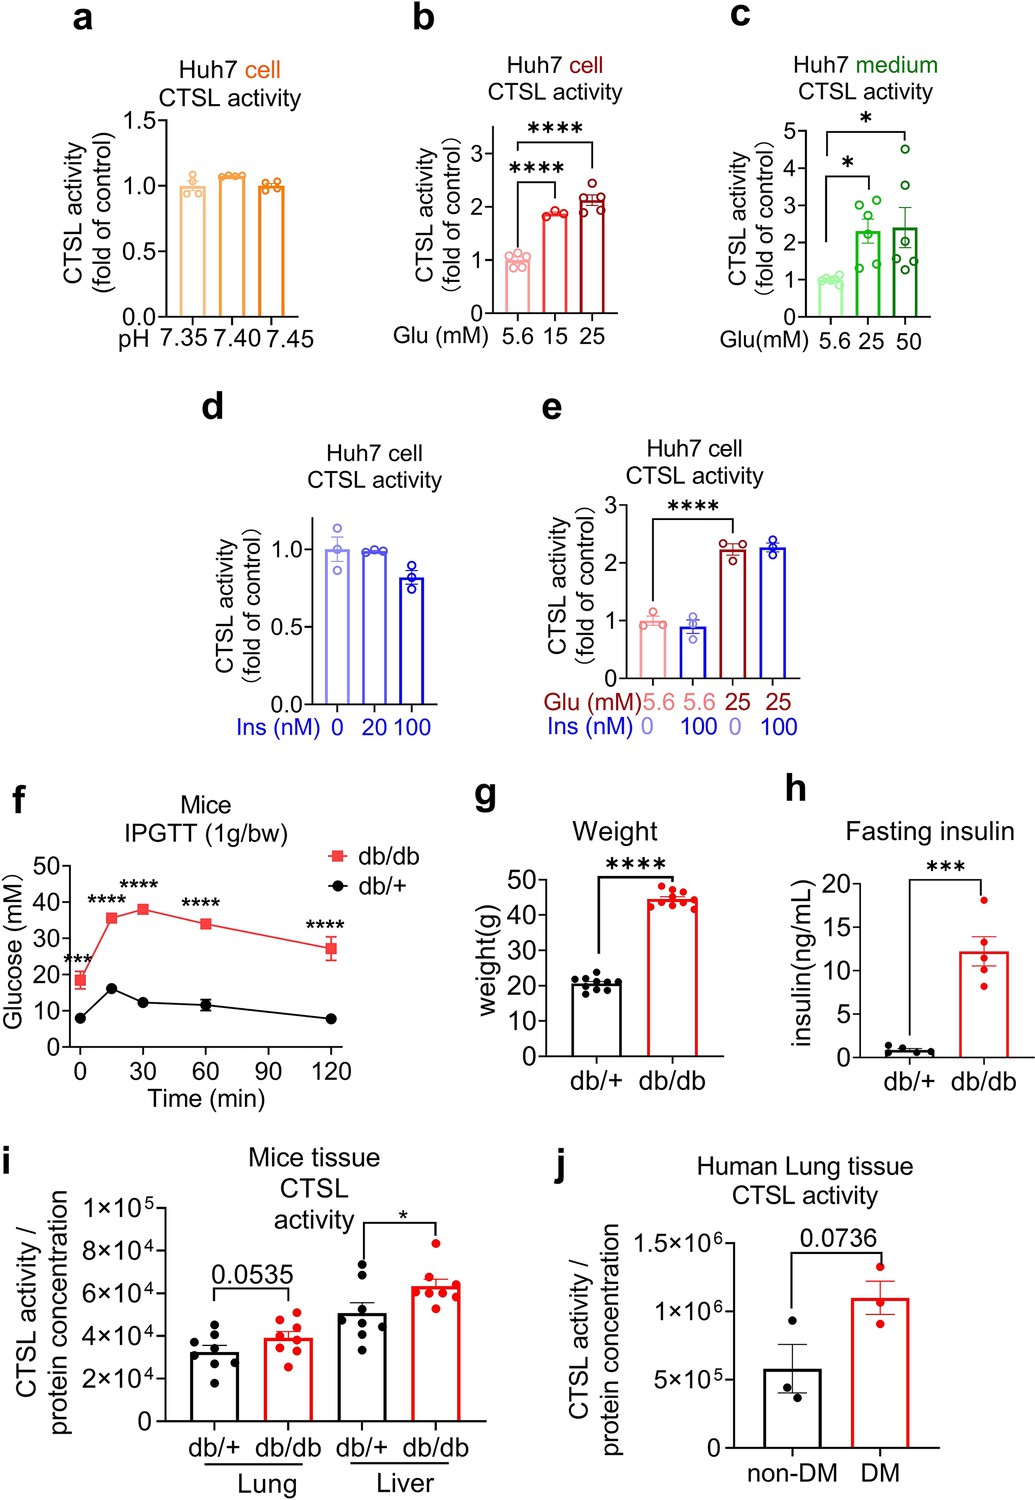
Elevation of glucose levels enhance CTSL activity.
Effects of high glucose levels on CTSL activity in Huh7 cells, as well as in biopsy samples of mice and diabetic patients. (a) Intracellular CTSL activity was measured in Huh7 cells cultured in different pH as indicated (n=4). (b) Intracellular CTSL activity was measured in Huh7 cells cultured in different glucose concentrations as indicated (5.6 Glu group, n=5; 15 Glu group, n=3; 25 Glu group, n=5). (c) Extracellular CTSL activity was measured in Huh7 cells cultured in different glucose concentrations as indicated (n=6). (d) Intracellular CTSL activity was measured in Huh7 cells cultured in different insulin concentration as indicated (n=3). (e) Intracellular CTSL activity was measured in Huh7 cells cultured in different glucose and insulin concentrations as indicated (n=3). (f) Blood glucose levels during the intraperitoneal glucose tolerance test (IPGTT) in Leprdb/db mice and Leprdb/+ mice (n=5). (g) Body weight of Leprdb/db mice and Leprdb/+ mice was measured (n=10). (h) Fasting insulin levels were measured in Leprdb/db mice and Leprdb/+ mice (n=5). (i) CTSL activity was measured in the lung and liver biopsy samples of Leprdb/db mice and Leprdb/+ mice (n=8). (j) CTSL activity was measured in human lung biopsy samples from diabetic (DM) and non-diabetic patients (n=3). Statistical significance was assessed by one-way ANOVA with Tukey’s post hoc test (a–e), two-way ANOVA with Sidak’s multiple comparisons test (f) and unpaired t-test (g–j). The data are presented as the means ± SEM. *p<0.05, ***p<0.001, ****p<0.0001.
-
Figure 4—source data 1
The original data supporting Figure 4.
- https://cdn.elifesciences.org/articles/92826/elife-92826-fig4-data1-v1.xlsx
Figure 5 with 2 supplements
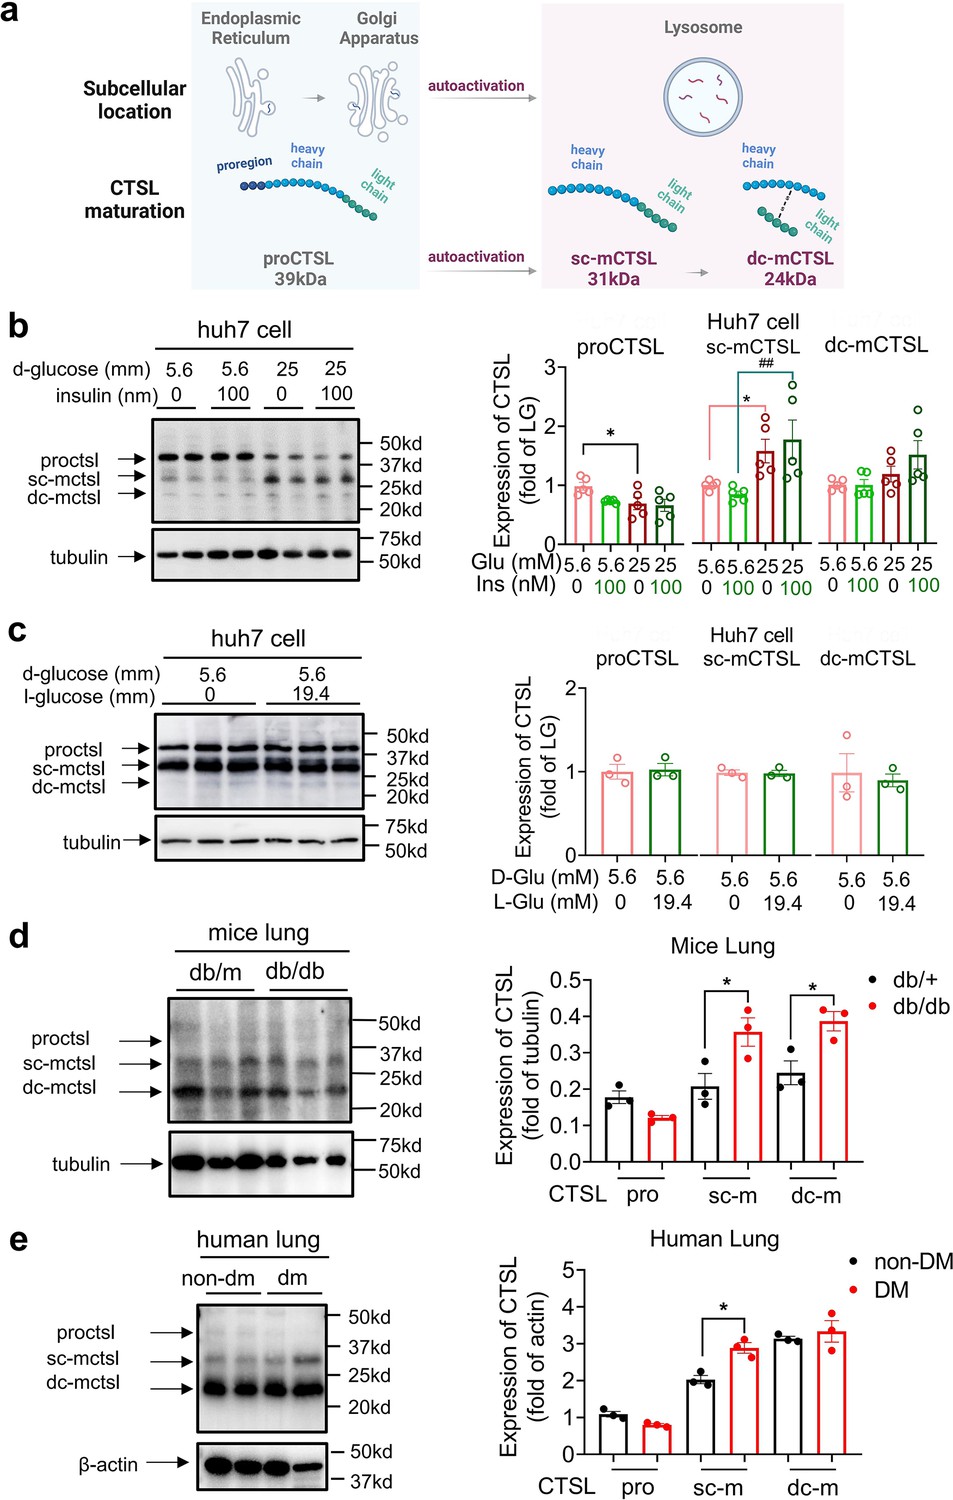
High glucose levels stimulate CTSL maturation.
(a) Schematic of the CTSL maturation process. Pro-cathepsin L (ProCTSL, 39 kDa) in endoplasmic reticulum (ER) and Golgi apparatus translocated to the lysosome and autoactivated into the single chain mature cathepsin L (sc-mCTSL, 31 kDa) and double chain mature cathepsin L (dc-mCTSL, 24 KDa). (b) Western blot analysis of CTSL protein in Huh7 cells cultured with different doses of D-glucose and insulin as indicated (n=5). (c) Western blot analysis of CTSL protein in Huh7 cells cultured with 5.6 mM D-glucose or D-glucose plus 19.4 mM L-glucose as indicated (n=3). (d) Western blot analysis of CTSL protein in lung tissues from Leprdb/db mice and Leprdb/+ mice (n=3). (e) Western blot analysis of CTSL protein in human lung tissues from non-diabetic and diabetic patients (n=3). Statistical significance was assessed by one-way ANOVA with Tukey’s post hoc test (b–e). The data are presented as the means ± SEM. *p<0.05, ##p<0.01.
-
Figure 5—source data 1
The original data supporting Figure 5.
- https://cdn.elifesciences.org/articles/92826/elife-92826-fig5-data1-v1.xlsx
-
Figure 5—source data 2
Raw western blots shown in Figure 5.
- https://cdn.elifesciences.org/articles/92826/elife-92826-fig5-data2-v1.zip
Figure 5—figure supplement 1
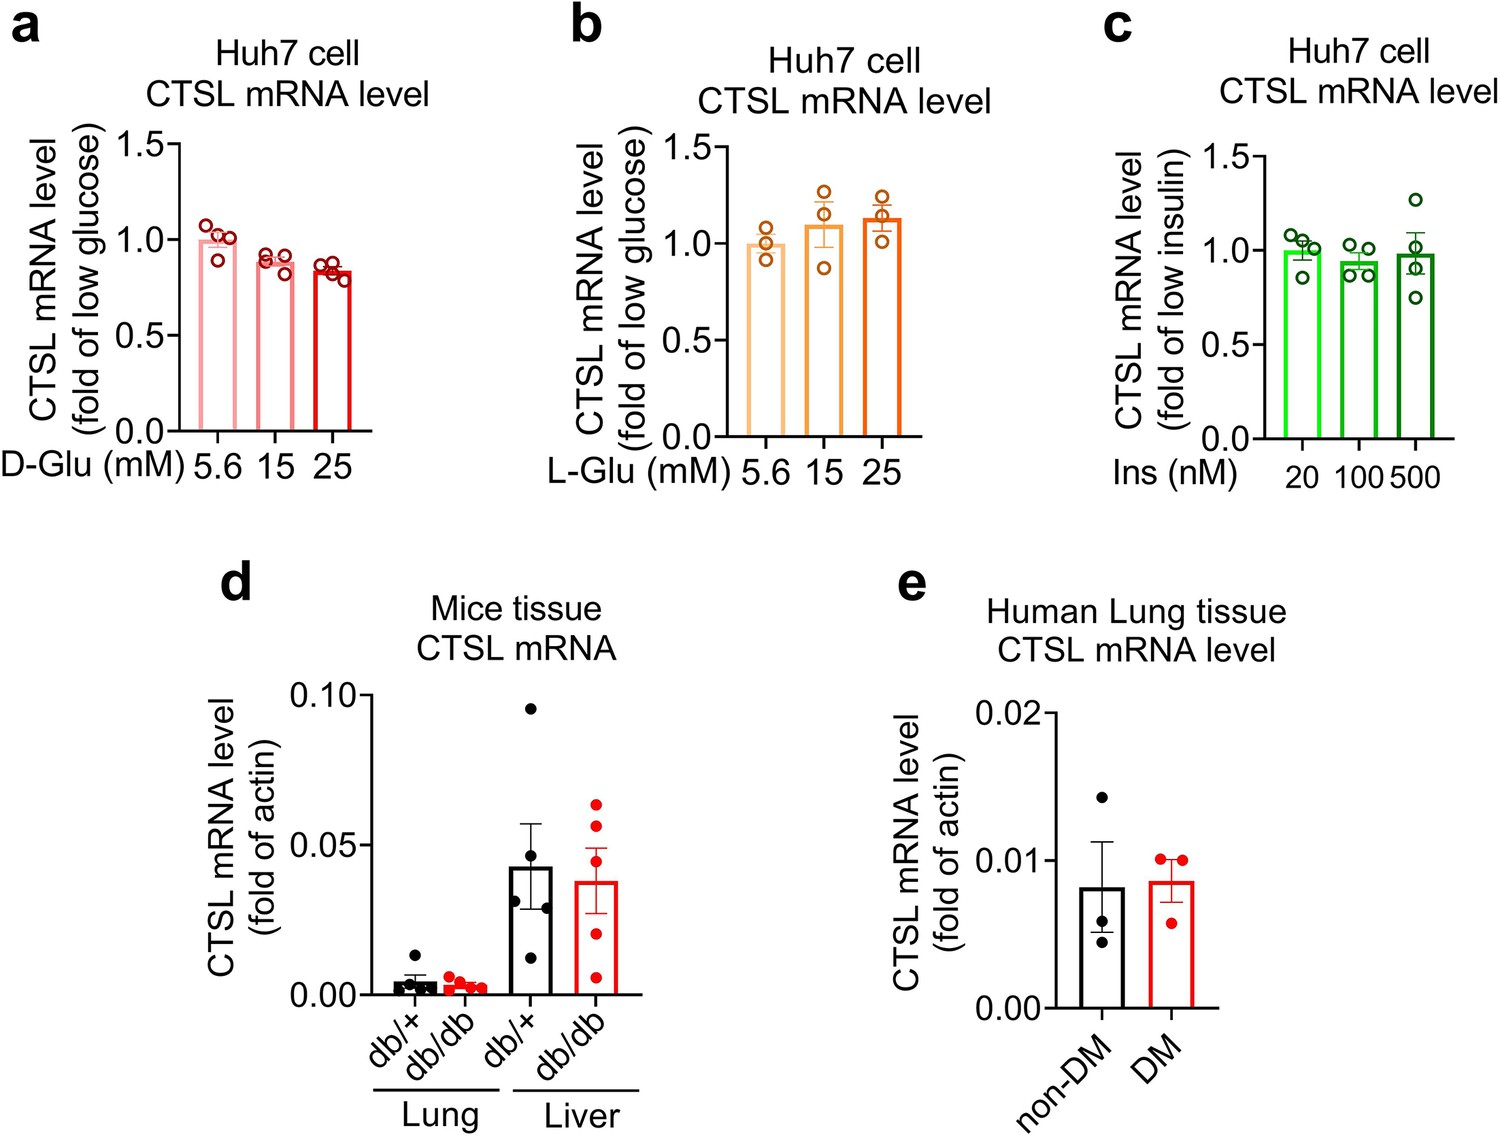
CTSL mRNA levels remain unchanged under different glucose conditions.
(a–c) mRNA levels of CTSL in Huh7 cells cultured in media containing different concentrations of (a) D-glucose, (b) L-glucose, and (c) insulin, as indicated (n=3–4). (d) mRNA levels of CTSL in Leprdb/db mice and Leprdb/+ mice lung and liver tissues (n=5). (e) mRNA levels of CTSL in human lung tissues (n=3). Significance was assessed by one-way ANOVA with Tukey’s post hoc test (a–c) and Mann-Whitney U-test (d and e). The data are presented as the means ± SEM.
-
Figure 5—figure supplement 1—source data 1
The original data supporting Figure 5—figure supplement 1.
- https://cdn.elifesciences.org/articles/92826/elife-92826-fig5-figsupp1-data1-v1.xlsx
Figure 5—figure supplement 2
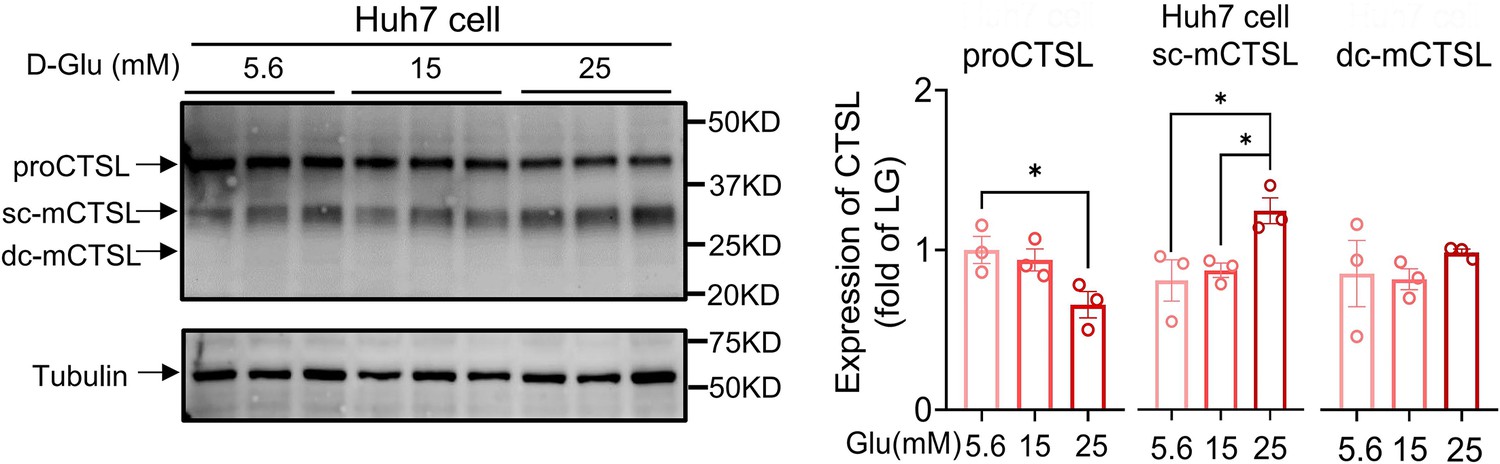
CTSL protein expression in Huh7 cells under different D-glucose concentrations.
CTSL expression in Huh7 cells cultured in media containing different concentrations of D-glucose (n=3). Statistical significance was assessed by one-way ANOVA with Tukey’s post hoc test. The data are presented as the means ± SEM. *p<0.05.
-
Figure 5—figure supplement 2—source data 1
The original data supporting Figure 5—figure supplement 2.
- https://cdn.elifesciences.org/articles/92826/elife-92826-fig5-figsupp2-data1-v1.xlsx
-
Figure 5—figure supplement 2—source data 2
Raw western blots shown in Figure 5—figure supplement 2.
- https://cdn.elifesciences.org/articles/92826/elife-92826-fig5-figsupp2-data2-v1.zip
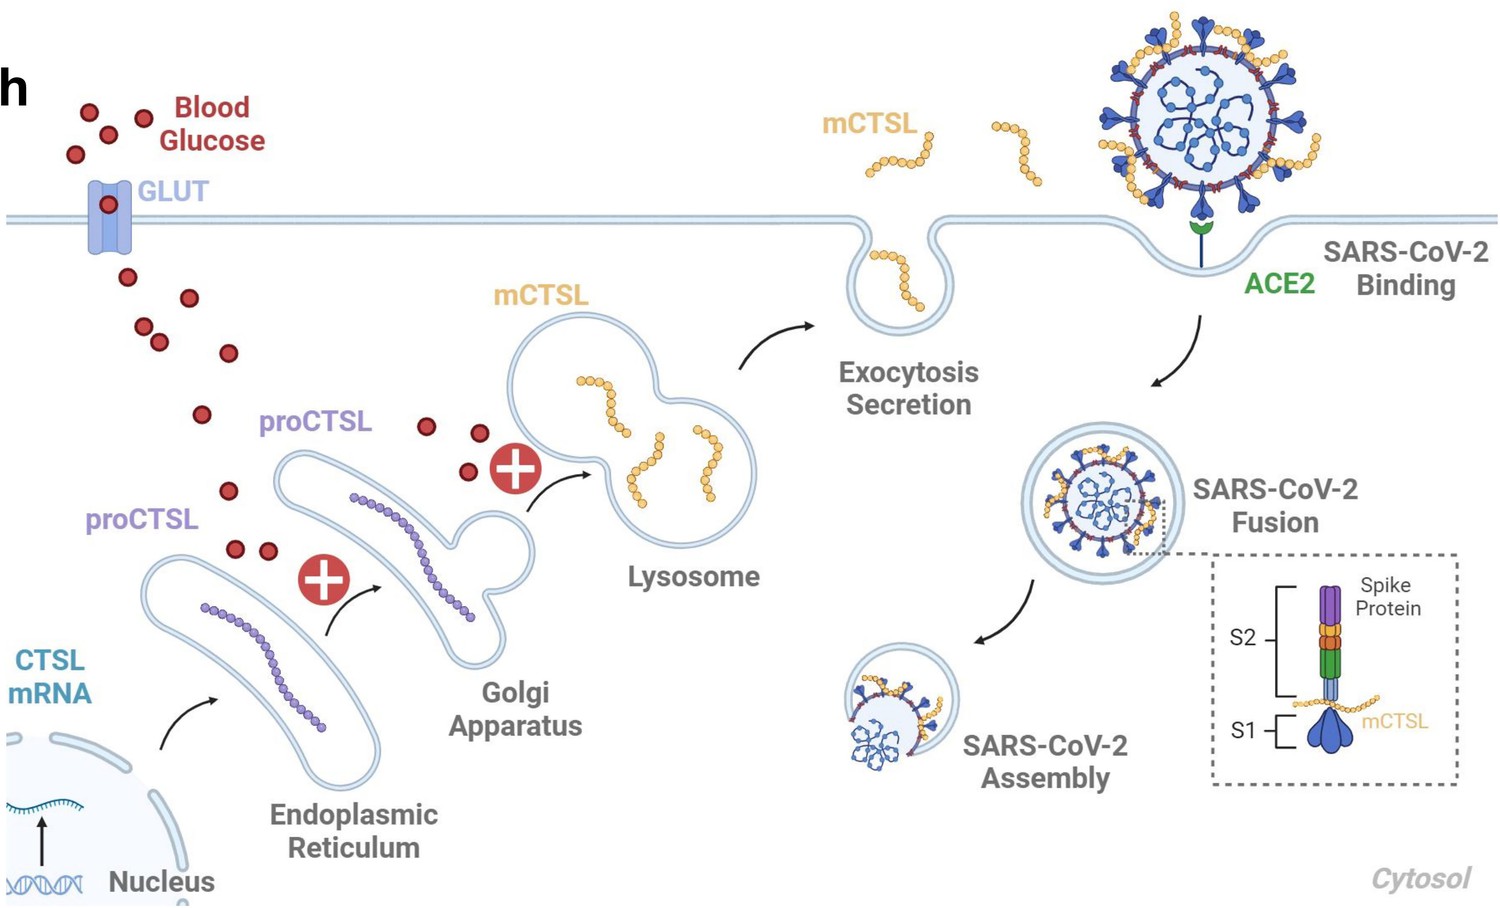
Figure 6 with 2 supplements
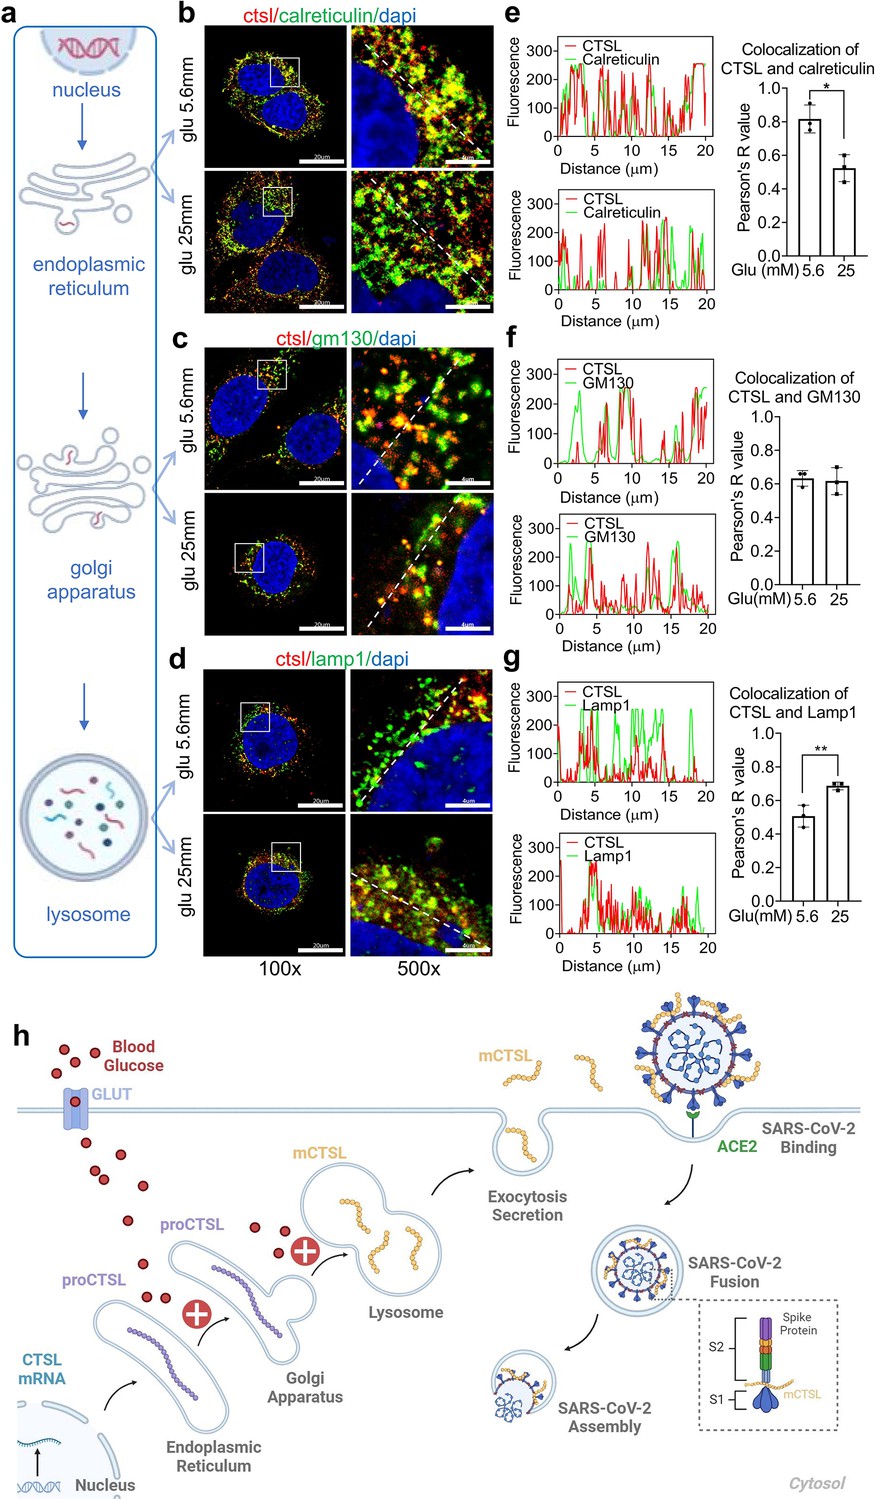
High glucose promotes CTSL translocation from endoplasmic reticulum to lysosome and enhances SARS-CoV-2 infection.
(a) A diagram illustrating the process of CTSL translocation via the endoplasmic reticulum (ER)-Golgi-lysosome axis. (b–d) Immunofluorescent staining of Huh7 cells cultured in 5.6 mM or 25 mM glucose as indicated. Co-localization analysis of CTSL (labeled red) and different organelles (labeled green) was performed using CTSL and organelle marker protein antibodies. (b) calreticulin for ER, (c) GM130 for Golgi apparatus, and (d) lamp1 for lysosome. (e–g) Fluorescence co-localization intensity analysis of the dashed line on the 500 times enlarged immunofluorescence picture. Fluorescence co-localization intensity was calculated using the Plot Profile tool in Image J software (n=3). Scale bars, 20 μm for 100 x and 4 μm for 500 x. (h) Proposed mechanisms of hyperglycemia drives CTSL maturation and enhances SARS-CoV-2 infection. (1) Blood glucose increased in diabetic patients. (2) Hyperglycemia promoted CTSL maturation through the ER-Golgi-lysosome axis. (3) CTSL activity increased and facilitated SARS-CoV-2 entry, by cleaving the spike protein (consist of S1 and S2 subunits), and enhanced COVID-19 severity in diabetic patients. All statistical significance was assessed using unpaired t-test. The data are presented as the means ± SEM. *p<0.05, **p<0.01.
-
Figure 6—source data 1
The original data supporting Figure 6.
- https://cdn.elifesciences.org/articles/92826/elife-92826-fig6-data1-v1.xlsx
Figure 6—figure supplement 1
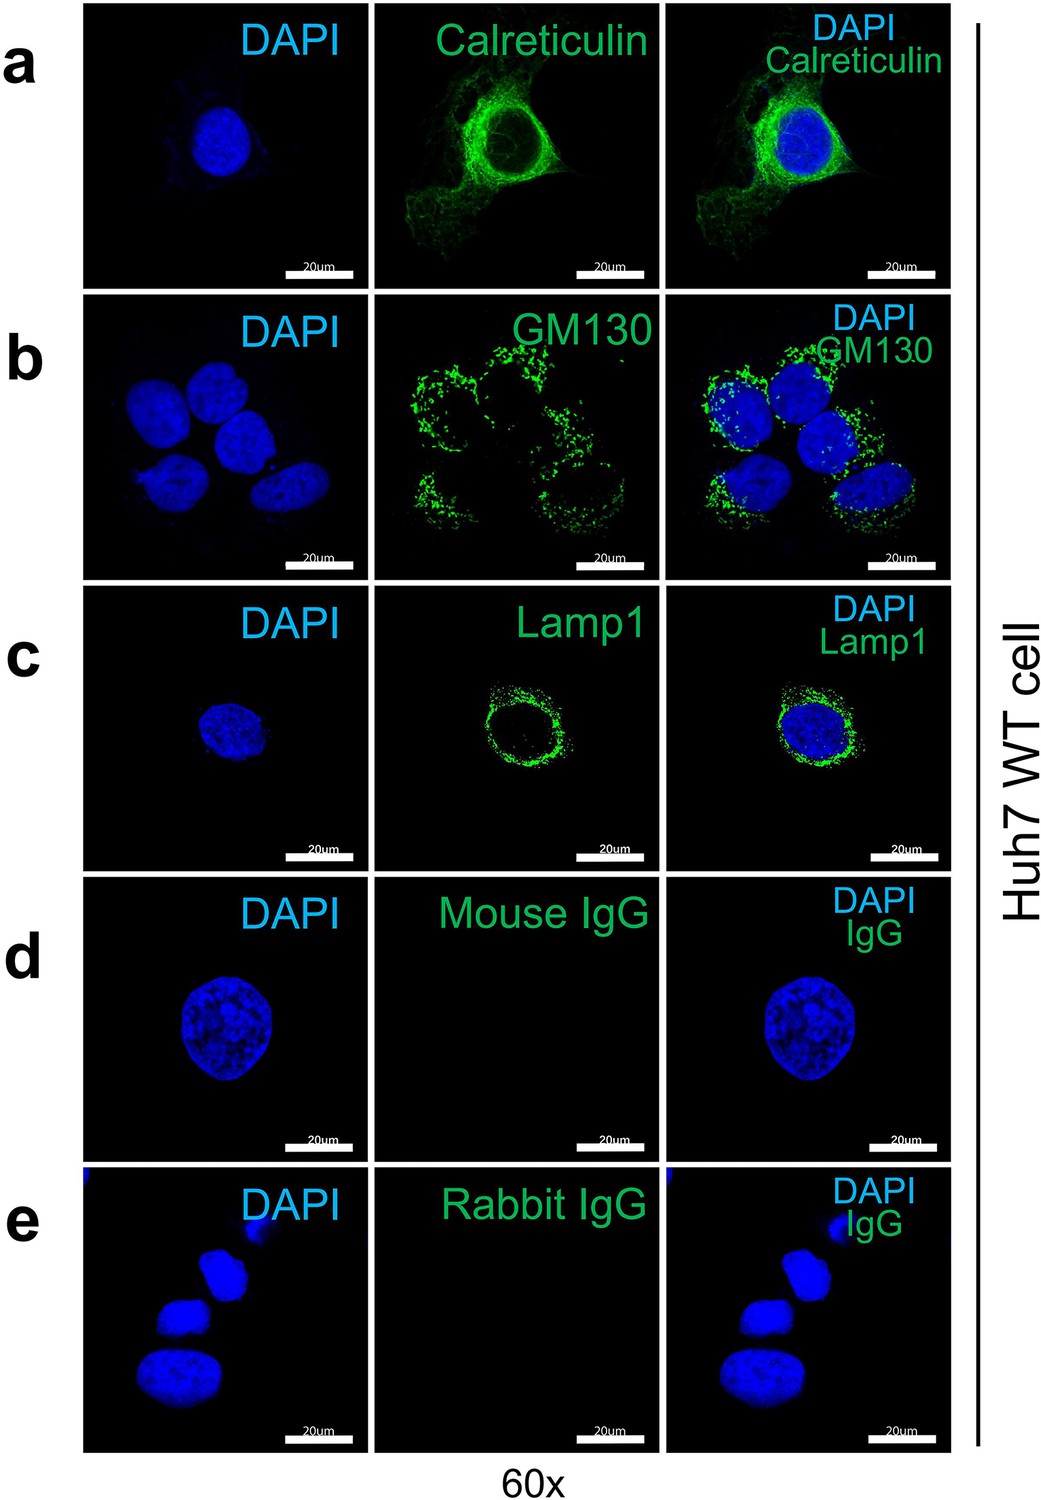
Immunofluorescent staining of organelle markers representing the endoplasmic reticulum (ER), Golgi apparatus and lysosome.
(a) Expression of calreticulin (endoplasmic reticulum marker protein) in WT Huh7 cells. (b) Expression of GM130 (Golgi apparatus marker protein) in WT Huh7 cells. (c) Expression of Lamp1 (lysosome marker protein) in WT Huh7 cells. (d) Mouse immunoglobulin G (IgG) was used as a negative control to show the specificity of the primary antibody binding to GM130 and Lamp1 antigen. (e) Rabbit IgG was used as a negative control to show the specificity of the primary antibody binding to calreticulin antigen.
Figure 6—figure supplement 2
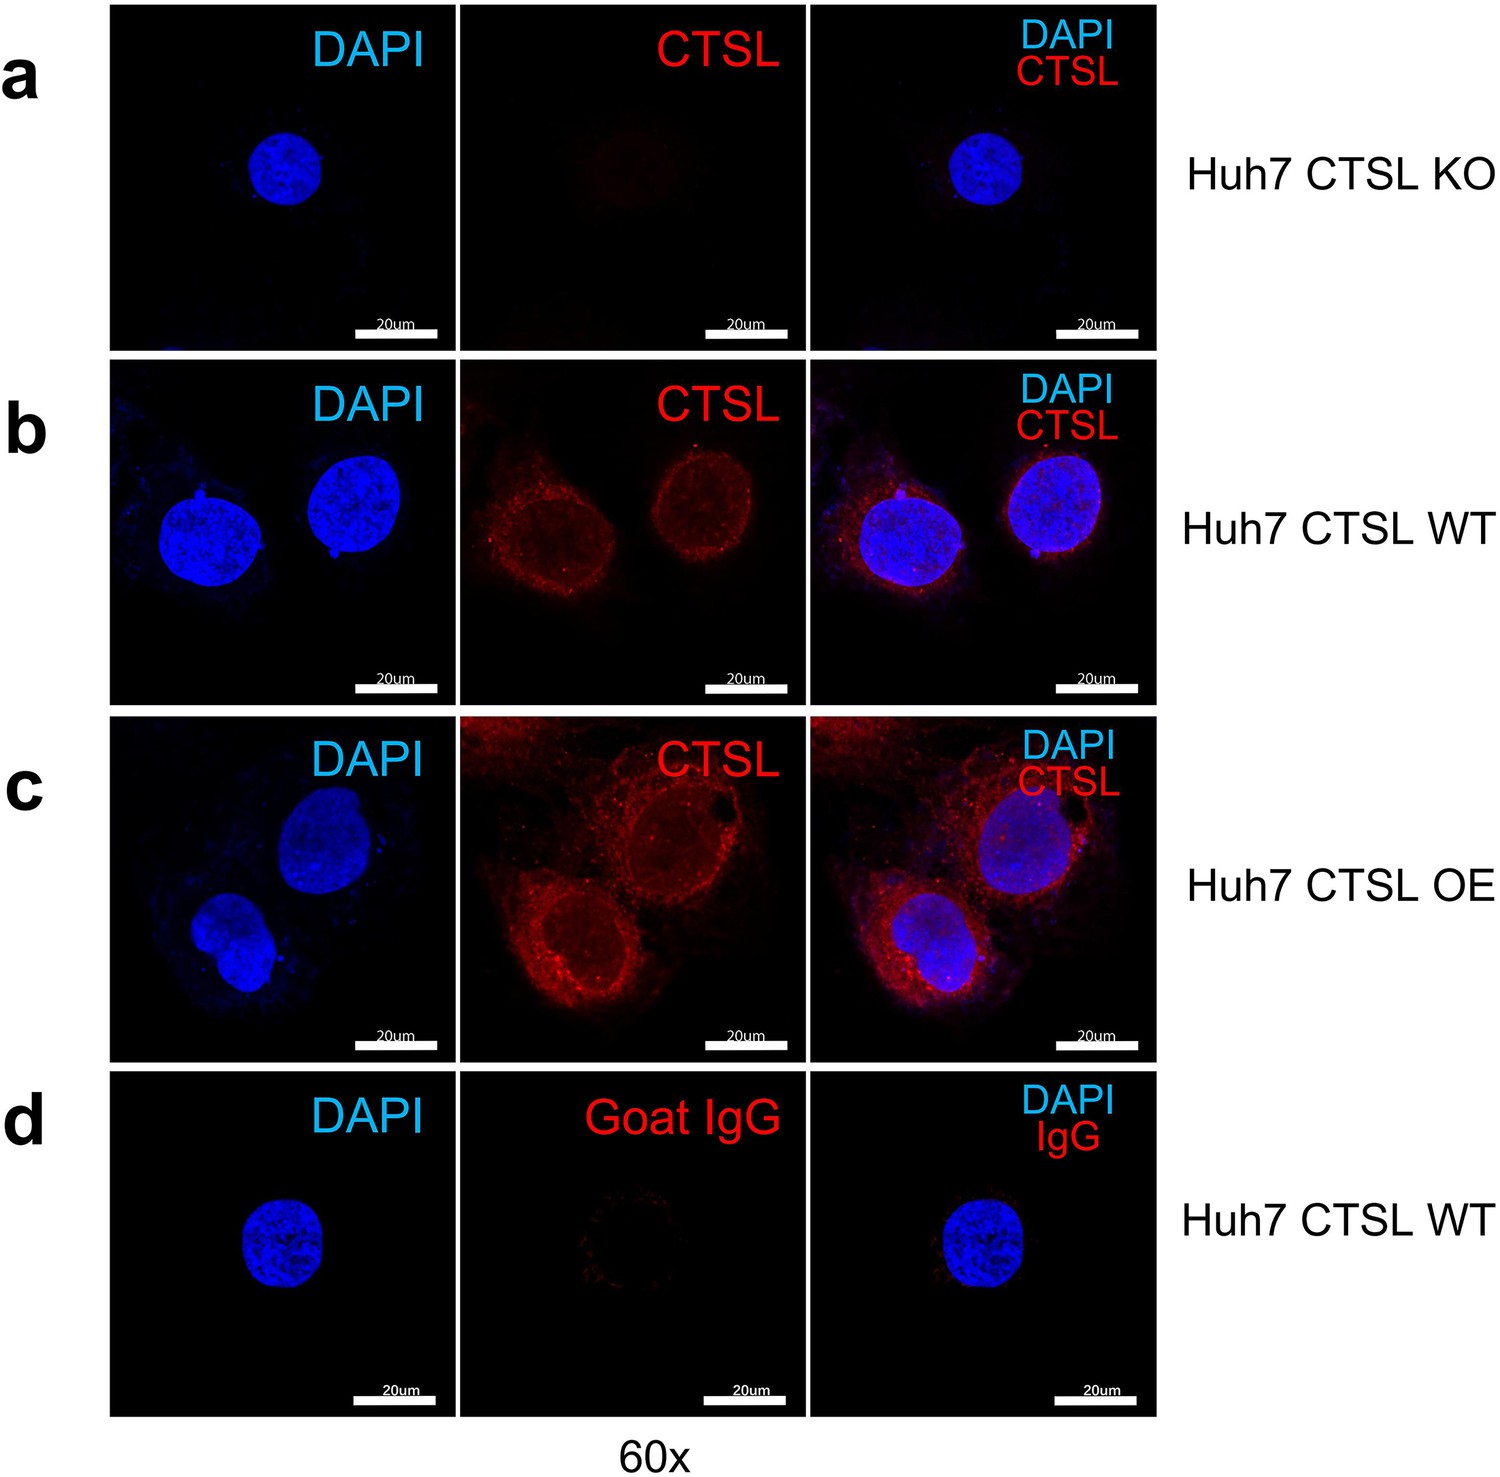
Immunofluorescent staining of CTSL in Huh7 cells.
(a) CTSL expression in wild-type (WT) Huh7 cells. (b) CTSL expression in CTSL knockout (KO) Huh7 cells. (c) CTSL expression in overexpression (OE) Huh7 cells. (d) Goat IgG was used as a negative control to show the specificity of the primary antibody binding to CTSL antigen.
Author response image 1

Author response image 2
Author response image 3
Author response image 4
Tables
Key resources table
| Reagent type (species) or resource | Designation | Source or reference | Identifiers | Additional information |
|---|---|---|---|---|
| Strain, strain background (Mus musculus) | Leprdb/db mice | Vital River Laboratories | N/A | N/A |
| Strain, strain background (Mus musculus) | Leprdb/+ mice | Vital River Laboratories | N/A | N/A |
| Cell line (Homo sapiens, liver) | The Huh7 cell line | Cell Resource Center, Chinese Academy of Medical Sciences | N/A | N/A |
| Biological sample (Homo sapiens) | Blood samples from patients with COVID-19 | Beijing Youan Hospital, Capital Medical University; Wuhan Union Hospital, Huazhong University of Science and Technology | N/A | N/A |
| Biological sample (Homo sapiens) | Blood samples from volunteers without COVID-19 | Beijing Tongren Hospital, Capital Medical University | N/A | N/A |
| Biological sample (Homo sapiens) | Human lung samples | Beijing Youan Hospital, Capital Medical University | N/A | N/A |
| Antibody | CTSL (Goat Polyclonal) | R&D System | AF952; RRID:AB_355737 | Dilution (1:2000) |
| Antibody | α-tubulin (Mouse Monoclonal) | Proteintech | 66031–1-Ig; RRID:AB_11042766 | Dilution (1:1000) |
| Antibody | β-actin (Mouse Monoclonal) | Proteintech | 66009–1-Ig; RRID:AB_2687938 | Dilution (1:1000) |
| Antibody | Calreticulin (Rabbit Monoclonal) | Cell Signaling Technology | 12238; RRID:AB_2688013 | Dilution (1:200) |
| Antibody | GM130 (Mouse) | BD Biosciences | 610822; RRID:AB_398141 | Dilution (1:200) |
| Antibody | Lamp1 (Mouse Monoclonal) | PTM BIO | PTM-5775 | Dilution (1:200) |
| Antibody | Goat IgG | Beyotime | A7007 | Dilution (1:500) |
| Antibody | Rabbit IgG | Beyotime | A7016; RRID:AB_2905533 | Dilution (1:500) |
| Antibody | Mouse IgG | Beyotime | A7028; RRID:AB_2909433 | Dilution (1:500) |
| Sequence-based reagent | Primer: CTSL (human) - F | This paper | AAACTGGGAGGCTTATCTCACT | N/A |
| Sequence-based reagent | Primer: CTSL (human) - R | This paper | GCATAATCCATTAGGCCACCAT | N/A |
| Sequence-based reagent | Primer: Ctsl (mouse) - F | This paper | CTACACAACGGGGAATACAGC | N/A |
| Sequence-based reagent | Primer: Ctsl (mouse) - R | This paper | CATTGGTCATGTCACCGAAGG | N/A |
| Sequence-based reagent | Primer: ACTB (human) – F | This paper | TCATGAAGTGTGACGTGGACATC | N/A |
| Sequence-based reagent | Primer: ACTB (human) – R | This paper | CAGGAGGAGCAATGATCTTGATCT | N/A |
| Sequence-based reagent | Primer: Actb (mouse) – F | This paper | GTGACGTTGACATCCGTAAAGA | N/A |
| Sequence-based reagent | Primer: Actb (mouse) – R | This paper | GCCGGACTCATCGTACTCC | N/A |
| Commercial assay or kit | Human ACE2 Elisa kit | Cloud-Clone Corp | Cat. No L220216094 | N/A |
| Commercial assay or kit | Human CTSL ELISA Kit | Elabscience | Cat. No E-EL-H0671 | N/A |
| Commercial assay or kit | Human CTSB ELISA kit | Elabscience | Cat. No E-EL-H6151 | N/A |
| Commercial assay or kit | Mouse insulin ELISA kit | Millipore | Cat. No EZRMI-13K; RRID:AB_2783856 | N/A |
| Commercial assay or kit | Britelite Plus Kit | Perkinelmer | Cat. No 6066761 | N/A |
| Commercial assay or kit | Cell Counting Kit | Transgen | Cat. No FC101-04 | N/A |
| Commercial assay or kit | RNAprep Pure Cell/ Bacteria kit | Tiangen | Cat. No DP430 | N/A |
| Commercial assay or kit | RNAprep Pure Tissue kit | Tiangen | Cat. No DP431 | N/A |
| Chemical compound, drug | Ac-FR-AFC | R&D | Cat. No ES009 | N/A |
| Chemical compound, drug | TransScript First-Strand cDNA Synthesis SuperMix | Transgen | Cat. No AT301 | N/A |
| Chemical compound, drug | TransStart Tip Green qPCR SuperMix | Transgen | Cat. No AQ141 | N/A |
| Software, algorithm | Image J | Image J Software | https://imagej.net/software/imagej/ | N/A |
| Software, algorithm | Graphpad prism 7.0 | GraphPad Software | https://www.graphpad.com | N/A |
| Software, algorithm | SPSS for Windows 17.0 | IBM SPSS Software | https://www.ibm.com/analytics/spss-statistics-software | N/A |
| Software, algorithm | Microsoft Office Home and Student 2019 | Microsoft Corporation | https://www.microsoft.com/microsoft-365 | N/A |
Additional files
-
Supplementary file 1
Comparation of clinical features of COVID-19 patients.
Data are median (IQR) or n (%). P values were calculated by Mann-Whitney U-test (†) or χ² test (#), as appropriate for group comparison analyses.
- https://cdn.elifesciences.org/articles/92826/elife-92826-supp1-v1.docx
-
Supplementary file 2
Demographic and clinical characteristics of non-COVID-19 patients.
Data are median (IQR) or n (%). P values were calculated by Mann-Whitney U-test (†) or χ² test (#), as appropriate for group comparison analyses.
- https://cdn.elifesciences.org/articles/92826/elife-92826-supp2-v1.docx
-
Supplementary file 3
Nonparametric correlations of parameters correlated with CTSL levels and diabetes in non-COVID-19 individuals.
Data are correlation coefficient (P value). Spearman’s rho test (two-tailed).
- https://cdn.elifesciences.org/articles/92826/elife-92826-supp3-v1.docx
-
Supplementary file 4
Demographic and clinical characteristics of human lung tissues donor.
Six enrolled patients undergoing lung surgery in general surgery department of Beijing Tongren Hospital ranging from March 22 to June 22, 2022.
- https://cdn.elifesciences.org/articles/92826/elife-92826-supp4-v1.docx
-
MDAR checklist
- https://cdn.elifesciences.org/articles/92826/elife-92826-mdarchecklist1-v1.docx
Download links
A two-part list of links to download the article, or parts of the article, in various formats.
Downloads (link to download the article as PDF)
Open citations (links to open the citations from this article in various online reference manager services)
Cite this article (links to download the citations from this article in formats compatible with various reference manager tools)
Hyperglycemia induced cathepsin L maturation linked to diabetic comorbidities and COVID-19 mortality
eLife 13:RP92826.
https://doi.org/10.7554/eLife.92826.3


