A novel bioinformatics pipeline for the identification of immune inhibitory receptors as potential therapeutic targets
- Center for Translational Immunology, University Medical Centre Utrecht, Utrecht University, Netherlands
- Oncode Institute, Netherlands
- Department of Hematology, University Medical Center Utrecht, Utrecht University, Netherlands
- Department of Biosystems Science and Engineering, ETH Zurich, Switzerland
- Theoretical Biology and Bioinformatics, Department of Biology, Utrecht University, Netherlands
Figures
Figure 1 with 1 supplement
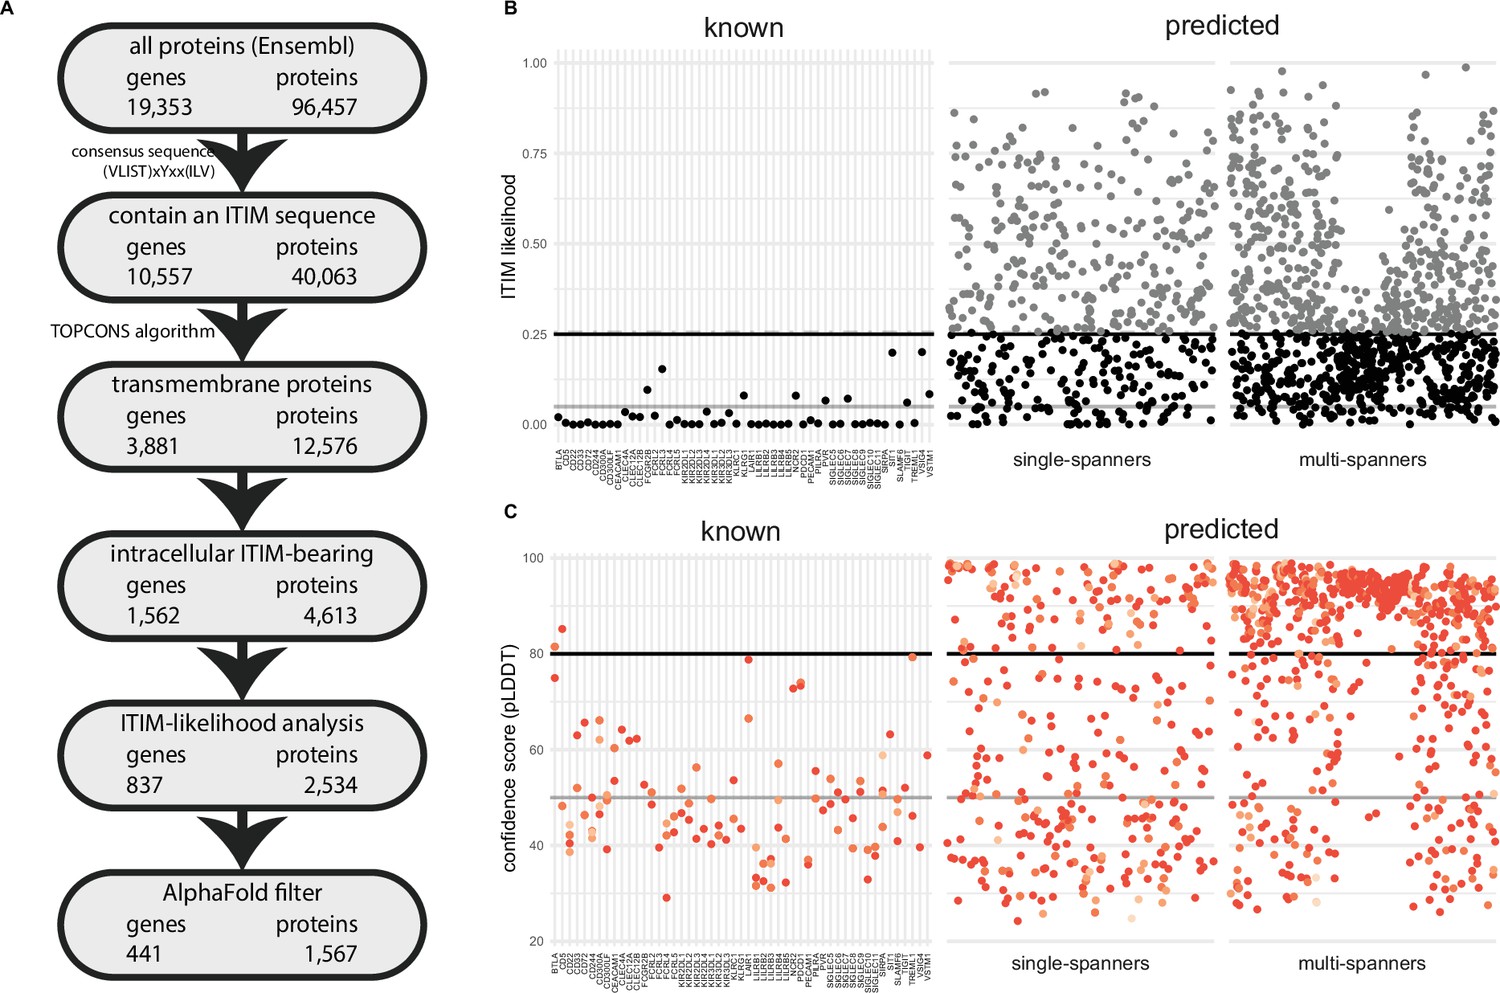
A novel bioinformatics approach for the identification of predicted inhibitory receptors.
(A) Schematic overview of the bioinformatics pipeline with the number of unique genes and corresponding proteins remaining at every step. All amino acid sequences corresponding to a protein-coding transcript were retrieved from Ensembl. (B) Intracellular domains of identified proteins were permutated 10,000 times, and the number of immunoreceptor tyrosine-based inhibitory motif (ITIM) or immunoreceptor tyrosine-based switch motif (ITSM) occurrences were compared to the number of ITIMs in the original sequence to determine the likelihood of a specific intracellular domain containing an ITIM or ITSM. Threshold was determined based on known inhibitory receptors, and set at 0.25+ε, with ε being a random number between 0 and 0.01 to better predict the borderline predictions. The black line indicates 0.25 likelihood, the grey dotted line indicates 0.25+ε and the solid grey line indicates 0.05 likelihood. (C) Three-dimensional structure for all proteins was predicted using AlphaFold, and the average model prediction score (pLDDT) was determined for each individual ITIM or ITSM in the protein. Proteins with all ITIMs above 80 pLDDT were excluded. The black line indicates 80 pLDDT threshold and the solid grey line indicates 50 pLDDT. For B and C, one protein is plotted for every unique gene symbol for clarity.
Figure 1—figure supplement 1
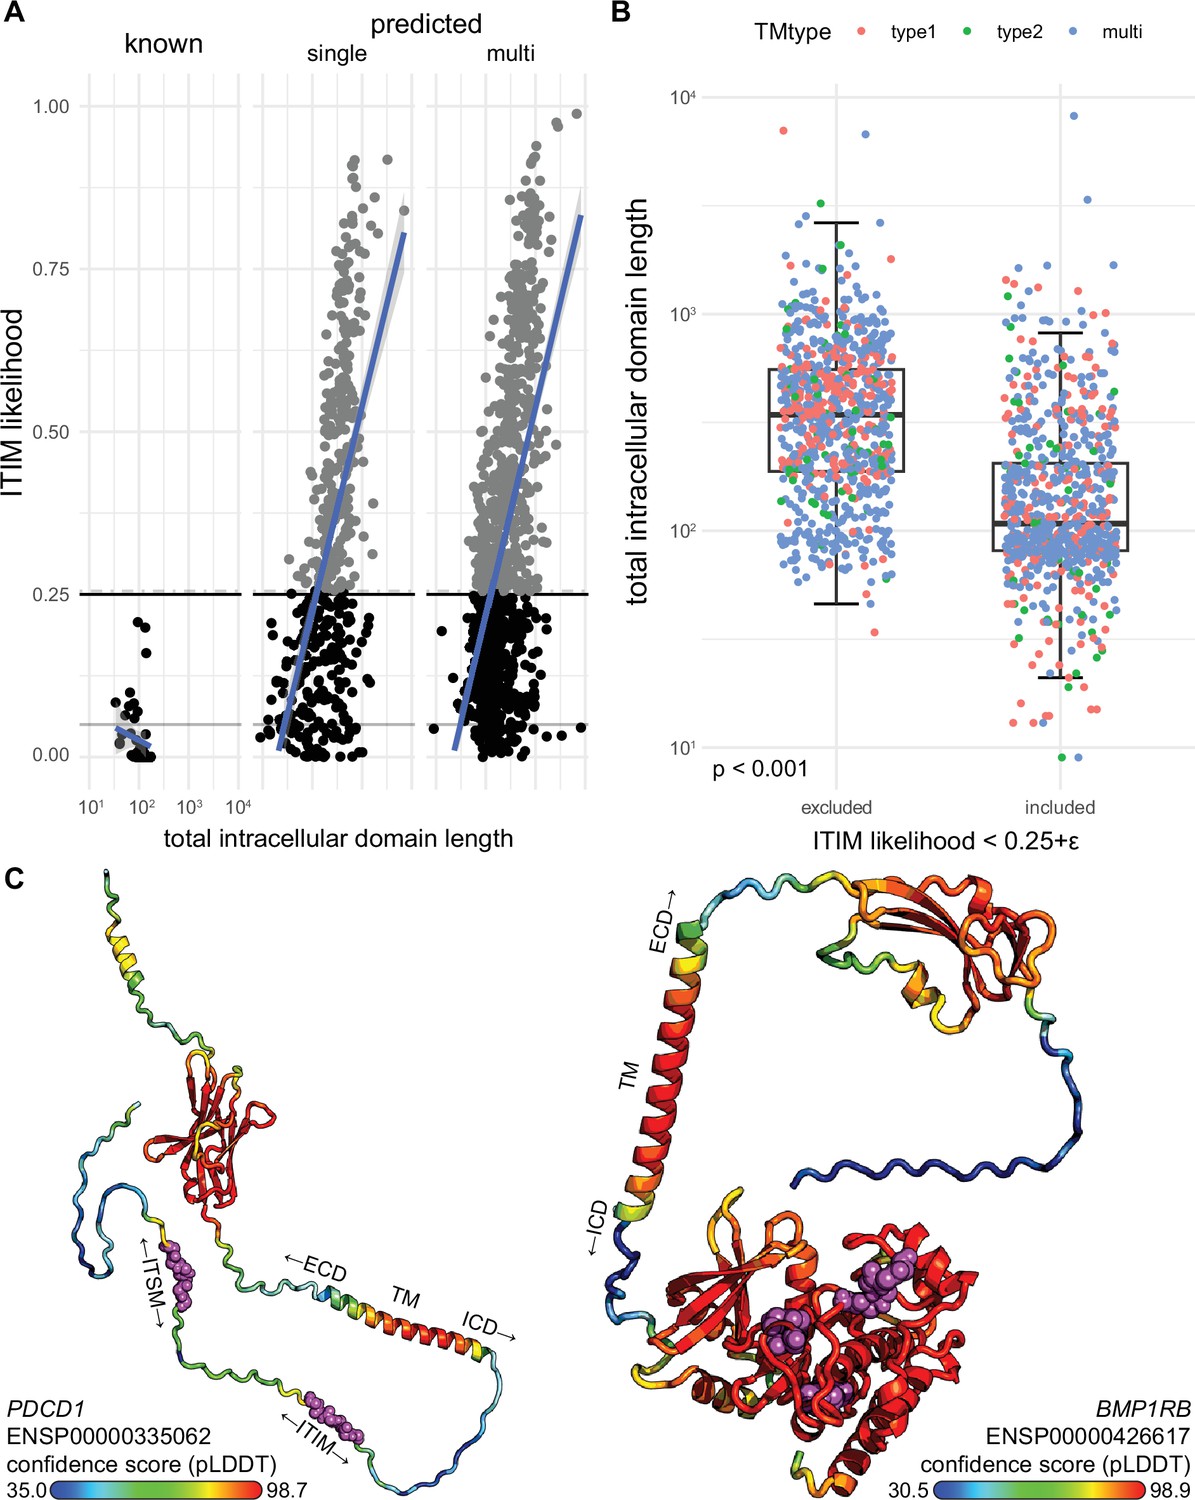
A novel bioinformatics approach for the identification of predicted inhibitory receptors.
(A) The overall likelihood of finding an immunoreceptor tyrosine-based inhibitory motif (ITIM) in the intracellular domain based on the permutation method was plotted as function of total intracellular domain length for known and predicted single-spanner and multi-spanner proteins. (B) The average size of the intracellular domain of proteins that were excluded by the likelihood filter was significantly higher than of those that were included. Boxplot indicates median, 25th percentile, 75th percentile and 1.5 times inter-quartile range. N(included) = 764 unique genes, N(excluded) = 798 unique genes. Significance was determined by Wilcoxon signed-rank test. (C) Examples of three-dimensional structure predictions by AlphaFold. Colouring indicates high (red) and low (blue) confidence residues in the protein, ITIMs for PDCD1 (left) and BMP1RB (right) are depicted as purple spheres.
Figure 2 with 1 supplement
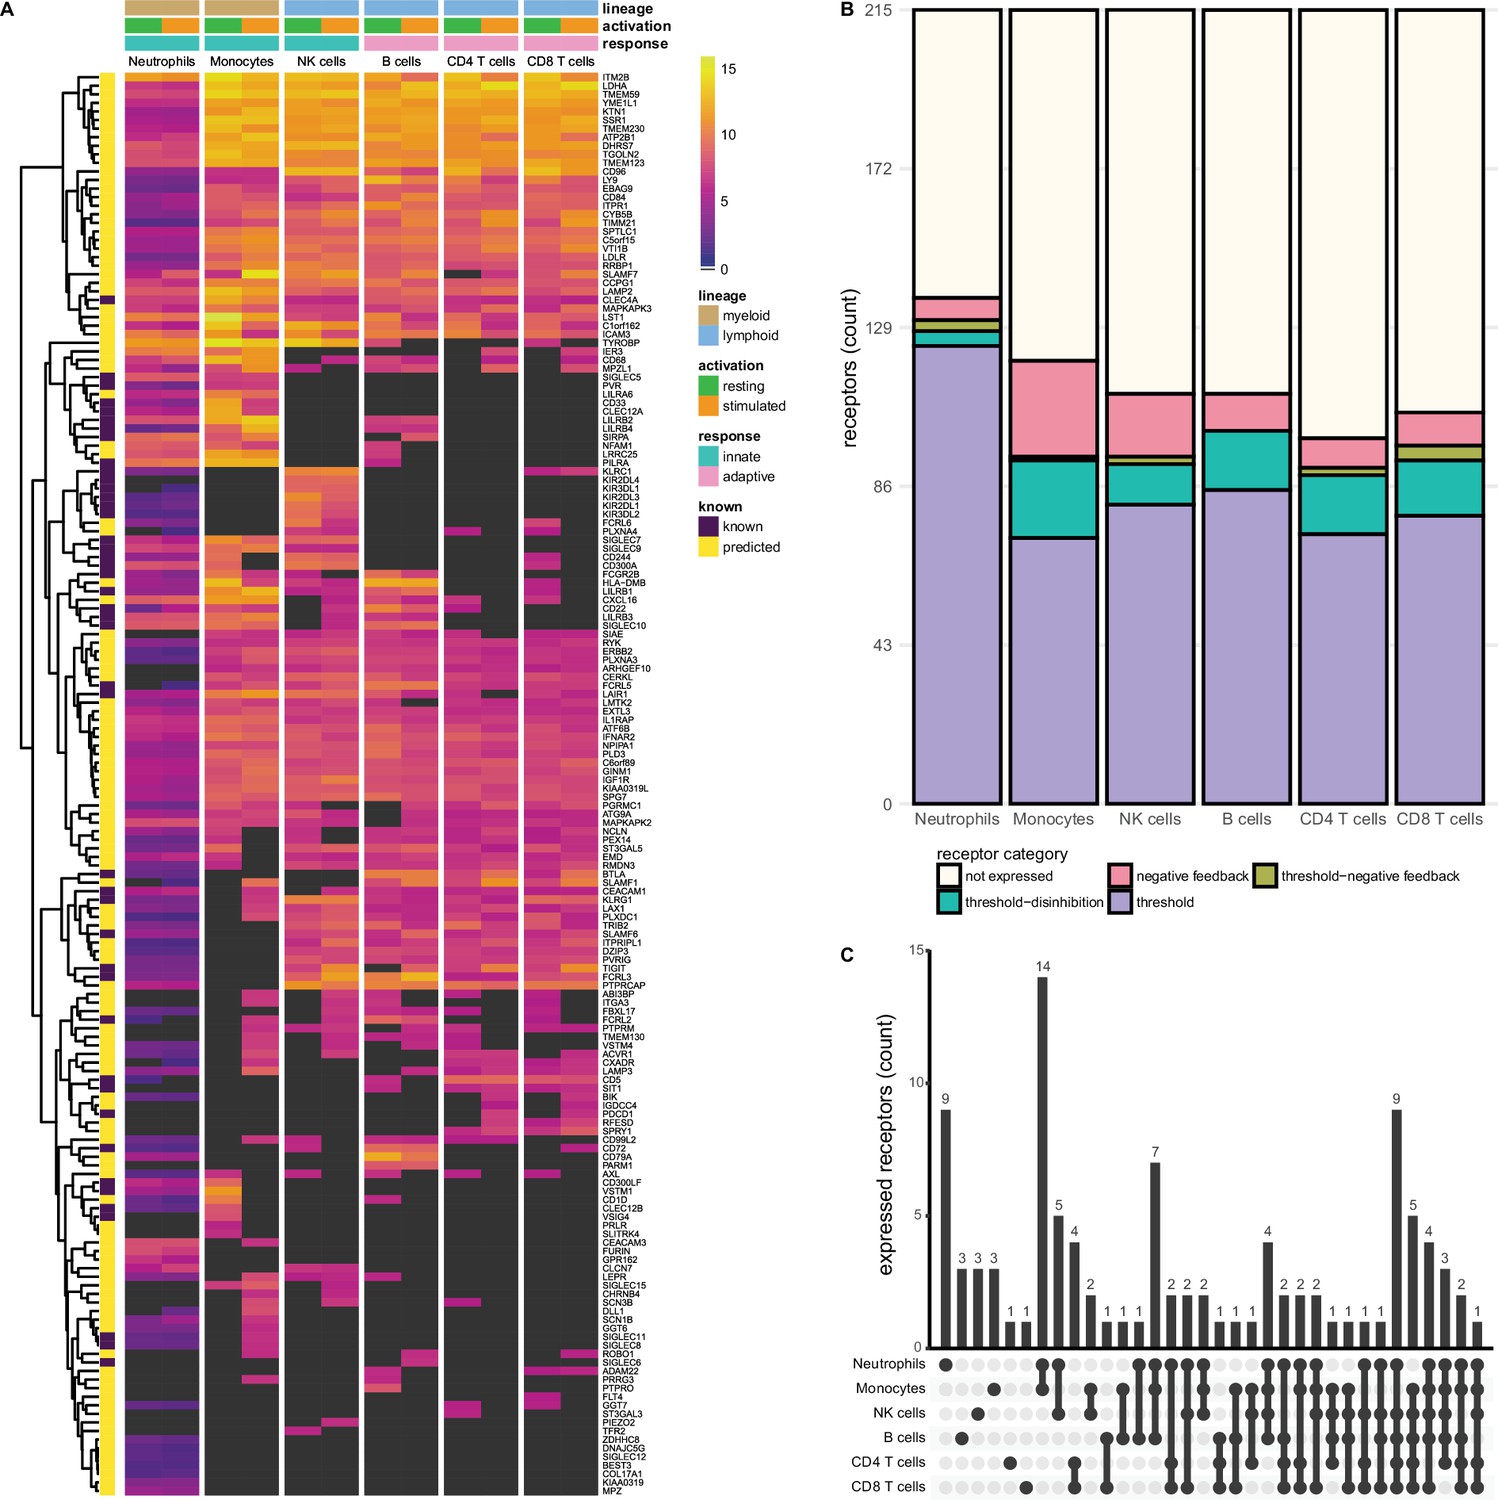
Known and predicted single-spanning inhibitory receptors are expressed in different cell types in the resting state and after activation.
(A) Heatmap with normalised expression data for known and predicted single-spanning inhibitory receptor genes in different cell types, in the resting state or after activation. Receptors were considered not expressed (black) when expression was below median overall gene expression in the sample. Data for neutrophils was retrieved from a different source than the other cell types. (B) Novel and known receptors were classified into different functional categories based on changes, or lack thereof, in expression after stimulation. Threshold receptors were expressed at resting state, and did not change after activation (i.e. change in expression <0.5 log2 fold change). Threshold-negative feedback and threshold-disinhibition receptors were defined by >0.5 log2 fold change up- or downregulation, respectively, in expression after activation. Negative feedback receptors were absent in the resting state, but were expressed after activation. (C) Upset plot showing the number of single-spanning receptors that are expressed uniquely by individual immune cell subsets, or shared between subsets as indicated by connected circles. Sixty-four genes are expressed in all cell types (not depicted).
Figure 2—figure supplement 1
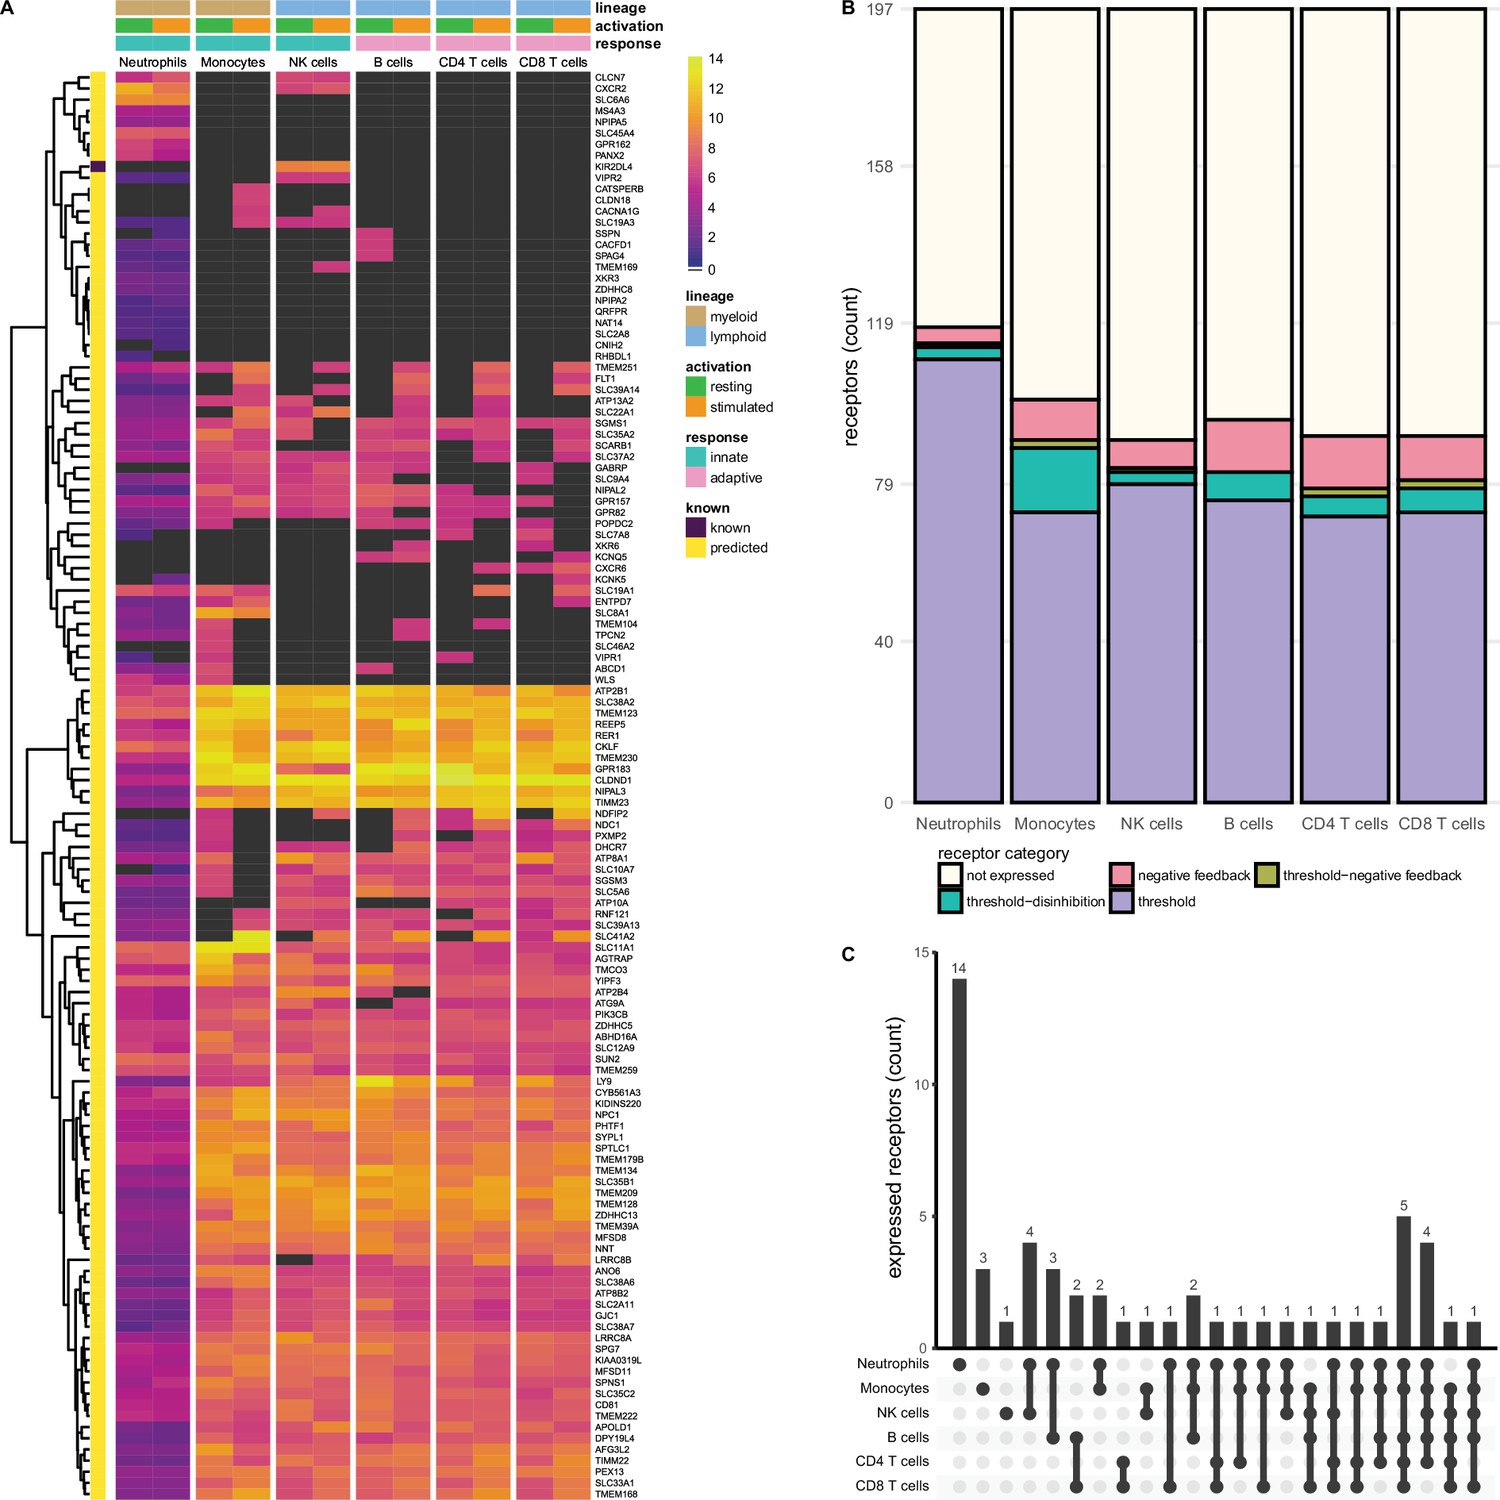
Known and predicted multi-spanning inhibitory receptors are expressed in different cell types in the resting state and after activation.
(A) Heatmap with normalised expression data for known and predicted multi-spanning inhibitory receptor genes in different cell types, in the resting state or after activation. Receptors were considered not expressed (black) when expression was below median overall gene expression in the sample. Data for neutrophils was retrieved from a different source than the other cell types. (B) Known and predicted multi-spanning receptors were classified into different functional categories based on changes, or lack thereof, in expression after stimulation. Threshold receptors were expressed at resting state, and did not change after activation (i.e. change in expression <0.5 log2 fold change). Threshold-negative feedback and threshold-disinhibition receptors were defined by >0.5 log2 fold change up- or downregulation, respectively, in expression after activation. Negative feedback receptors were absent in the resting state, but expressed after activation. (C) Upset plot showing the number of multi-spanning receptors that are expressed uniquely by individual immune cell subsets, or shared between subsets as indicated by connected circles. Seventy-five genes are expressed in all cell types (not depicted). All receptors shown are shared with at least one other immune cell subset or are uniquely expressed by a cell subset. Cell subsets without uniquely expressed putative inhibitory receptors, i.e., B cells and T cells, were excluded from the panel for clarity.
Figure 3 with 3 supplements
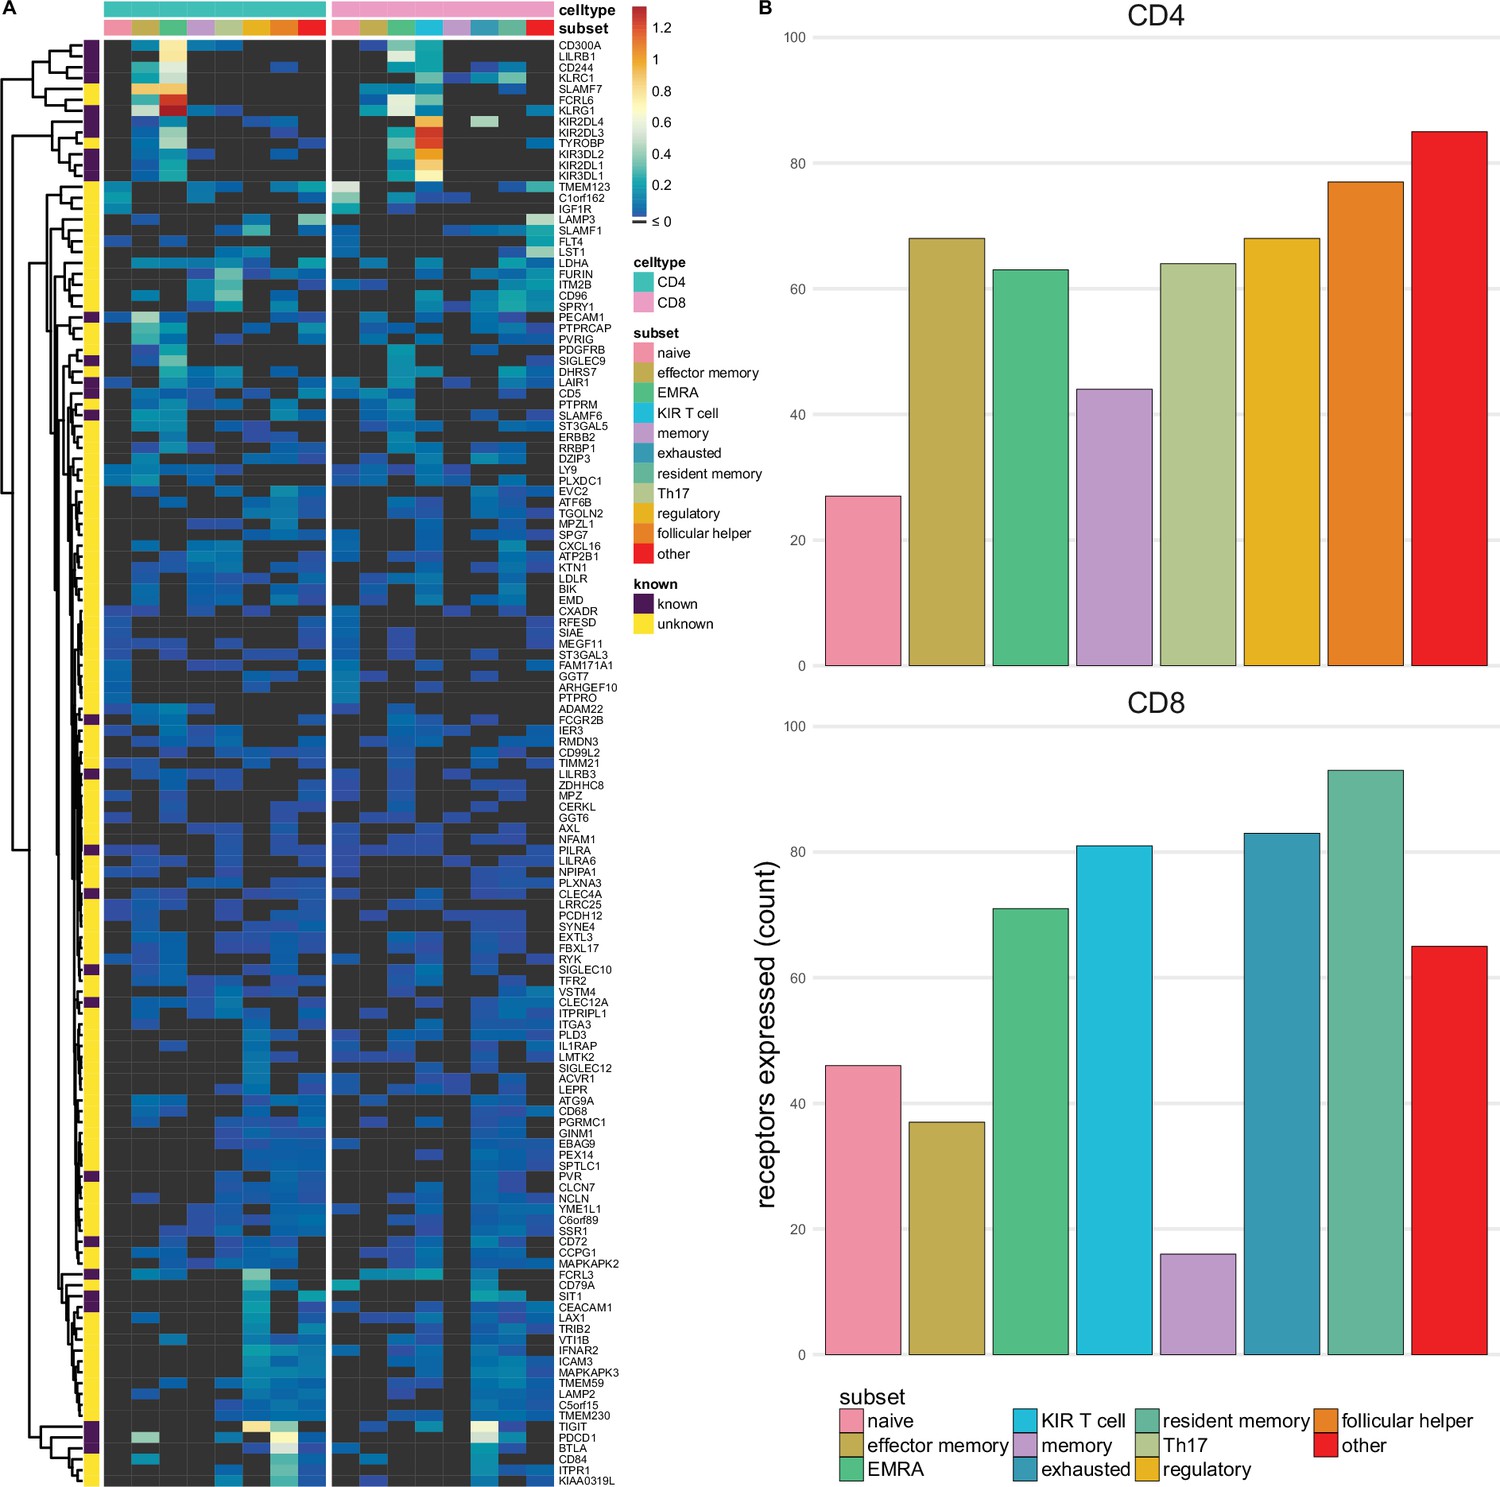
Single-spanning predicted inhibitory receptors are expressed across a wide variety of tumour infiltrating T cell subsets.
(A) Heatmap with row-normalised expression data for known and predicted single-spanning inhibitory receptor genes in different tumour infiltrating T cell subsets. Receptors were considered not expressed in a T cell subset (black) when expression was below median across all subsets. (B) Number of inhibitory receptor genes expressed by different CD4+ T cell subsets (upper graph) and CD8+ T cell subsets (lower graph).
Figure 3—figure supplement 1
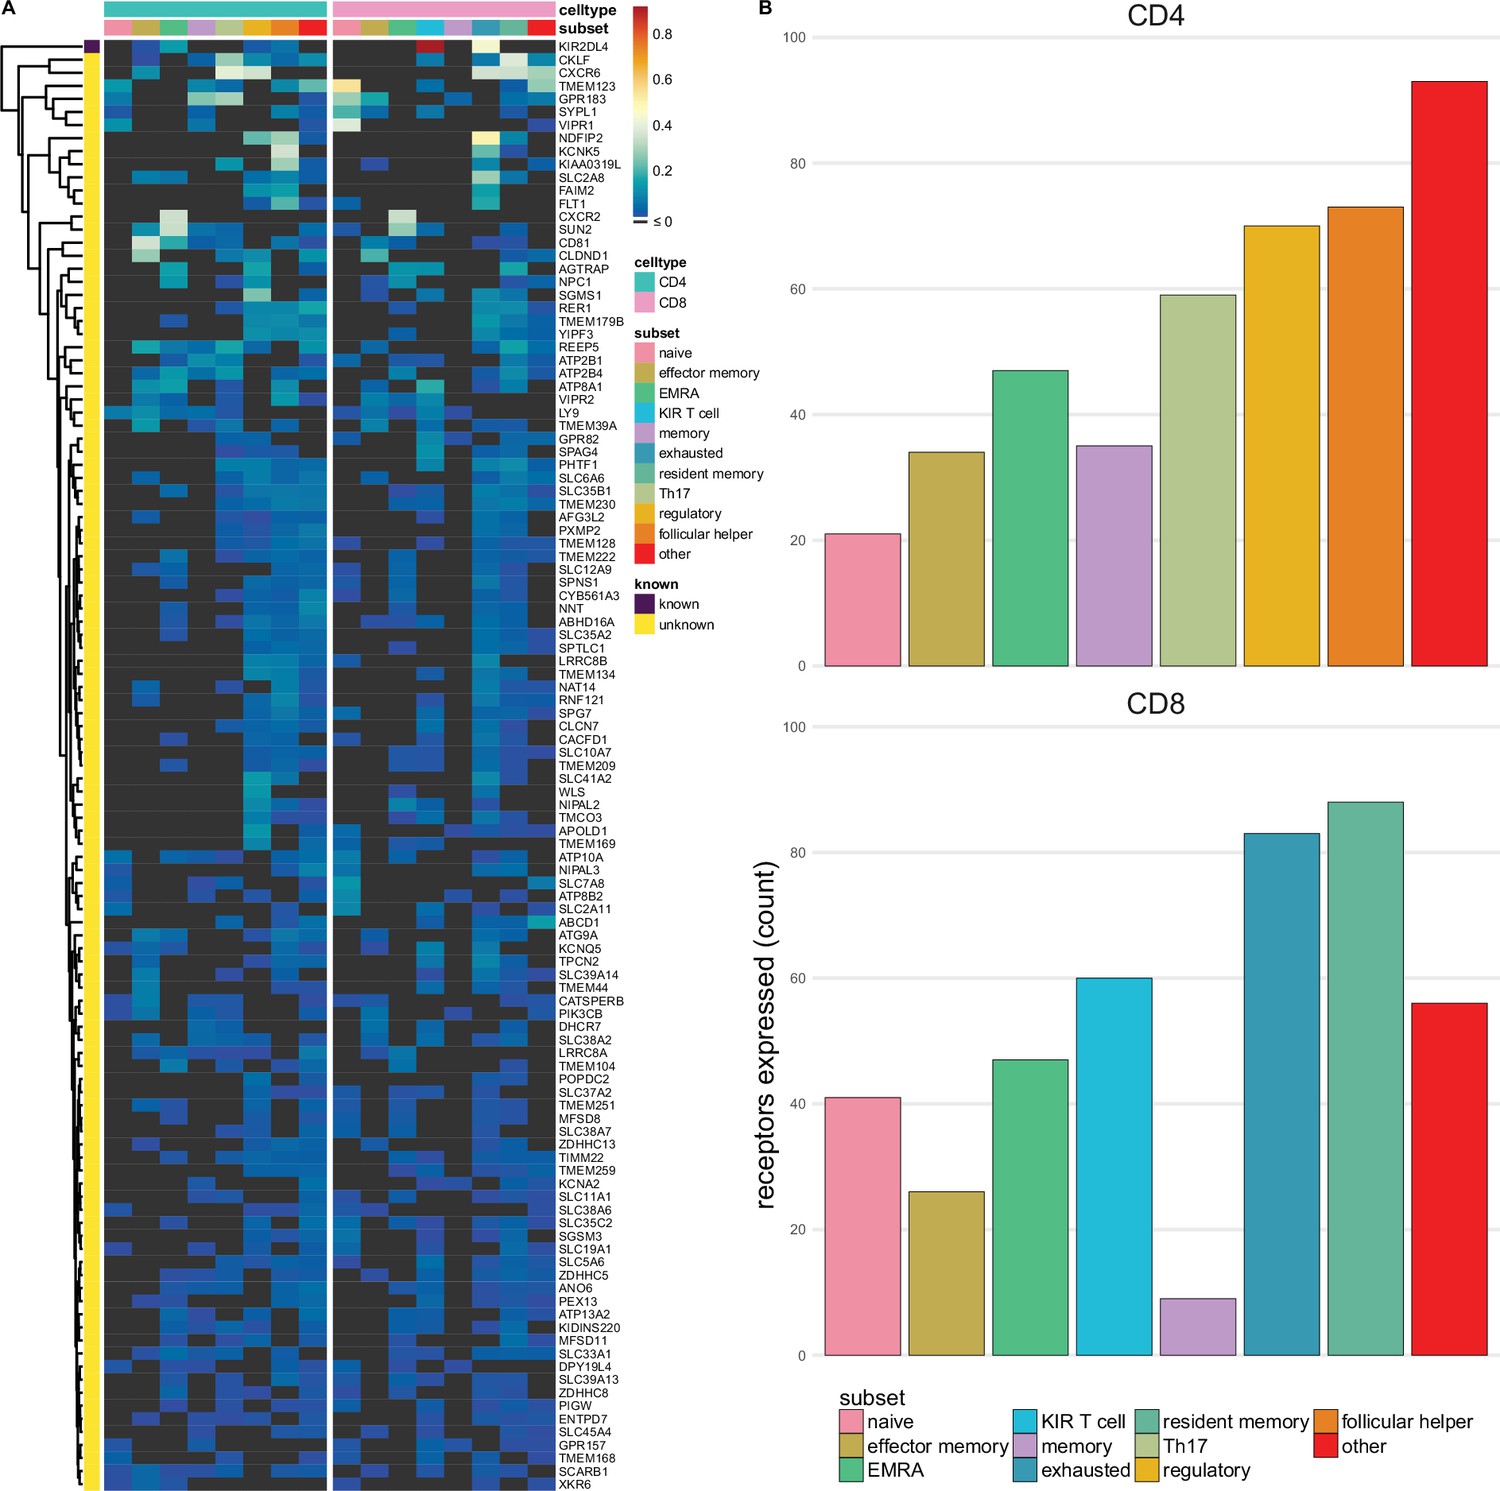
Multi-spanning predicted inhibitory receptors are expressed across a wide variety of tumour infiltrating T cell subsets.
(A) Heatmap with row-normalised expression data for known and predicted multi-spanning inhibitory receptor genes in different tumour infiltrating T cell subsets. Receptors were considered not expressed in a T cell subset (black) when expression was below median across all subsets. (B) Number of inhibitory receptor genes expressed by different CD4+ T cell subsets (upper graph) and CD8+ T cell subsets (lower graph).
Figure 3—figure supplement 2
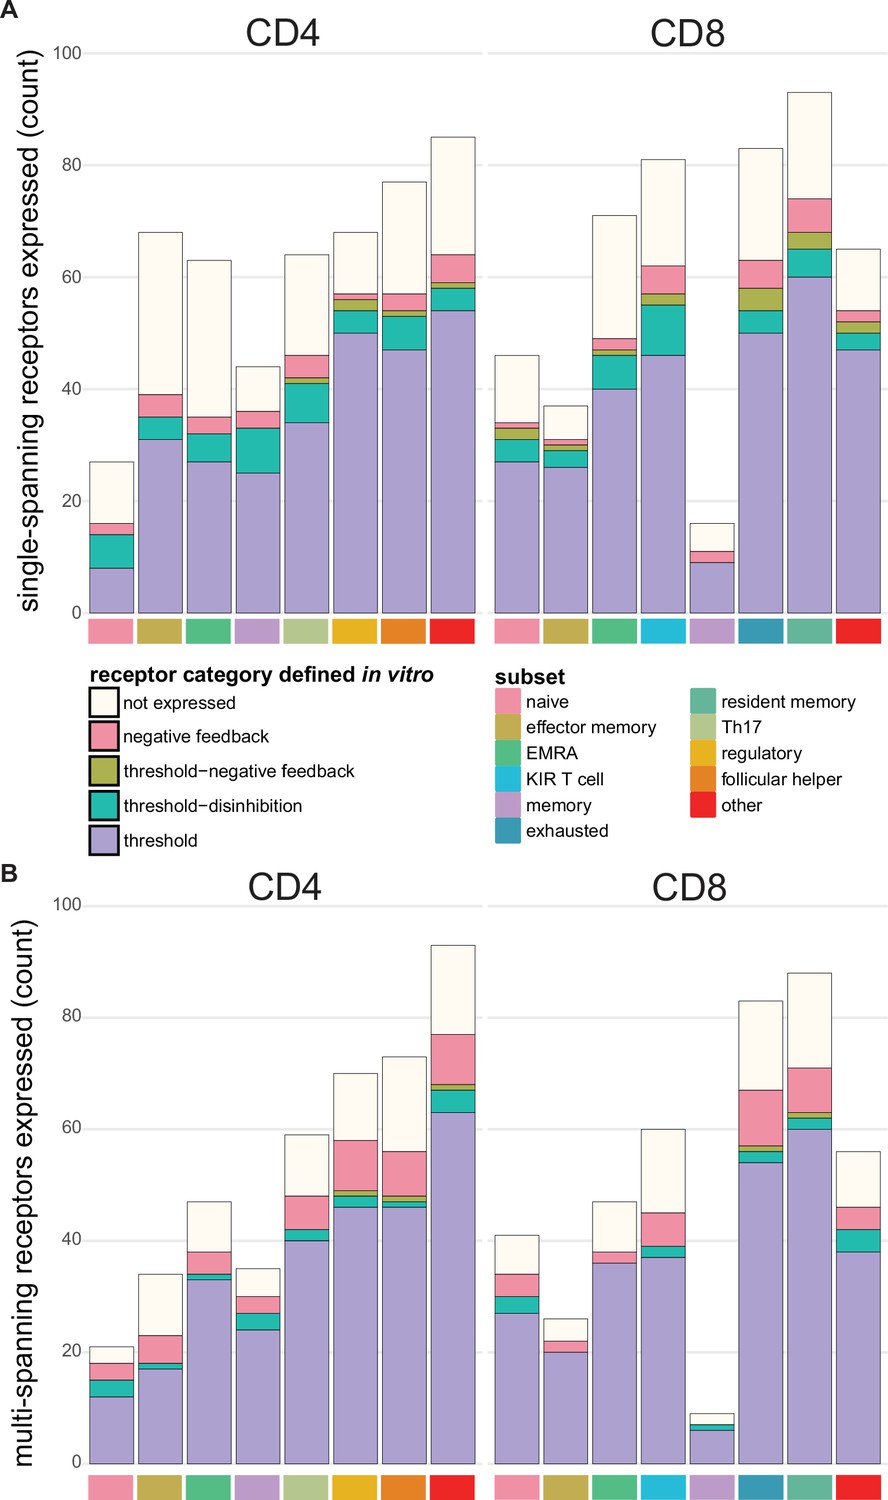
Expression of functional categories of inhibitory receptors across tumour infiltrating T cell subsets.
(A) Functional categories of known and novel single-spanning inhibitory receptors across tumour infiltrating T cell subsets. (B) Functional categories of known and novel multi-spanning inhibitory receptors across tumour infiltrating T cell subsets. For A and B, the functional categorisation was based on the in vitro RNA sequencing datasets, and was applied to the tumour infiltrating T cell subset expression.
Figure 3—figure supplement 3

Known inhibitory receptors are expressed in tumour infiltrating T cell subsets of melanoma patients.
Heatmap with row-normalised expression data for known inhibitory receptor genes in different tumour infiltrating T cell subsets of melanoma patients. Receptors were considered not expressed in a T cell subset (black) when expression was below median across all subsets.
Tables
Table 1
Genes encoding previously described immunoreceptor tyrosine-based inhibitory motif (ITIM)-bearing inhibitory receptors.
| BTLA | CLEC4A | KIR3DL2 | NCR2 | SIGLEC11 |
| CD22 | FCGR2B | KIR3DL3 | PDCD1 | SIRPA |
| CD244 | FCRL2 | KLRC1 | PECAM1 | SIT1 |
| CD300A | FCRL3 | KLRG1 | PILRA | SLAMF6 |
| CD300LF | FCRL4 | LAIR1 | PVR | TIGIT |
| CD33 | FCRL5 | LILRB1 | SIGLEC5 | TREML1 |
| CD5 | KIR2DL1 | LILRB2 | SIGLEC6 | VSIG4 |
| CD72 | KIR2DL2 | LILRB3 | SIGLEC7 | VSTM1 |
| CEACAM1 | KIR2DL3 | LILRB4 | SIGLEC8 | |
| CLEC12A | KIR2DL4 | LILRB5 | SIGLEC9 | |
| CLEC12B | KIR3DL1 | MPIG6B | SIGLEC10 |
Table 2
Number of samples for different resting and activated immune cell subsets.
| Cell type | Subsets | Resting | Activated | Stimulation | Duration |
|---|---|---|---|---|---|
| Neutrophils | 3 | 10 | TSLP/Staphylococcus aureus | 4 hr/24 hr | |
| Monocytes | 4 | 8 | LPS | 24 hr | |
| NK cells | 6 | 6 | IL-2 | 24 hr | |
| B cells | Naïve, memory, plasmablast | 13 | 10 | Anti-IgG/M+IL-4 | 24 hr |
| CD4 T cells | Naïve, effector, memory, regulatory, Tfh | 37 | 40 | Dynabeads +IL-2 | 24 hr |
| CD8 T cells | Naïve, effector, memory | 15 | 16 | Dynabeads +IL-2 | 24 hr |
Table 3
Number of single-spanning receptors in different functional categories for each immune cell subset.
| Cell type | Not expressed | Negative feedback | Threshold-negative feedback | Threshold-disinhibition | Threshold |
|---|---|---|---|---|---|
| Neutrophils | 78 | 6 | 3 | 4 | 124 |
| Monocytes | 95 | 26 | 1 | 21 | 72 |
| NK cells | 104 | 17 | 2 | 11 | 81 |
| B cells | 104 | 10 | 0 | 16 | 85 |
| CD4 T cells | 116 | 8 | 2 | 16 | 73 |
| CD8 T cells | 109 | 9 | 4 | 15 | 78 |
Additional files
-
Supplementary file 1
Overview of predicted immune inhibitory receptor genes bearing an intracellular immunoreceptor tyrosine-based inhibitory motif (ITIM).
Supplementary tables containing all genes and corresponding peptides containing an ITIM in the intracellular domain as determined through the steps described in Figure 1, further subdivided into genes that additionally pass the likelihood and AlphaFold filters (Table 1a), those that pass the likelihood, but not AlphaFold filter (Table 1b) and those that did not pass the likelihood, nor the AlphaFold filter (Table 1c).
- https://cdn.elifesciences.org/articles/92870/elife-92870-supp1-v1.xlsx
-
Supplementary file 2
Number of multi-spanning receptors in different functional categories for each immune cell subset.
Supplementary table corresponding to Figure 2—figure supplement 1 contains the numbers of multi-spanning receptors that have been categorised as ‘not expressed’, ‘negative feedback’, ‘threshold-negative feedback’, ‘threshold-disinhibition’, and ‘threshold’ in different immune cell subsets, i.e., neutrophils, monocytes, NK cells, B cells, and CD4+ and CD8+ T cells.
- https://cdn.elifesciences.org/articles/92870/elife-92870-supp2-v1.xlsx
-
MDAR checklist
- https://cdn.elifesciences.org/articles/92870/elife-92870-mdarchecklist1-v1.pdf
Download links
A two-part list of links to download the article, or parts of the article, in various formats.
Downloads (link to download the article as PDF)
Open citations (links to open the citations from this article in various online reference manager services)
Cite this article (links to download the citations from this article in formats compatible with various reference manager tools)
A novel bioinformatics pipeline for the identification of immune inhibitory receptors as potential therapeutic targets
eLife 13:RP92870.
https://doi.org/10.7554/eLife.92870.3


