Chemotherapy activates inflammasomes to cause inflammation-associated bone loss
- Division of Bone and Mineral Diseases, Washington University School of Medicine, United States
- Aclaris Therapeutics, Inc, United States
- Department of Orthopaedic Surgery, Washington University School of Medicine, United States
- Shriners Hospitals for Children, United States
Figures
Figure 1 with 1 supplement
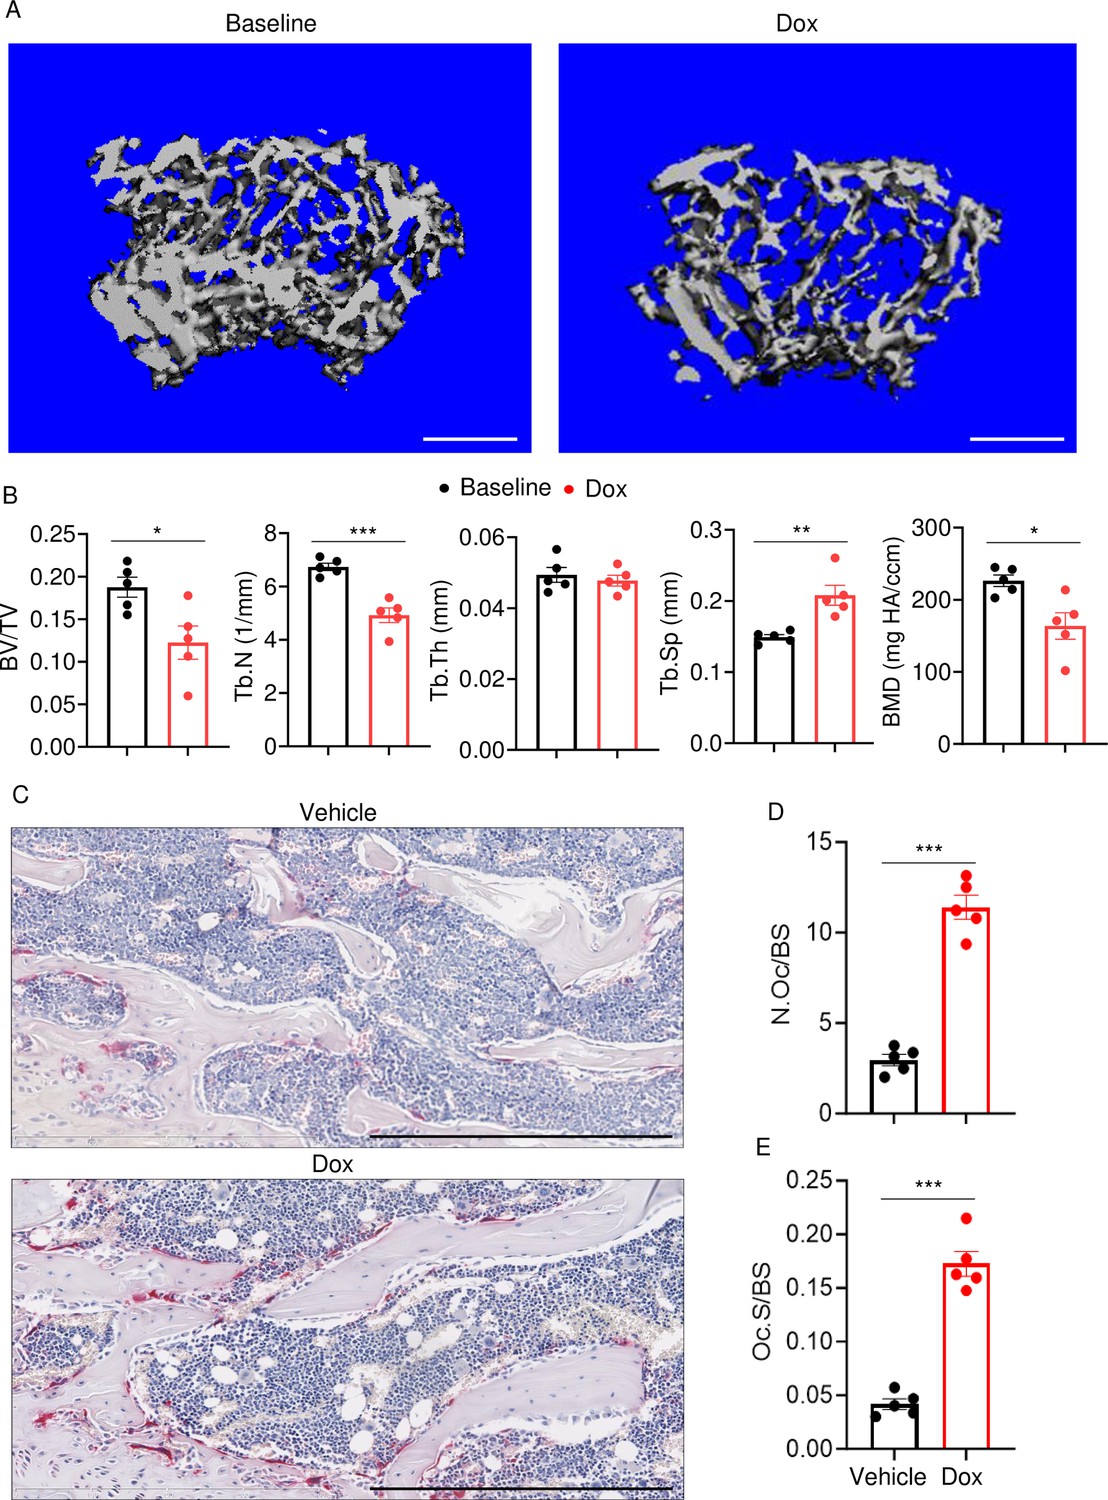
Doxorubicin causes bone loss in male mice.
Femurs from WT male mice were analyzed by VivaCT before (baseline) and 4 weeks after a single intraperitoneal injection of 5 mg/kg doxorubicin. Cross sections of 3D reconstructions. Scale bars: 500 μm (A), bone parameters (B), and femurs from WT male mice (C–E) were analyzed 4 weeks after a single intraperitoneal injection of vehicle or doxorubicin. Specimens were stained for tartrate-resistant acidic phosphatase (TRAP) activity. Representative images. Scale bars: 500 μm (C), N.Oc/BS (D), Oc.S/BS (E). N=5 mice/group. Data are mean ± SEM. Student’s t-test was used. *p<0.05; **p<0.01; ***p<0.001. BMD, bone mineral density; BV/TV, bone volume/total volume; Dox, doxorubicin; N.Oc/BS, OC number/bone surface; Oc.S/BS, OC surface/bone surface; OC, osteoclast; ns, not significant; Tb.N, trabecular number; Tb.Th, trabecular thickness; Tb.Sp, trabecular separation; WT, wild-type.
-
Figure 1—source data 1
Micro-computed tomography (µCT) analysis in Figure 1B.
- https://cdn.elifesciences.org/articles/92885/elife-92885-fig1-data1-v1.xlsx
-
Figure 1—source data 2
Tartrate-resistant acidic phosphatase (TRAP) staining analysis in Figure 1D and E.
- https://cdn.elifesciences.org/articles/92885/elife-92885-fig1-data2-v1.xlsx
Figure 1—figure supplement 1
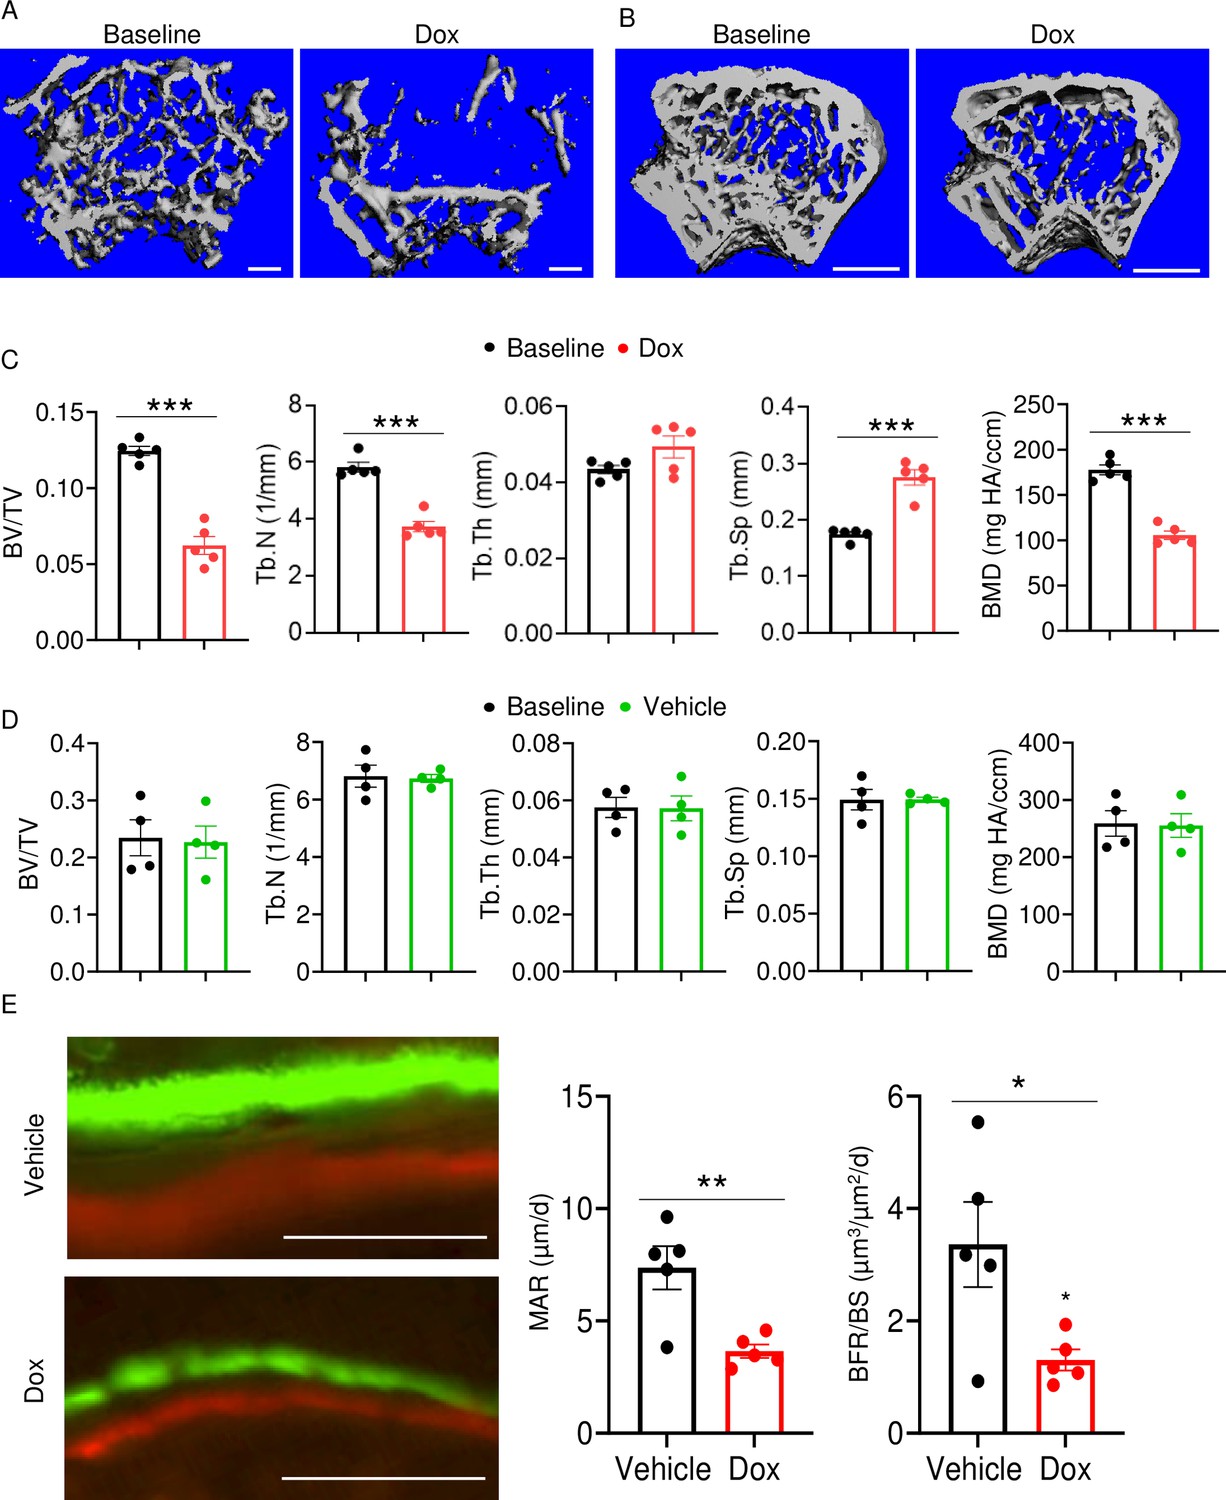
Doxorubicin causes bone loss in female mice.
Femurs from 10-week-old WT female (A, C) and male (B, D) mice were analyzed by VivaCT before (baseline) and 4 weeks after a single i.p. injection of 5 mg/kg doxorubicin (A–C) or vehicle (D). For dynamic histomorphometry, male mice were i.p. injected with calcein green and 6 days later with alizarin red and were euthanized 2 days after the second injection. The tibias were used for the analysis. Cross sections of 3D reconstructions of trabecular (A; scale bars: 200 μm) and trabecular and cortical (B; scale bars: 500 μm) bones. Bone parameters (C, D). Dynamic bone parameters (E; scale bars: 50 μm). Data are mean ± SEM. N=4–5 mice/group. *p<0.05; **p<0.01; ***p<0.001. BFR/BS, bone formation rate/bone surface; BMD bone mineral density; BV/TV, bone volume/total volume; MAR, mineral apposition rate; N.Oc/BS, OC number/bone surface; ns, not significant; OC, osteoclast; Tb.N, trabecular number; Tb.Sp, trabecular separation; Tb.Th, trabecular thickness.
-
Figure 1—figure supplement 1—source data 1
Micro-computed tomography (µCT) analysis in Figure 1—figure supplement 1C–D.
- https://cdn.elifesciences.org/articles/92885/elife-92885-fig1-figsupp1-data1-v1.xlsx
-
Figure 1—figure supplement 1—source data 2
Dynamic bone parameters analysis in Figure 1—figure supplement 1E.
- https://cdn.elifesciences.org/articles/92885/elife-92885-fig1-figsupp1-data2-v1.xlsx
Figure 2
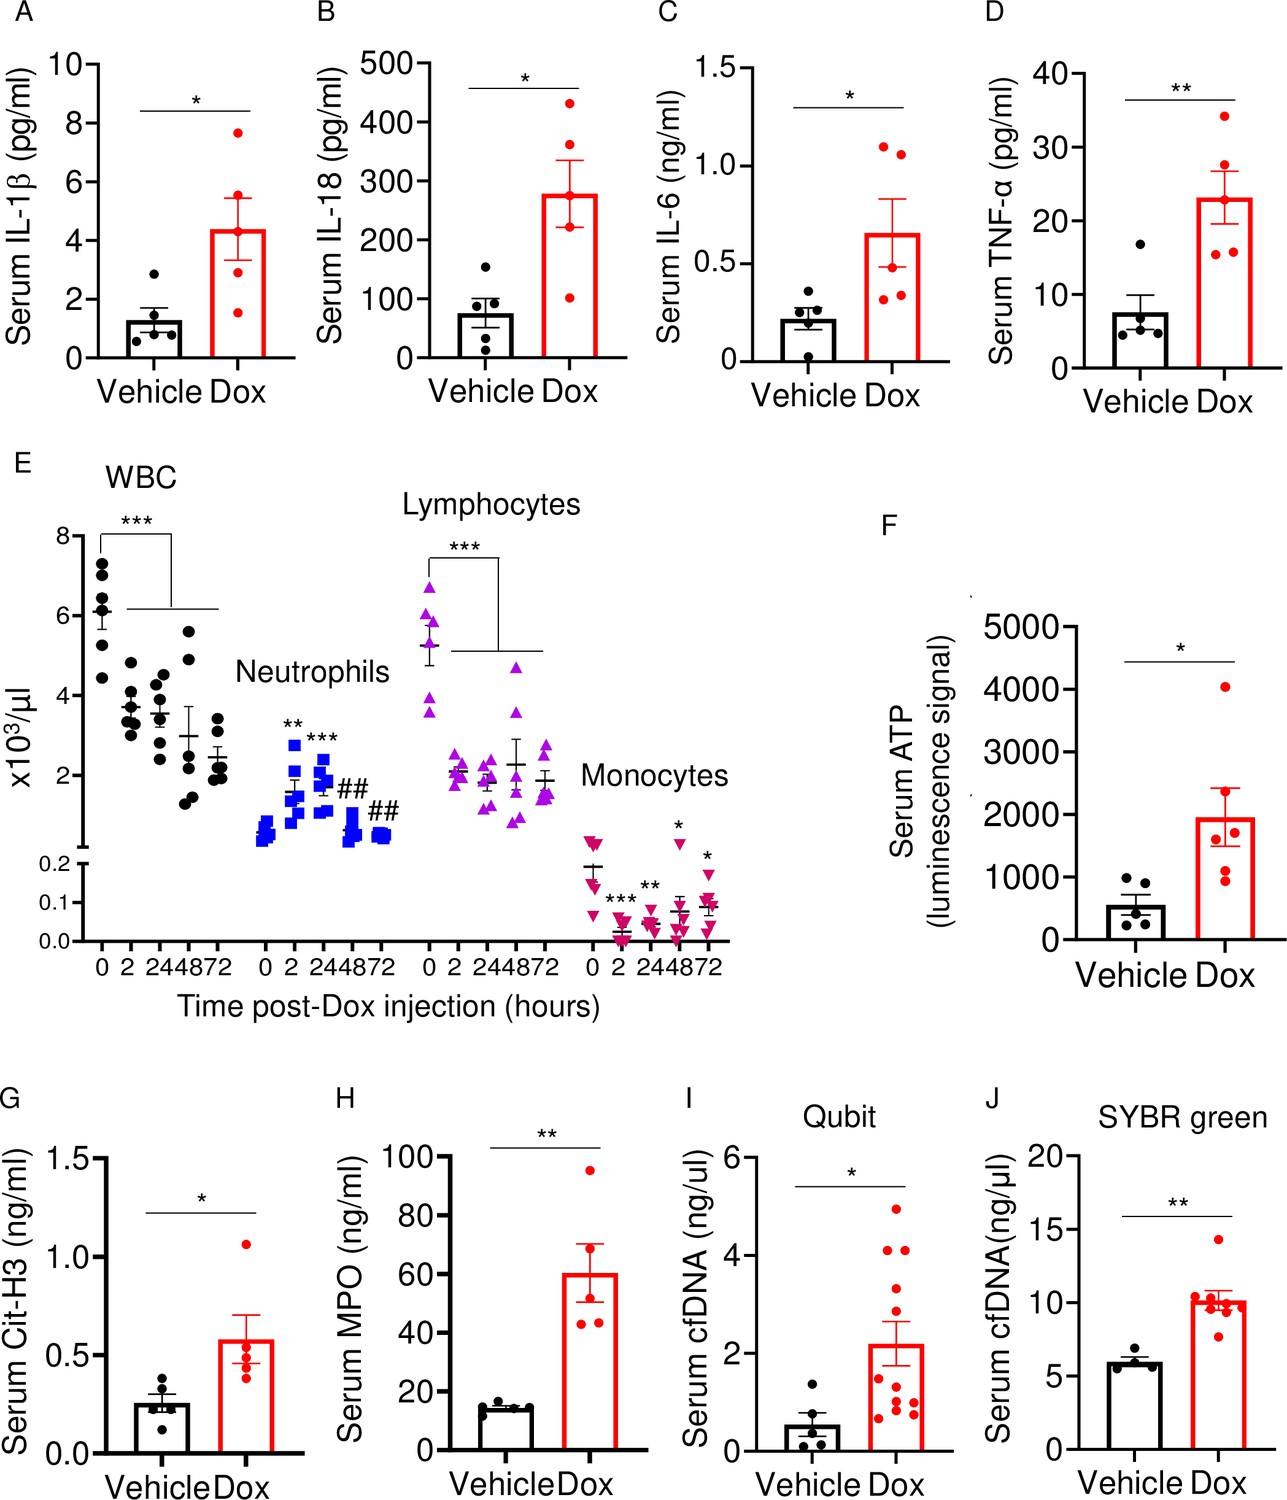
Doxorubicin causes cytokinemia, leukopenia, release of danger-associated molecular patterns (DAMPs), and NETosis in vivo.
Twelve-week-old WT mice were exposed to a single dose of vehicle or 5 mg/kg doxorubicin. Serum samples were harvested 3 days (A–D) or 2 days (F–J) later and analyzed by MSD (IL-1β, IL-6, and TNF-α) or ELISA (Cit-H3, IL-18, and MPO). Blood was collected for cell counts at the indicated time-points after a single dose of 5 mg/kg doxorubicin injection (E). cfDNA was measured using Qubit (I) or SYBR green (J). Data are mean ± SEM. N=5–12 mice/group. *p<0.05; **p<0.01; ***p<0.001 vs 0 hr; ##p<0.01 vs 2 or 24 hr. Student’s t-test (A–D, F–J) and one-way ANOVA (E) were used. cfDNA, cell-free DNA; Cit-H3, citrullinated histone H3; Dox, doxorubicin; IL, interleukin; MPO, myeloperoxidase; WBCs, white blood cells.
-
Figure 2—source data 1
Serum samples analysis of inflammatory cytokines, ATP, citrullinated histone 3 (Cit-H3), myeloperoxidase (MPO), and cfDNA in Figure 2A–D and F–J.
- https://cdn.elifesciences.org/articles/92885/elife-92885-fig2-data1-v1.xlsx
-
Figure 2—source data 2
Complete blood count in Figure 2E.
- https://cdn.elifesciences.org/articles/92885/elife-92885-fig2-data2-v1.xlsx
Figure 3
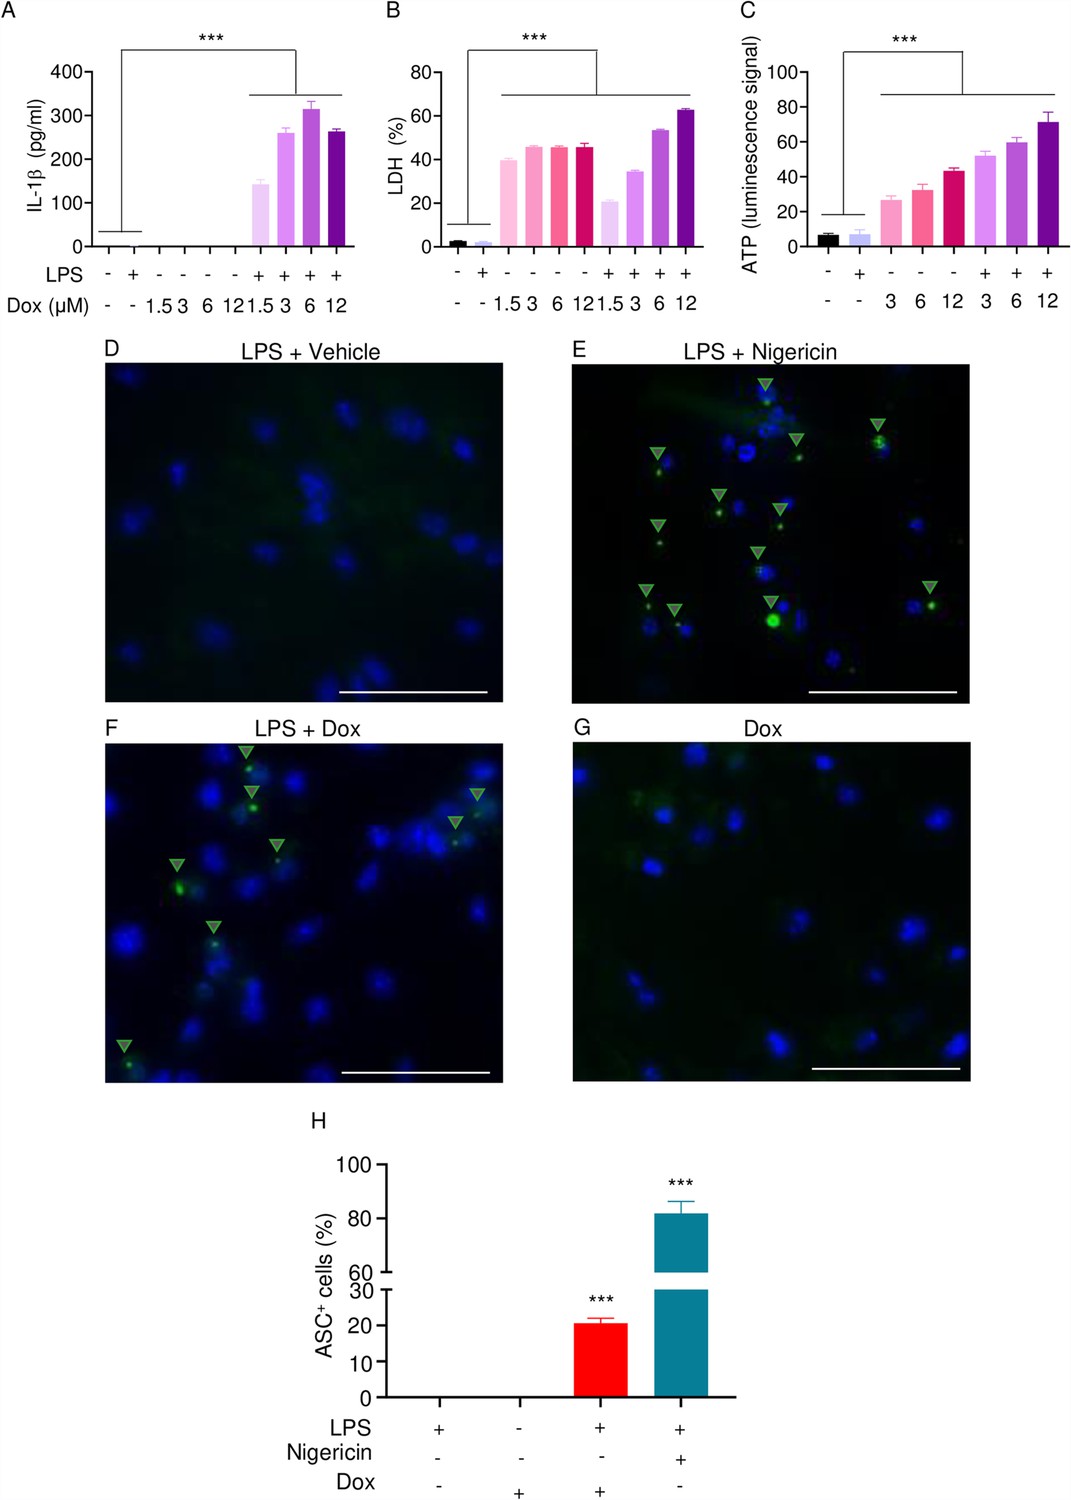
Doxorubicin activates inflammasomes and causes macrophage pyroptosis.
WT bone marrow-derived macrophages (BMMs) were left untreated or primed with LPS for 3 hr, then treated with various doxorubicin concentrations for 16 hr. IL-1β (A), LDH (B), and ATP (C) in the conditioned media were measured by enzyme linked immunosorbent assay (ELISA), the cytotoxicity detection kit, or ATP detection kit, respectively. WT BMMs from ASC-citrine mice were primed with 100 ng/ml LPS for 3 hr and treated or not with 15 µM nigericin for 30 min or 10 µM doxorubicin for 16 hr (D–F). Non-primed cells were also treated with 10 µM doxorubicin for 16 hr (G). Scale bars: 50 µm. ASC specks were visualized under fluorescence microscopy and quantified using ImageJ. Quantitative data (H). Data are mean ± SEM from experimental triplicates and represent at least two independent experiments. ***p<0.001 vs. untreated- or LPS-treated cultures. One-way ANOVA. ASC, apoptosis-associated speck-like protein containing a CARD; ATP, adenosine triphosphate; Dox, doxorubicin; IL-1β, interleukin-1β; LDH, lactate dehydrogenase; LPS, lipopolysaccharide; WT, wild-type.
-
Figure 3—source data 1
IL-1β, lactate dehydrogenase (LDH), and ATP analysis of bone marrow-derived macrophages (BMMs) supernatant in Figure 3A–C.
- https://cdn.elifesciences.org/articles/92885/elife-92885-fig3-data1-v1.xlsx
-
Figure 3—source data 2
ASC+ cells analysis in Figure 3H.
- https://cdn.elifesciences.org/articles/92885/elife-92885-fig3-data2-v1.xlsx
Figure 4 with 2 supplements
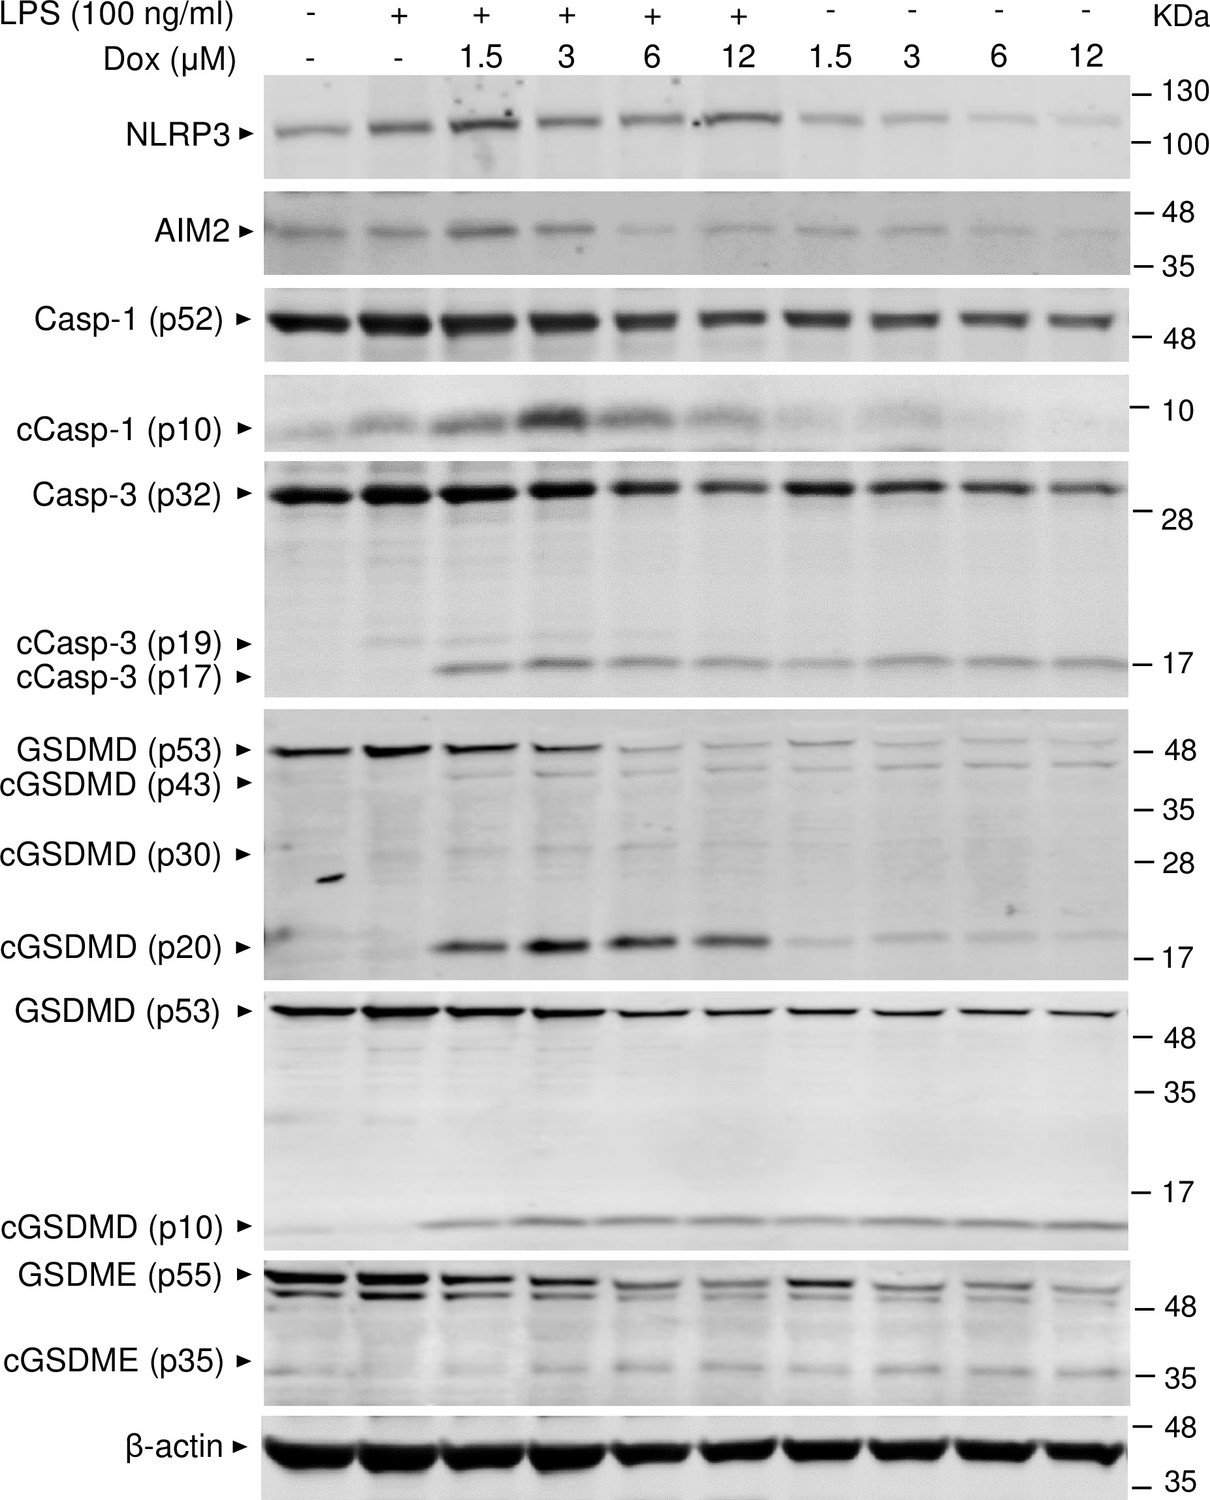
Doxorubicin activates inflammasome-dependent and -independent pathways in macrophages.
WT bone marrow-derived macrophages (BMMs) were left untreated or primed with LPS for 3 hr, then treated with various doxorubicin concentrations for 16 hr. Whole cell lysates were analyzed by immunoblotting. Data are representative of at least three independent experiments. AIM2, absent in melanoma 2; cCasp, cleaved caspase; cGSDM, cleaved gasdermin; LPS, lipopolysaccharide; Dox, doxorubicin; WT, wild-type.
-
Figure 4—source data 1
Original file for the western blot analysis in Figure 4 (NLRP3).
- https://cdn.elifesciences.org/articles/92885/elife-92885-fig4-data1-v1.zip
-
Figure 4—source data 2
Original file for the western blot analysis in Figure 4 (AIM2).
- https://cdn.elifesciences.org/articles/92885/elife-92885-fig4-data2-v1.zip
-
Figure 4—source data 3
Original file for the western blot analysis in Figure 4 (caspase-1).
- https://cdn.elifesciences.org/articles/92885/elife-92885-fig4-data3-v1.zip
-
Figure 4—source data 4
Original file for the western blot analysis in Figure 4 (cleaved caspase-1).
- https://cdn.elifesciences.org/articles/92885/elife-92885-fig4-data4-v1.zip
-
Figure 4—source data 5
Original file for the western blot analysis in Figure 4 (caspase-3/cleaved caspase-3).
- https://cdn.elifesciences.org/articles/92885/elife-92885-fig4-data5-v1.zip
-
Figure 4—source data 6
Original file for the western blot analysis in Figure 4 (gasdermin D [GSDMD]/cleaved GSDMD).
- https://cdn.elifesciences.org/articles/92885/elife-92885-fig4-data6-v1.zip
-
Figure 4—source data 7
Original file for the western blot analysis in Figure 4 (gasdermin D [GSDMD]/cleaved GSDMD [(p10])).
- https://cdn.elifesciences.org/articles/92885/elife-92885-fig4-data7-v1.zip
-
Figure 4—source data 8
Original file for the western blot analysis in Figure 4 (GSDME/cleaved GSDME).
- https://cdn.elifesciences.org/articles/92885/elife-92885-fig4-data8-v1.zip
-
Figure 4—source data 9
Original file for the western blot analysis in Figure 4 (β-actin).
- https://cdn.elifesciences.org/articles/92885/elife-92885-fig4-data9-v1.zip
-
Figure 4—source data 10
Original images of the relevant western blot analysis (NLRP3, AIM2, caspase-1/cleaved caspase-1, caspase-3/cleaved caspase-3, gasdermin D [GSDMD]/cleaved GSDMD, GSDME/cleaved GSDME, and β-actin) with highlighted bands and sample labels in Figure 4.
- https://cdn.elifesciences.org/articles/92885/elife-92885-fig4-data10-v1.zip
Figure 4—figure supplement 1

Cleavage sites of gasdermin D (GSDMD) and GSDME.
Cleavage sites of murine GSDMD by caspase-1 and caspase-3 (A). Cleavage sites of murine GSDME by caspase-3 (B).
Figure 4—figure supplement 2
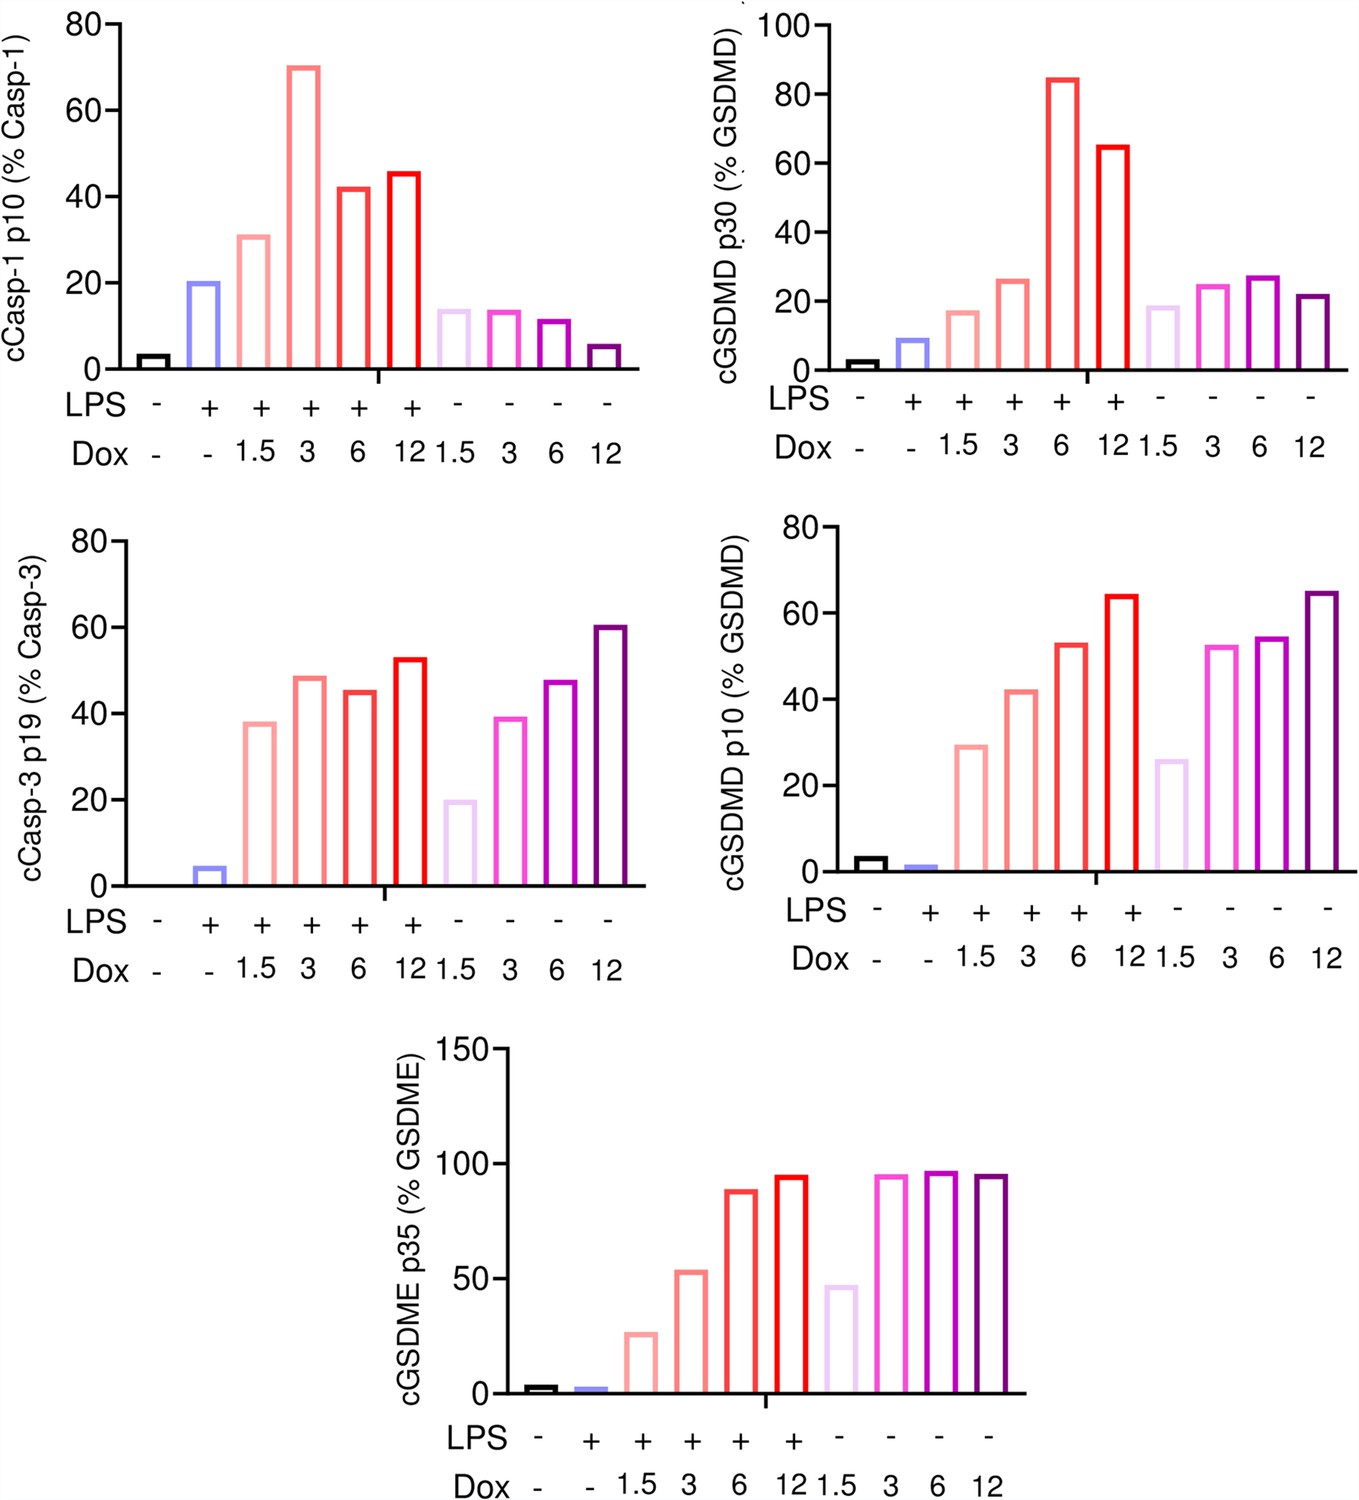
Doxorubicin activates inflammasome-dependent and -independent pathways in macrophages.
WT bone marrow-derived macrophages (BMMs) were left untreated or primed with lipopolysaccharide (LPS) for 3 hr, then treated with various doxorubicin concentrations for 16 hr. Bar graph represents the quantitative data from whole cell lysates analyzed by immunoblotting.
-
Figure 4—figure supplement 2—source data 1
Western blot analysis of bone marrow-derived macrophages (BMMs) in Figure 4—figure supplement 2.
- https://cdn.elifesciences.org/articles/92885/elife-92885-fig4-figsupp2-data1-v1.xlsx
Figure 5 with 1 supplement
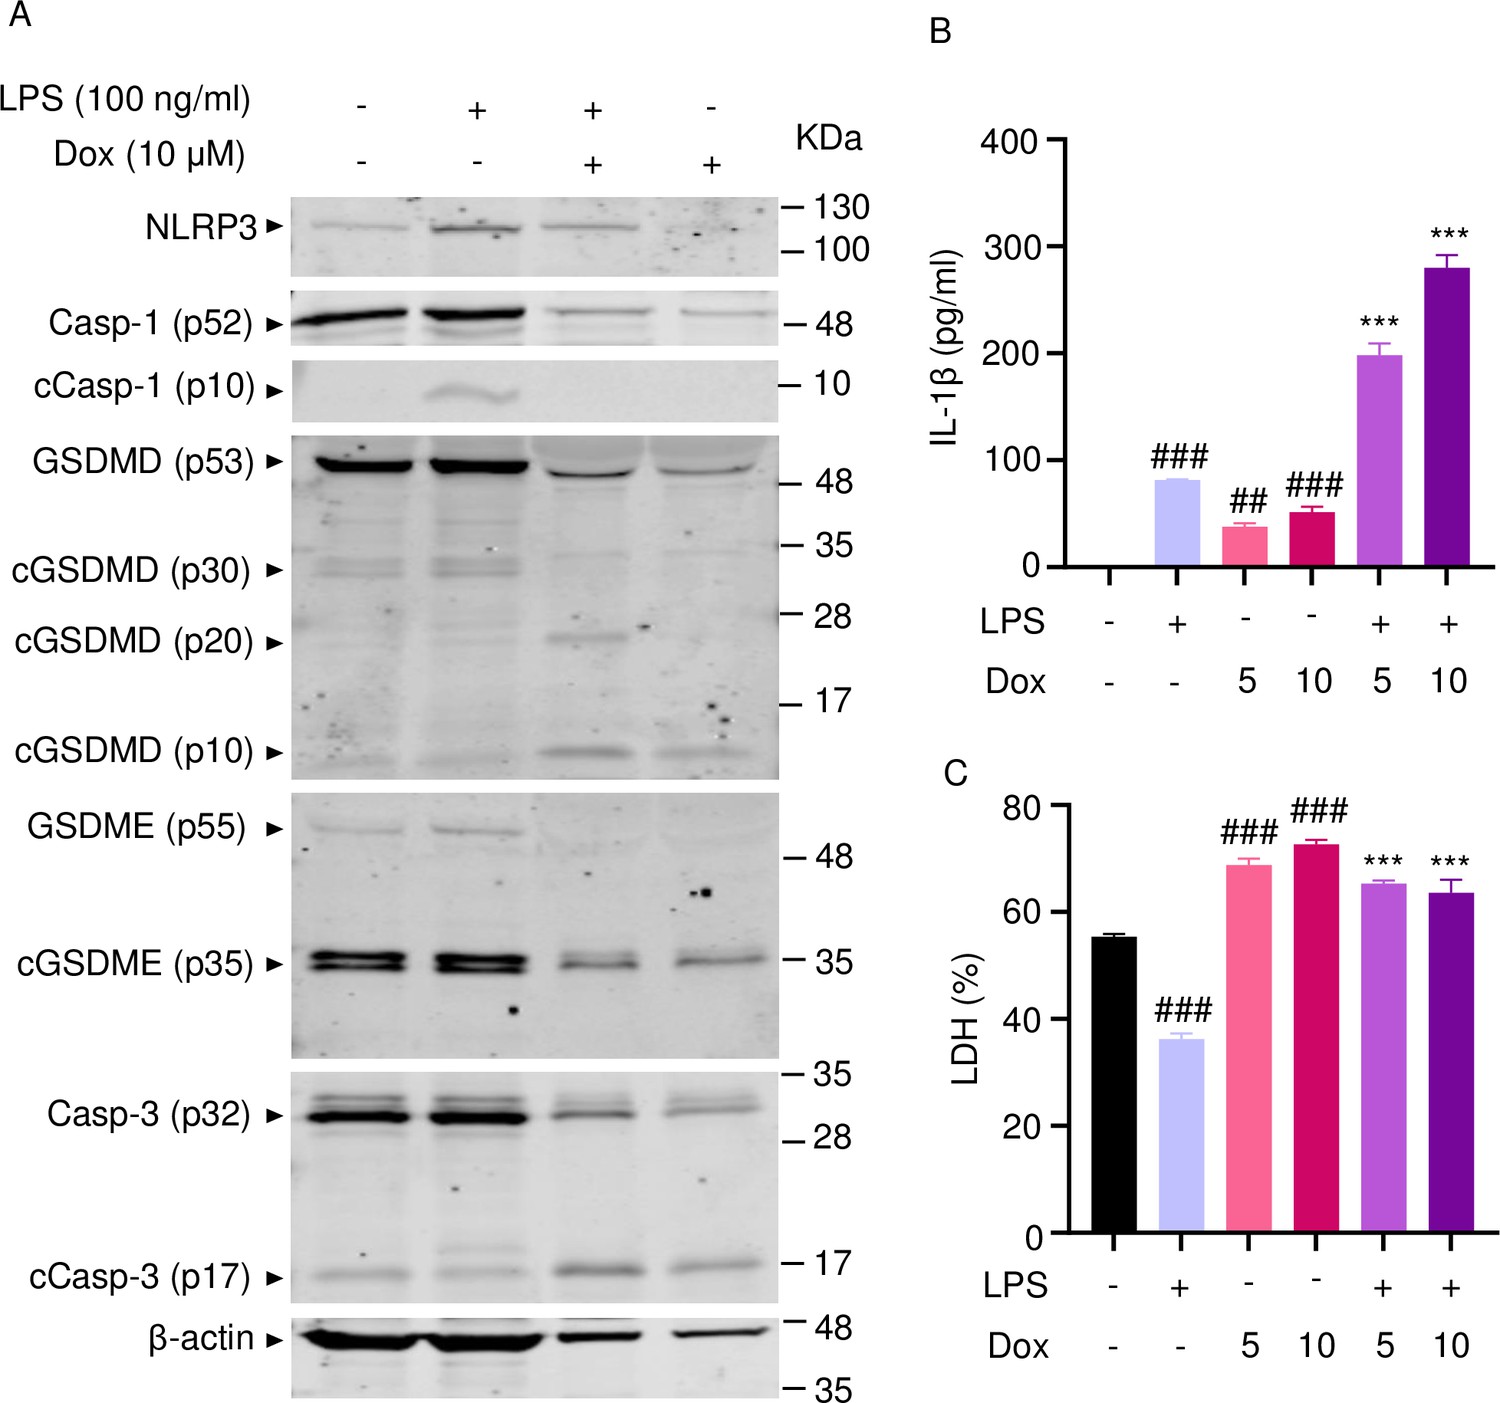
Doxorubicin activates inflammasome-dependent and -independent pathways in neutrophils.
WT mouse bone marrow neutrophils were left untreated or primed with LPS for 3 hr, then treated with various doxorubicin concentrations for 16 hr. Whole cell lysates were analyzed by immunoblotting. Blots are representative of at least three independent experiments (A), IL-1β (B), and LDH (C) in the conditioned media were measured by enzyme linked immunosorbent assay (ELISA) and the cytotoxicity detection kit, respectively. Data are mean ± SEM from experimental triplicates and are representative of at least two independent experiments. ***p<0.001 vs. LPS; ##p<0.01, ###p<0.001 vs. untreated cultures. One-way ANOVA was used. cCasp, cleaved caspase; cGSDM, cleaved gasdermin; IL-1β, interleukin-1β; LDH, lactate dehydrogenase; LPS, lipopolysaccharide; Dox, doxorubicin.
-
Figure 5—source data 1
Original file for the western blot analysis in Figure 5A (NLRP3).
- https://cdn.elifesciences.org/articles/92885/elife-92885-fig5-data1-v1.zip
-
Figure 5—source data 2
Original file for the western blot analysis in Figure 5A (caspase-1/cleaved caspase-1).
- https://cdn.elifesciences.org/articles/92885/elife-92885-fig5-data2-v1.zip
-
Figure 5—source data 3
Original file for the western blot analysis in Figure 5A (gasdermin D [GSDMD]/cleaved GSDMD).
- https://cdn.elifesciences.org/articles/92885/elife-92885-fig5-data3-v1.zip
-
Figure 5—source data 4
Original file for the western blot analysis in Figure 5A (GSDME/cleaved GSDME).
- https://cdn.elifesciences.org/articles/92885/elife-92885-fig5-data4-v1.zip
-
Figure 5—source data 5
Original file for the western blot analysis in Figure 5A (caspase-3/cleaved caspase-3).
- https://cdn.elifesciences.org/articles/92885/elife-92885-fig5-data5-v1.zip
-
Figure 5—source data 6
Original file for the western blot analysis in Figure 5A (β-actin).
- https://cdn.elifesciences.org/articles/92885/elife-92885-fig5-data6-v1.zip
-
Figure 5—source data 7
Original images for the western blot analysis (NLRP3, caspase-1/cleaved caspase-1, gasdermin D [GSDMD]/cleaved GSDMD, GSDME/cleaved GSDME, caspase-3/cleaved caspase-3, and β-actin) with highlighted bands and sample labels in Figure 5A.
- https://cdn.elifesciences.org/articles/92885/elife-92885-fig5-data7-v1.zip
-
Figure 5—source data 8
IL-1β and lactate dehydrogenase (LDH) analysis of bone marrow neutrophils supernatant in Figure 5B and C.
- https://cdn.elifesciences.org/articles/92885/elife-92885-fig5-data8-v1.xlsx
Figure 5—figure supplement 1

Doxorubicin activates inflammasome-dependent and -independent pathways in neutrophils.
Wild-type (WT) neutrophils were left untreated or primed with lipopolysaccharide (LPS) for 3 hr, then treated with various doxorubicin concentrations for 16 hr. Bar graph represents the quantitative data from whole cell lysates analyzed by immunoblotting.
-
Figure 5—figure supplement 1—source data 1
Western blot analysis of bone marrow neutrophils in Figure 5—figure supplement 1.
- https://cdn.elifesciences.org/articles/92885/elife-92885-fig5-figsupp1-data1-v1.xlsx
Figure 6
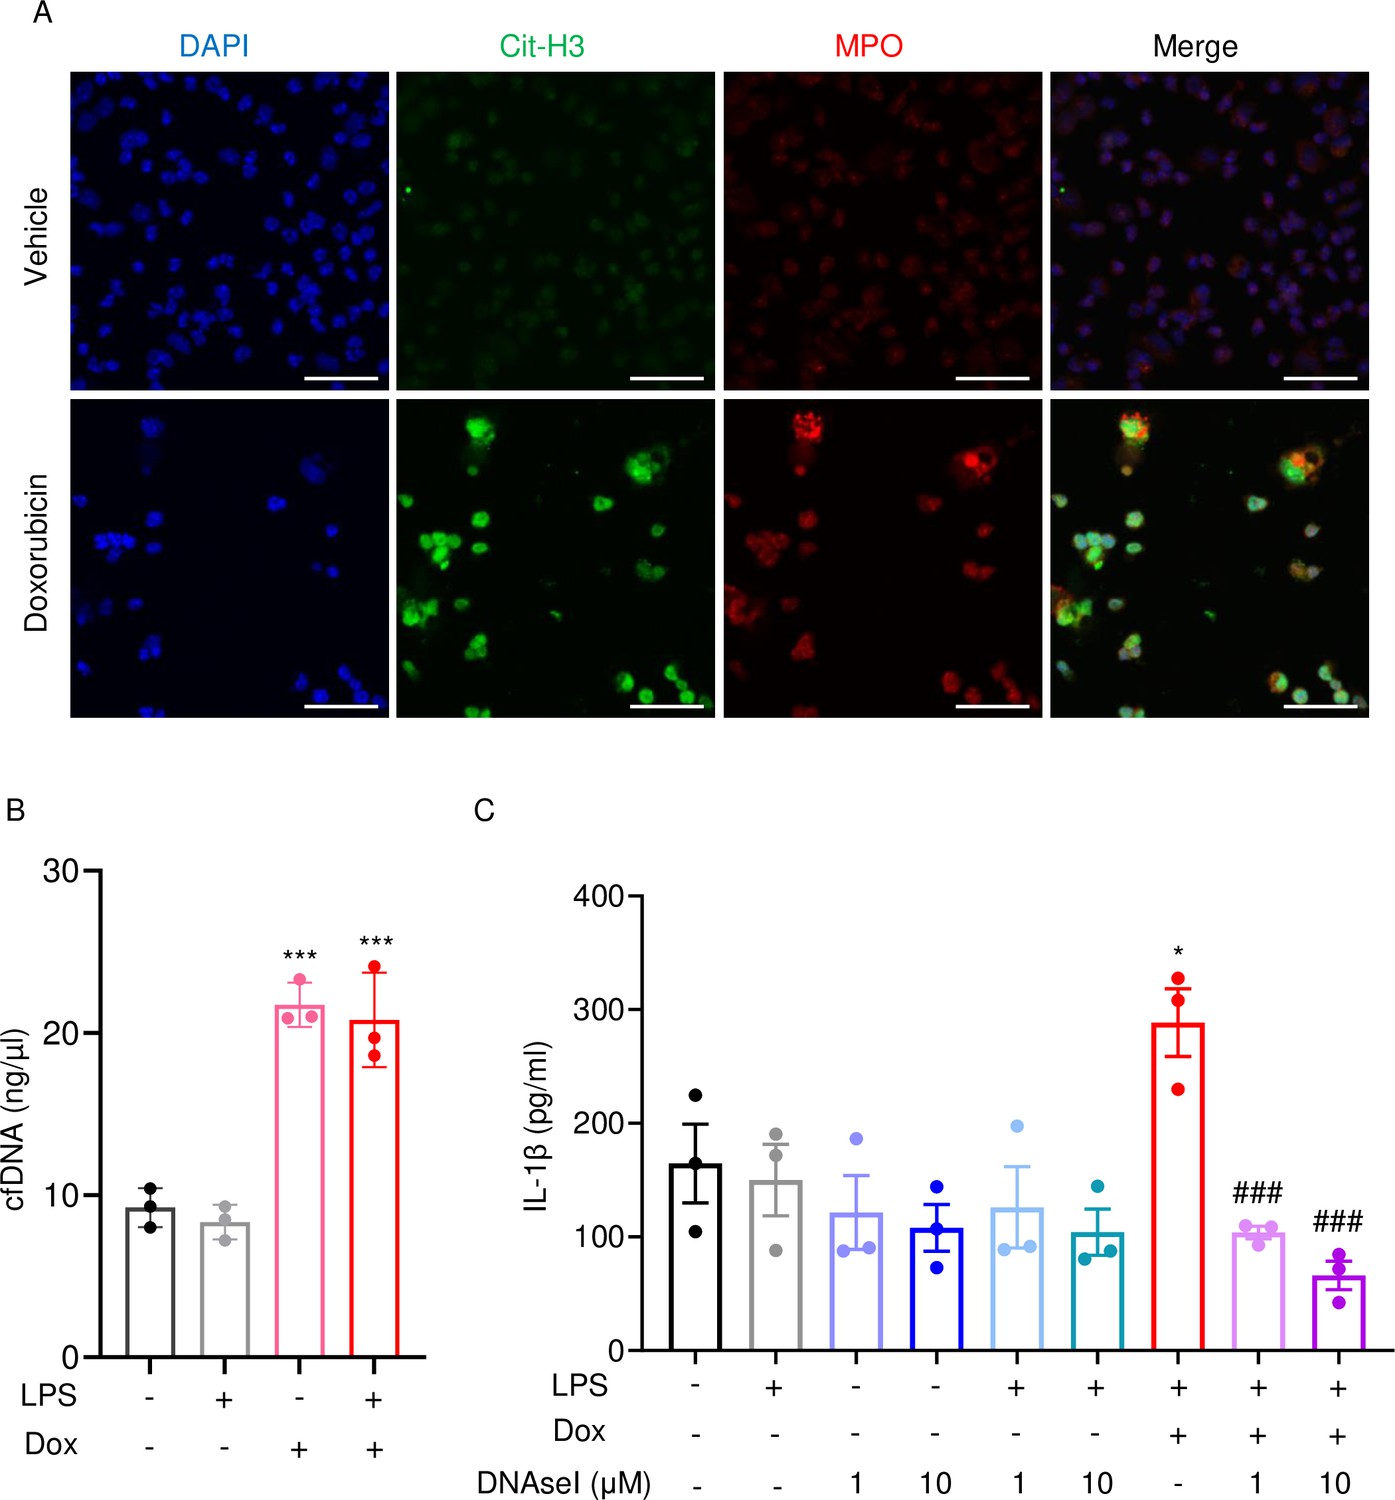
Doxorubicin causes NETosis in vitro.
Wild-type (WT) mouse bone marrow neutrophils were left untreated or treated with 10 µM doxorubicin for 16 hr (A). Cit-H3 and MPO were analyzed by immunofluorescence. Scale bars: 50 μm. Images are representative of at least three independent experiments. Neutrophils were left untreated or primed with LPS for 3 hr, then treated with 10 µM doxorubicin for 16 hr. cfDNA in the conditioned medium was extracted and quantified (B). Neutrophils were left untreated or primed with LPS for 3 hr, then treated with 10 µM doxorubicin and/or DNase I for 16 hr. IL-1β in the conditioned media was measured by enzyme linked immunosorbent assay (ELISA) (C). Data are mean ± SEM from experimental triplicates and are representative of at least two independent experiments. *p<0.05; **p<0.01; ***p<0.001 vs. LPS; #p<0.05, ###p<0.001 vs. LPS+Dox. One-way ANOVA was used. Dox, doxorubicin; cfDNA, cell-free DNA; Cit-H3, citrullinated histone H3; MPO, myeloperoxidase.
-
Figure 6—source data 1
Cell-free DNA (cfDNA) and IL-1β analysis of bone marrow neutrophils supernatant in Figure 6B–C.
- https://cdn.elifesciences.org/articles/92885/elife-92885-fig6-data1-v1.xlsx
Figure 7 with 2 supplements
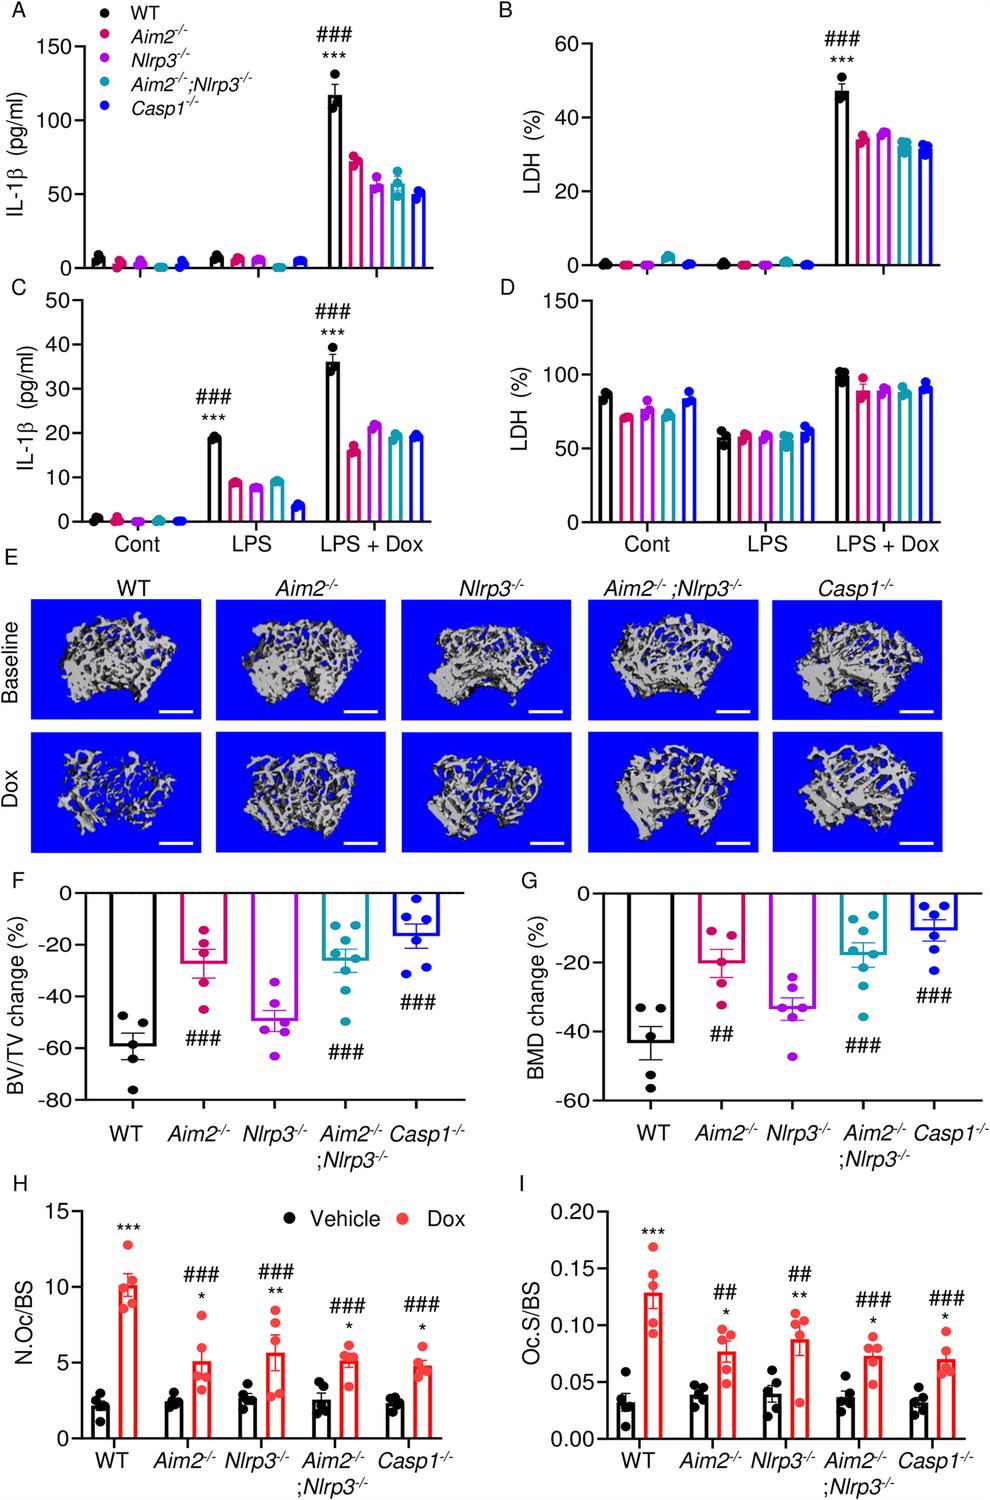
AIM2 and NLRP3 inflammasomes are involved in bone-damaging effects of doxorubicin.
WT, Aim2-/-, Nlrp3-/-, Aim2-/-;Nlrp3-/- or Casp1-/- bone marrow-derived macrophages (BMMs) (A, B) and neutrophils (C, D) were left untreated or primed with LPS for 3 hr, then exposed or not to 10 µM doxorubicin for 16 hr. IL-1β (A, C) and LDH (B, D) in the conditioned media were measured by enzyme linked immunosorbent assay (ELISA) and the cytotoxicity detection kit, respectively. Femurs from male mice were analyzed by VivaCT before (baseline) and 4 weeks after a single intraperitoneal injection of 5 mg/kg doxorubicin (E–G). Cross sections of 3D reconstructions. Scale bars: 500 μm (E). BV/TV changes (F). BMD changes (G). Femurs harvested from different genotypes of male mice were analyzed 4 weeks after a single intraperitoneal injection of vehicle or doxorubicin (H, I). Specimens were stained for tartrate-resistant acidic phosphatase (TRAP) activity. N.Oc/BS (H). Oc.S/BS (I). Data are mean ± SEM from experimental triplicates and are representative of at least two independent experiments (A–D); n=5–8 mice/group (E–I). Data are mean ± SEM. *p<0.05; **p<0.01; ***p<0.001 vs. control, LPS, or vehicle; ##p<0.01, ###p<0.001 vs. other genotypes or WT treated with Dox. Two-way ANOVA (A–D, H–I) and one-way ANOVA (F–G) were used. AIM2, absent in melanoma 2; BMD bone mineral density; BV/TV, bone volume/total volume; casp1, caspase-1; Cont, control; Dox, doxorubicin; IL-1β, interleukin-1β; LDH, lactate dehydrogenase; LPS, lipopolysaccharide; N.Oc/BS, OC number/bone surface; Oc.S/BS; OC, osteoclast; WT, wild-type.
-
Figure 7—source data 1
IL-1β and lactate dehydrogenase (LDH) analysis of different genotypes of bone marrow-derived macrophages (BMMs) and bone marrow neutrophils supernatant in Figure 7A–D.
- https://cdn.elifesciences.org/articles/92885/elife-92885-fig7-data1-v1.xlsx
-
Figure 7—source data 2
Micro-computed tomography (µCT) analysis of different genotypes of mice in Figure 7F and G.
- https://cdn.elifesciences.org/articles/92885/elife-92885-fig7-data2-v1.xlsx
-
Figure 7—source data 3
Tartrate-resistant acidic phosphatase (TRAP) staining analysis of different genotypes of mice in Figure 7H and I.
- https://cdn.elifesciences.org/articles/92885/elife-92885-fig7-data3-v1.xlsx
Figure 7—figure supplement 1
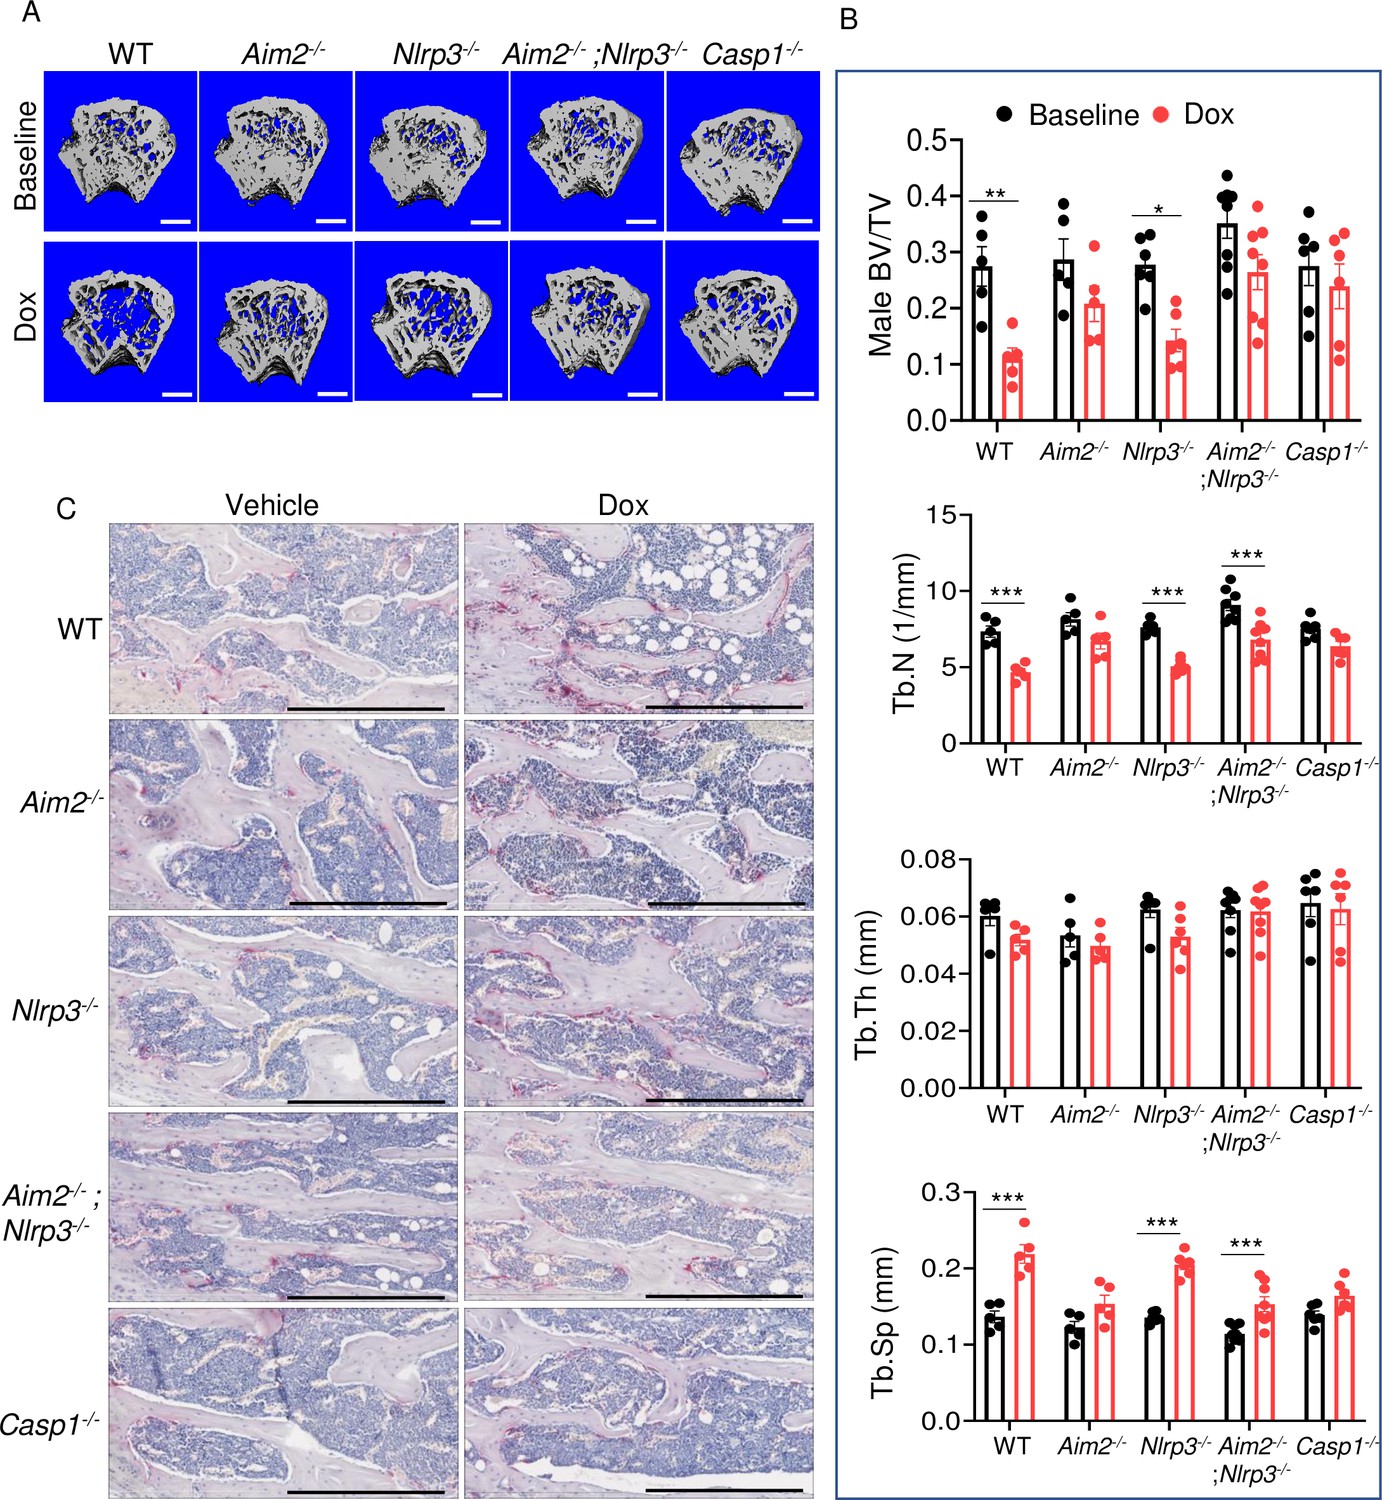
AIM2 and NLRP3 inflammasomes are involved in bone-damaging effects of doxorubicin in male mice.
Femurs from WT, Aim2-/-, Nlrp3-/-, Aim2-/-; Nlrp3-/- or Casp1-/- male mice were analyzed by VivaCT before (baseline) and 4 weeks after a single intraperitoneal injection of 5 mg/kg doxorubicin (A, B). Cross sections of 3D reconstructions of trabecular and cortical (A; scale bars: 500 μm) bones. Bones from WT, Aim2-/-, Nlrp3-/-, Aim2-/-; Nlrp3-/- or Casp1-/- male mice were analyzed 4 weeks after a single intraperitoneal injection of vehicle or doxorubicin; specimens were stained for tartrate-resistant acidic phosphatase (TRAP) activity (C; scale bars: 400 μm). Data are mean ± SEM. N=5–8 mice/group. ***p<0.001. Two-way ANOVA was used. BV/TV, bone volume/total volume; BMD bone mineral density; Tb.N, trabecular number; Tb.Th, trabecular thickness; Tb.Sp, trabecular separation; WT, wild-type.
-
Figure 7—figure supplement 1—source data 1
Micro-computed tomography (µCT) analysis of different genotypes of male mice in Figure 7—figure supplement 1B.
- https://cdn.elifesciences.org/articles/92885/elife-92885-fig7-figsupp1-data1-v1.xlsx
Figure 7—figure supplement 2
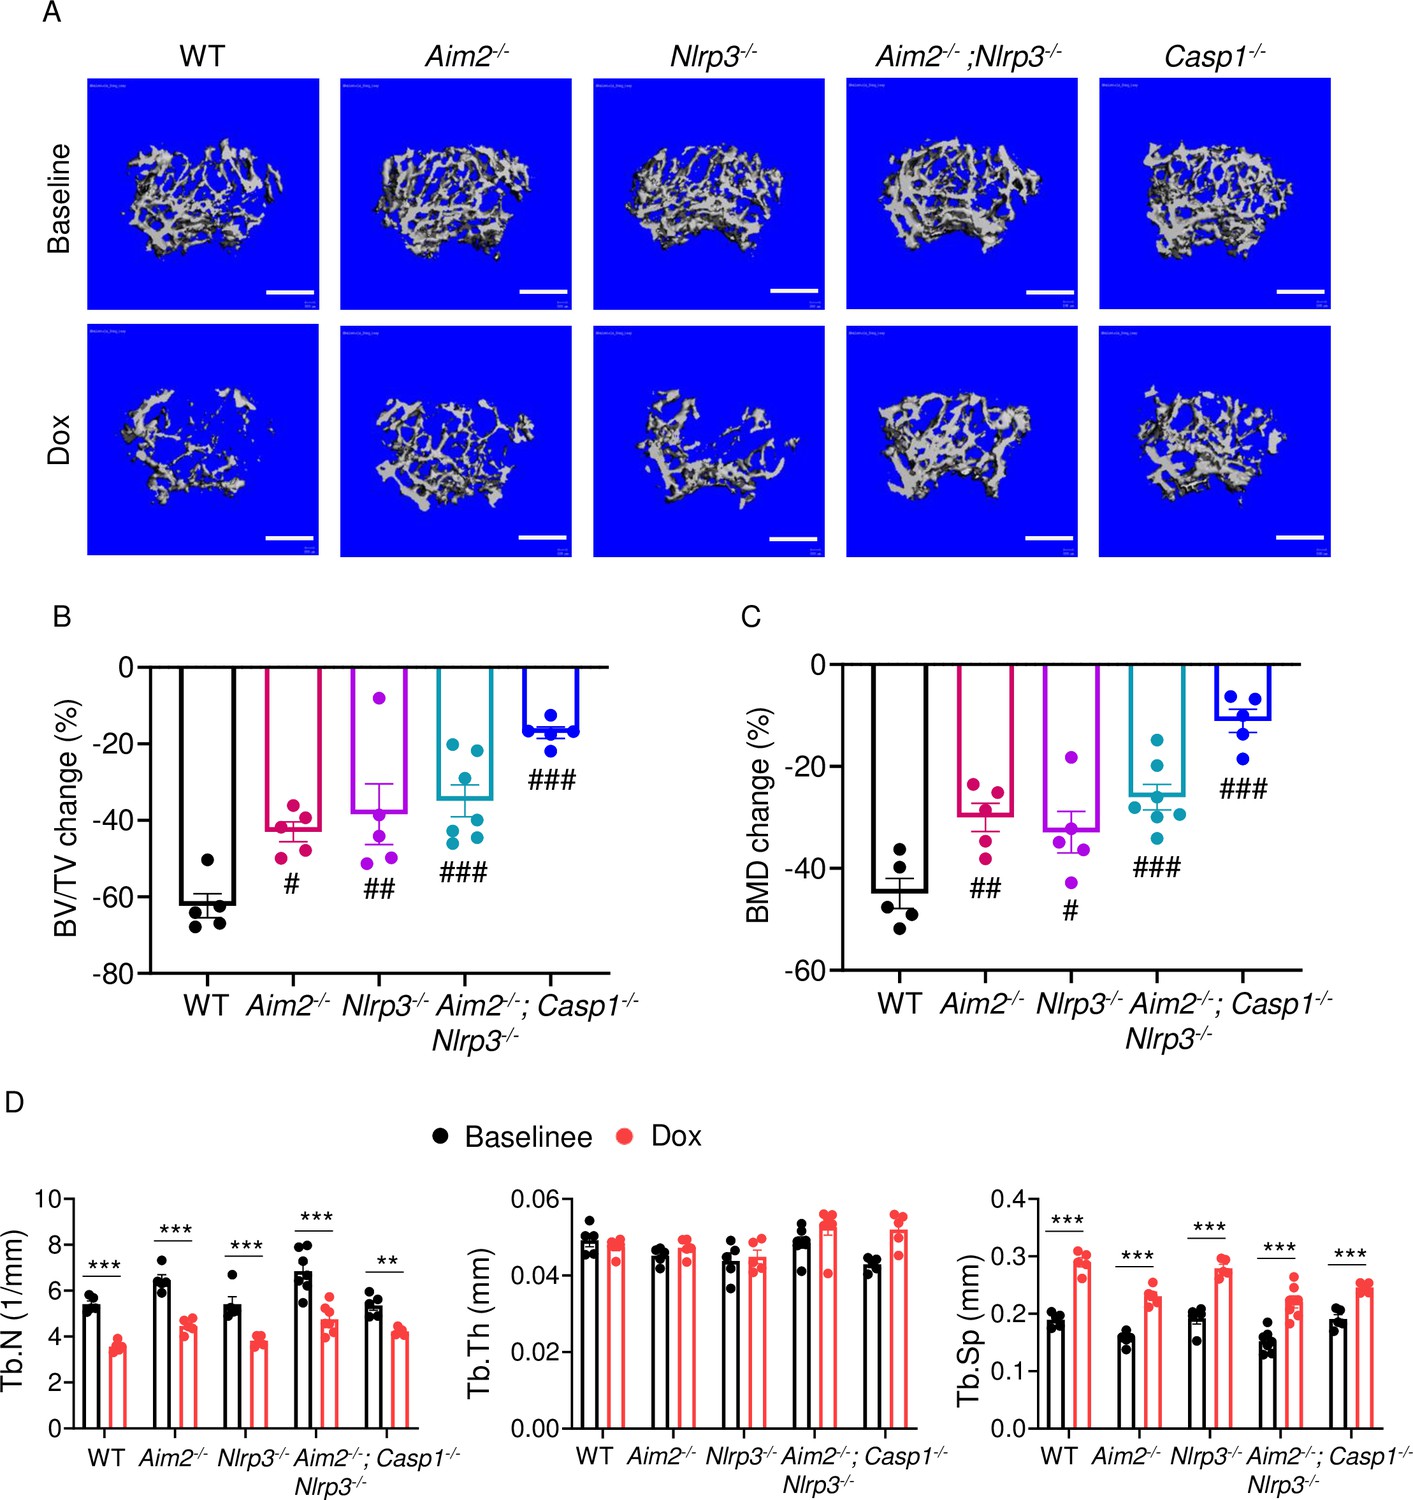
AIM2 and NLRP3 inflammasomes are involved in bone-damaging effects of doxorubicin in female mice.
Femurs from WT, Aim2-/-, Nlrp3-/-, Aim2-/-; Nlrp3-/- or Casp1-/- female mice were analyzed by VivaCT before (baseline) and 4 weeks after a single intraperitoneal injection of 5 mg/kg doxorubicin. Cross sections of 3D reconstructions (A). BV/TV changes (B). BMD changes (C). Additional bone parameters (D). Data are mean ± SEM. N=5 mice/group. **p<0.01; ***p<0.001; #p<0.05; ##p<0.01; ###p<0.001. One-way ANOVA (B, C) and two-way ANOVA (D) were used. Scale bars: 500 μm. BV/TV, bone volume/total volume; BMD bone mineral density; Tb.N, trabecular number; Tb.Th, trabecular thickness; Tb.Sp, trabecular separation; WT, wild-type.
-
Figure 7—figure supplement 2—source data 1
Micro-computed tomography (µCT) analysis of different genotypes of female mice in Figure 7—figure supplement 2B–D.
- https://cdn.elifesciences.org/articles/92885/elife-92885-fig7-figsupp2-data1-v1.xlsx
Figure 8
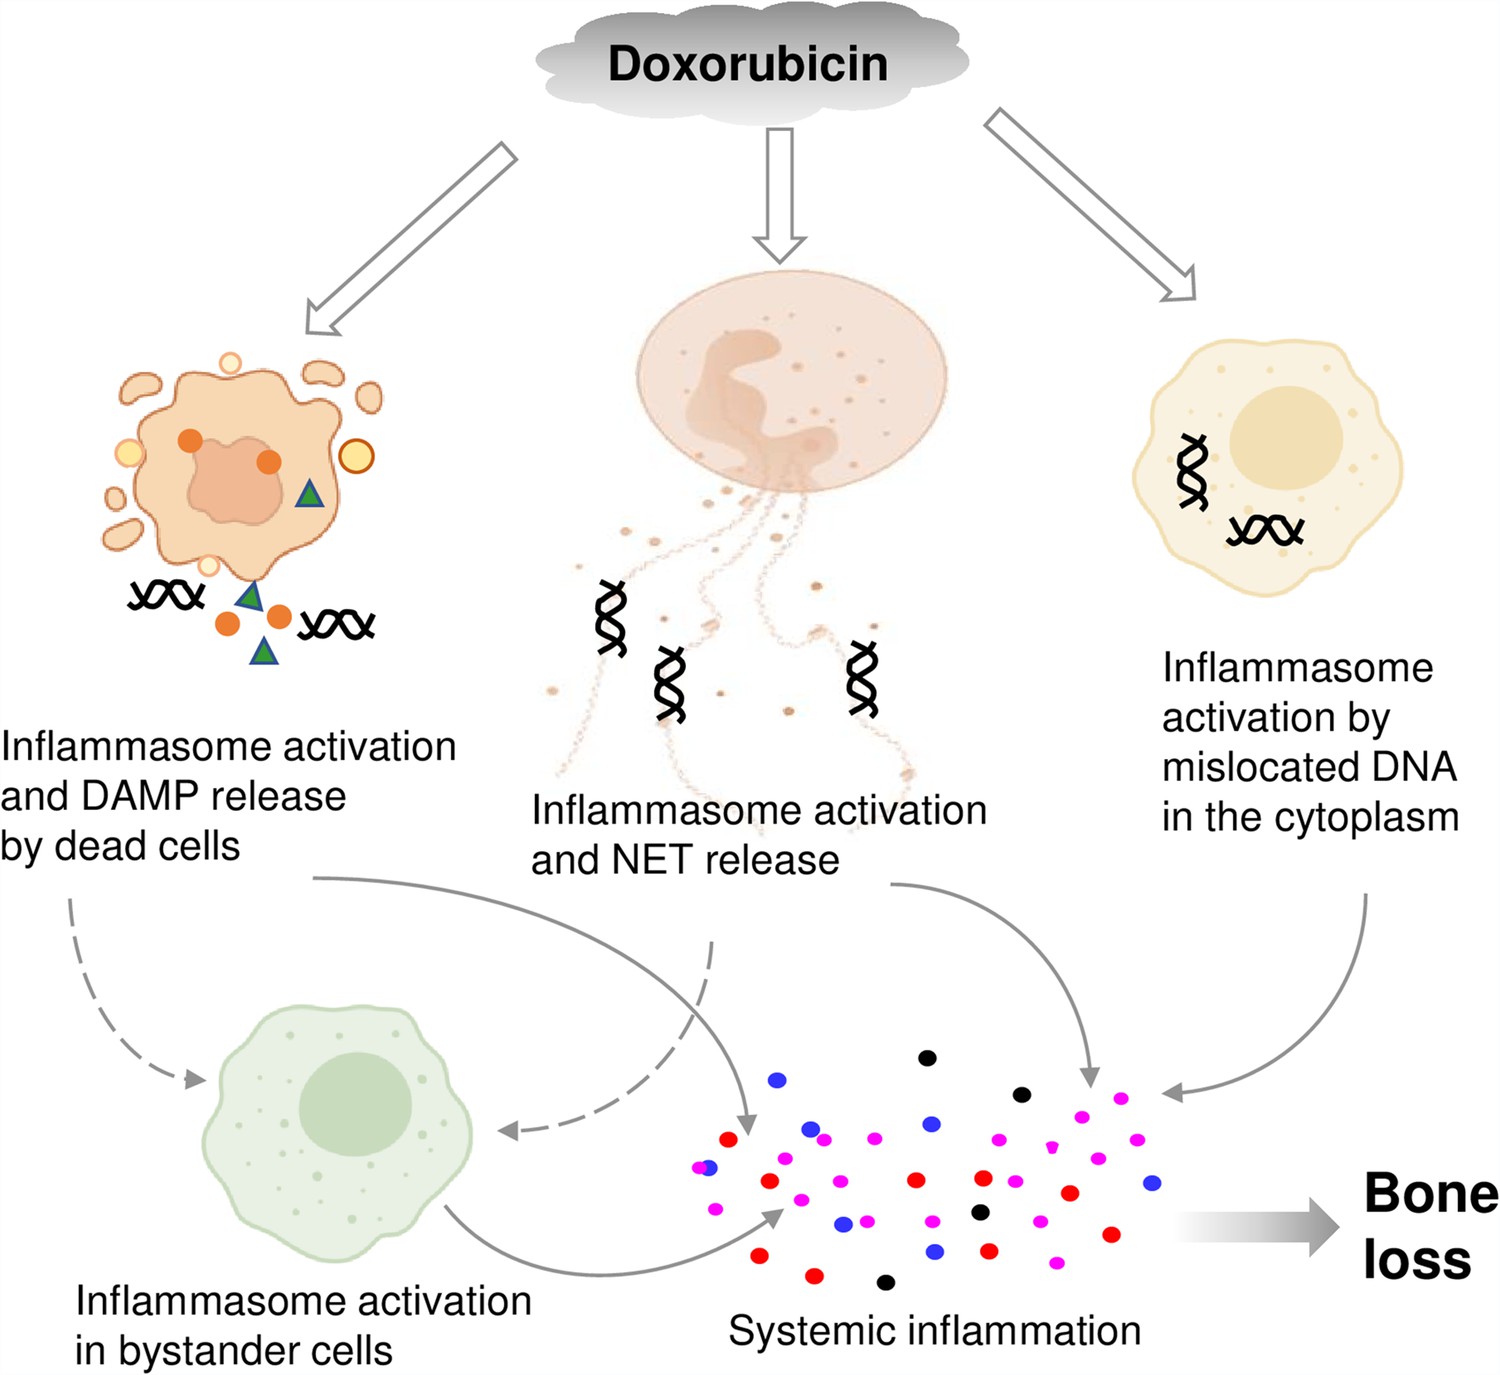
Graphical abstract.
Double line arrows: direct effects of doxorubicin on target cells. Solid line arrows: direct contribution to systemic inflammation. Broken line arrows: indirect contribution to systemic inflammation.
© 2024, BioRender Inc. Figure 8 was created using BioRender, and is published under a CC BY-NC-ND license. Further reproductions must adhere to the terms of this license.
Additional files
Download links
A two-part list of links to download the article, or parts of the article, in various formats.
Downloads (link to download the article as PDF)
Open citations (links to open the citations from this article in various online reference manager services)
Cite this article (links to download the citations from this article in formats compatible with various reference manager tools)
Chemotherapy activates inflammasomes to cause inflammation-associated bone loss
eLife 13:RP92885.
https://doi.org/10.7554/eLife.92885.4


