Chemoproteomics validates selective targeting of Plasmodium M1 alanyl aminopeptidase as an antimalarial strategy
- Drug Delivery, Disposition and Dynamics, Monash Institute of Pharmaceutical Sciences, Monash University, Australia
- School of Medicine, Deakin University, Australia
- The Institute for Mental and Physical Health and Clinical Translation, Deakin University, Australia
- Monash Biomedicine Discovery Institute and Department of Microbiology, Monash University, Australia
- Centre to Impact AMR, Monash University, Australia
- Medicinal Chemistry, Monash Institute of Pharmaceutical Sciences, Monash University, Australia
- Discovery Biology, Centre for Cellular Phenomics, Griffith University, Australia
- Swiss Tropical and Public Health Institute, Switzerland
- University of Basel, Switzerland
- The Walter and Eliza Hall Institute of Medical Research, Australia
- Department of Medical Biology, The University of Melbourne, Australia
- School of Environment and Science, Griffith University, Australia
Figures
Figure 1 with 1 supplement
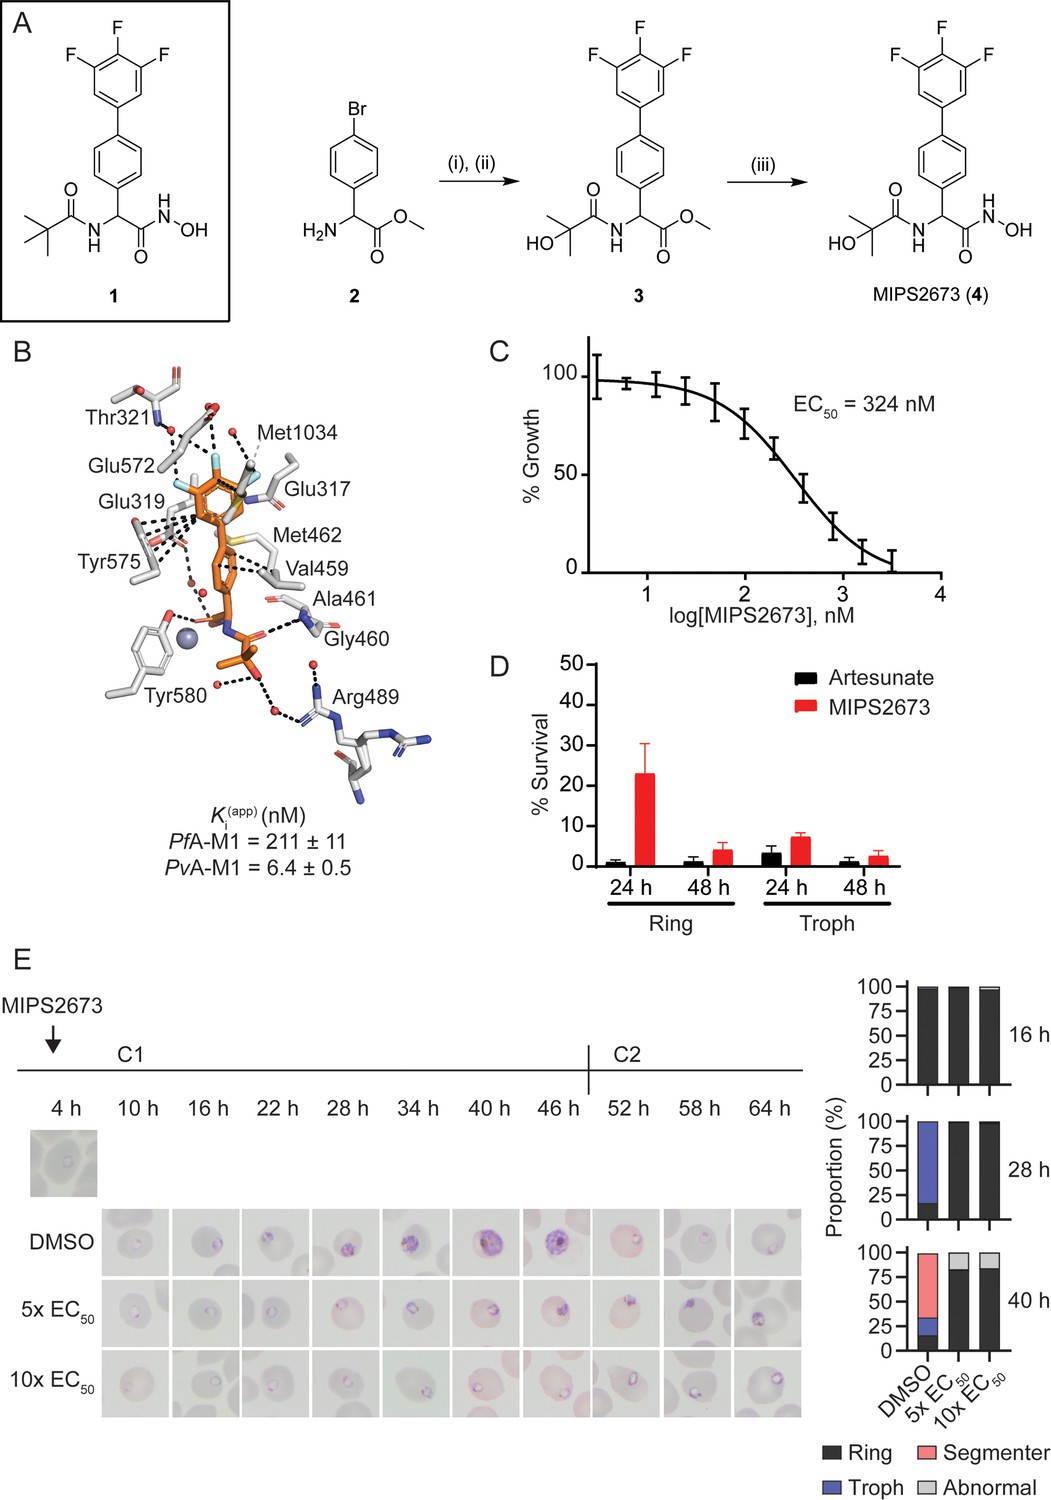
Synthesis and antimalarial activity of the M1-selective aminopeptidase inhibitor, MIPS2673.
(A) Synthesis of MIPS2673 (4). Reagents and conditions: (i) RCOOH, EDCI, DMAP, CH2Cl2; (ii) 3,4,5-trifluorophenylboronic acid, Pd(PPh3)2Cl2, Na2CO3, THF; (iii) NH2OH•HCl, KOH. (B) Binding mode of MIPS2673 bound to PfA-M1 determined by X-ray crystallography (8SLO.pdb). Interactions between MIPS2673 (orange sticks) and PfA-M1 (grey) shown as black dashed lines. Inhibition constant (Ki) for MIPS2673 towards recombinant, purified PfA-M1 and PvA-M1. (C) Sensitivity to MIPS2673 exposure (72 hr) for P. falciparum 3D7 parasites. Parasite growth was determined relative to a no-drug control by SYBR Green I assay. The EC50 value was calculated from four biological replicates performed in technical triplicate and the data plotted as the mean ± standard error of the mean. (D) Stage-dependent activity of MIPS2673 in P. falciparum (3D7). Synchronised ring- or trophozoite-stage cultures were incubated for either 24 hr or 48 hr with compound at 10× EC50, before the drug was washed off and parasites allowed to grow for a further 48 hr. Growth was determined via SYBR Green I assay and compared to vehicle (DMSO)-treated controls. Shown is the mean ± standard deviation (n=4). (E) MIPS2673-induced morphology and growth effects for P. falciparum 3D7 parasites (left). Synchronised cultures at 4 hr post invasion were treated over two cycles (C1, cycle 1; C2, cycle 2) with either 5× or 10× EC50 or DMSO at the concentration present in the 10× EC50 treatment. Representative Giemsa-stained smears from two biological replicates show parasites stalling and dying at the ring to trophozoite transition. The percentage of parasites at each stage of development is shown from counts of 100 infected red blood cells at 16 hr, 28 hr, and 40 hr post invasion (right).
-
Figure 1—source data 1
Data collection and refinement statistics for X-ray crystal structure.
- https://cdn.elifesciences.org/articles/92990/elife-92990-fig1-data1-v1.docx
Figure 1—figure supplement 1

Antimalarial potency of the clinically used artemisinin derivative, artesunate.
Sensitivity to artesunate exposure (72 hr) for P. falciparum 3D7 parasites. Artesunate activity was tested alongside MIPS2673 as a reference compound with known antimalarial activity. Parasite growth was determined relative to a no-drug control by SYBR Green I assay. The EC50 value was calculated from four biological replicates performed in technical triplicate and the data plotted as the mean ± standard error of the mean.
Figure 2
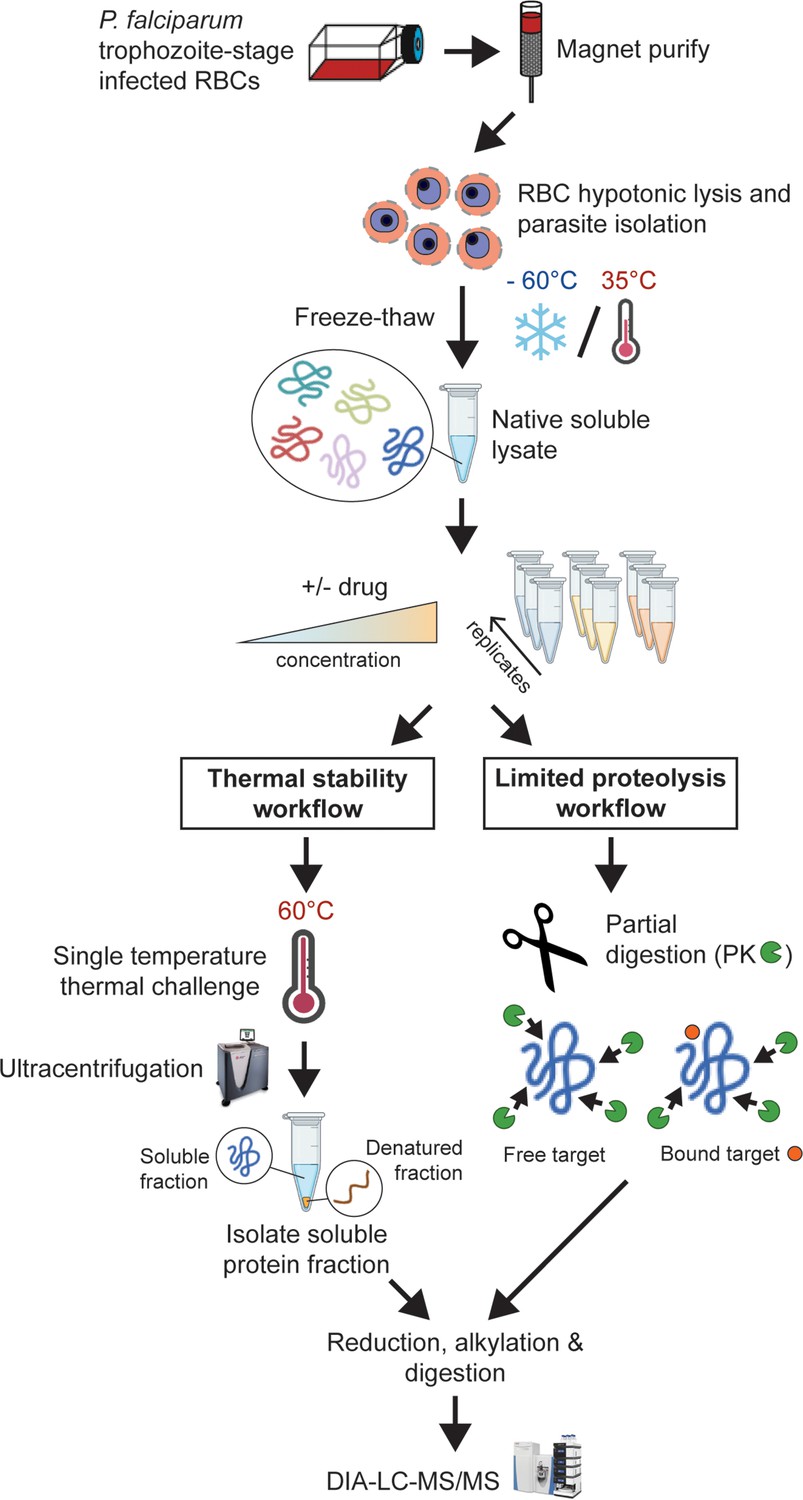
Experimental thermal stability and limited proteolysis workflows for unbiased drug target identification in P. falciparum lysates.
Synchronised trophozoite-stage parasites (30–38 hr post invasion) are isolated from the host red blood cell by hypotonic lysis. Proteins are extracted from cells under native conditions by multiple freeze-thaw cycles. The lysate, comprising the soluble protein fraction, is pooled and distributed to achieve multiple independent incubations per reaction condition for use in either thermal stability or limited proteolysis workflows. For thermal stability proteomics studies, the parasite lysate is subjected to treatment with vehicle (untreated control) or drug at two concentrations, followed by thermal challenge at 60°C. The soluble (non-denatured) protein fraction is isolated by ultracentrifugation and digested overnight with trypsin. The resulting peptide mixture is analysed by data-independent acquisition (DIA)-liquid chromatography coupled to mass spectrometry (LC-MS/MS) against an in-house-generated spectral library to determine drug-induced thermal stabilisation. For limited proteolysis studies, ligand-protein interactions are monitored at multiple drug concentrations following double protease digestion. An initial pulse proteolysis with the broad specificity protease, proteinase K (PK), captures local ligand-induced structural alterations of proteins that become differentially susceptible to protease cleavage upon drug binding. Samples then undergo complete digestion under reducing conditions with trypsin/LysC. Differential proteolytic patterns produced upon ligand binding are detected by DIA-LC-MS/MS and analysed against a limited proteolysis spectral library.
Figure 3 with 1 supplement
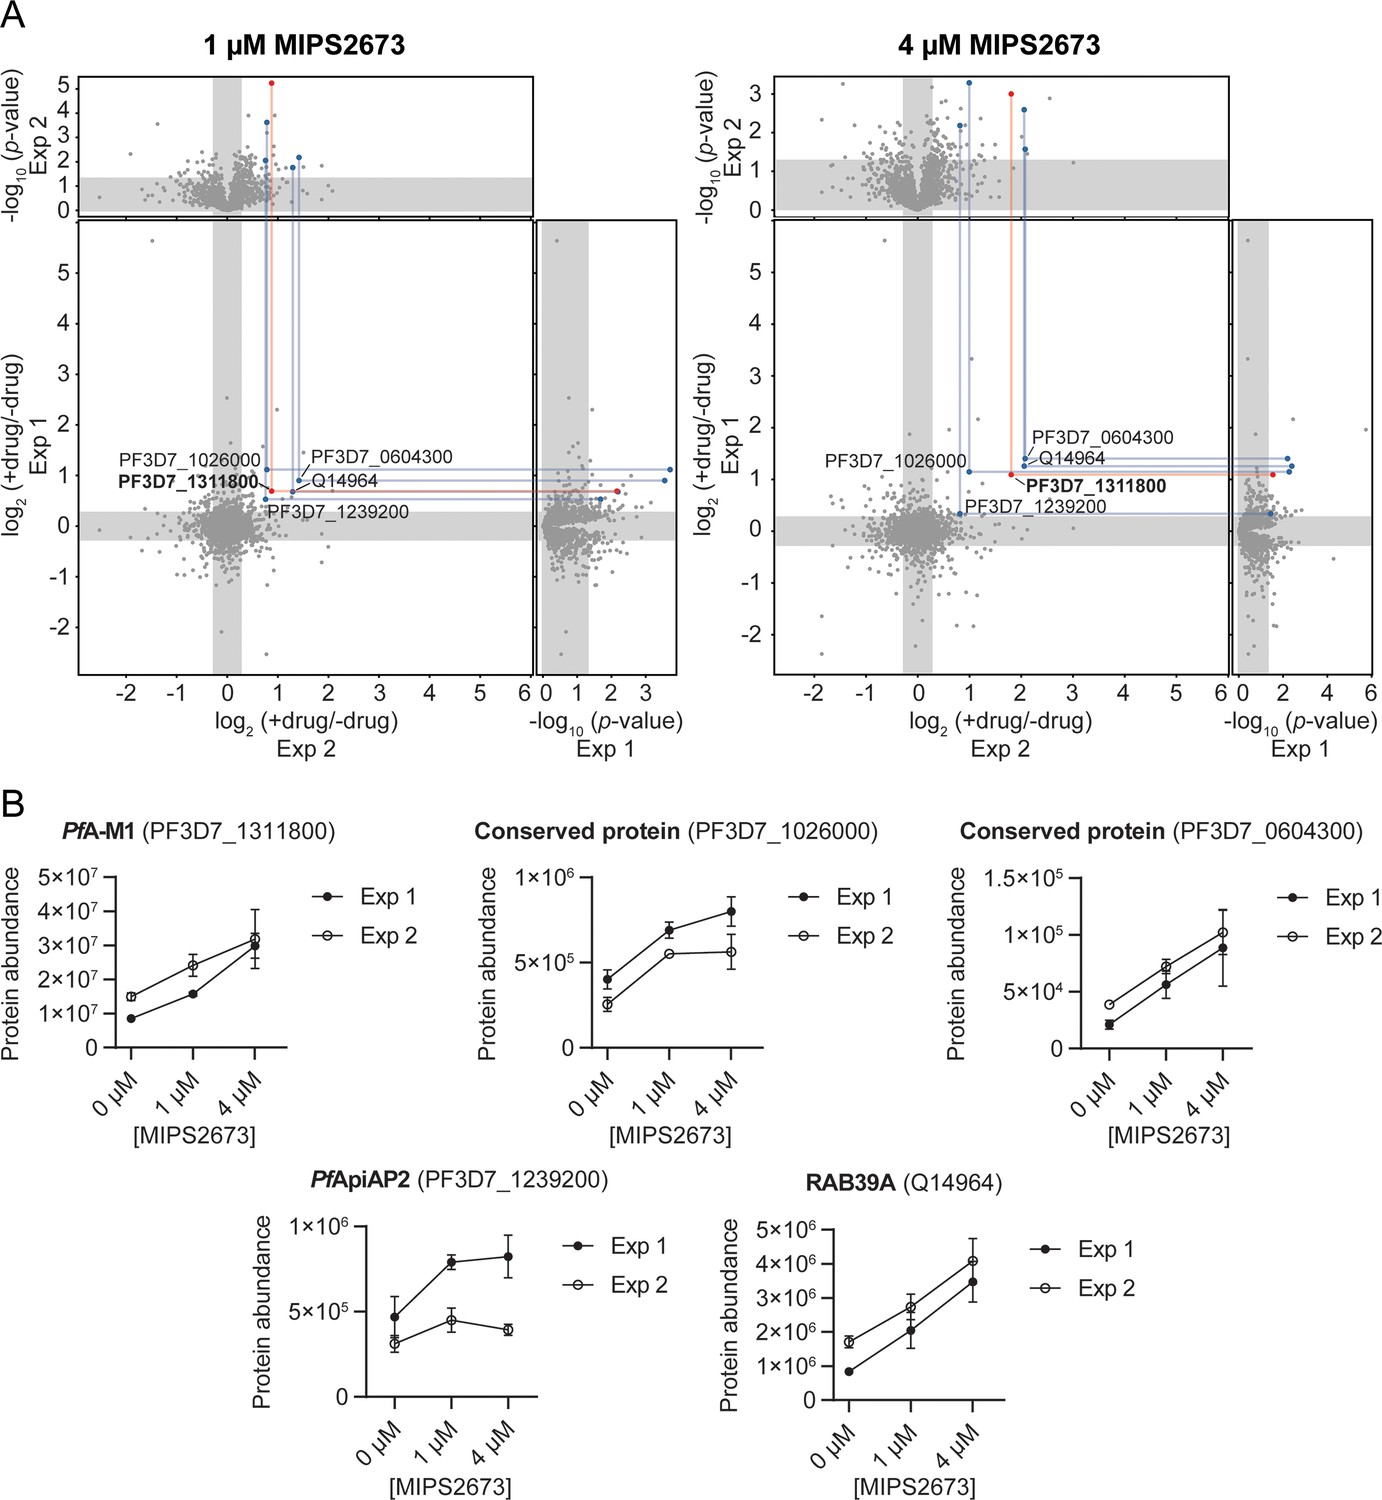
Thermal stabilisation of proteins by MIPS2673.
(A) Paired volcano plots of all proteins detected after a 60°C thermal challenge across two experiments from P. falciparum lysates (at least n=3 of independent lysate incubations per condition and experiment) treated with 1 μM (left) and 4 μM (right) MIPS2673. Outside panels show the fold-change in protein abundance for treated relative to untreated samples as a function of statistical significance (p-value) for independent experiments. Each protein is represented with a single data point. Significance cut-offs for thermal stabilisation were p<0.05 (Welch’s t-test) and fold-change >1.2 (unshaded regions). The central panel plots protein fold-change from experiments one and two, with proteins in the upper right quadrant reproducibly stabilised by >1.2-fold. Proteins passing both fold-change and statistical cut-offs at both drug concentrations and in multiple independent experiments are highlighted. M1-family alanyl aminopeptidase (PF3D7_1311800) is in red and all other proteins passing cut-offs are in blue. (B) Individual profiles for the five proteins reproducibly stabilised by MIPS2673 after a 60°C thermal challenge. Two independent experiments are shown. Data are mean protein abundances in the absence and presence of MIPS2673 (± SD) from four replicates.
-
Figure 3—source data 1
Thermal stability proteomics datasets related to Figure 3.
- https://cdn.elifesciences.org/articles/92990/elife-92990-fig3-data1-v1.xlsx
-
Figure 3—source data 2
Thermal stability proteomics joint volcano plot data related to Figure 3.
- https://cdn.elifesciences.org/articles/92990/elife-92990-fig3-data2-v1.xlsx
Figure 3—figure supplement 1

Individual thermal stabilisation profile of PfA-M17 leucyl aminopeptidase after P. falciparum lysate treatment with MIPS2673.
Abundance of PfA-M17 leucyl aminopeptidase from P. falciparum lysates in the absence and presence of MIPS2673 after a 60°C thermal challenge. PfA-M17 was not stabilised by MIPS2673 after a 60°C thermal challenge (p>0.05). Error bars indicate SD (n=4 independent lysate incubations per condition in each independent experiment).
Figure 4 with 1 supplement
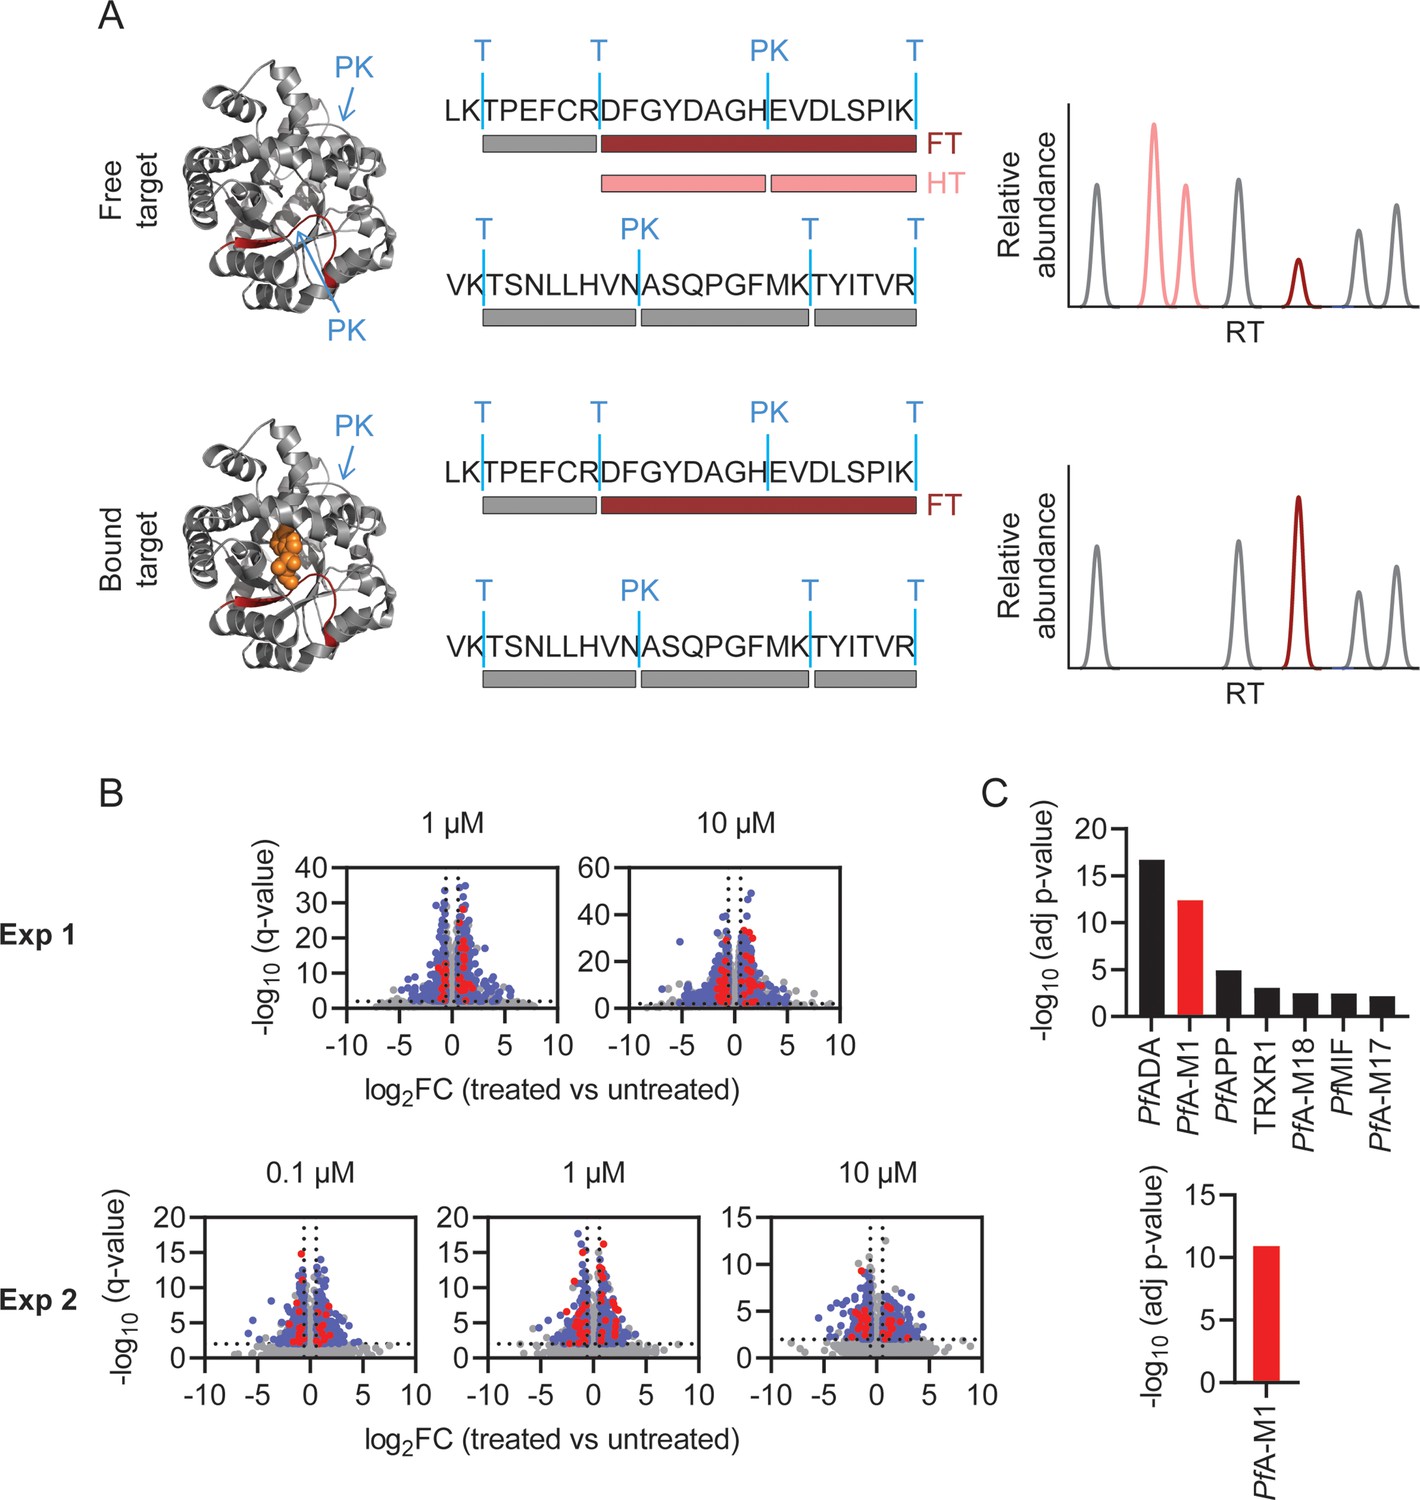
Identification of MIPS2673 target proteins using limited proteolysis coupled with mass spectrometry (LiP-MS).
(A) Principle of LiP-MS analysis. Ligand binding to a protein alters the local proteolytic susceptibility and prevents protein cleavage by proteinase K. In the bound state this results in decreased abundance of peptides with non-tryptic ends (half tryptic, HT) shown in pink and/or an increase in concentration of the corresponding fully tryptic (FT) peptide, shown in red. Peptides unaffected by ligand binding (grey) are unchanged in abundance. (B) Volcano plots of two independent LiP-MS experiments (at least n=3 independent lysate incubations per condition and experiment). Each data point represents a detected peptide. Fold-changes (FC) in peptide abundance in treated vs untreated samples are shown as a function of significance (q<0.01) at the MIPS2673 concentrations shown. Peptides highlighted in blue represent LiP peptides that were significant across all concentrations tested within an experiment. Red peptides represent significant LiP peptides from PfA-M1. (C) Short-list of putative MIPS2673 targets identified in each LiP-MS experiment after prioritising targets based upon the number of significant peptides detected per protein. Significance was determined using a Fisher’s exact test and Bonferroni corrected p<0.05. The expected target PfA-M1 aminopeptidase is shown in red.
-
Figure 4—source data 1
Limited proteolysis coupled with mass spectrometry (LiP-MS) proteomics datasets related to Figure 4 and Figure 5.
- https://cdn.elifesciences.org/articles/92990/elife-92990-fig4-data1-v1.xlsx
-
Figure 4—source data 2
Limited proteolysis coupled with mass spectrometry (LiP-MS) Fisher’s exact test p-values related to Figure 4.
- https://cdn.elifesciences.org/articles/92990/elife-92990-fig4-data2-v1.xlsx
-
Figure 4—source data 3
Experiment one: limited proteolysis coupled with mass spectrometry (LiP-MS) gene ontology (GO) molecular function enrichment analysis related to Figure 4.
- https://cdn.elifesciences.org/articles/92990/elife-92990-fig4-data3-v1.xlsx
Figure 4—figure supplement 1
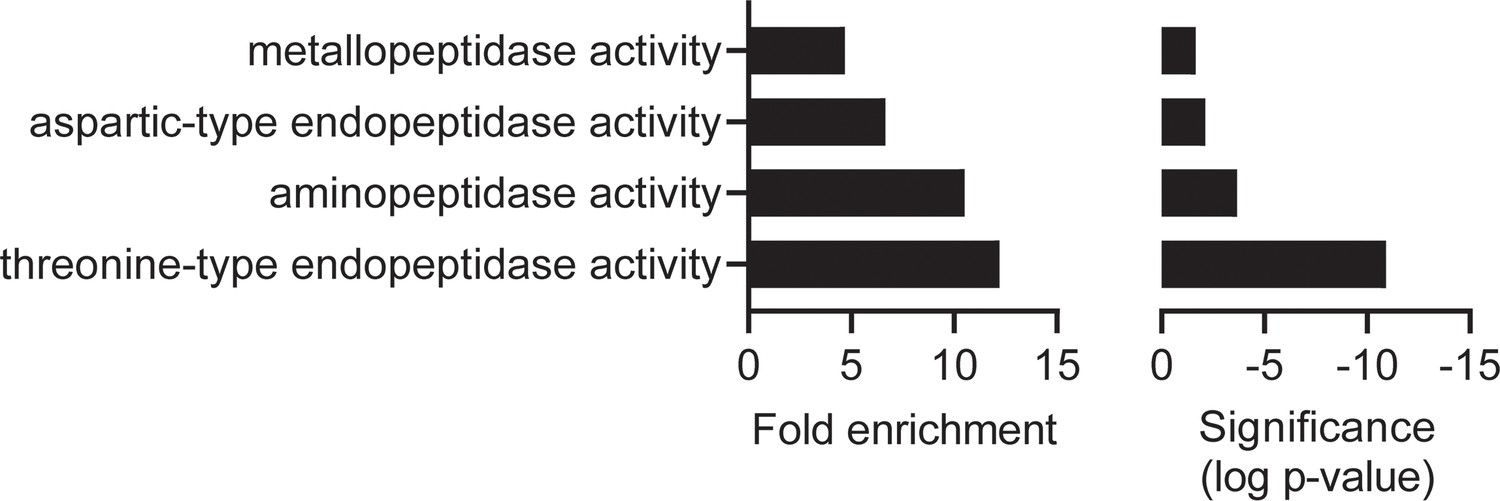
Molecular function gene ontology (GO) enrichment analysis of the MIPS2673 experiment one: limited proteolysis coupled with mass spectrometry (LiP-MS) dataset.
Fold enrichment (left) and significance (right) of GO molecular functions enriched among the expanded list of candidate MIPS2673 targets identified in the first LiP-MS experiment. All proteins with an uncorrected p<0.05 were tested against a background of proteins for which abundance was measured. PlasmoDB GO terms were used for GO term mapping. Enrichment in molecular function GO terms was tested with the Fisher’s exact test using the weight-algorithm in topGO. All terms with a p-value less than 0.05 were considered significant. GO terms represented by fewer than five proteins in the background dataset were excluded from the analysis.
Figure 5 with 2 supplements
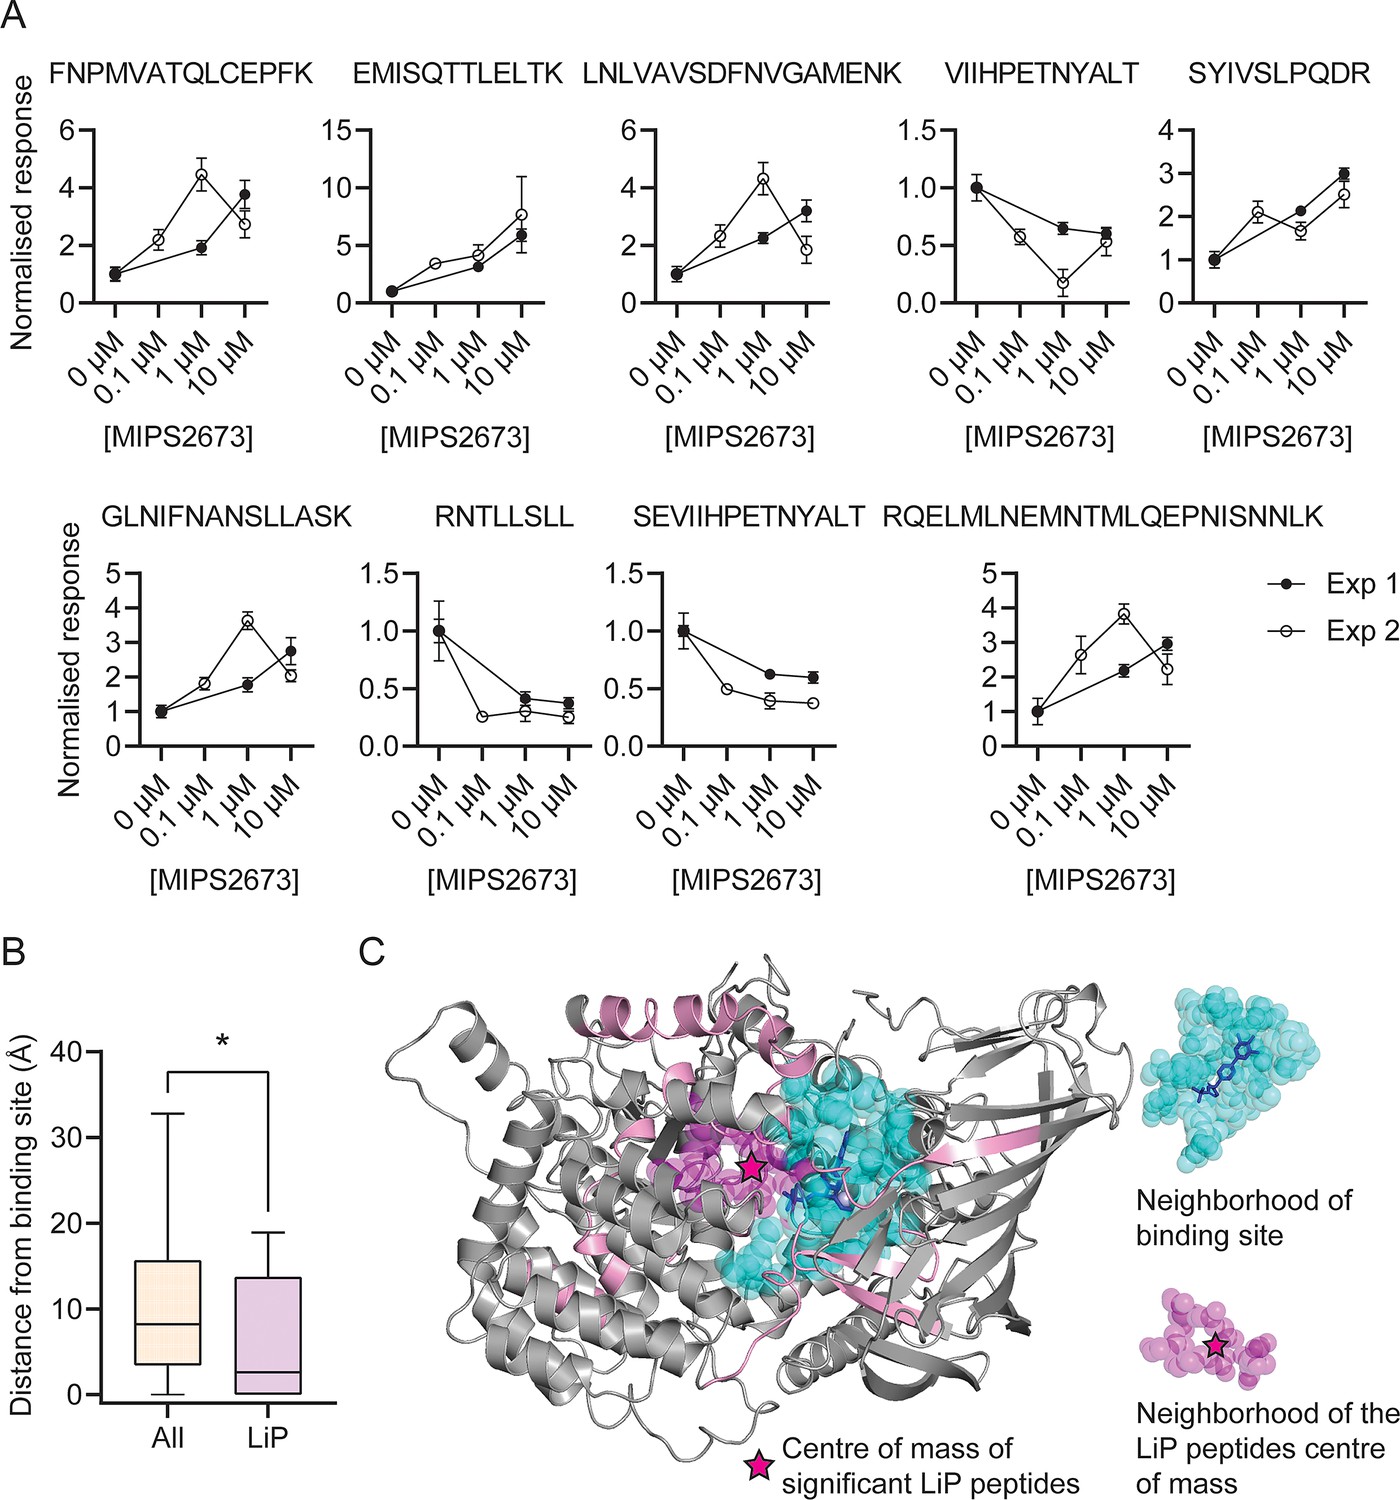
Features of structurally significant PfA-M1 limited proteolysis coupled with mass spectrometry (LiP-MS) peptides.
(A) Relative abundance of the significant LiP peptides commonly identified across two LiP-MS experiments following P. falciparum proteome lysate treatment with MIPS2673. The mean ± SEM of at least three independent lysate incubations per condition and experiment are shown. (B) Median distances between atoms of the nine significant LiP peptides or all detected PfA-M1 peptides and the PfA-M1 binding cleft residues. *p<0.05, Mann-Whitney test. (C) MIPS2673 binding site on PfA-M1 determined by X-ray crystallography (PDB: 8SLO), and approximation of the MIPS2673 binding site using the significant PfA-M1 LiP peptides and centre of mass calculation. The significant LiP peptides are mapped onto the PfA-M1 structure with MIPS2673 bound and are shown in pink. The drug ligand is shown in blue and the centre of mass of the significant LiP peptides is shown by a magenta star. The area in cyan represents the neighbourhood of the drug binding site determined as residues within 6.44 Å of bound MIPS2673. The neighbourhood of the LiP peptide centre of mass (residues within 6.44 Å of the centre of mass) is depicted in magenta.
Figure 5—figure supplement 1

Minimum distance of significant limited proteolysis coupled with mass spectrometry (LiP-MS) or all other PfA-M1 peptides from bound MIPS2673.
Among the 108 PfA-M1 peptides commonly identified across both LiP-MS experiments, nine peptides were significantly dysregulated in the presence of MIPS2673 at all concentrations tested. The atoms of these LiP peptides were used to measure the distribution of distances to bound MIPS2673 compared to all detected PfA-M1 peptides. *p<0.05, Mann-Whitney test.
Figure 5—figure supplement 2
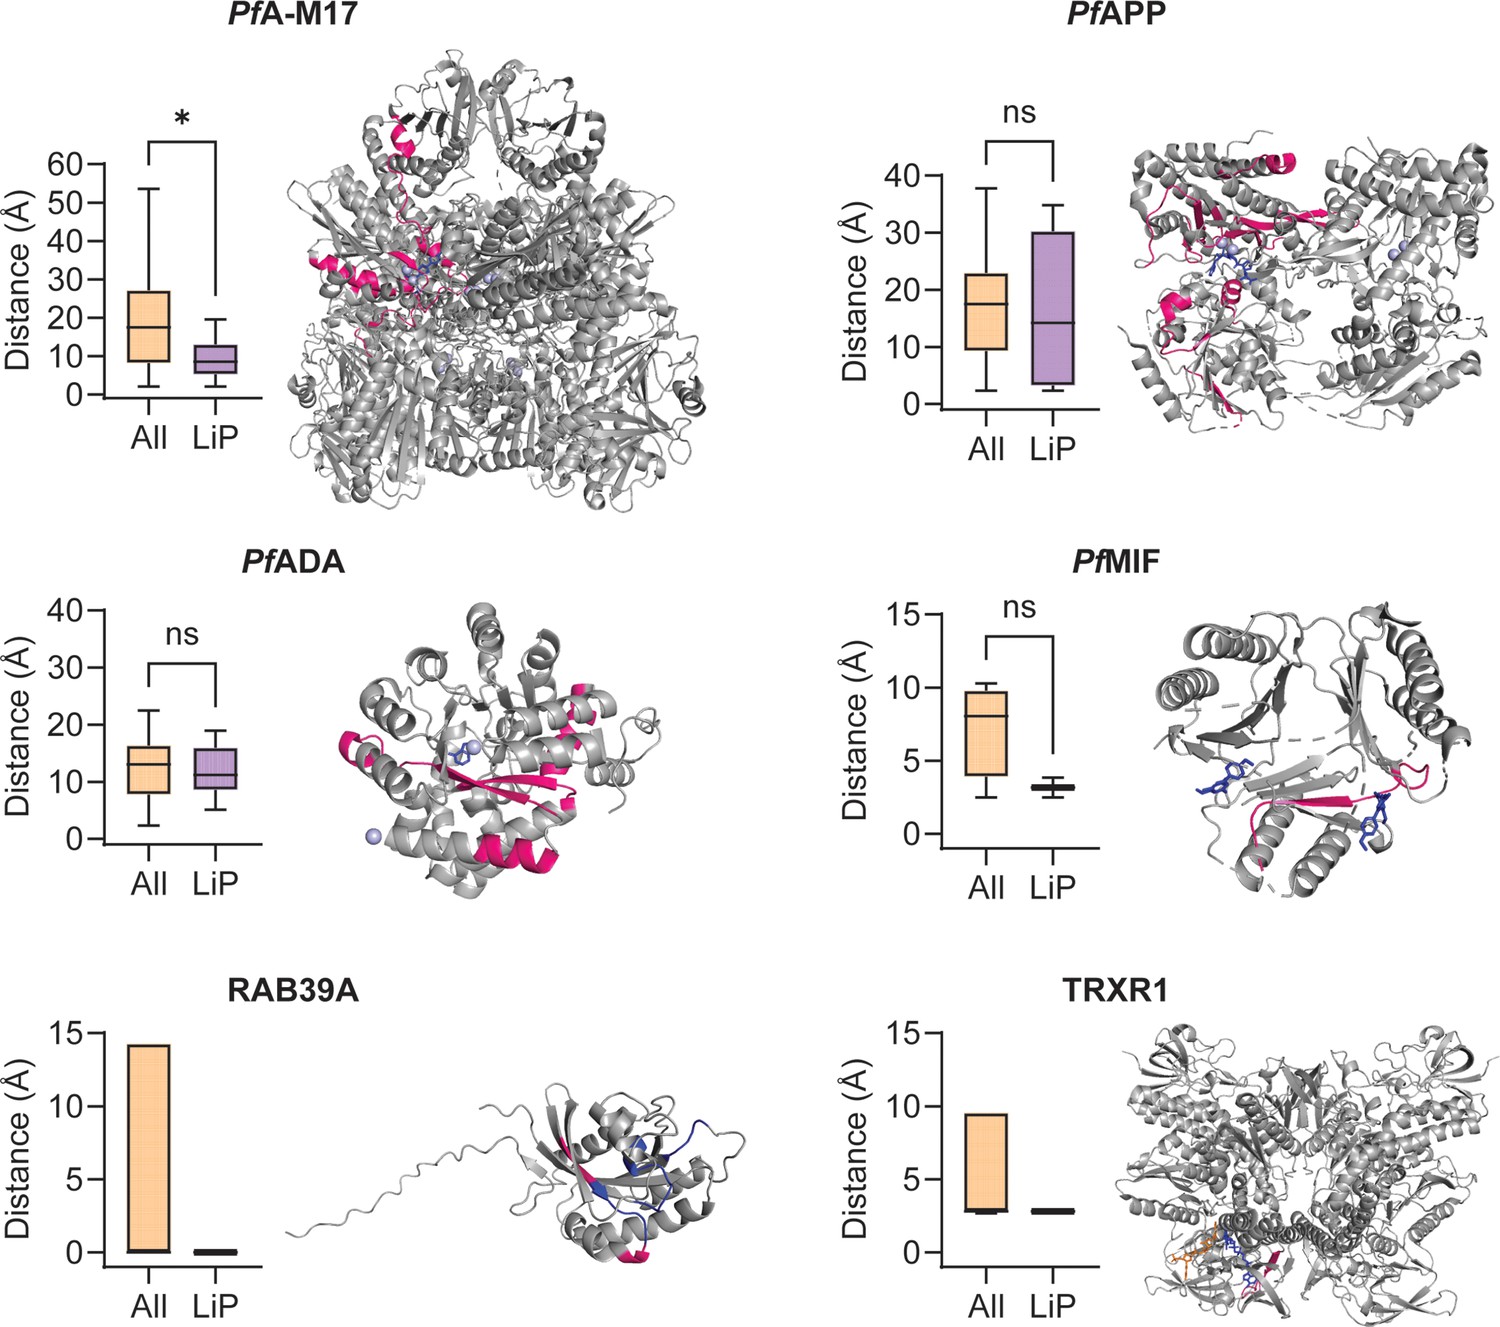
Minimum distance measurements and mapping of significant limited proteolysis coupled with mass spectrometry (LiP-MS) peptides to structures of other putative MIPS2673-interacting proteins.
Distance measurement analyses were performed for other putative MIPS2673-interacting proteins identified with thermal stability proteomics and LiP-MS (experiment one) where a protein structure was available and significant LiP-MS peptides were identified. Only peptides detected in both LiP-MS experiments were considered for analysis. Significant LiP peptides were defined as any peptide that passed the relative abundance (absolute fold-change >1.5), statistical significance (q<0.01), and proteolytic peptide pattern (i.e. increased fully tryptic or decreased half tryptic) filters at any concentration in both LiP-MS experiments. For the metalloproteins PfA-M17, PfAPP, and PfADA (PDB: 7RIE, 5JR6, and 6II7, respectively) the active site metal ions were used as a reference point for minimum distance measurements. For PfMIF (PDB: 4P7S), the bound ligand 20K and TRXR1 (PDB: 2ZZC), the bound ligands FAD and NADP, were used for minimum distance measurements. For RAB39A, which is not a metalloprotein and where no ligand-bound structure is available, the GTP binding site residues (blue) were used (AlphaFold: AF-Q14964-F1). Significant LiP-MS peptides are in pink, metal ions are in light blue, and ligands are in dark blue or orange (NADP only). Peptide mapping for multimeric proteins was performed for one chain only (chain A for PfA-M17, PfAPP and TRXR1, and chain B for PfMIF). The putative PfApiAP2 transcription factor, PF3D7_1239200, was excluded as no protein structure is available and the AlphaFold predicted structure is of very low quality (pLDDT score 36.67). No peptides met the significance criteria for PfA-M18 and the conserved parasite proteins, PF3D7_1026000 and PF3D7_0604300. *p<0.05, Mann-Whitney test. For RAB39A and TRXR1, where only one significant LiP-MS peptide was identified per protein, statistical significance was not determined.
Figure 6 with 1 supplement
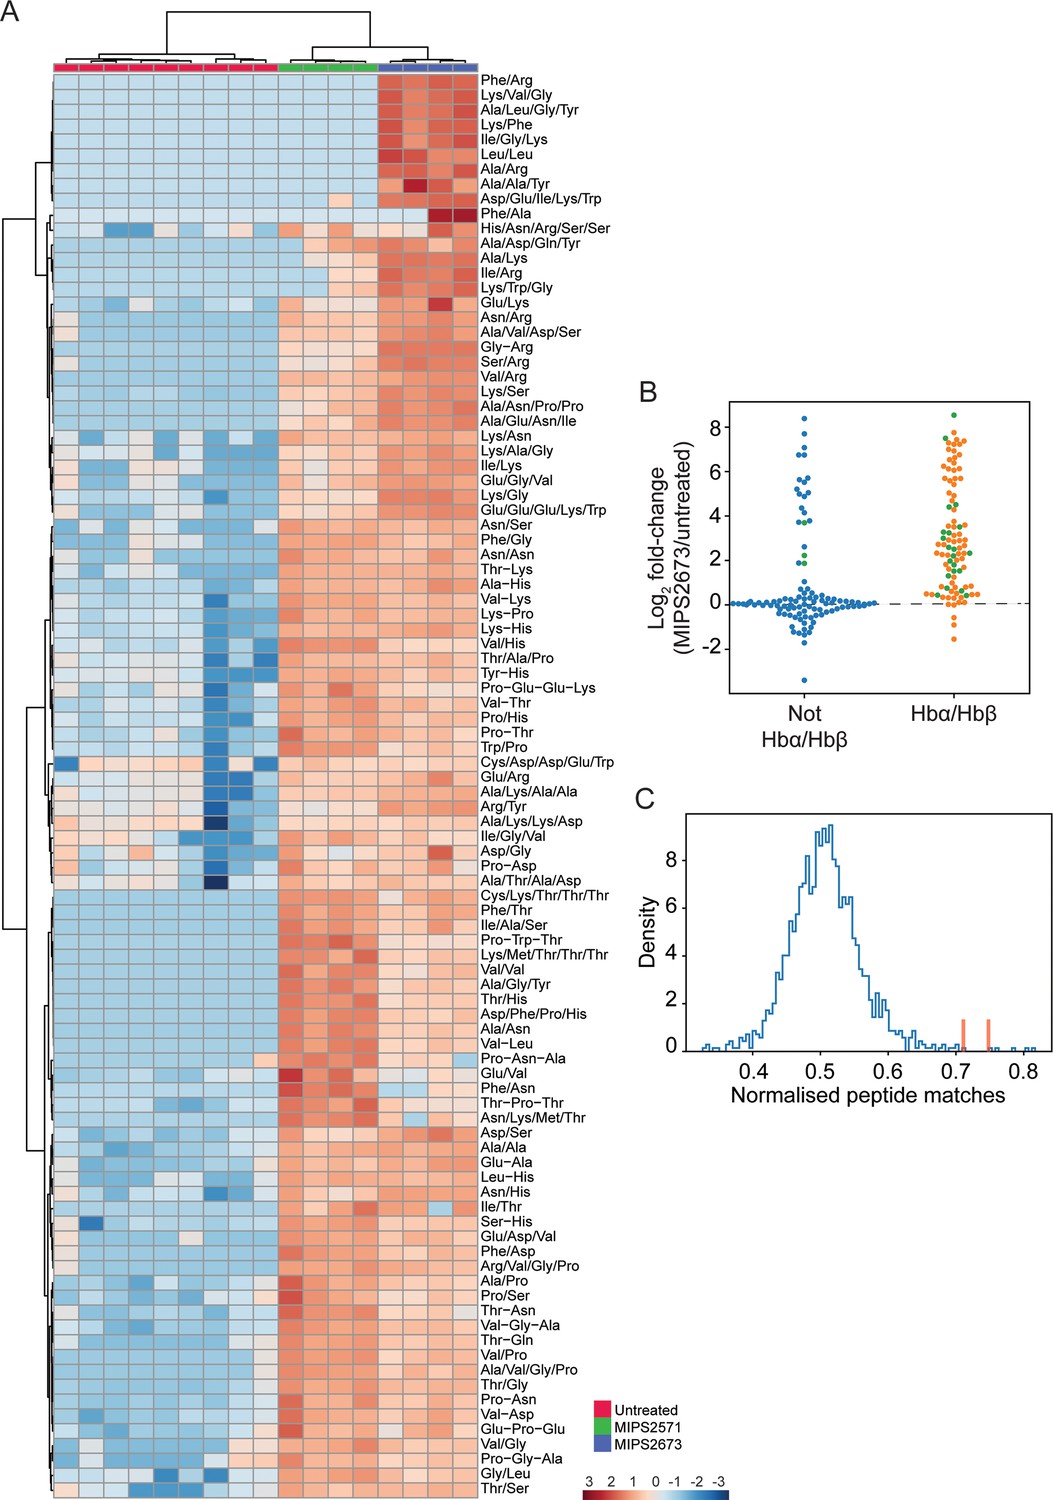
Targeted analysis of significantly dysregulated peptides (p<0.05) following treatment with 1 µM of MIPS2673 (PfA-M1 inhibitor) for 1 hr compared to MIPS2571 (PfA-M17 inhibitor) and DMSO control.
(A) Hierarchical clustering of the 97 peptides significantly dysregulated after treatment with MIPS2673 (fold-change >1.5 and p<0.05); four biological replicates for MIPS2673 and MIPS2571 (data from Edgar et al., 2022) and nine biological replicates for DMSO control. Vertical clustering displays similarities between samples, while horizontal clusters reveal the relative abundances (median normalised) of the 97 peptides. The color scale bar represents log2 (mean-centred and divided by the standard deviation of each variable) intensity values. Peptides with hyphen (-) notation indicate confirmed sequence by MS/MS. Peptides with slash (/) notation indicate putative amino acid composition (accurate mass), without confirmed sequence order. (B) Differential enrichment of all (201) putatively identified peptides that could (orange dots) or could not (blue dots) be derived from haemoglobin (Hb) α and β. Green dots are peptides that have MS/MS spectra and their sequences have been confirmed. (C) Histogram of the sequence similarity of ~4700 proteins present in P. falciparum infected red blood cells to the peptides significantly dysregulated by treatment with MIPS2673. Here, sequence similarity is quantified as the number of times a significantly perturbed peptide matches a given protein, normalised by protein length. The Hb chains α and β are highlighted in red bars.
Figure 6—figure supplement 1
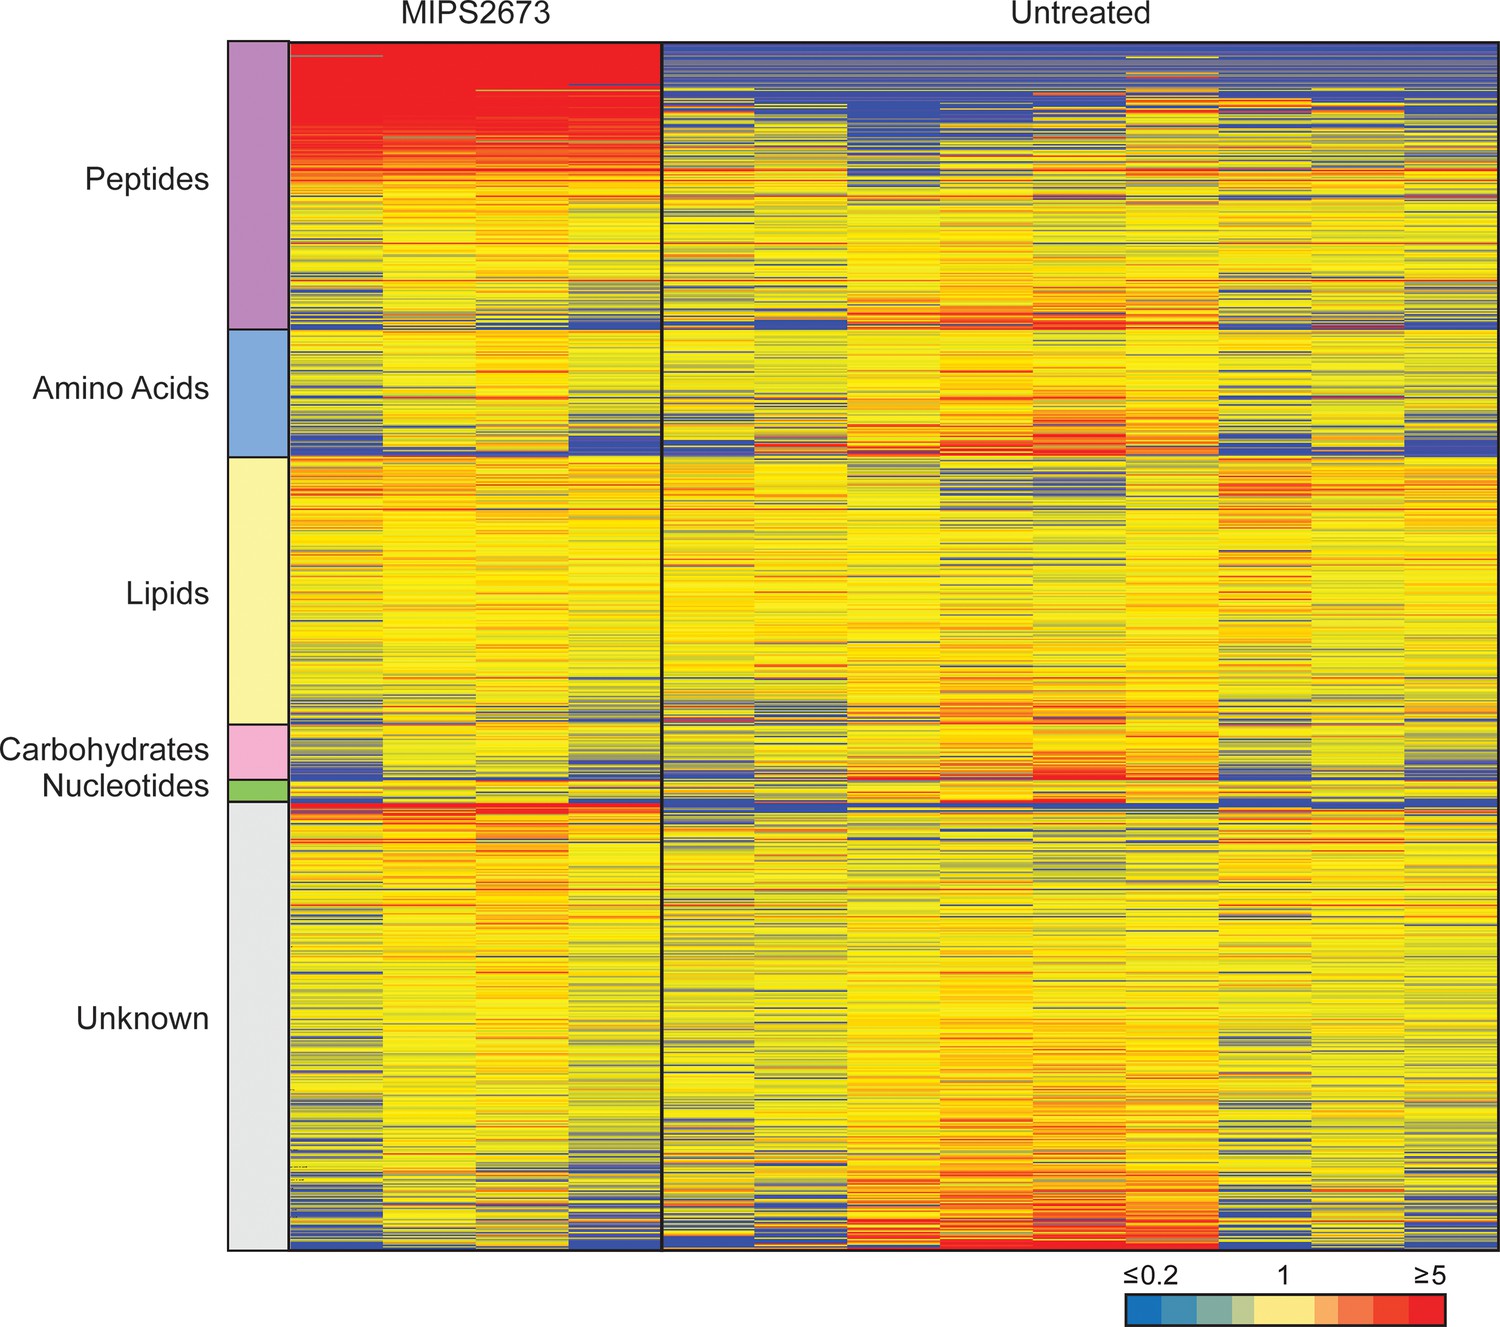
Untargeted metabolomics analysis of 3D7 parasites treated with 1 µM of MIPS2673.
Heatmap analysis of peak intensities of all putative metabolites for each condition; 1 µM of MIPS2673 for 1 hr and DMSO control (untreated). Data is shown from four to nine biological replicates; red, blue, and yellow indicate increase, decrease, and no change, respectively, in the relative abundance of putative metabolites identified.
Tables
Table 1
Percent inhibition by MIPS2673 of PfA-M1 and PvA-M1 aminopeptidase activities compared to selected human M1 homologues.
| Concentration (µM) | % inhibition* | ||||
|---|---|---|---|---|---|
| PfA-M1 | PvA-M1 | LTA4H | ERAP1 | ERAP2 | |
| 1.25 | 100 | 100 | 0 | 0 | 31 |
| 10 | 100 | 100 | 58 | 2.3 | 0 |
| 500 | – | – | 42.2 | 89.8 | 97.8 |
| 1000 | – | – | 53.4 | 95.6 | 98.7 |
-
*
Values represent the mean of three independent experiments. All assays were performed at pH 8.0. The concentration of substrate H-Leu-NHMec (H-Leu-NHMec, L-leucine-7-amido-4-methylcoumarin hydrochloride) varied depending on the enzyme assayed 20 µM for PfA-M1, 40 µM for PvA-M1, and 100 µM for ERAP1 and ERAP2. LTA4H was assessed using the substrate H-Ala-NHMec (L-alanine-7-amido-4-methylcoumarin hydrochloride) at a concentration of 20 µM. LTA4H, leukotriene A-4 hydrolase. ERAP1, endoplasmic reticulum aminopeptidase 1. ERAP2, endoplasmic reticulum aminopeptidase 2.
Table 2
Table 3
MIPS2673 effectiveness against a panel of drug-resistant P. falciparum strains*.
| P. falciparum strain | Sensitivity profile | EC50 (nM)† | Fold shift in EC50 relative to | |
|---|---|---|---|---|
| NF54 | Dd2 | |||
| NF54 | Sensitive | 237 | 1.0 | |
| K1 | Decreased sensitivity to chloroquine | 278 | 1.2 | |
| 7G8 | Decreased sensitivity to chloroquine | 293 | 1.2 | |
| TM90C2B | Decreased sensitivity to atovaquone | 194 | 0.8 | |
| Cam3.1 | Decreased sensitivity to artemisinin | 244 | 1.0 | |
| Dd2 | Decreased sensitivity to chloroquine | 220 | 0.9 | 1.0 |
| Dd2 DDD107498 | Decreased sensitivity to eEF2 inhibitor, DDD107498 | 211 | 1.0 | |
| Dd2 MMV390048 | Decreased sensitivity to PI4K inhibitor, MMV390048 | 164 | 0.7 | |
| Dd2 DSM265 | Decreased sensitivity to DHODH inhibitor, DSM265 | 183 | 0.8 | |
| Dd2 GNF156 | Decreased sensitivity to GNF156 | 195 | 0.9 | |
| Dd2 ELQ300 | Decreased sensitivity to cyt bc1 inhibitor, ELQ300 | 174 | 0.8 | |
-
*
72 hr [3H]-hypoxanthine incorporation assay.
-
†
Mean values from two biological replicates.
Table 4
MIPS2673 effectiveness against P. falciparum early (I-III), late (IV-V), and mature (V) gametocyte stages of NF54-pfs16-GFP parasites.
Additional files
Download links
A two-part list of links to download the article, or parts of the article, in various formats.
Downloads (link to download the article as PDF)
Open citations (links to open the citations from this article in various online reference manager services)
Cite this article (links to download the citations from this article in formats compatible with various reference manager tools)
Chemoproteomics validates selective targeting of Plasmodium M1 alanyl aminopeptidase as an antimalarial strategy
eLife 13:RP92990.
https://doi.org/10.7554/eLife.92990.3


