Peptidoglycan-Chi3l1 interaction shapes gut microbiota in intestinal mucus layer
Figures
Figure 1 with 1 supplement
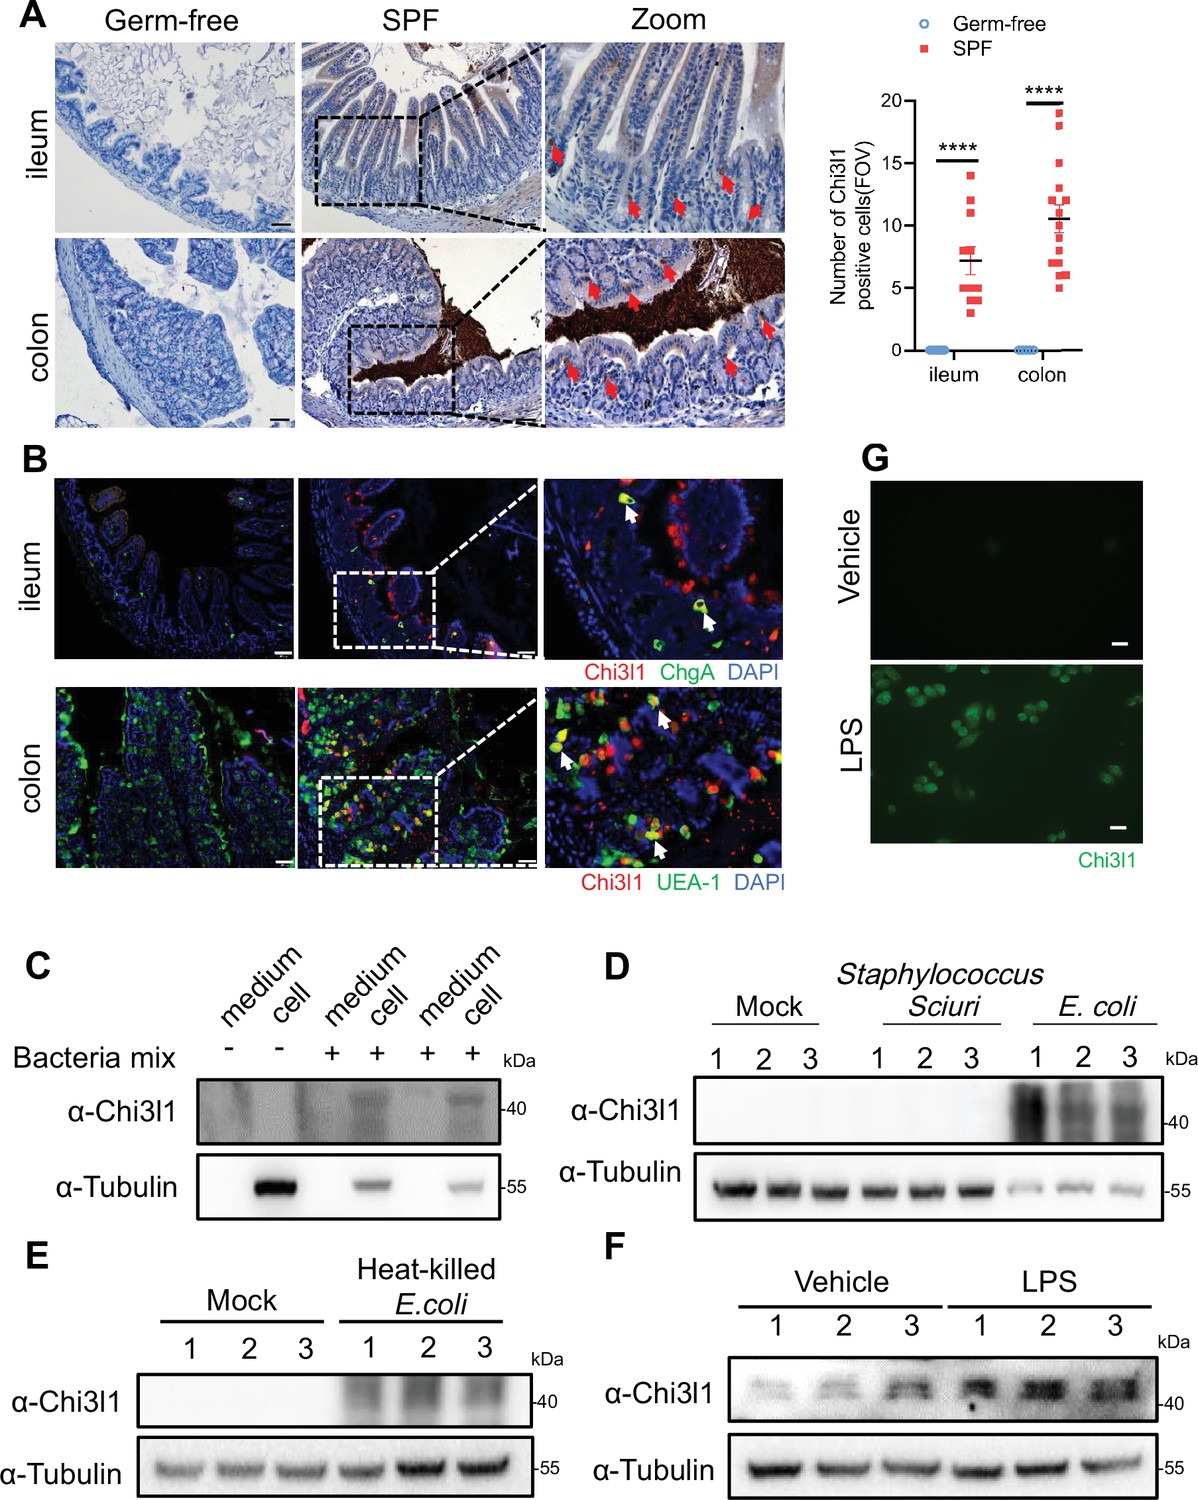
Intestinal epithelial cells express Chi3l1 induced by gut microbiota.
(A) Immunohistochemical (IHC) staining to detect Chi3l1 in both ileum and colon from germ-free and wildtype mice. Ctrl (wildtype mice without application of first antibody), WT (wildtype C57B/6J mice). Red arrows indicate Chi3l1-expressing cells. Scale bars, 50 μm (Ctrl, Germ-free, WT). The number of Chi3l1-positive cells in each field of view (FOV) was analyzed. (B) Ileum and colon were collected from wildtype mice and stained with ChgA (green), Chi3l1(red), and nuclear DAPI (blue) in ileum and UEA-1 (green), Chi3l1 (red), and nuclear DAPI (blue) in colon. Scale bars, 50 μm. Ctrl (without application of first antibody), WT (wildtype C57BL/6J mice). (C) Western blot to detect Chi3l1 protein expression in DLD-1 cells after bacteria mix infection for 12 hr. Bacteria mix are total bacteria extracted from feces of wildtype mice. (D) Western blot to detect Chi3l1 protein expression in DLD-1 cells after Staphylococcus sciuri and E. coli infection for 12 hr. Staphylococcus sciuri and E. coli are isolated from bacteria mix and verified by 16S rRNA sequencing. Three independent experimental results are showed. (E) Western blot to detect Chi3l1 protein expression in DLD-1 cells after treatment with heat-killed E. coli for 12 hr. Three independent experimental results are showed. (F) Western blot to detect Chi3l1 protein expression in DLD-1 cells after treatment with 100 pg/mL lipopolysaccharides (LPS) for 12 hr. Three independent experimental results are showed. (G) Immunofluorescence to detect Chi3l1 protein expression in DLD-1 cells after treatment with 100 pg/mL LPS for 12 hr. Scale bars, 20 μm. The presence of cells in the untreated sample is annotated using white dashed lines based on the overexposure. All data above represent at least three independent experiments. Representative images are shown in (A, B), n = 3 mice/group. *p<0.05, **p<0.01, ***p<0.001, ****p<0.0001, ns: no significant difference, error bar indicates SEM.
-
Figure 1—source data 1
File containing original western blots for Figure 1C–F, indicating the relevant bands.
- https://cdn.elifesciences.org/articles/92994/elife-92994-fig1-data1-v1.zip
-
Figure 1—source data 2
Original files for western blot analysis displayed in Figure 1C–F.
- https://cdn.elifesciences.org/articles/92994/elife-92994-fig1-data2-v1.zip
-
Figure 1—source data 3
Numerical data of Figure 1A.
- https://cdn.elifesciences.org/articles/92994/elife-92994-fig1-data3-v1.xlsx
Figure 1—figure supplement 1
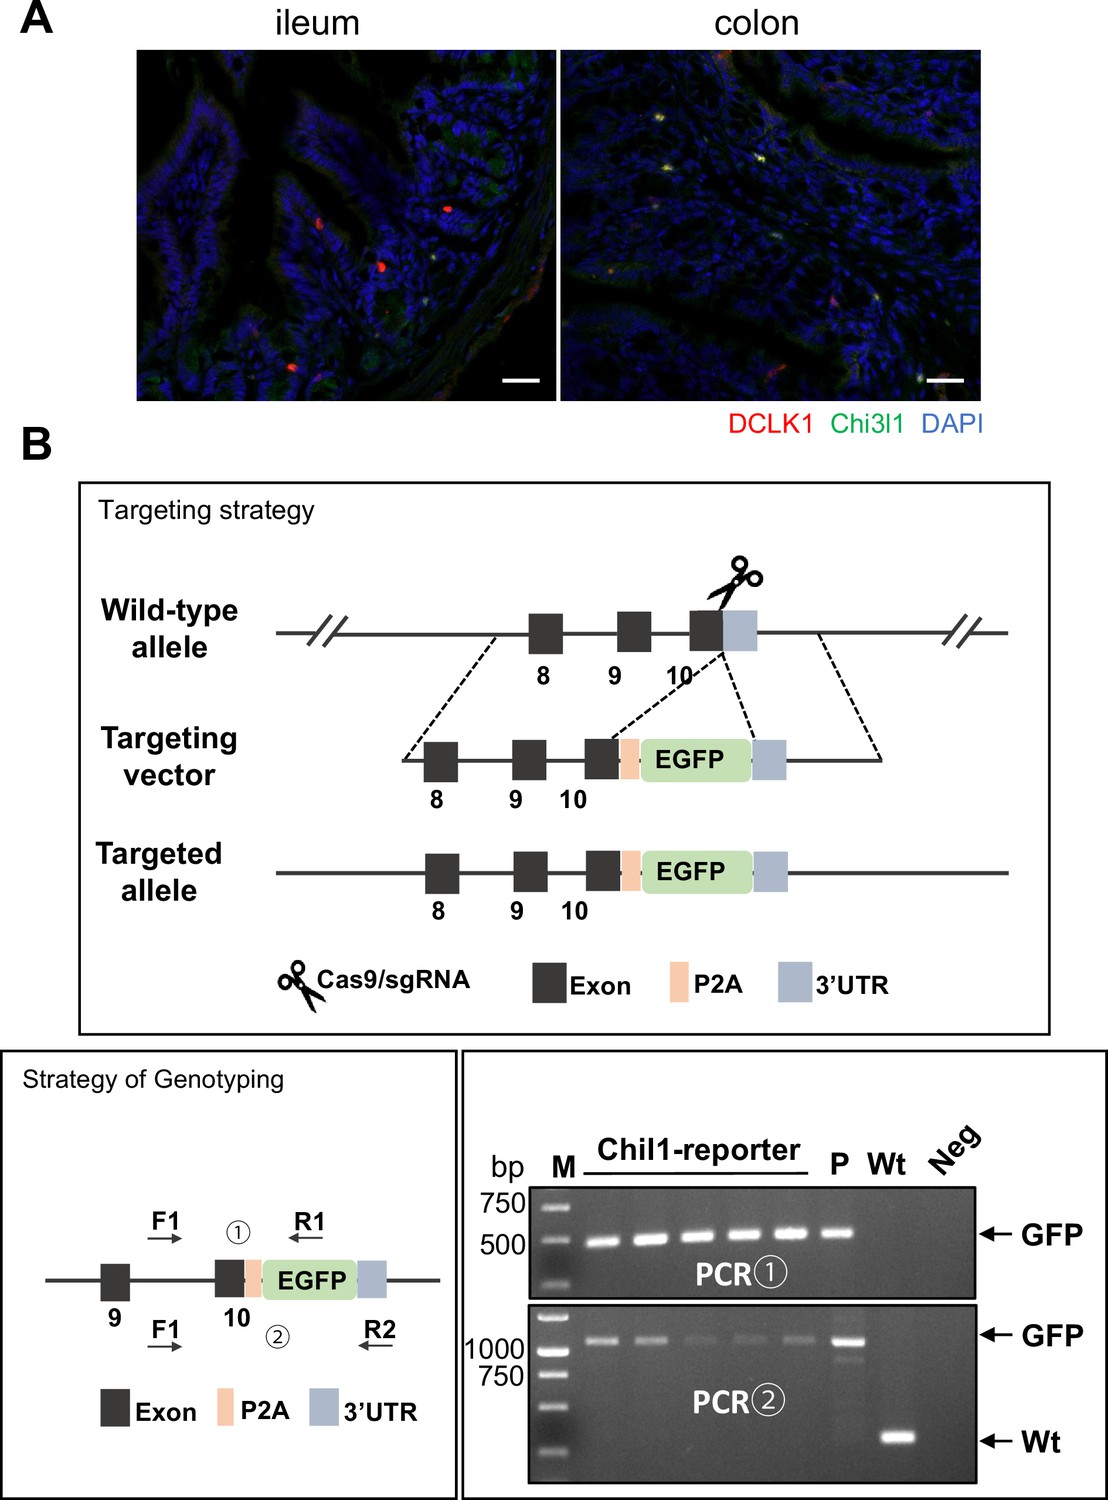
Chi3l1 do not express in tuft cells.
(A) Ileum and colon were collected from Chil1-EGFP reporter mice and stained with DCLK1 (red), Chi3l1 (green), and nuclear DAPI (blue). Scale bars, 20 μm. Representative images are shown, n = 3 mice/group. (B) The construction, genotyping strategy, and genotyping results of Chil1-EGFP reporter mice. P: positive control; Wt: wildtype control; Neg: Blank control (ddH2O); M: DNA Ladder.
-
Figure 1—figure supplement 1—source data 1
File containing original DNA gels for Figure 1—figure supplement 1B, indicating the relevant bands.
- https://cdn.elifesciences.org/articles/92994/elife-92994-fig1-figsupp1-data1-v1.zip
-
Figure 1—figure supplement 1—source data 2
Original files for DNA gels for Figure 1—figure supplement 1B.
- https://cdn.elifesciences.org/articles/92994/elife-92994-fig1-figsupp1-data2-v1.zip
Figure 2
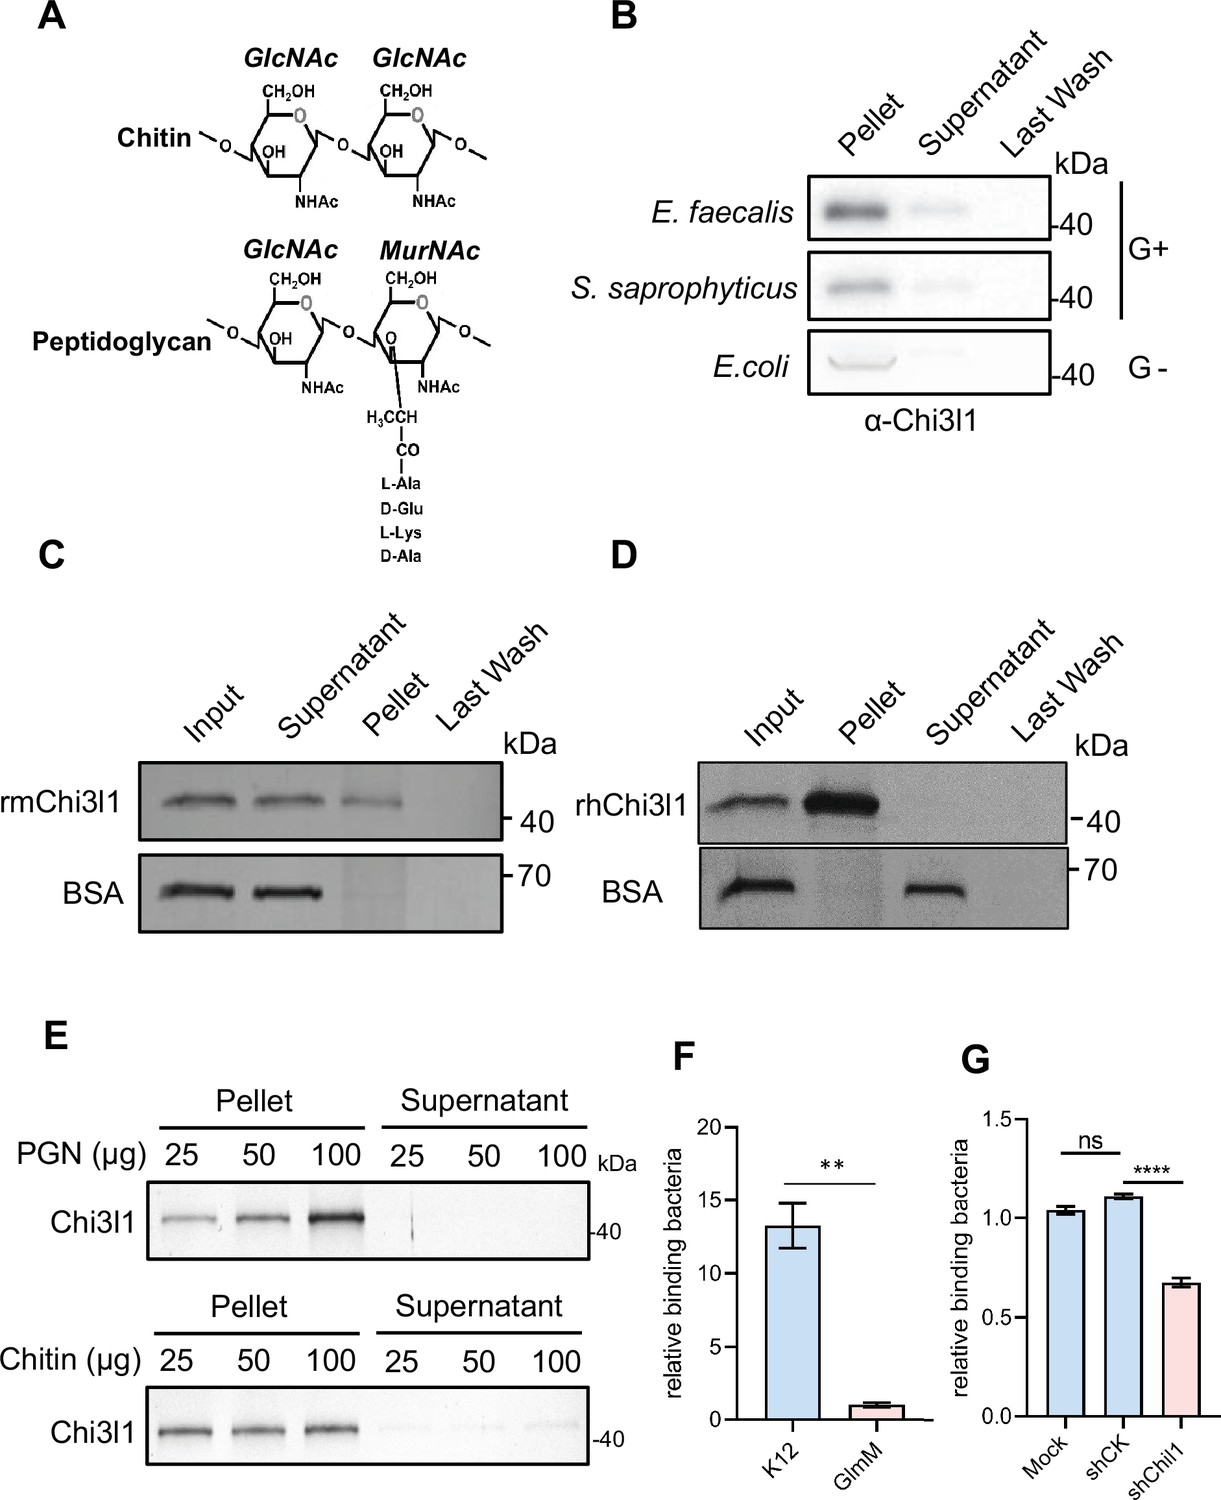
Chi3l1 interact with bacteria via peptidoglycan (PGN).
(A) Structural comparison between chitin and PGN. Both chitin and PGN contain N-acetylglucosamine (GlcNAc) and have β–1,4-glycosidic bonds in their structures. However, chitin is purely a polysaccharide, while PGN includes a peptide component that forms cross-links between chains (Zhou et al., 2022). (B) Gram-positive bacteria (E. faecalis, S. saprophyticus) and Gram-negative bacteria (E. coli) were incubated with 1 μg of recombinant mouse Chi3l1 protein (rmChi3l1), respectively. Proteins bound to indicated bacteria were precipitated by centrifugation. Western blot was used to detect rmChi3l1 in Pellet, Supernatant (unbound proteins) and Last Wash (last wash unbound proteins). (C) Insoluble PGN were incubated with either recombinant mouse Chi3l1 protein (rmChi3l1) or bovine serum albumin (BSA). Proteins bound to PGN were precipitated by centrifugation. Silver staining was used to detect rmChi3l1 in Input, Supernatant (unbound proteins), Pellet and Last Wash (last wash unbound proteins). (D) Insoluble PGN were incubated with recombinant human Chi3l1 protein (rhChi3l1). Proteins bound to PGN were precipitated by centrifugation. Silver staining was used to detect rhChi3l1 in Input, Supernatant (unbound proteins), Pellet and Last Wash (last wash unbound proteins). All data above represent at least three independent experiments. (E) Insoluble PGN or chitin was incubated with rmChi3l1. Chi3l1 bound to PGN (upper panel) and chitin (lower panel) was precipitated and detected by silver staining. The supernatant represents the last wash, and the pellet contains proteins precipitated by either PGN or chitin. (F) Relative DLD-1 bacterial binding preference after treatment with K12 or GlmM, a PGN synthesis-deficient mutant. Colony-forming units (CFU) were counted, and GlmM CFU were normalized to 1. (G) Relative K12 bacterial adhesion preference after DLD-1 cells were transfected without (Mock), or with scramble shRNA (shCK), or with shChil1. CFU were counted, and the Mock group were normalized to 1. *p<0.05, **p<0.01, ***p<0.001, ****p<0.0001, ns: no significant difference, error bar indicates SEM.
-
Figure 2—source data 1
File containing original western blots for Figure 2B and silver staining for Figure 2C–E, indicating the relevant bands.
- https://cdn.elifesciences.org/articles/92994/elife-92994-fig2-data1-v1.zip
-
Figure 2—source data 2
Original files for western blot analysis displayed in Figure 2B and silver staining for Figure 2C–E.
- https://cdn.elifesciences.org/articles/92994/elife-92994-fig2-data2-v1.zip
-
Figure 2—source data 3
Numerical data of Figure 2F and G.
- https://cdn.elifesciences.org/articles/92994/elife-92994-fig2-data3-v1.xlsx
Figure 3 with 2 supplements
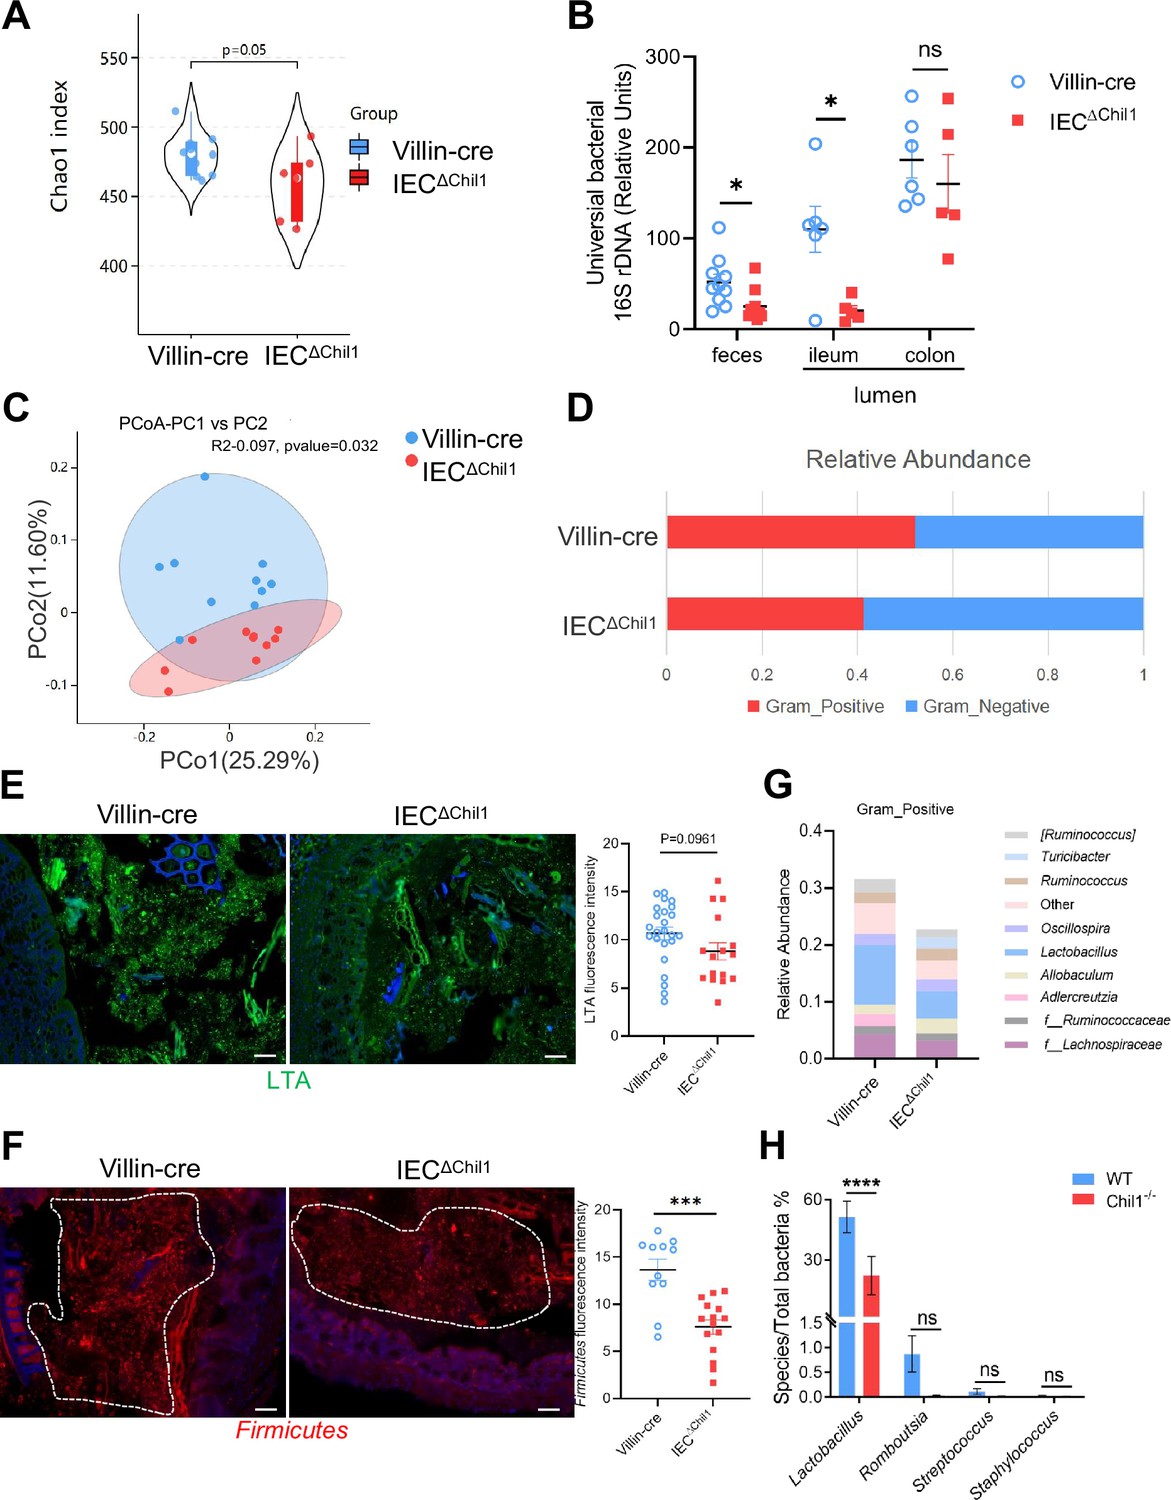
Intestinal bacteria are disordered in IEC∆Chil1 mice, especially Gram-positive bacteria.
(A, C, D, G) Female Villin-cre and IEC∆Chil1 littermates continue to cage together after weaning for 8 weeks. Microbial communities in feces and intestinal lumen were characterized by 16S rRNA sequencing. n = 7 or 10/group. (A) Alpha diversity analysis of colon contents between Villin-cre and IEC∆Chil1 littermates. (B) qPCR analysis of total bacteria in the feces and ileum, colon luminal microbial communities of Villin-cre and IEC∆Chil1 littermates. Values for each bacterial group are expressed relative to total 16S rRNA levels. n = 5–10/group. (C) Principal component analysis of weighed UniFrac distances of 16S community profiles of Villin-cre and IEC∆Chil1 littermates feces (binary-jaccard). (D) Relative abundance of Gram-positive and Gram-negative bacteria in colon contents of Villin-cre and IEC∆Chil1 littermates are shown. (E) Lipoteichoic acid (LTA) (green) was detected by immunofluorescence in colon sections of Villin-cre and IEC∆Chil1 littermates. Nuclei were detected with DAPI. Scale bars, 50 μm. The average fluorescence intensity in each field of view (FOV) was analyzed. (F) Fluorescence in situ hybridization (FISH) detection of Gram-positive bacteria (red) in the colon of Villin-cre and IEC∆Chil1 littermates, nuclei were detected with DAPI (blue). Scale bars, 50 μm. The average fluorescence intensity in each FOV was analyzed. (G) Relative abundance of Gram-positive bacteria genera in colon lumen of Villin-cre and IEC∆Chil1 littermates. (H) Female wildtype and Chil1-/- littermates continue to cage together after weaning for 8 weeks. Microbial communities in feces were characterized by 16S rRNA sequencing. n = 3 mice/group. Representative images are shown in (E, F), n = 4–5/3-6 mice/group. *p<0.05, **p<0.01, ***p<0.001, ****p<0.0001, ns: no significant difference, error bar indicates SEM.
-
Figure 3—source data 1
Numerical data of Figure 3A–H.
- https://cdn.elifesciences.org/articles/92994/elife-92994-fig3-data1-v1.xlsx
Figure 3—figure supplement 1
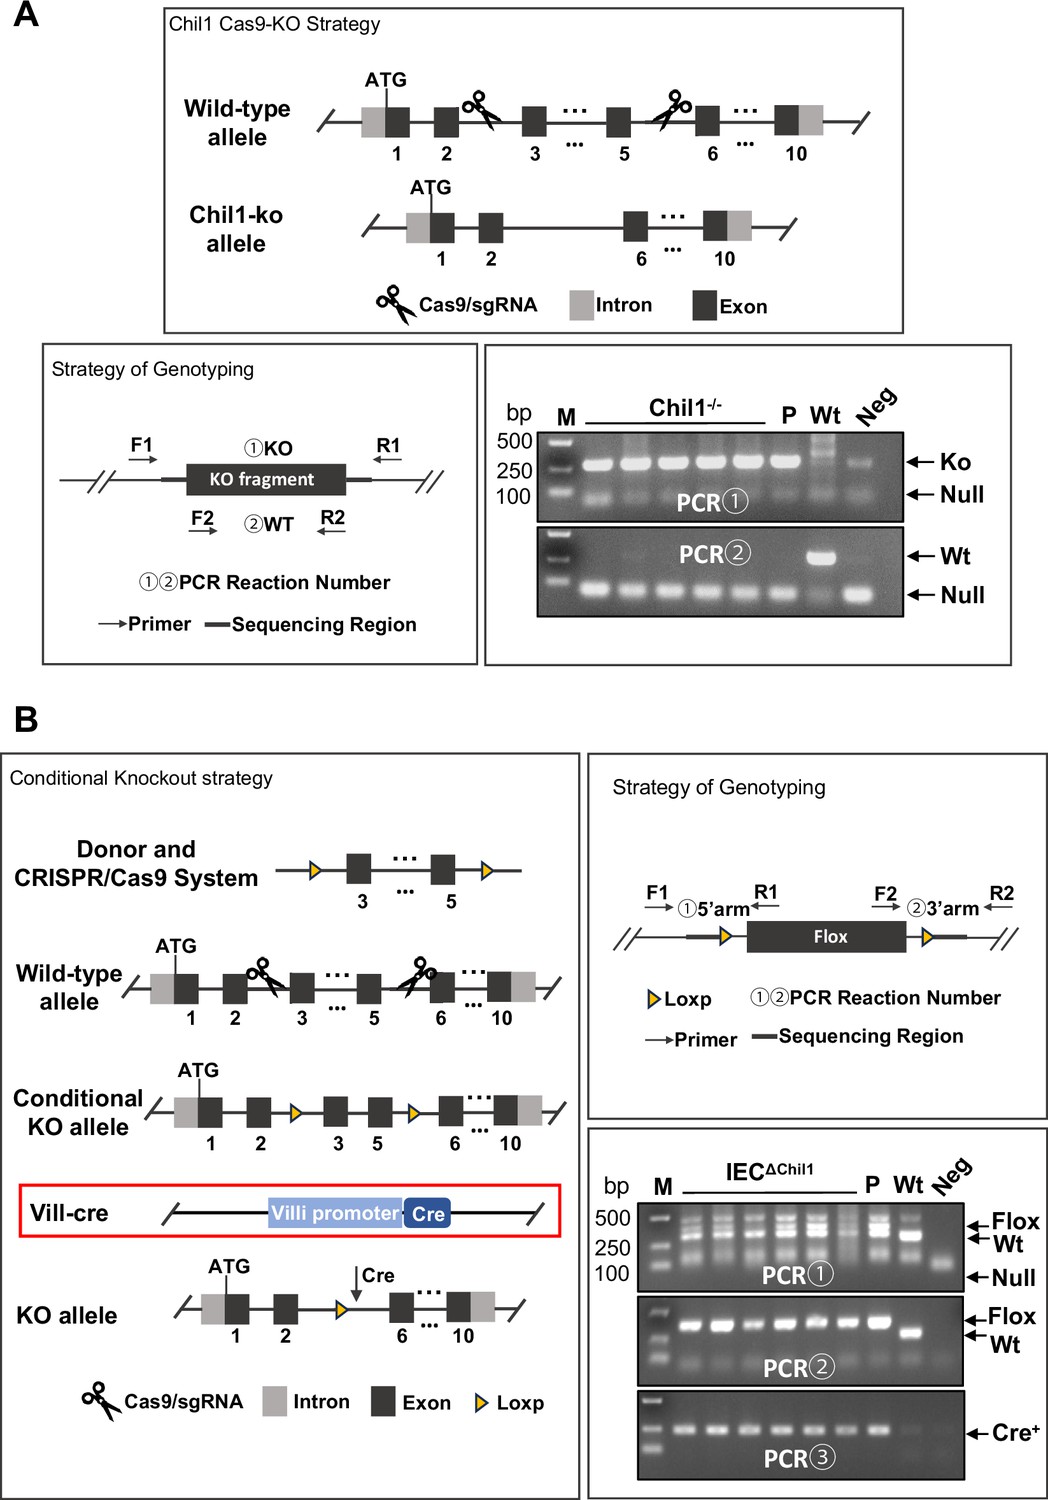
The construction and genotype of Chi3l1-/- and IEC∆Chil1 mice.
(A) The construction, genotyping strategy and genotyping results of Chil1-/- mice. P: positive control; Wt: wildtype control; Neg: Blank control(ddH2O); M: DNA Ladder. (B) The construction, genotyping strategy and genotyping results of IEC∆Chil1 mice. P: positive control; Wt: wildtype control; Neg: Blank control (ddH2O); M: DNA Ladder. PCR① and ② implicated flox, ③implicated cre.
-
Figure 3—figure supplement 1—source data 1
File containing original DNA gels for Figure 3—figure supplement 1, indicating the relevant bands.
- https://cdn.elifesciences.org/articles/92994/elife-92994-fig3-figsupp1-data1-v1.zip
-
Figure 3—figure supplement 1—source data 2
Original files for DNA gels for Figure 3—figure supplement 1.
- https://cdn.elifesciences.org/articles/92994/elife-92994-fig3-figsupp1-data2-v1.zip
Figure 3—figure supplement 2

IECΔChil1 mice have more abundance of Turicibacter.
(A) qPCR analysis of Turicibacter in the feces of Villin-cre and IEC∆Chil1 is shown. Values for each bacterial group are expressed relative to total 16S rRNA levels. p-Vaule is indicated, error bar indicates SEM.
-
Figure 3—figure supplement 2—source data 1
Numerical data of Figure 3—figure supplement 2.
- https://cdn.elifesciences.org/articles/92994/elife-92994-fig3-figsupp2-data1-v1.xlsx
Figure 4 with 1 supplement
Chi3l1 promotes the colonization of Gram-positive bacteria in intestinal mucus layer.
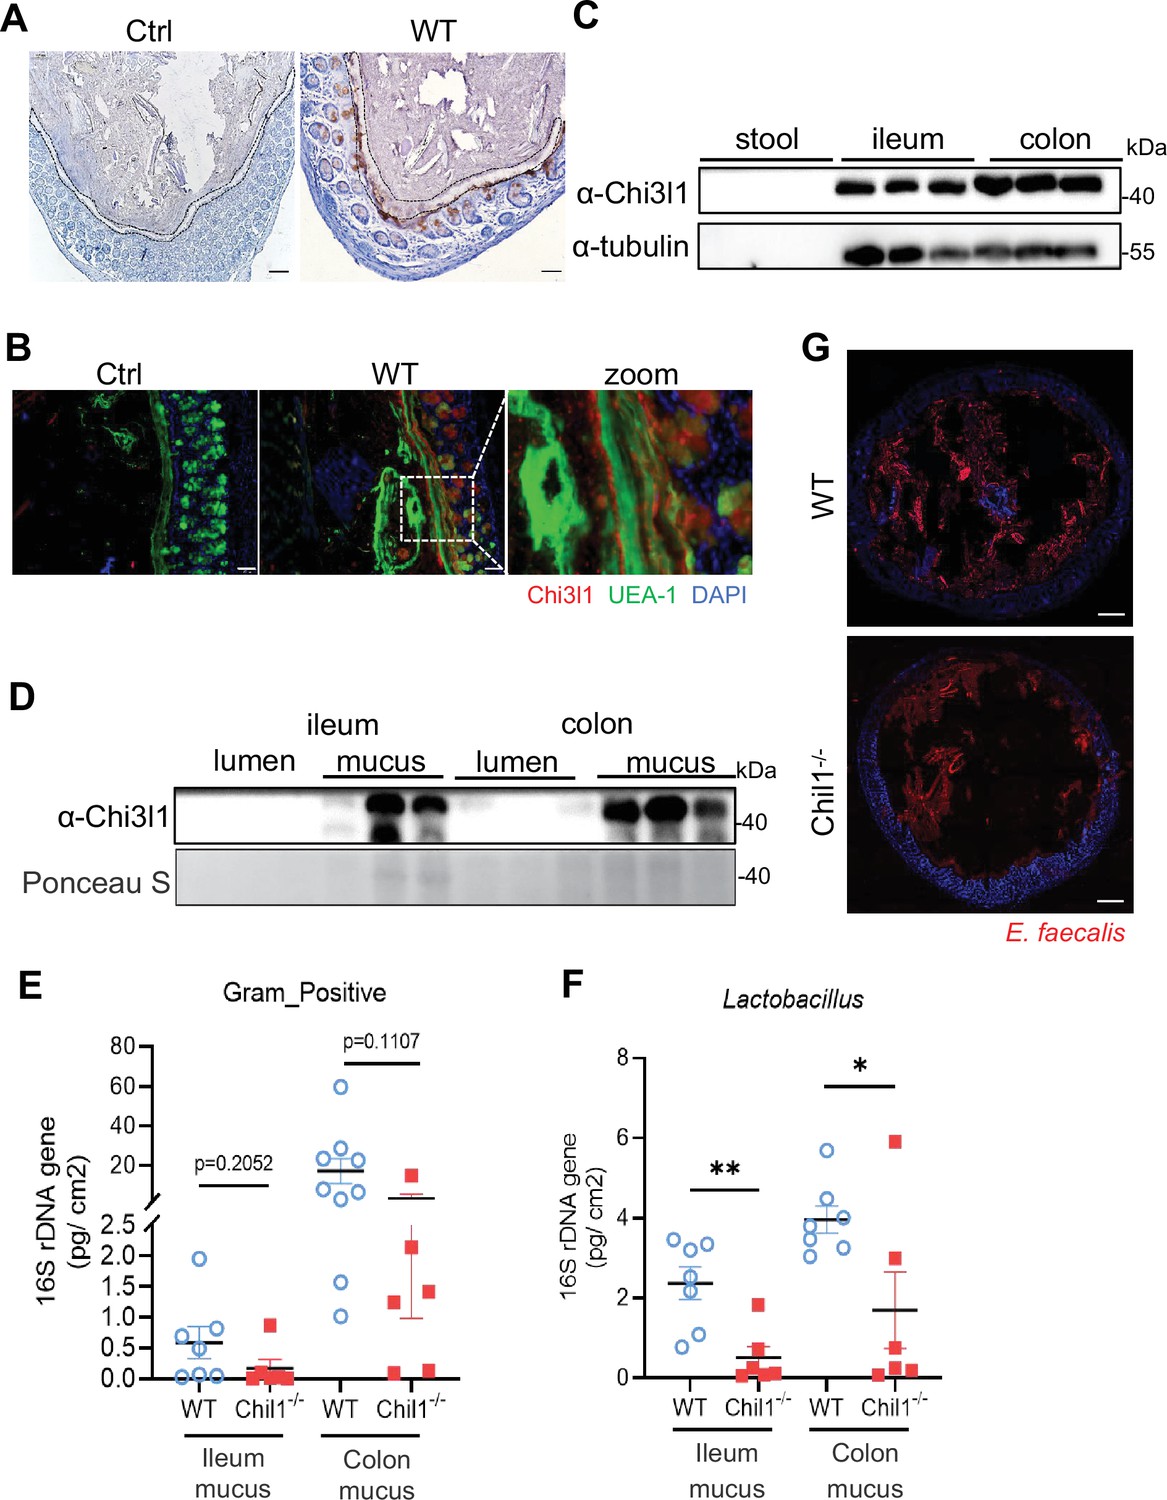
(A) Immunohistochemical (IHC) staining to detect Chi3l1 in colon mucus layer from wildtype mice. Ctrl (without application of ant-Chi3l1 antibody), WT (wildtype C57BL/6J mice). Black dotted line outlines mucus layer. Scale bars, 50 μm (Ctrl, WT). (B) Colons were collected from wildtype mice and stained with UEA-1 (green), Chi3l1 (red), and nuclear DAPI (blue). Ctrl (without application of first antibody), WT (wildtype C57BL/6J mice). Scale bars, 50 μm (Ctrl, WT). (C) Stool, ileum, and colon tissues were collected from wildtype mice. Western blot was used to detect Chi3l1 expression in these samples. n = 3 mice/sample. (D) Both luminal and mucus-associated proteins of either ileum or colon were extracted. Western blot was used to detect Chi3l1 expression in these samples. lumen (luminal proteins), and mucus (mucus-associated proteins). n = 3 mice/sample. (E, F) qPCR analysis of specific bacteria in the ileum and colon mucus microbial communities of wildtype and Chil1-/- littermates. (E) qPCR analysis of Gram-positive bacteria is shown. (F) qPCR analysis of Gram-positive bacteria is shown. Values for each bacterial group are expressed relative to total 16S rRNA levels. WT (wildtype C57BL/6J mice). n = 6–8/group. (G) Rectal injection of both wildtype and Chil1-/- mice with FDAA-labeled E. faecalis (a Gram-positive bacteria strain) for 4 hr. Colon sections were collected and colonization of E. faecalis was examined under microscope. Nuclei were stained with DAPI. Scale bars, 50 μm (WT, Chil1-/-). Representative images are shown in (A, B, G), n = 3 mice/group. *p<0.05, **p<0.01, ***p<0.001, ****p<0.0001, ns: no significant difference, error bar indicates SEM.
-
Figure 4—source data 1
File containing original western blots for Figure 4C and D, indicating the relevant bands.
- https://cdn.elifesciences.org/articles/92994/elife-92994-fig4-data1-v1.zip
-
Figure 4—source data 2
Original files for western blot analysis displayed in Figure 4C and D.
- https://cdn.elifesciences.org/articles/92994/elife-92994-fig4-data2-v1.zip
-
Figure 4—source data 3
Numerical data of Figure 4E and F.
- https://cdn.elifesciences.org/articles/92994/elife-92994-fig4-data3-v1.xlsx
Figure 4—figure supplement 1
Chil1-/- mice possess shortening mucus layer.
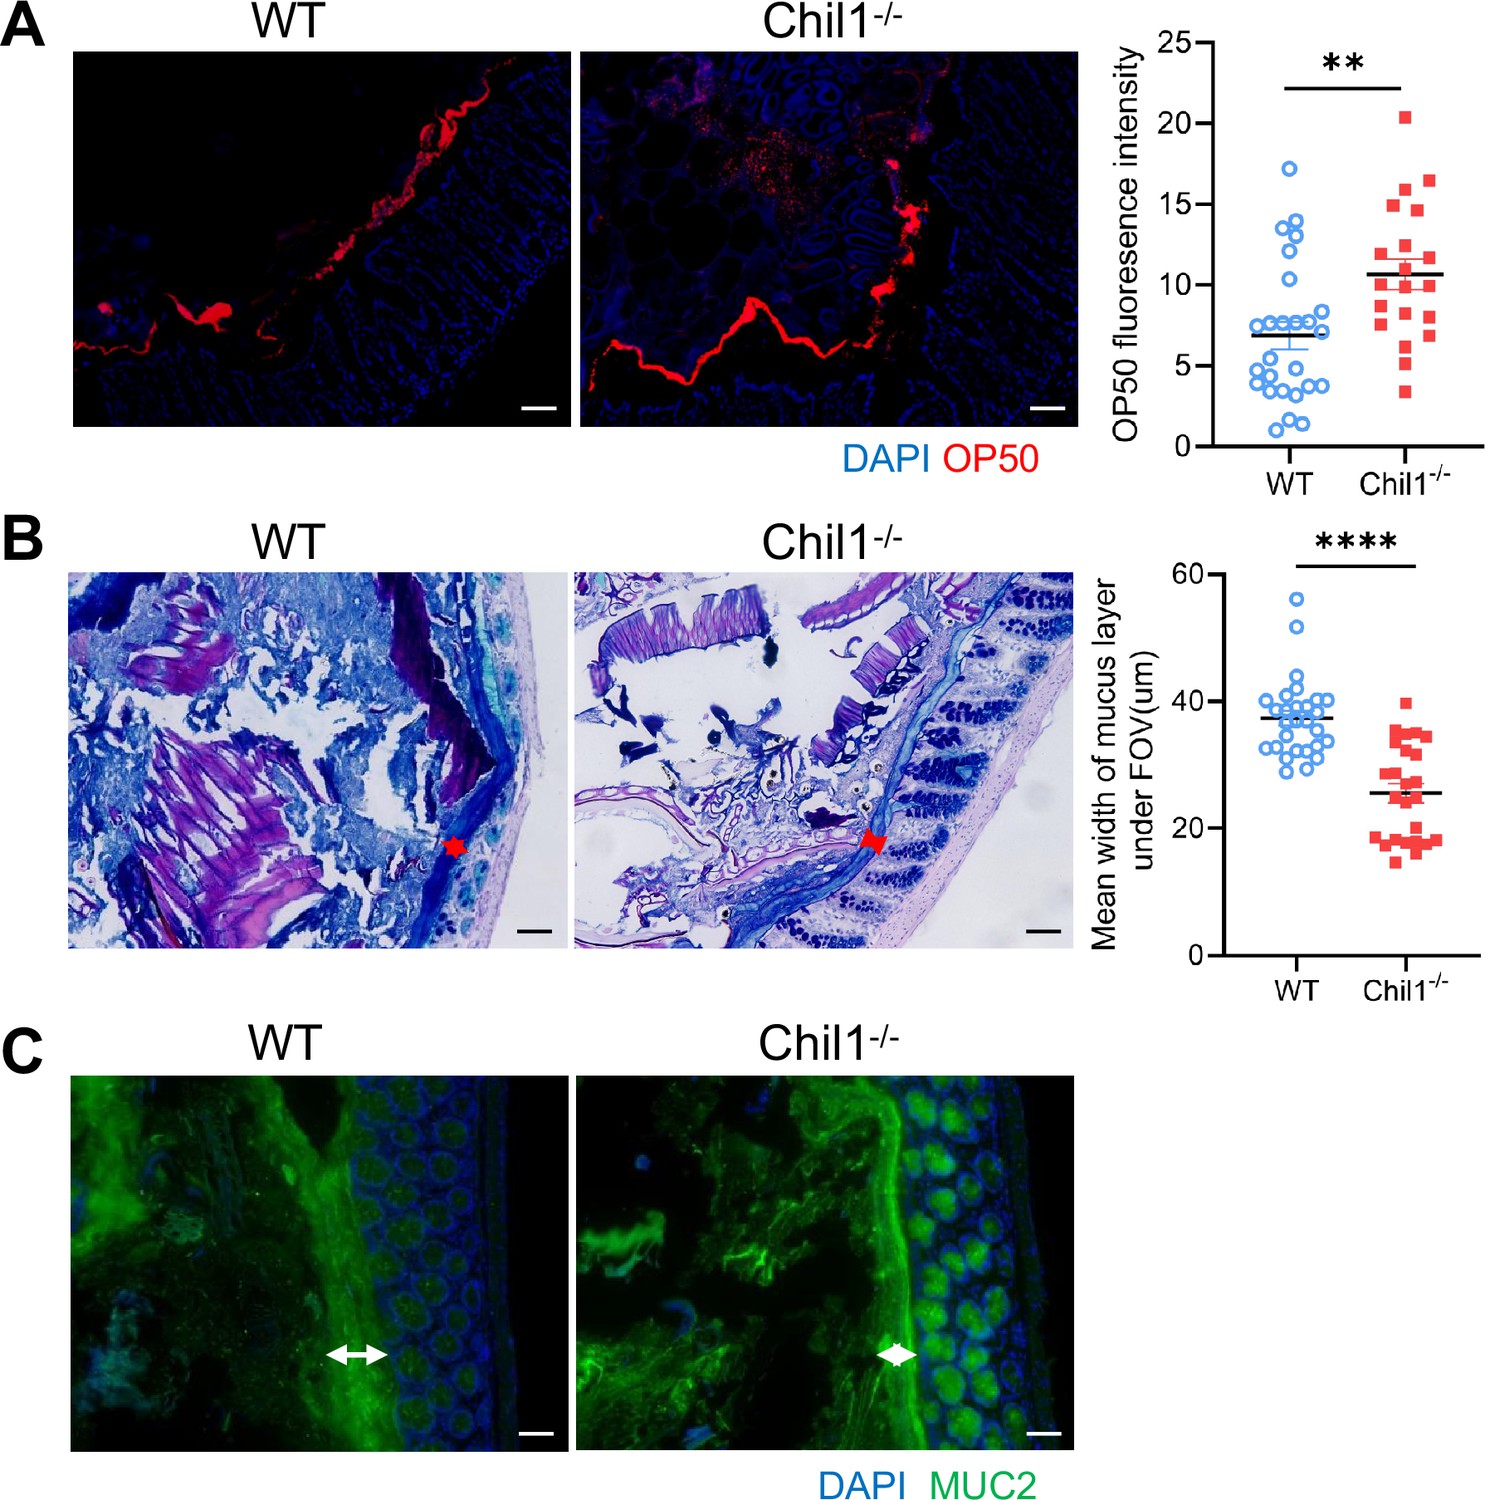
(A) Rectal injection of both wildtype and Chil1-/- mice with mCherry-OP50 (a strain of E. coli expressing mCherry) for 4 hr. Colon sections were collected and colonization of OP50 was examined under microscope. Nuclei were stained with DAPI. n = 3–4 mice/group. The average fluorescence intensity in each field of view (FOV) was analyzed. (B) Periodic acid–Schiff and Alcian blue (AB-PAS) staining in the colons of WT and Chil1-/- littermates. Scale bars, 100 μm. The mean width of mucus layer in each FOV was analyzed. (C) Immunofluorescence staining to detect Mucin 2 (green) and nuclear DAPI (blue) in colon from WT and Chil1-/- littermates. Scale bars, 50 μm. Representative images are shown in (C, D), n = 4 mice/group. *p<0.05, **p<0.01, ***p<0.001, ****p<0.0001, ns: no significant difference, error bar indicates SEM.
-
Figure 4—figure supplement 1—source data 1
Numerical data of Figure 4—figure supplement 1A and B.
- https://cdn.elifesciences.org/articles/92994/elife-92994-fig4-figsupp1-data1-v1.xlsx
Figure 5 with 1 supplement
Disordered intestinal bacteria in IEC∆Chil1 mice contribute to inflammatory bowel disease (IBD).
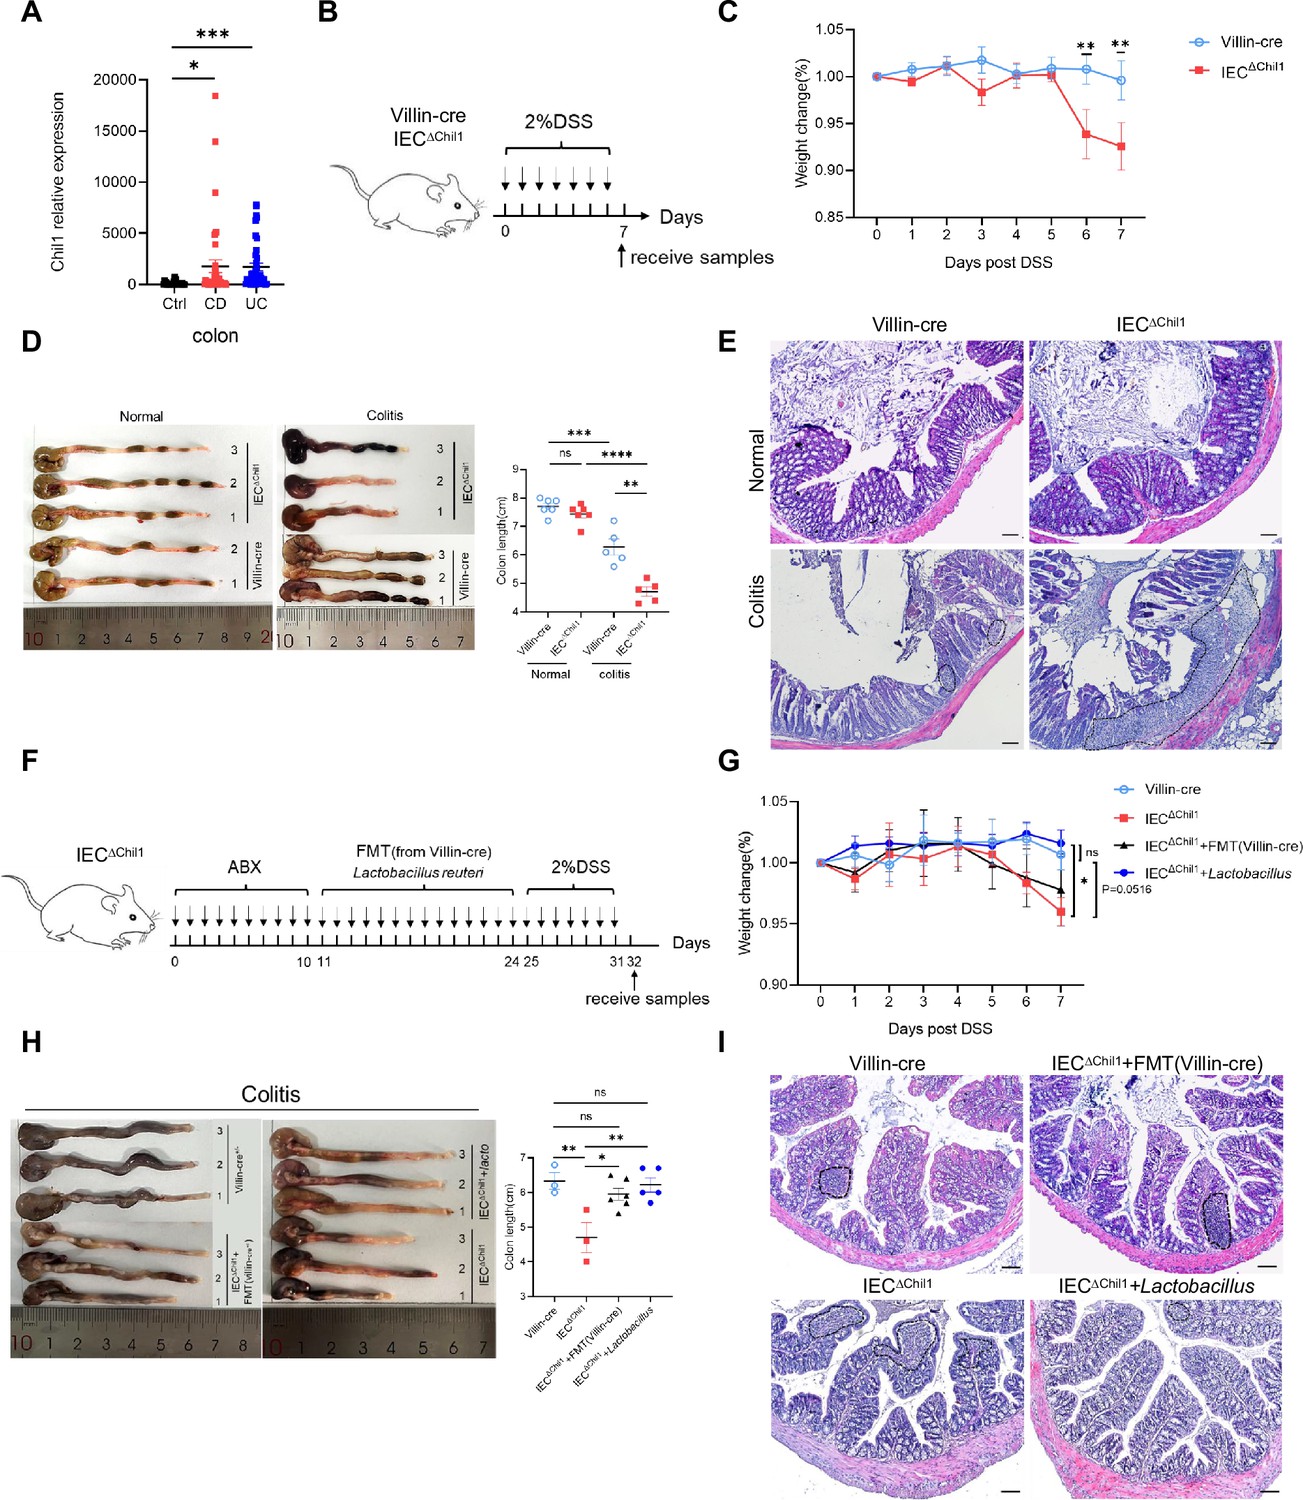
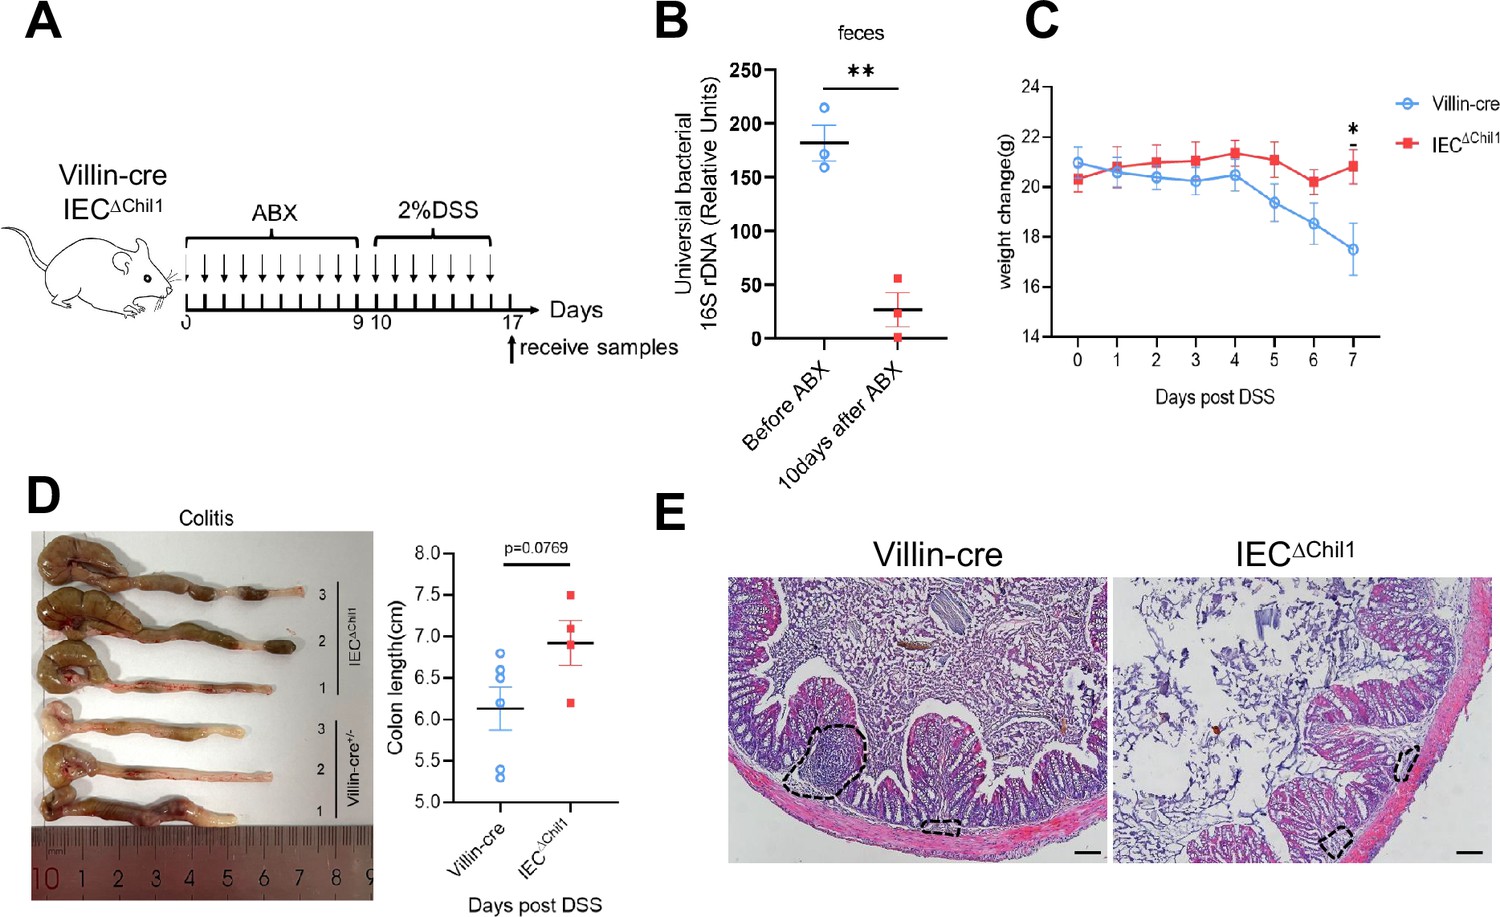
(A) Chil1 mRNA relative expression in colon tissues of patients without gut disease (controls, n = 35) or with Crohn’s disease (CD, n = 40), ulcerative colitis (UC, n = 40) (GEO datasets: SRP303290). (B) Schematic model of the experimental design. Both Villin-cre and IEC∆Chil1 littermates were fed with 2% dextran sodium sulfate (DSS) in drinking water to induce colitis. (C) Weight change of Villin-cre and IEC∆Chil1 littermates during DSS feeding. Weight change (%) = Current weight/Initial weight. (D) Representative colonic length from Normal and DSS-treated Villin-cre and IEC∆Chil1 littermates (left) and the statistics of colonic length (right). (E) H&E staining of mice colon from Normal and DSS-treated Villin-cre and IEC∆Chil1 littermates. The inflamed areas are outlined by white dotted line, scale bars = 100 μm. (F) Schematic of the experimental design. First, antibiotics were used to eliminate gut microbiota for 10 days, and then either fecal microbiota from Villin-cre mice (FMT) or Lactobacillus reuteri were transplanted back to IEC∆Chil1 mice orally every day for 2 weeks. Finally, colitis mouse model was constructed by 2% DSS feeding in drinking water for another 7 days. (G–I) Villin-cre and IEC∆Chil1 were only fed with 2% DSS in drinking water for 7 days. IEC∆Chil1 + FMT(Villin-cre), and IEC∆Chil1 + Lactobacillus were constructed as described in (F). (G) Weight change of Villin-cre, IEC∆Chil1, IEC∆Chil1 + FMT(Villin-cre), and IEC∆Chil1 + Lactobacillus mice during DSS feeding. (H) Representative colonic length from Villin-cre, IEC∆Chil1, IEC∆Chil1 + FMT(Villin-cre), and IEC∆Chil1 + Lactobacillus mice (left) and the statistics of colonic length (right). n = 3–6/group. (I) H&E staining of mice colon from Villin-cre, IEC∆Chil1, IEC∆Chil1 + FMT(Villin-cre), and IEC∆Chil1 + Lactobacillus mice after DSS treatment. The inflamed area is outlined by black dotted line, scale bars = 100 μm. Representative images are shown in (C, E, H, I), n = 3–8 mice/group. *p<0.05, **p<0.01, ***p<0.001, ****p<0.0001, ns: no significant difference, error bar indicates SEM.
-
Figure 5—source data 1
Numerical data of Figure 5A, C, D, G and H .
- https://cdn.elifesciences.org/articles/92994/elife-92994-fig5-data1-v1.xlsx
Figure 5—figure supplement 1
Chi3l1-mediated bacteria, but not Chi3l1 itself affect more upon the development of colitis.
(A) Schematic model of the experimental design. Both Villin-cre and IEC∆Chil1 littermates were fed with 2% dextran sodium sulfate (DSS) in drinking water to induce colitis after elimination of gut microbiota by antibiotics for 10 days. (B) qPCR analysis of total bacteria in the feces of Villin-cre and IEC∆Chil1 littermates. Values for each bacterial group are expressed relative to total 16S rRNA levels. n = 3/group. (C) Weight change of Villin-cre and IEC∆Chil1 mice during DSS feeding. (D) Representative colonic length from colitis Villin-cre and IEC∆Chil1 mice (left) and the statistics of colonic length (right). (E) H&E staining of colitis mice colon from Villin-cre and IEC∆Chil1. The inflamed area is outlined by black dotted lines, scale bars = 100 μm. n = 4–6 mice/group. *p<0.05, **p<0.01, ***p<0.001, ****p<0.0001, ns: no significant difference, error bar indicates SEM.
-
Figure 5—figure supplement 1—source data 1
Numerical data of Figure 5—figure supplement 1B.
- https://cdn.elifesciences.org/articles/92994/elife-92994-fig5-figsupp1-data1-v1.xlsx
Figure 6
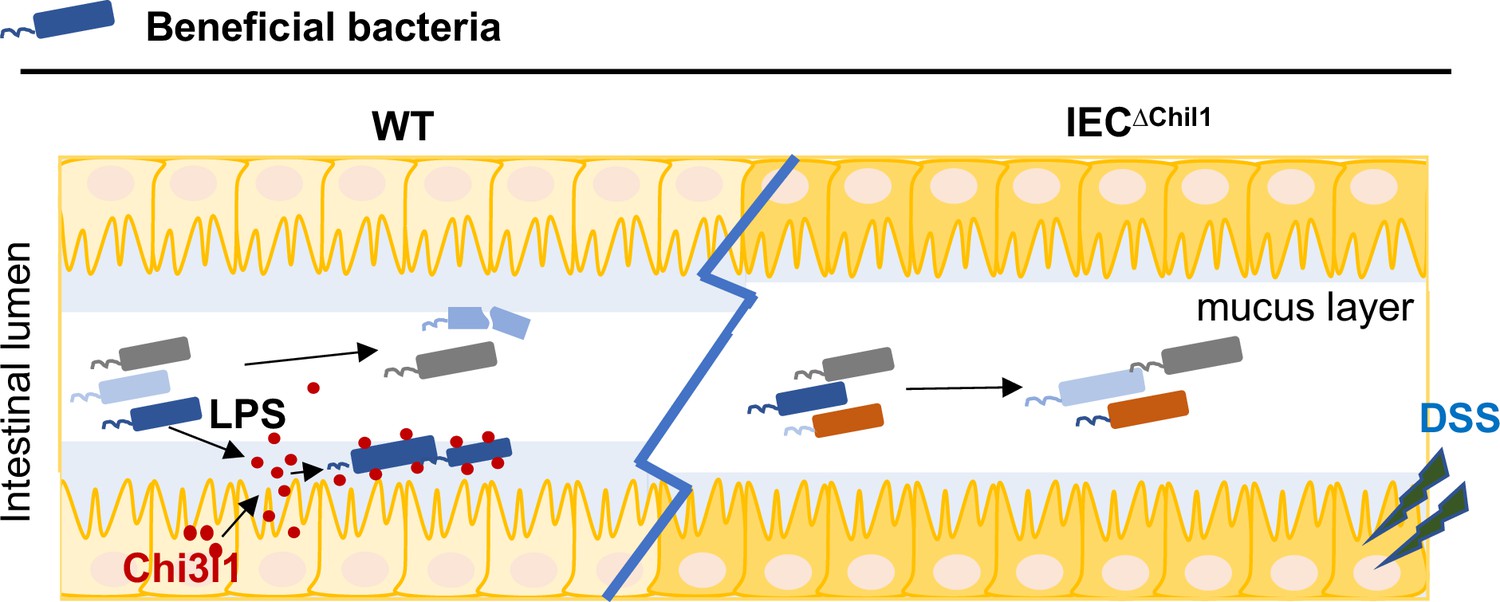
A schematic working model.
Intestinal epithelial cells are stimulated by the gut microbiota to express Chi3l1. Once expressed, Chi3l1 is secreted into the mucus layer where it interacts with the gut microbiota, specifically through a component of bacterial cell walls called peptidoglycan. This interaction between Chi3l1 and bacteria is beneficial for the colonization of bacteria in the mucus, particularly for Gram-positive bacteria like Lactobacillus. Moreover, a deficiency of Chi3l1 leads to an imbalance in the gut microbiota, which exacerbates colitis induced by dextran sodium sulfate (DSS).
Author response image 1

Chi3l1 express in the proximal and distal colon.
Immunofluoresence staining on proximal and distal colon sections to detect Chi3l1 (Red) expression. Nuclei were detected with DAPI (blue). Scale bars, 50 μm.
Author response image 2

Comparison of mucus layer proteins identified by mass spectrometry between our team and the Hansson team.
Mucus layer proteins identified by mass spectrometry between our team and the Hansson team (PMID: 19432394) are compared.
Author response image 3

Goblet Cell Distribution in the Middle Colon.
Goblet cells in the middle segment of the colon (approximately 3 to 4 cm distal from the cecum) were detected using immunofluorescence with antibodies against UEA-1 (green) and MUC2 (red). Scale bars = 50 μm. Representative images are shown from three mice individually stained for each antibody.
Tables
Key resources table
| Reagent type (species) or resource | Designation | Source or reference | Identifiers | Additional information |
|---|---|---|---|---|
| Cell line (Homo sapiens) | DLD-1 cells | ATCC | CCL-221 | |
| Recombinant DNA reagent | PLKO.1-Puro (plasmid) | Addgene | RRID:Addgene_10878 | Pol III-based shRNA backbone |
| Transfected construct (human) | shChil1 (constructed from pLKO.1 – TRC) | This paper | Constructed from RRID:Addgene_10878 | Lentiviral construct to transfect and express the shRNA |
| Strain, strain background (Staphylococcus saprophyticus) | Staphylococcus saprophyticus | ATCC | 15305 | |
| Strain, strain background (Enterococcus faecalis) | E. faecalis | ATCC | 33186 | |
| Strain, strain background (Lactobacillus reuteri) | Lactobacillus reuteri | ATCC | 23272 | |
| Strain, strain background (Escherichia coli) | K12 | Dharmacon | Cat# OEC5042 | |
| Strain, strain background (E. coli) | OP50 | CGC | RRID:WB-STRAIN:WBStrain00041969 | |
| Strain, strain background (E. coli) | OP50-mCherry | Provided by Bin Qi Lab; He et al., 2023 | ||
| Strain, strain background (Staphylococcus sciuri) | Staphylococcus sciuri | Identified from C57BL/6J wildtype mice stools | This paper | This strain is used in Figure 1D |
| Strain, strain background (E. coli) | E. coli | Identified from C57BL/6J wildtype mice stools (this paper) | This paper | This strain is used in Figure 1D |
| Antibody | Anti-Chi3l1 (rabbit polyclonal) | Invitrogen | PA5-95897 RRID:AB_2807699 | IHC (1:200) |
| Antibody | Anti-Chi3l1 (rabbit polyclonal) | Abcam | ab180569 RRID:AB_2891040 | IF (1:400) |
| Antibody | Anti-UEA-1-FITC (Ulex europaeus) | GeneTeX | GTX01512 | IF (1:200) |
| Antibody | Anti-Cha-A (mouse monoclonal) | Santa Cruz | sc-393941 RRID:AB_2801371 | IF (1:200) |
| Antibody | Anti-mouse Chi3l1 Purified Rat monoclonal IgG (rat monoclonal) | R&D | MAB2649 RRID:AB_2081263 | WB (1:2000) |
| Antibody | Anti-MUC2 (rabbit polyclonal) | Invitrogen | PA5-103083 RRID:AB_2852453 | IF (1:50) |
| Antibody | Gram-positive bacteria LTA (mouse monoclonal) | Invitrogen | MA1-7402 RRID:AB_1017302 | IF (1:50) |
| Antibody | 488-conjugated Affinipure Goat Anti-Rabbit (goat polyclonal) | Jackson | 111-545-003 RRID:AB_2338046 | IF (1:1000) |
| Antibody | Immunoresearch AlexaFluor 594 AffiniPure Goat Anti-Mouse IgG (H+L) (goat polyclonal) | Jackson | 115-585-003 RRID:AB_2338046 | IF (1:1000) |
| Antibody | Goat anti-Rabbit IgG (H+L) Secondary Antibody-Biotin (goat polyclonal) | Invitrogen | 65-6140 RRID:AB_2533969 | IHC (1:2000) |
| Antibody | Horseradish peroxidase conjugate antibody | Invitrogen | A2664 RRID:AB_2764530 | IHC (1:2000) |
| Antibody | Rabbit anti-Chi3l1 antibody | Proteintech | 12036-1-AP RRID:AB_2877819 | IF (1:200) WB (1:2000) |
| Antibody | Goat anti-Rabbit IgG (goat polyclonal) | Jackson ImmunoResearch | 111-035-0030 | WB (1:10,000) |
| Antibody | Anti-alpha-Actinin (mouse IgG1) | Cell Signaling | 69758S | WB (1:1000) |
| Antibody | Anti-Rat-IgG (goat) | Cell Signaling | 7077S | WB (1:10,000) |
| Antibody | Goat anti-mouse | Invitrogen | 62-6520 RRID:AB_2533947 | WB (1:10,000) |
| Antibody | Mouse anti-α-tubulin antibody (mouse monoclonal) | Sigma | T5168 RRID:AB_477579 | WB (1:2000) |
| Chemical compound, drug | Dextran sodium sulfate salt | MP | CAS:9011-18-1 | |
| Chemical compound, drug | Hematoxylin | Servicebio | G1004 | |
| Chemical compound, drug | Eosin | Biosharp | BL703b | |
| Chemical compound, drug | Tris | Solarbio | 77-86-1 | |
| Chemical compound, drug | Sodium chloride | Solarbio | 7647-14-5 | |
| Chemical compound, drug | Disodium salt dihydrate (EDTA) | Sangon Biotech | 6381-92-6 | |
| Chemical compound, drug | Sodium dodecyl sulfate (SDS) | BBI | A601336-0500 | |
| Chemical compound, drug | Egtazic acid, glycol ether diamine tetraacetic acid (EGTA) | BBI | 67-42-5 | |
| Chemical compound, drug | TritonX-100 | BBI | 9002-93-1 | |
| Chemical compound, drug | Citric acid | Sangon Biotech | 77-92-9 | |
| Chemical compound, drug | Vancomycin | Solarbio | V8050 | |
| Chemical compound, drug | Ampicillin-sodium salt | Solarbio | A8180 | |
| Chemical compound, drug | Metronidazole | Solarbio | M8060 | |
| Chemical compound, drug | Neomyein sulfate | Solarbio | N8090 | |
| Chemical compound, drug | MRS broth | Solarbio | M8540 | |
| Chemical compound, drug | Goat serum | Solarbio | ||
| Commercial assay or kit | AB-PAS staining kit | Solarbio | G1285 | |
| Commercial assay or kit | EIANamp stool DNA kit | TIANGEN | DP328-02 | |
| Commercial assay or kit | PAGE Gel Fast Preparation Kit | Shanghai Epizyme biotechnology | PG113 | |
| Commercial assay or kit | Gel extraction kit | Omega | D2500-02 | |
| Commercial assay or kit | DAB Substrate Kit | ZSGB-BIO | zli-9018 | |
| Other | SYBR Green kit | Thermo Fisher | A25742 | Using for qPCR |
| Other | FDAA | 5TAMRA; CHINESE PEPTIDE | CS-11-00433 | Using for label E. faecalis |
| Other | Antifade mounting medium | Vectashield | H-1000-10 | Using for IF staining |
Additional files
-
MDAR checklist
- https://cdn.elifesciences.org/articles/92994/elife-92994-mdarchecklist1-v1.docx
-
Supplementary file 1
Genotyping and qPCR Primers.
- https://cdn.elifesciences.org/articles/92994/elife-92994-supp1-v1.xlsx
Download links
A two-part list of links to download the article, or parts of the article, in various formats.
Downloads (link to download the article as PDF)
Open citations (links to open the citations from this article in various online reference manager services)
Cite this article (links to download the citations from this article in formats compatible with various reference manager tools)
Peptidoglycan-Chi3l1 interaction shapes gut microbiota in intestinal mucus layer
eLife 13:RP92994.
https://doi.org/10.7554/eLife.92994.3


