The role of heterochronic gene expression and regulatory architecture in early developmental divergence
- Department of Biological Sciences, North Carolina State University, United States
Figures
Figure 1
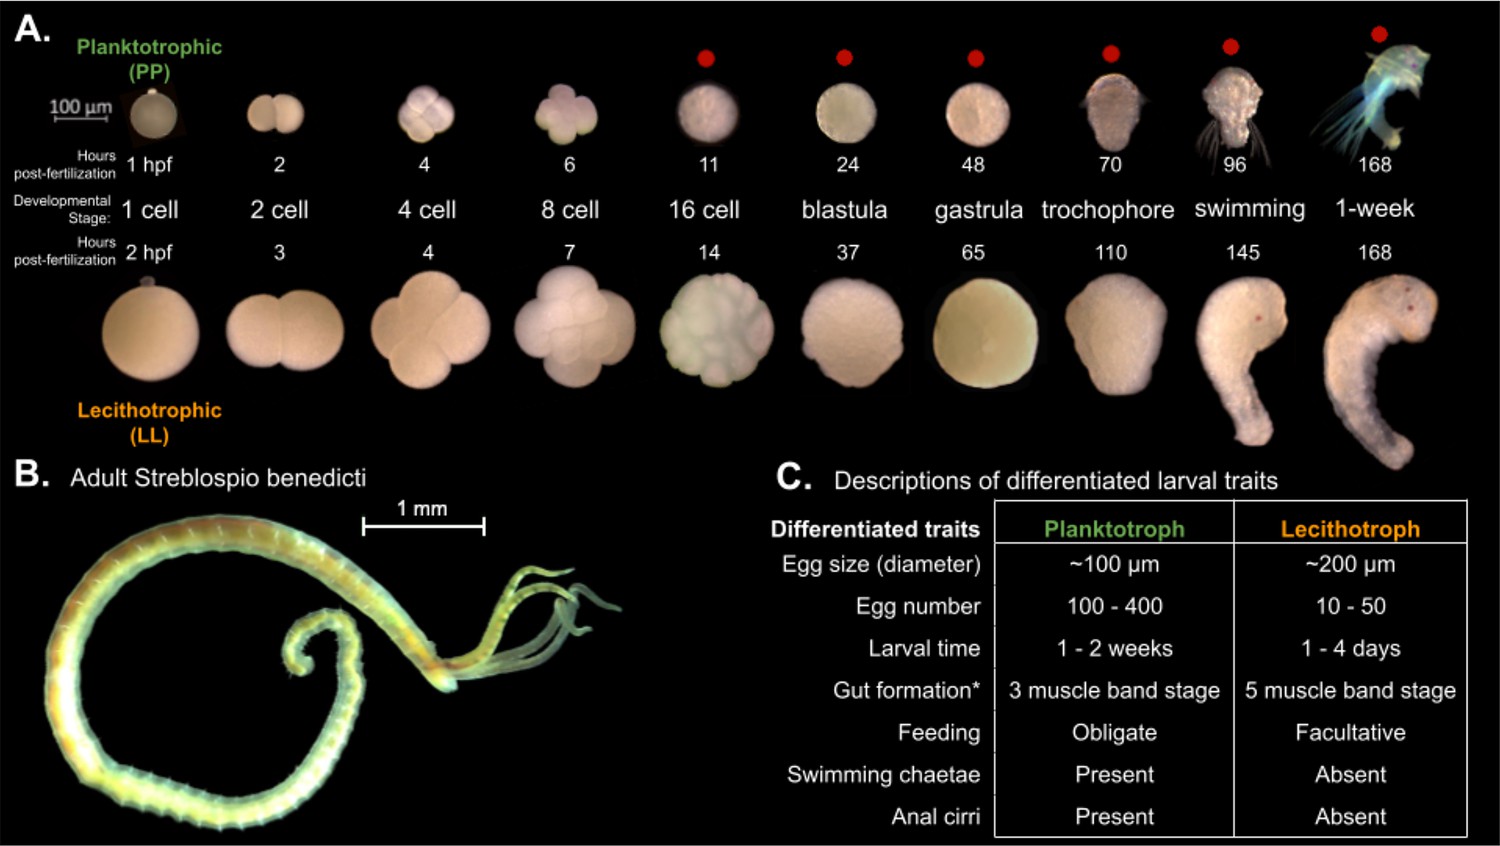
Embryology and development of S. benedicti.
(A) Timeline of early development of the two morphs. The ‘swimming’ stage is the onset of swimming ability in both morphs. The ‘1-week’ old stage (7 days post fertilization) occurs approximately 1–4 days following larval release from maternal brood pouches under natural conditions. Planktotrophic (PP) larvae at this stage were not fed. Stages used in this study are marked with a red dot. (B) Adult male. The adults of both morphs are indistinguishable outside of reproductive traits. (C) Table of larval traits. Lecithotrophic (LL) offspring are facultatively feeding, meaning that feeding is not obligatory, but they are capable of feeding (Pernet and McArthur, 2006). Gut formation from Pernet and McHugh, 2010, where the three-band stage is our swimming stage and the five-band stage is shortly before our 1-week stage.
Figure 2 with 2 supplements
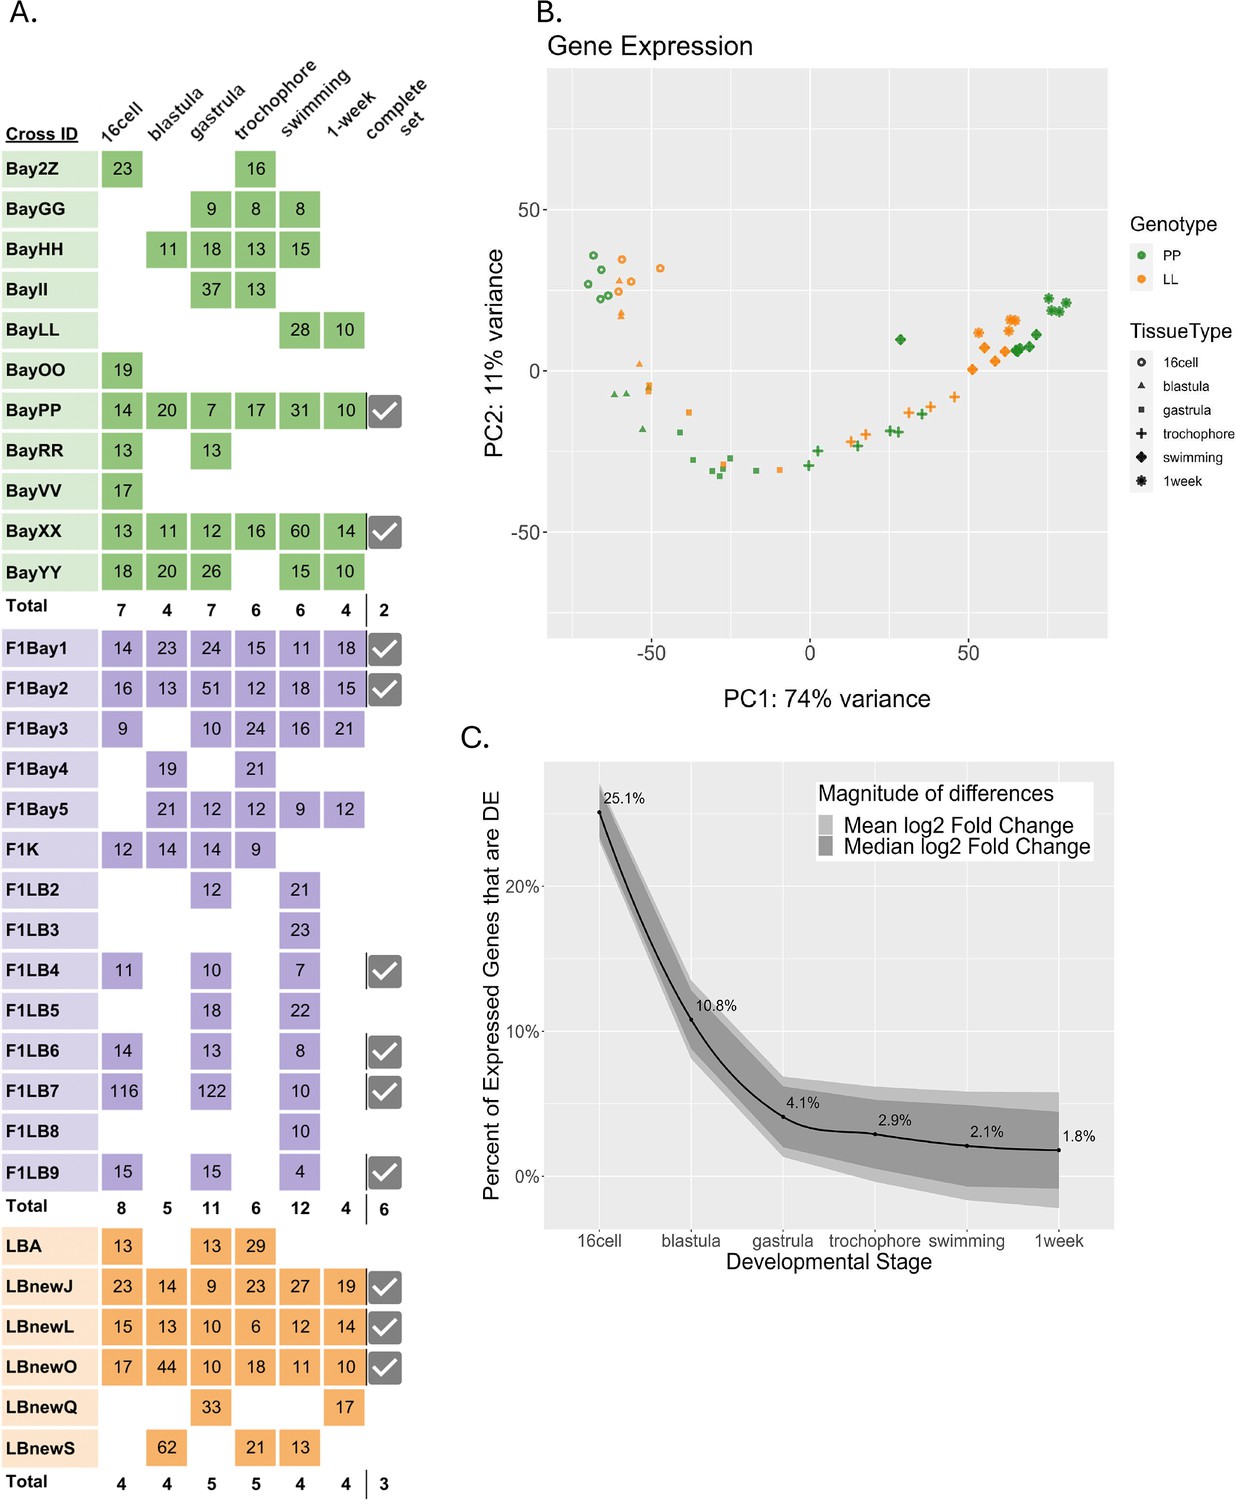
Differentially expressed (DE) genes across six developmental stages in the two developmental morphs.
(A) Sequenced libraries. Colors indicate morphs: green = PP (planktotrophic), orange = LL (lecithotrophic), purple = (F1) PL, pink = (F1) LP. Numbers in boxes are the sample’s sequencing depth in million reads. Total number of replicates for each time point are in bold. Samples for which all six stages were collected from the same cross are indicated as ‘complete’ with a check mark. (B) Principal component analysis of PP and LL samples. PC1 represents developmental time, whereas PC2 separates pre-gastrulation from post-gastrulation (C) DE between morphs over development. Black line is the percentage of total expressed genes that are DE at each stage, ribbon displays the relative mean and median log2 fold-change between morphs for those genes that are DE.
Figure 2—figure supplement 1
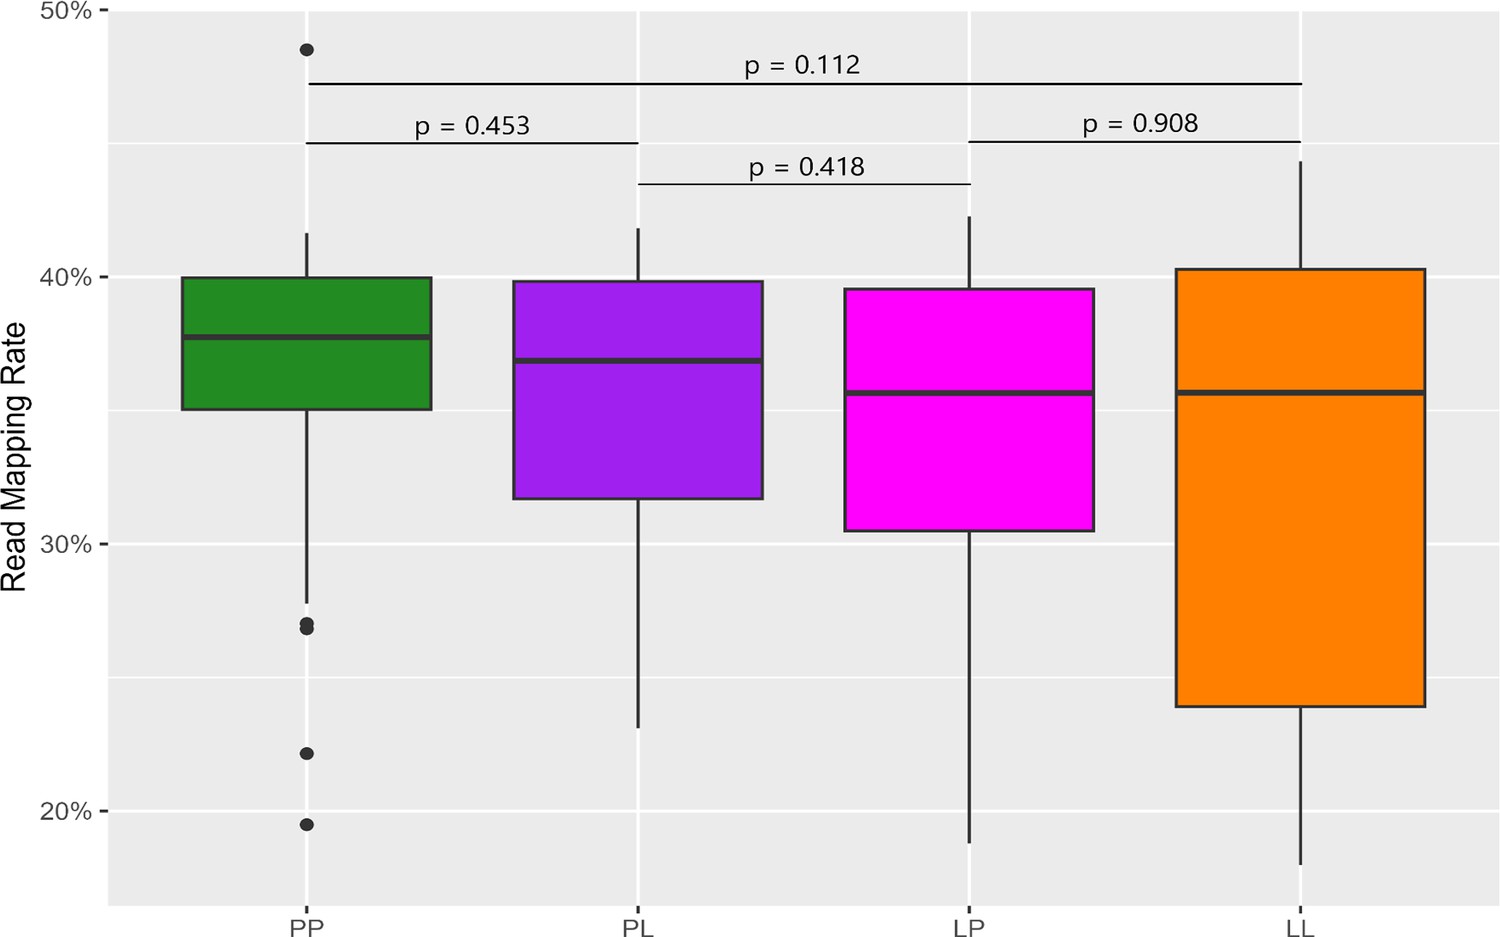
Read mapping rate between samples.
Mapping rates in all pairwise comparisons do not differ significantly. p-Values are shown above the plot indicating no significant differences between the mapping rates of any two groups.
Figure 2—figure supplement 2
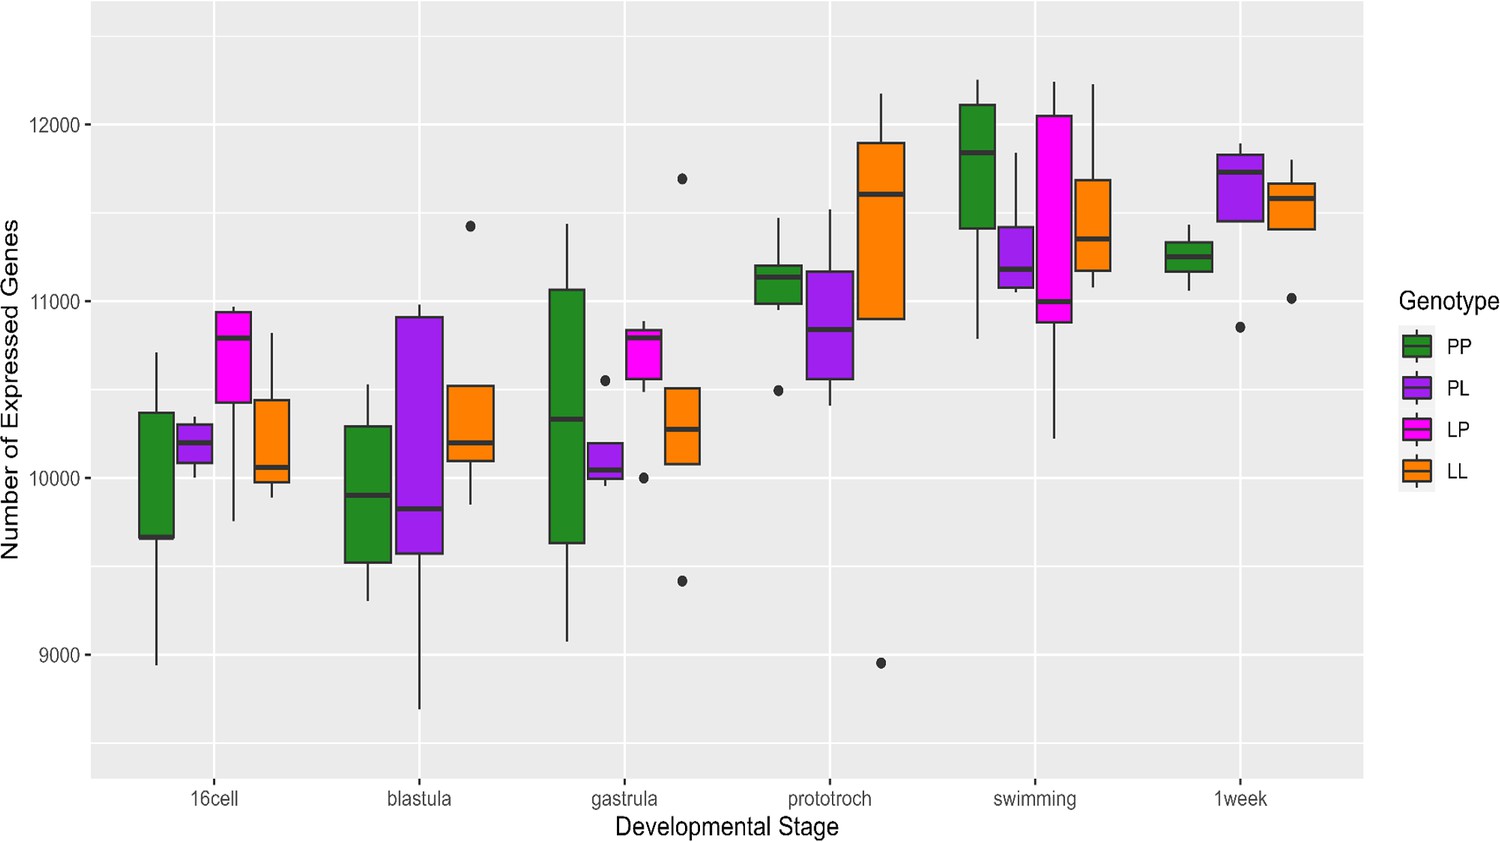
Number of genes expressed at each stage in planktotrophic (PP) and lecithotrophic (LL) samples.
Figure 3
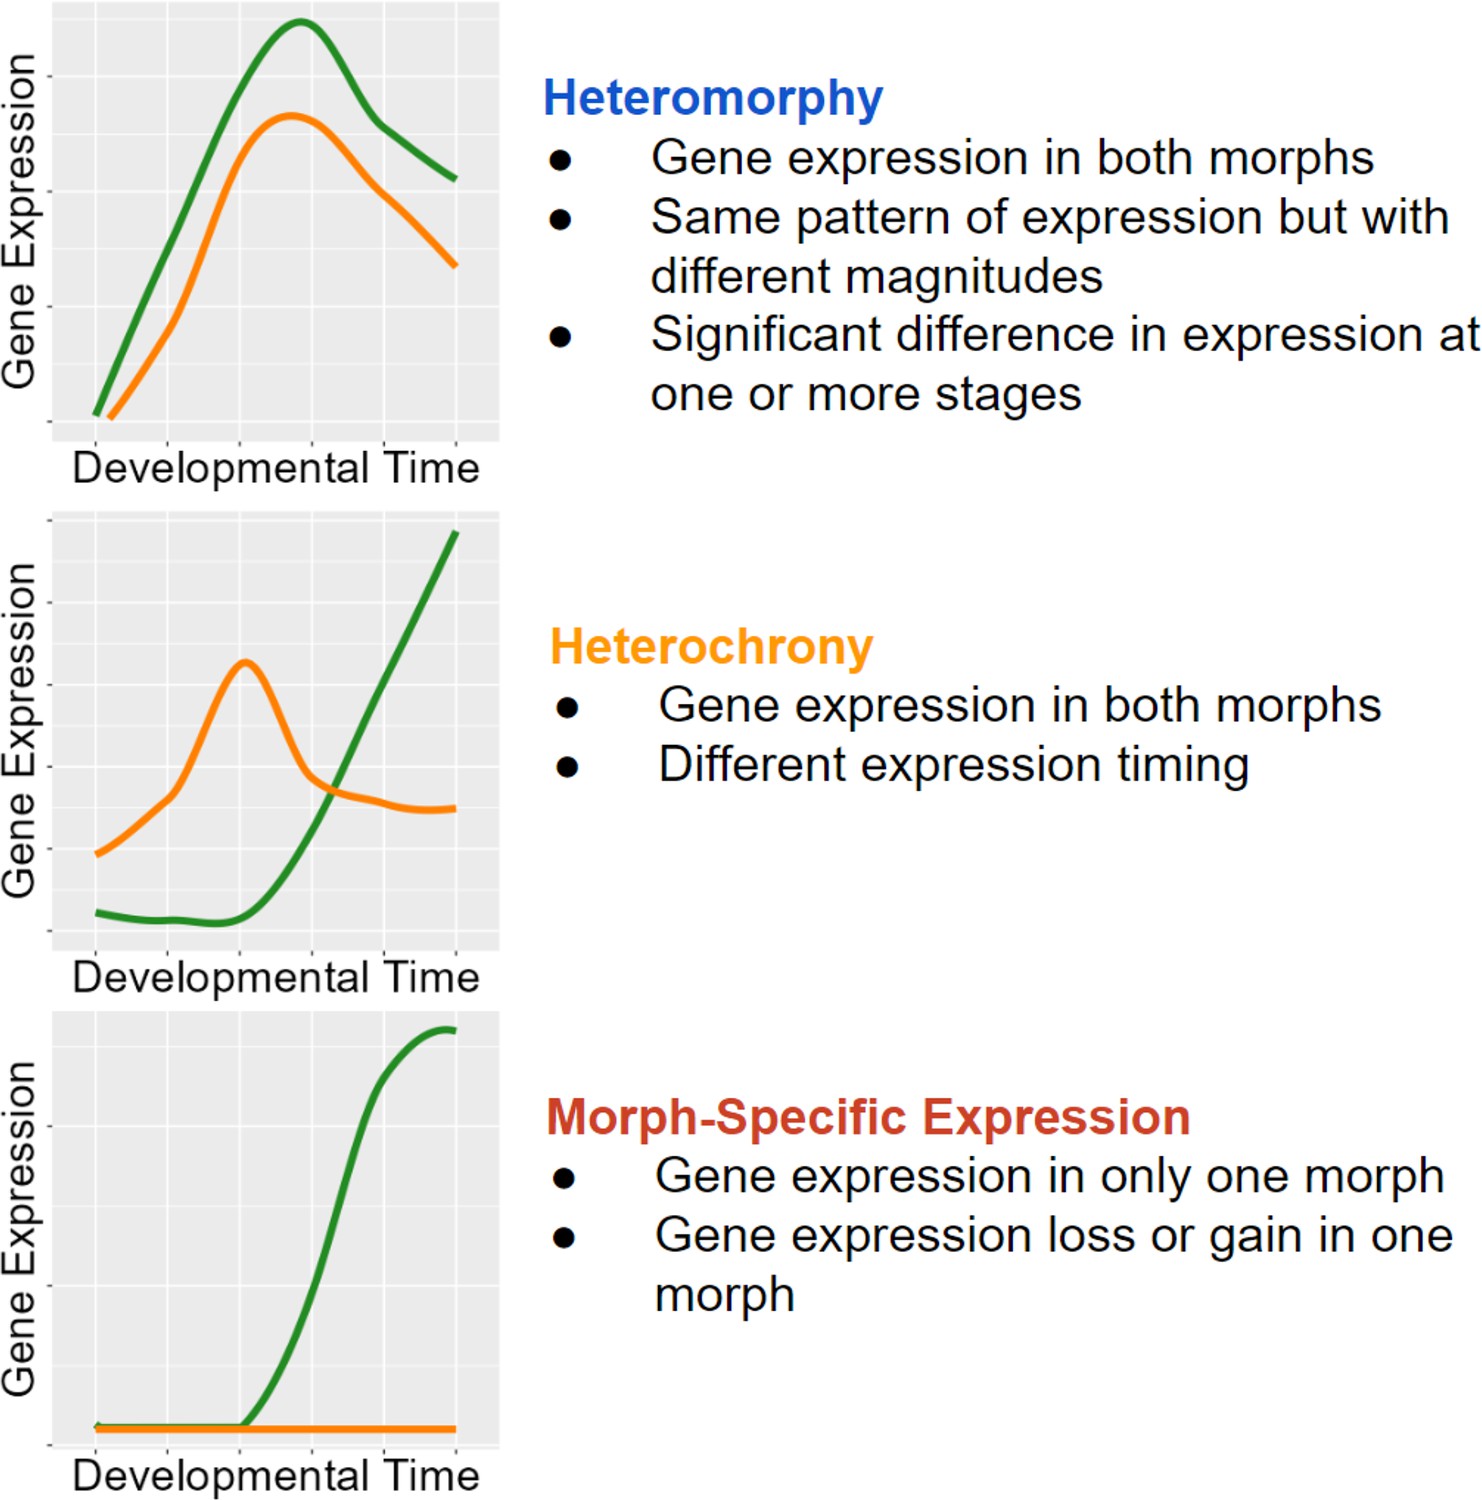
Classifications with examples of gene expression categories.
Functional heterochrony is a change in the developmental stage at which a particular pattern of gene expression appears instead of a difference in absolute time.
Figure 4 with 2 supplements
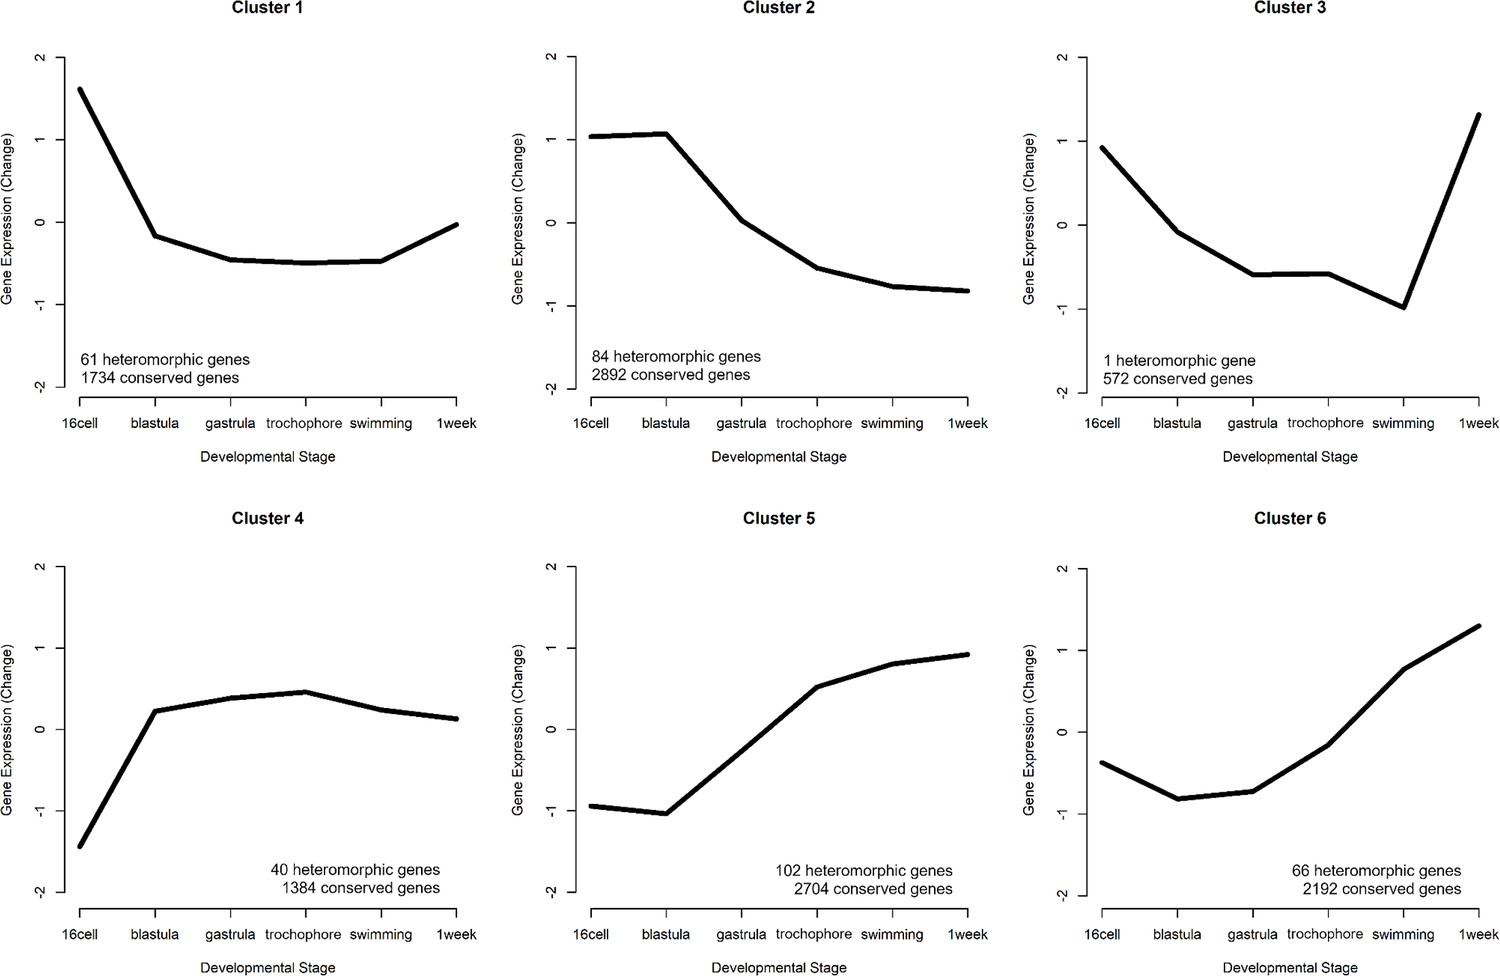
Six gene expression profiles representing the patterns of expression.
The number of conserved genes and heteromorphic genes that match each cluster is listed to summarize overall trends in expression patterns that appear mostly similar in both morphs. Clusters 2 (early expression) and 5 (late expression) represent the most genes.
Figure 4—figure supplement 1
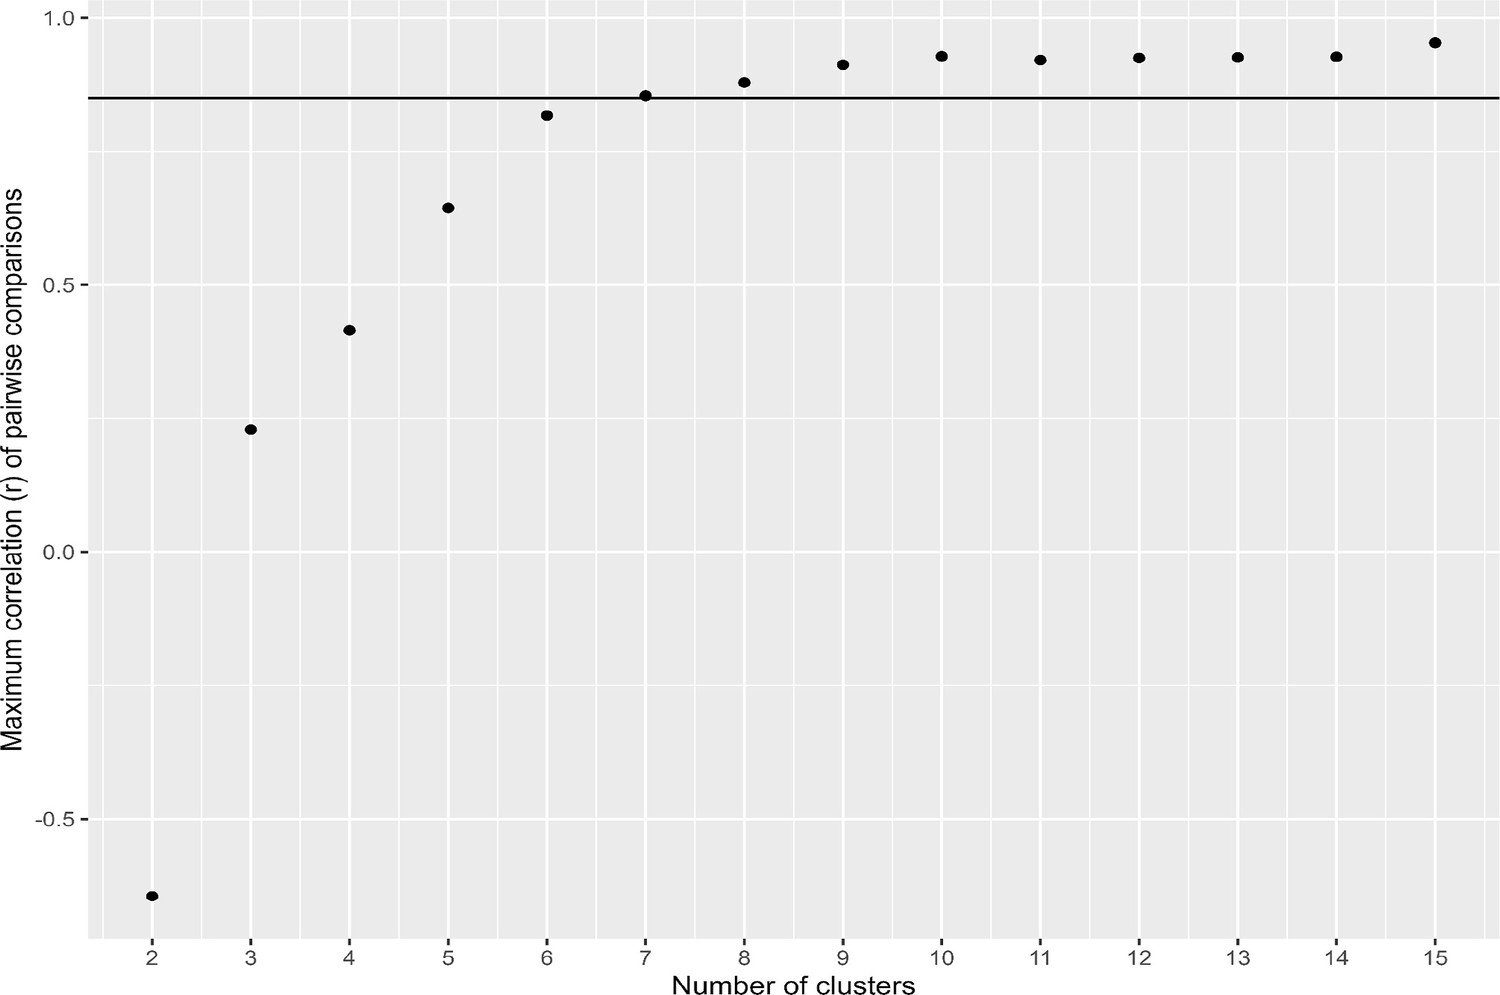
Cluster number optimization.
The correlation between the two most similar gene expression clusters (profiles) as cluster number increases. Threshold (solid line) at r=0.85.
Figure 4—figure supplement 2
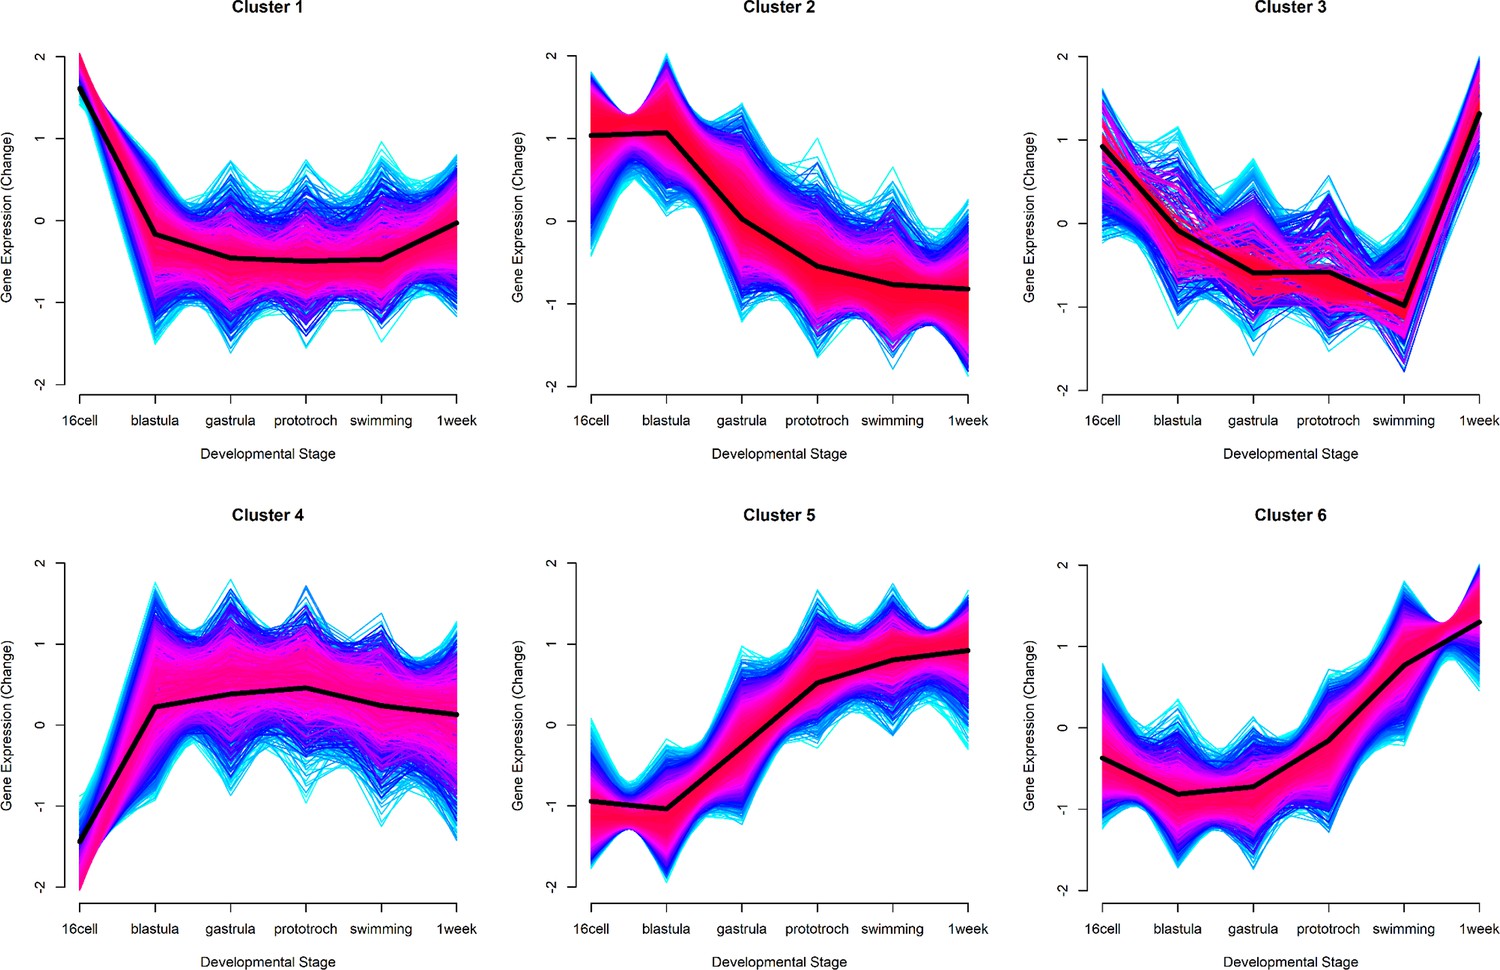
Clusters with all genes shown plotted on top of cluster core genes.
Red lines indicate genes with high cluster membership scores while blue lines indicate genes with lower membership scores. Genes with no cluster membership score greater than 0.5 were not assigned to a cluster and are not presented in this study’s results.
Figure 5
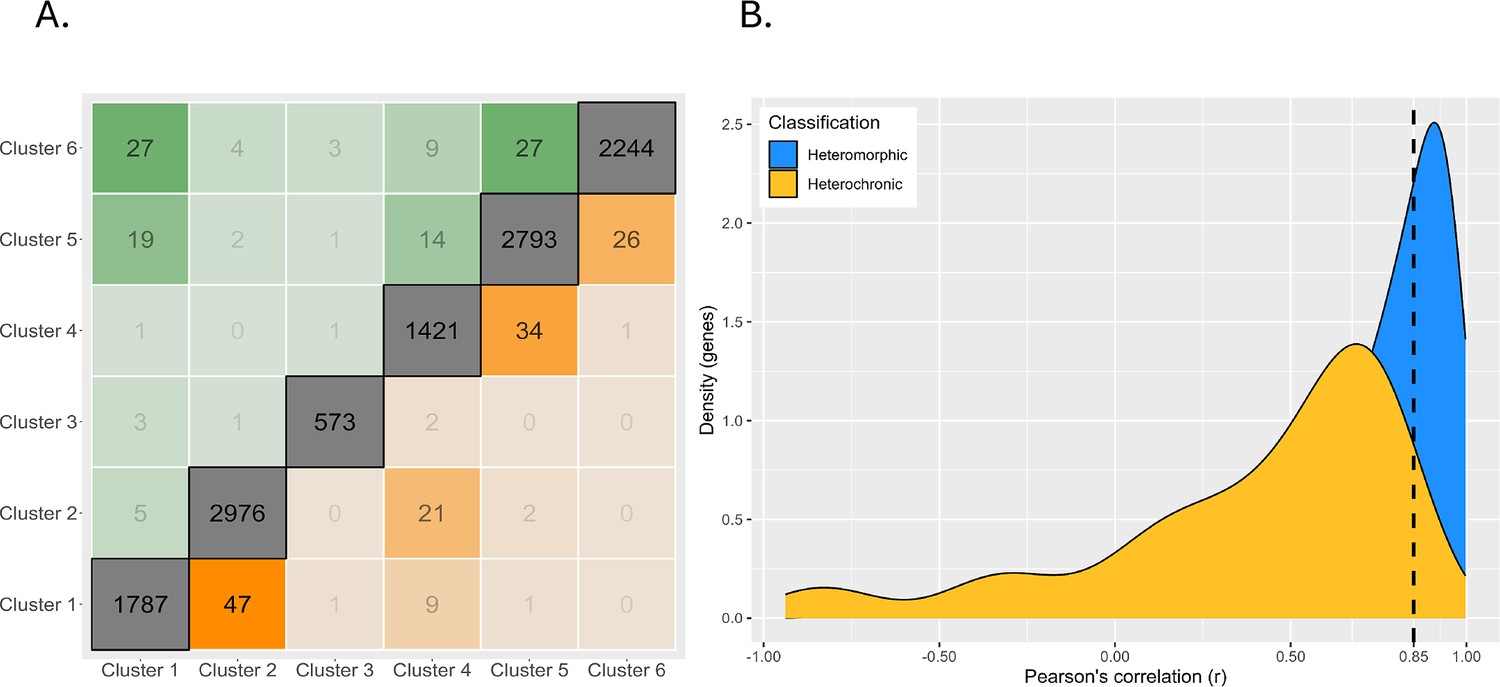
Magnitude of expression profile changes.
(A) Number of switches between each cluster. Clusters are arranged on the axes in order from high early developmental expression (left/bottom) to high late developmental gene expression (right/top). The diagonal represents genes which are assigned to the same cluster in both planktotrophic (PP) and lecithotrophic (LL) samples, boxes near the diagonal are switches between similar cluster profiles, and boxes furthest from the diagonal are extreme cluster switches. Genes expressed earlier in PP are above diagonal and earlier in LL are below. (B) Density plot of genes correlations between PP and LL. Heterochronic genes are yellow and heteromorphic genes in blue. Most heterochronies are minor changes in gene expression timing but the left-tailed distribution shows that few genes have large differences in timing.
Figure 6
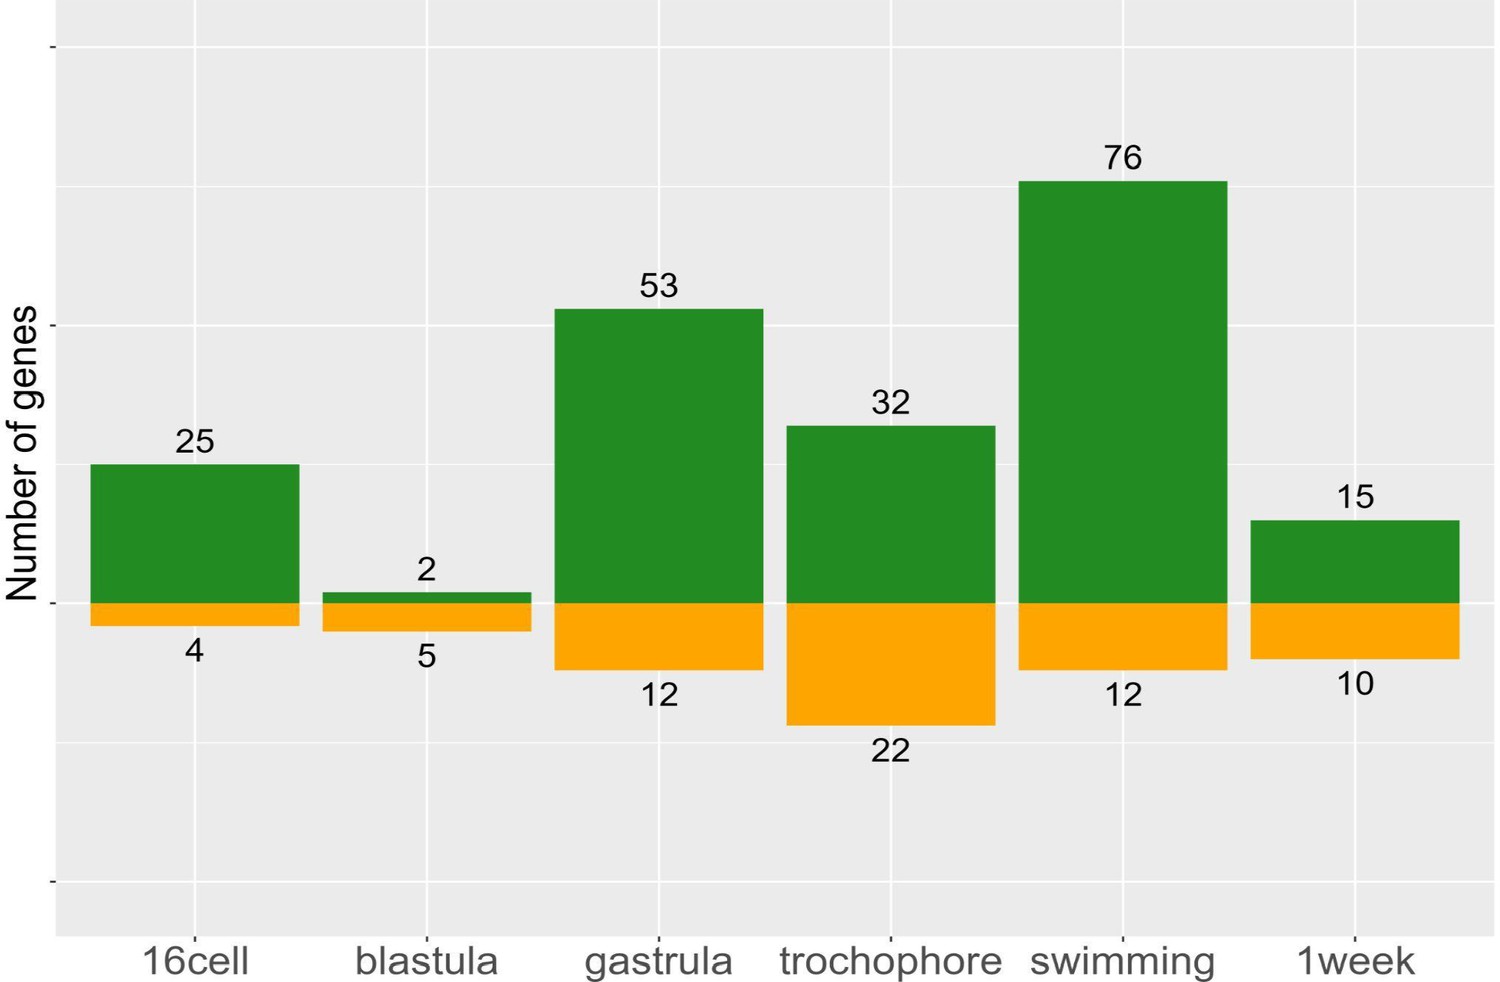
Morph-specific gene expression by stage.
These genes are never expressed in the opposite morph, but may be expressed at one to six stages within a morph. Planktotrophic (PP) is green and lecithotrophic (LL) is orange.
Figure 7
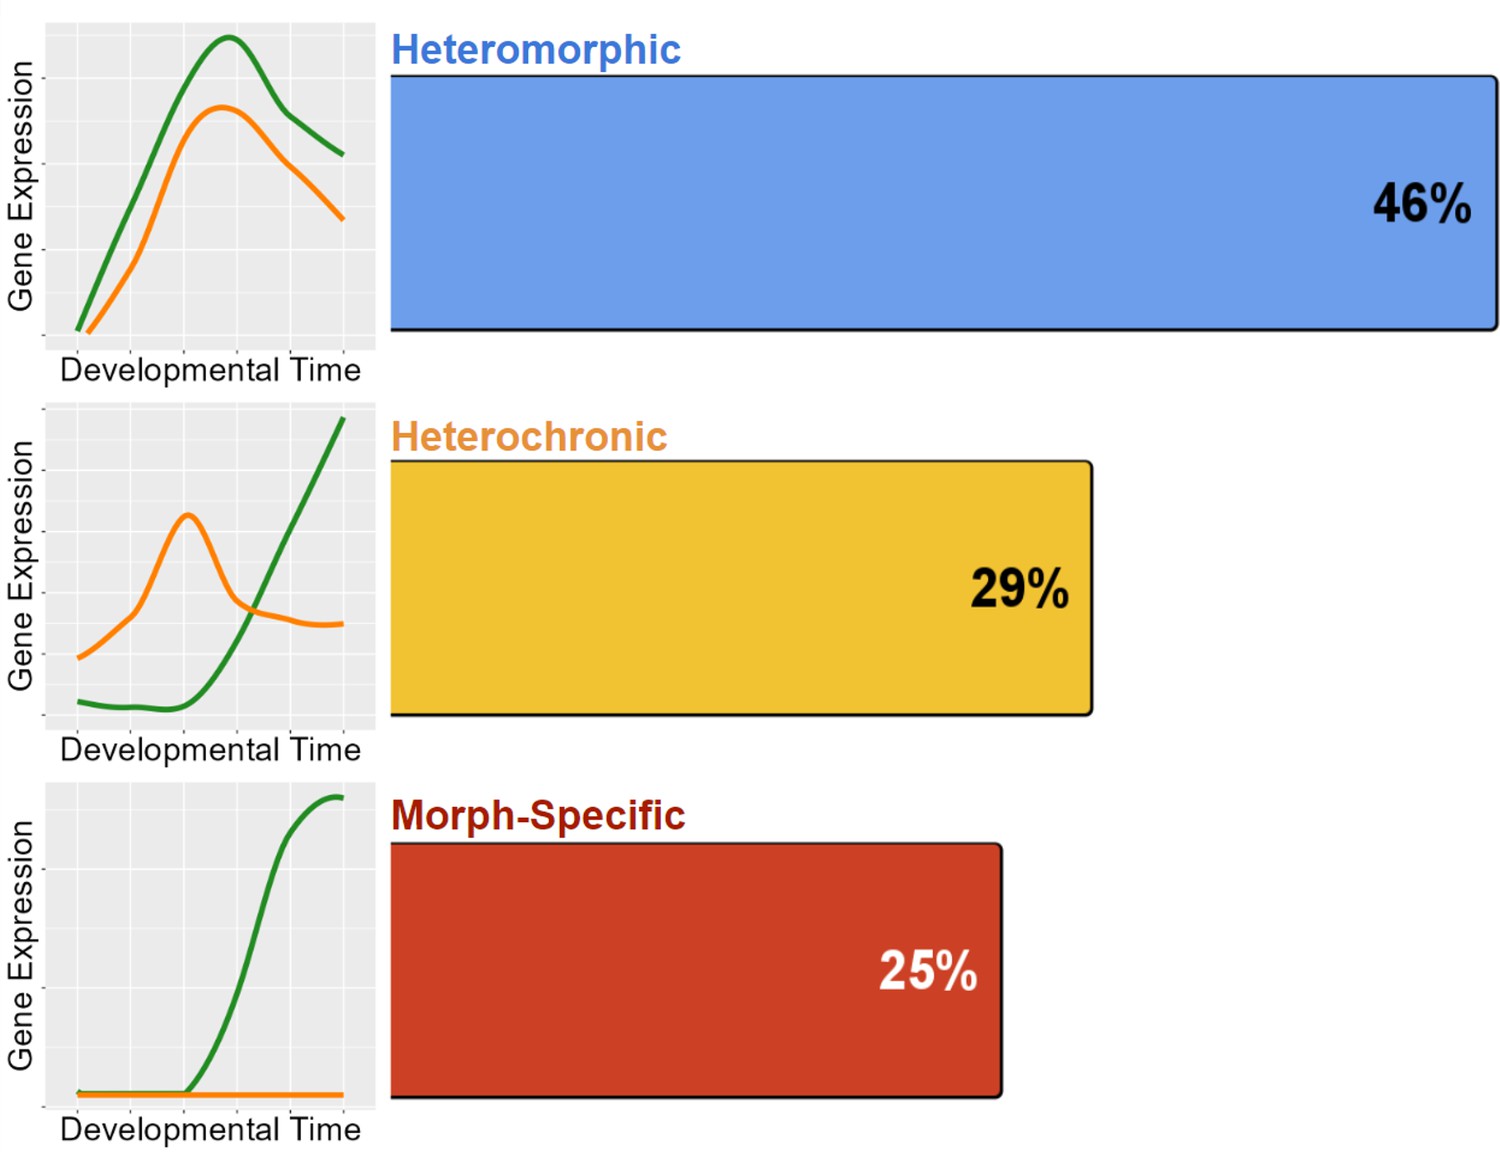
Distribution of the 772 genes with differentiated expression between morphs.
Heteromorphy makes up nearly half of all differentiated genes, while heterochrony and morph-specific genes split the remainder nearly equally.
Figure 8 with 2 supplements
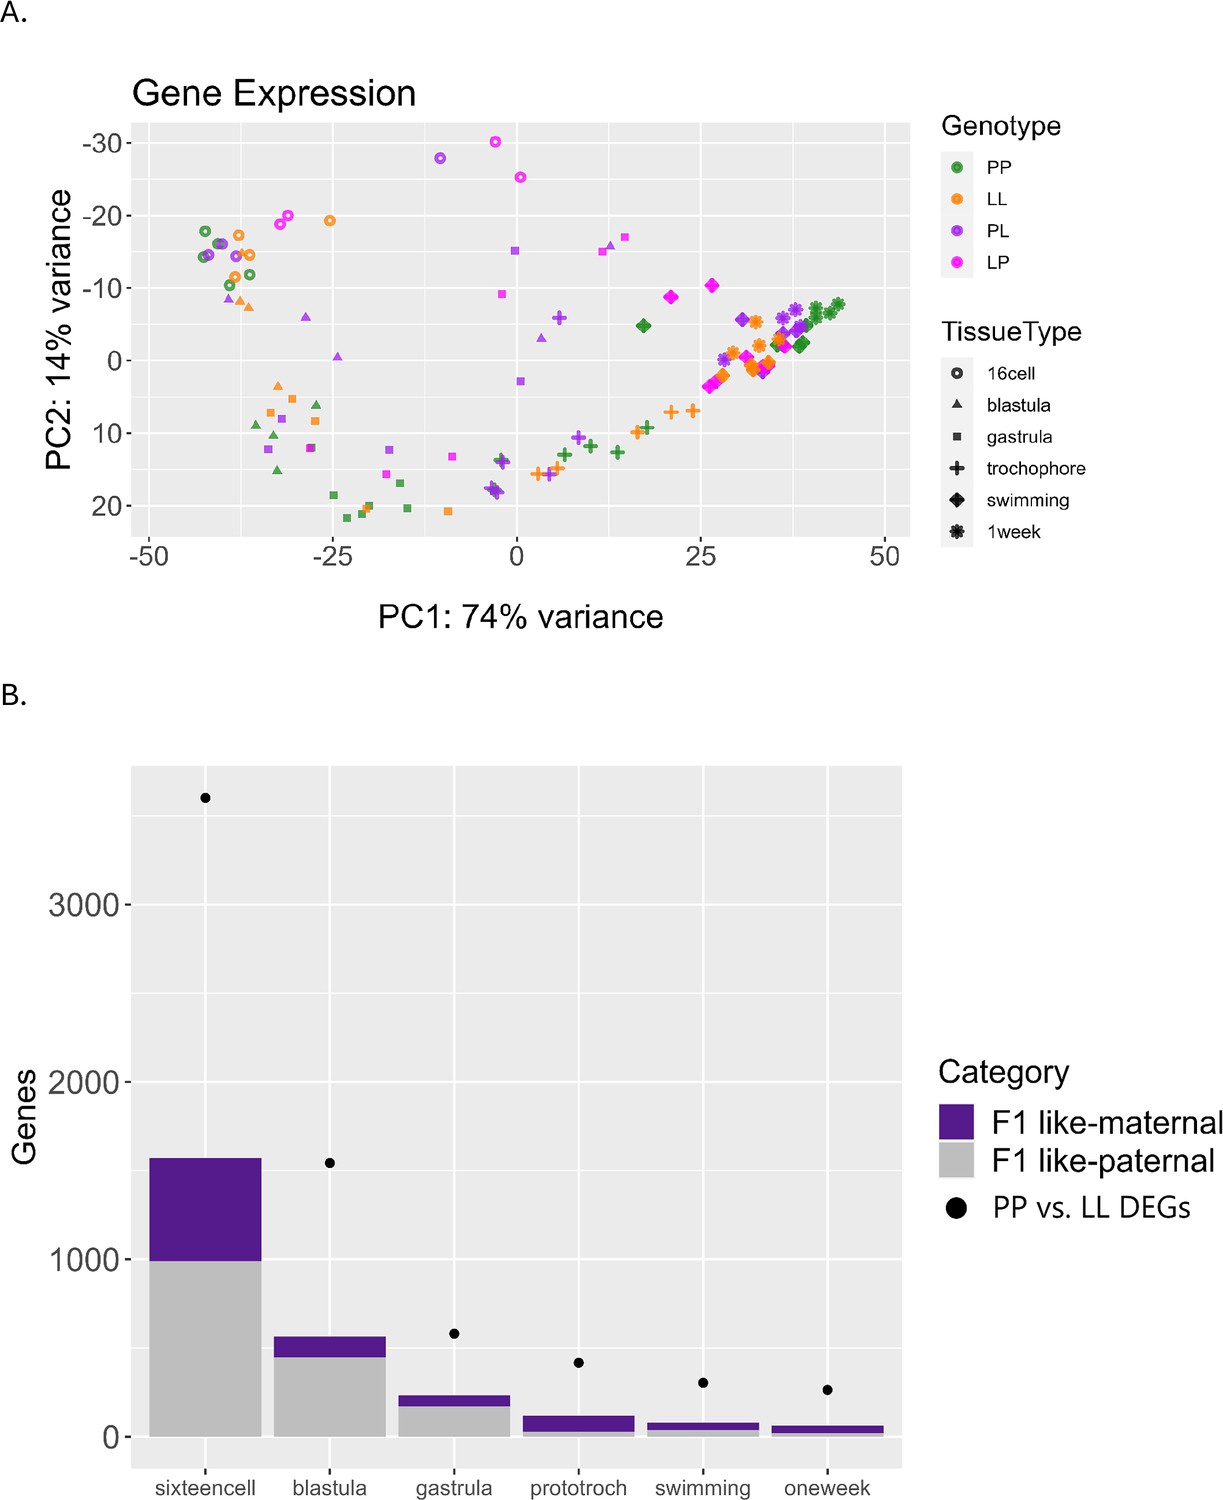
Differential gene expression including F1 offspring.
(A) Principal component analysis (PCA) of the top 500 most variable genes, including F1 (PL or LP) offspring. F1s have more misexpression in early stages but converge after the swimming stage and become intermediate to planktotrophic (PP) and lecithotrophic (LL) samples. (B) Plot relating F1 expression back to parental types. Dots indicate the number of DEGs between PP and LL samples at each stage. Purple bars represent the number of those DEGs for which the F1 gene expression is more like its maternal parent, and gray bars represent the number of those DEGs for which the F1 gene expression is more similar to its paternal parent.
Figure 8—figure supplement 1
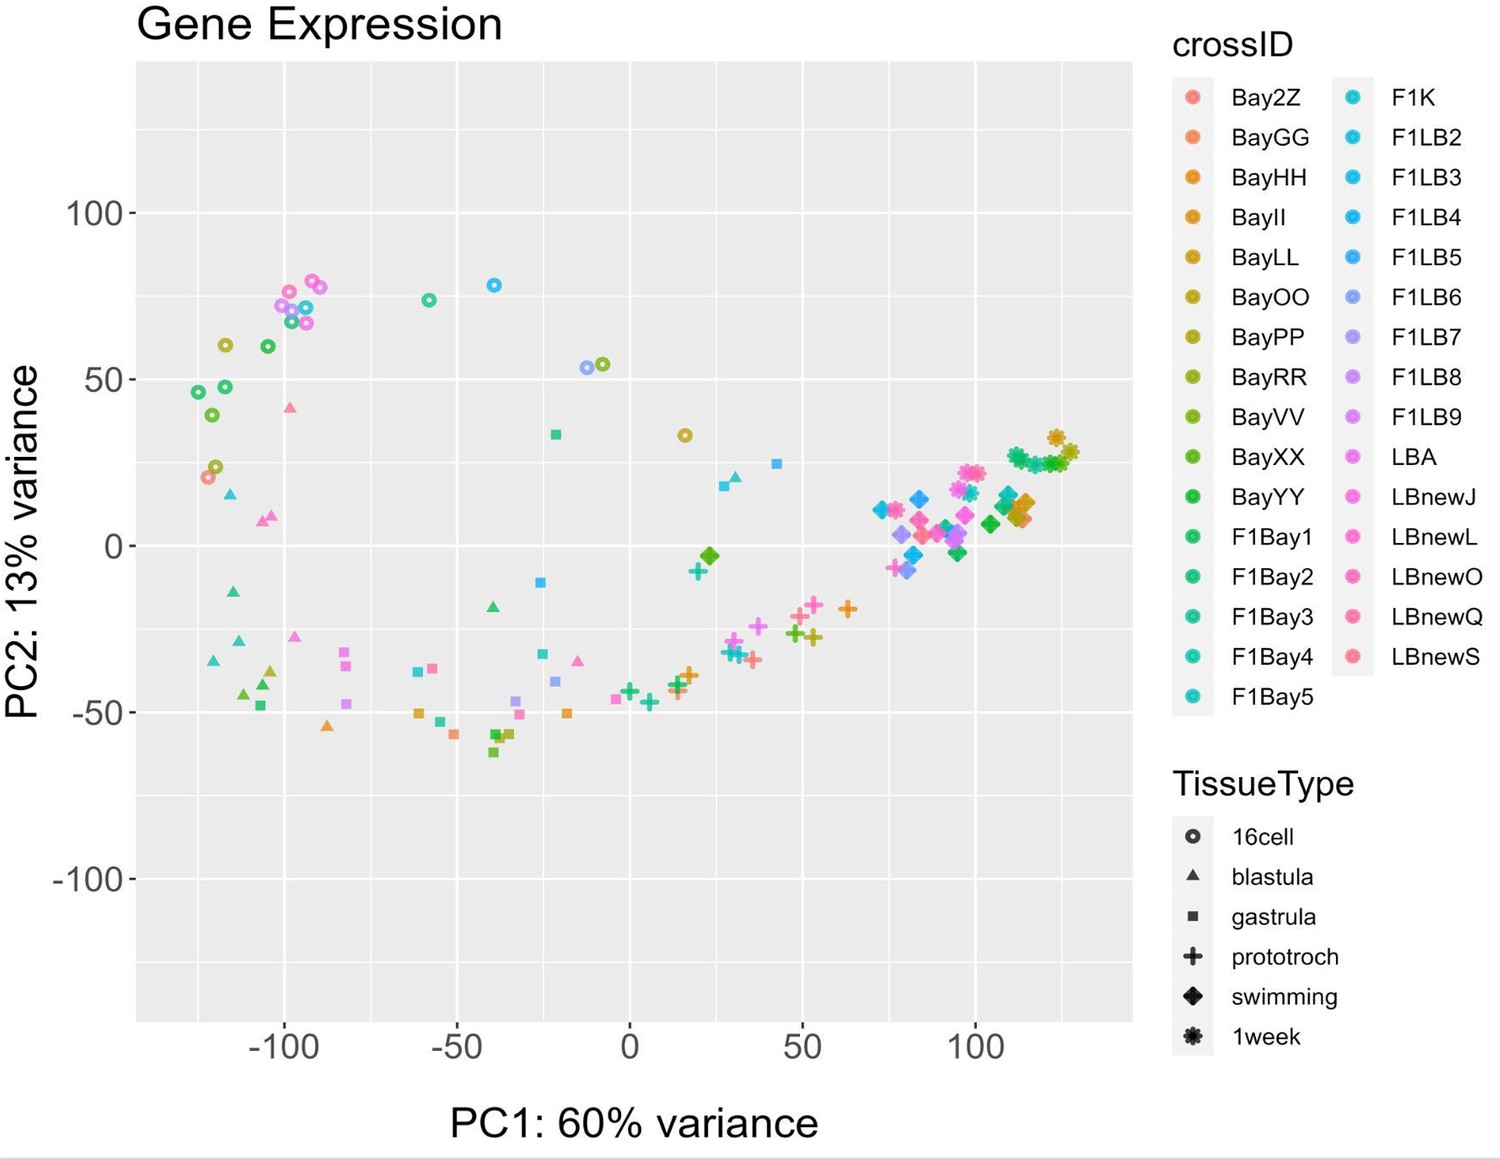
Principal component analysis (PCA) of all gene expression labeled by family (crossID).
Figure 8—figure supplement 2
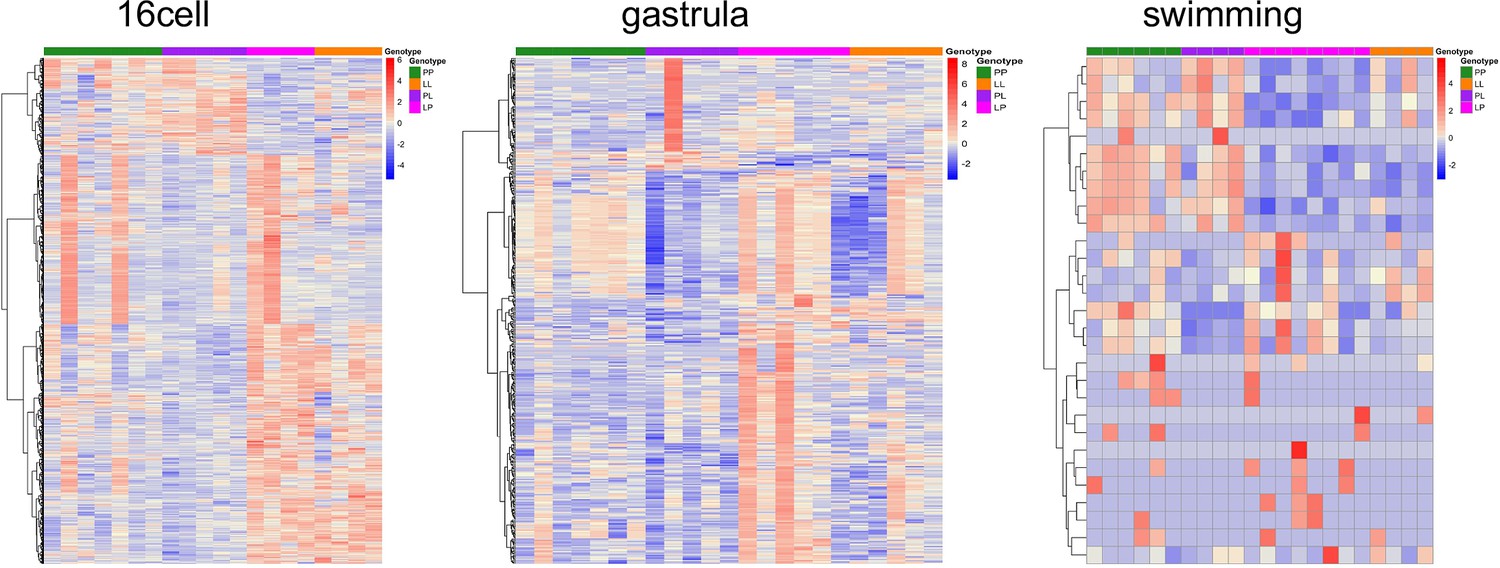
Genes with parental effects.
Most genes match maternal expression patterns.
Figure 9
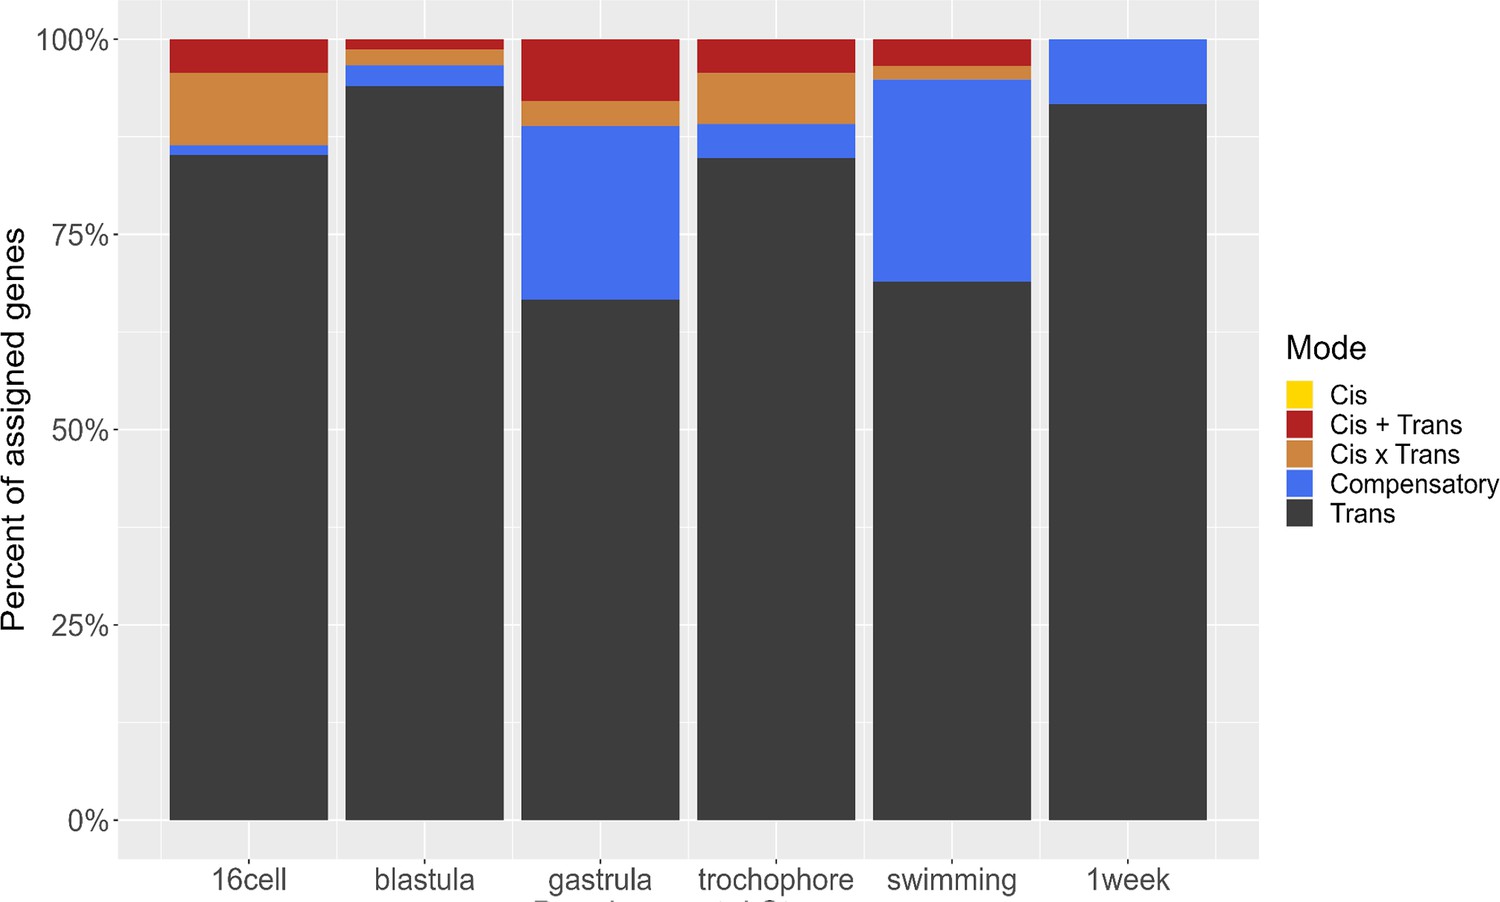
Distribution of regulatory mode over time.
The majority of regulatory changes act in trans, and compensatory changes emerge after gastrulation.
Figure 10
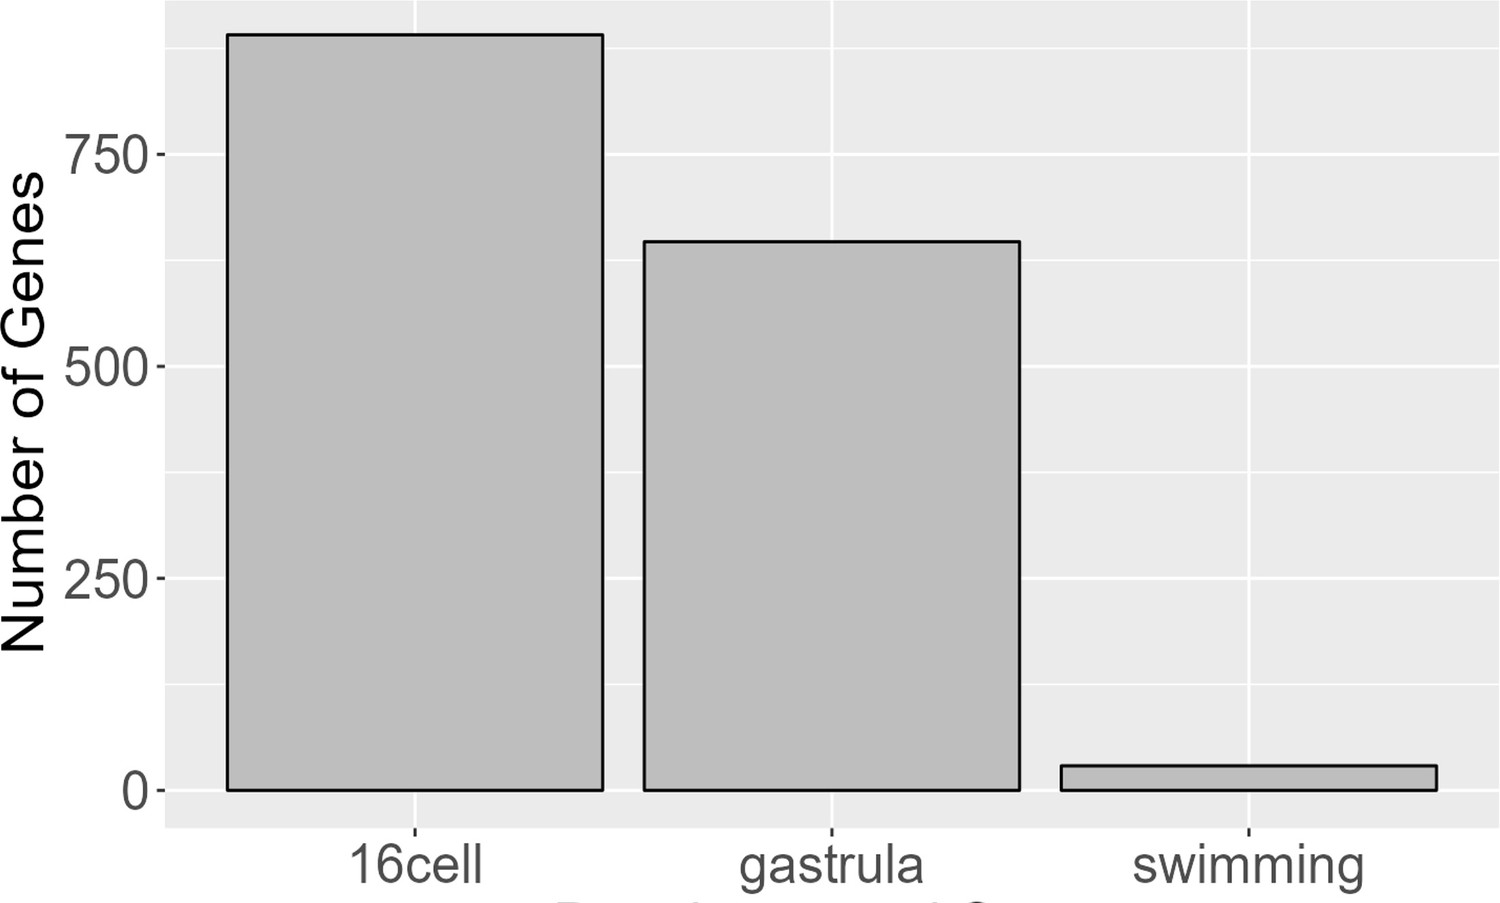
Genes with parental effects.
Early developmental stages have significantly more genes, likely due to maternal transcript differences. Maternal transcripts are likely degraded around the gastrula stage and any remaining parental effects observed are likely due to other mechanisms.
Tables
Table 1
Logical table showing criterion for morph-specific expression classification of genes based on number of samples in each group that have gene expression greater than their expression level threshold as assessed by data-adaptive flag method (DAFS).
An allowance for a single mismatched replicate is made in this criterion. This is because we do not believe that a single incidence within a morph (across all developmental stages) is a functionally significant and biologically relevant level of gene expression in this case.
| PP samples above expression threshold | LL samples above expression threshold | Classification |
|---|---|---|
| ≤1 | ≥3 | Lecithotrophic-specific expression |
| ≥3 | ≤1 | Planktotrophic-specific expression |
Author response table 1
| Comparison (Read Mapping Rates) | p-value of two sided T-test |
|---|---|
| PP versus LL | 0.1118 |
| PP versus PL | 0.453 |
| PL versus LP | 0.418 |
| LP versus LL | 0.908 |
Additional files
-
Supplementary file 1
Gene ontology (GO) enrichment results spreadsheet.
- https://cdn.elifesciences.org/articles/93062/elife-93062-supp1-v1.xlsx
-
Supplementary file 2
Mode of regulatory change classifications.
- https://cdn.elifesciences.org/articles/93062/elife-93062-supp2-v1.docx
-
MDAR checklist
- https://cdn.elifesciences.org/articles/93062/elife-93062-mdarchecklist1-v1.docx
Download links
A two-part list of links to download the article, or parts of the article, in various formats.
Downloads (link to download the article as PDF)
Open citations (links to open the citations from this article in various online reference manager services)
Cite this article (links to download the citations from this article in formats compatible with various reference manager tools)
The role of heterochronic gene expression and regulatory architecture in early developmental divergence
eLife 13:RP93062.
https://doi.org/10.7554/eLife.93062.3


