The genomic legacy of aurochs hybridisation in ancient and modern Iberian cattle
- Human Evolution, Department of Organismal Biology, Uppsala University, Sweden
- Centro Mixto UCM-ISCIII de Evolución y Comportamiento Humanos, Spain
- Laboratorio de Evolución Humana, Universidad de Burgos, Spain
- Universidad Complutense de Madrid, Spain
- Centre for Palaeogenetics, Sweden
- Instituto de Historia – CSIC, Spain
- Área de Prehistoria, University of the Basque Country, Spain
- Department of Prehistory and Archaeology, Valladolid University, Spain
- Departamento de Prehistoria y Arqueología, UNED, Spain
- Unidad Asociada de I+D+i al CSIC Vidrio y Materiales del Patrimonio Cultural (VIMPAC), Australia
- Department of Archaeology and History, La Trobe University, Australia
- CENIEH (Centro Nacional de Investigación sobre la Evolución Humana), Spain
Figures
Figure 1
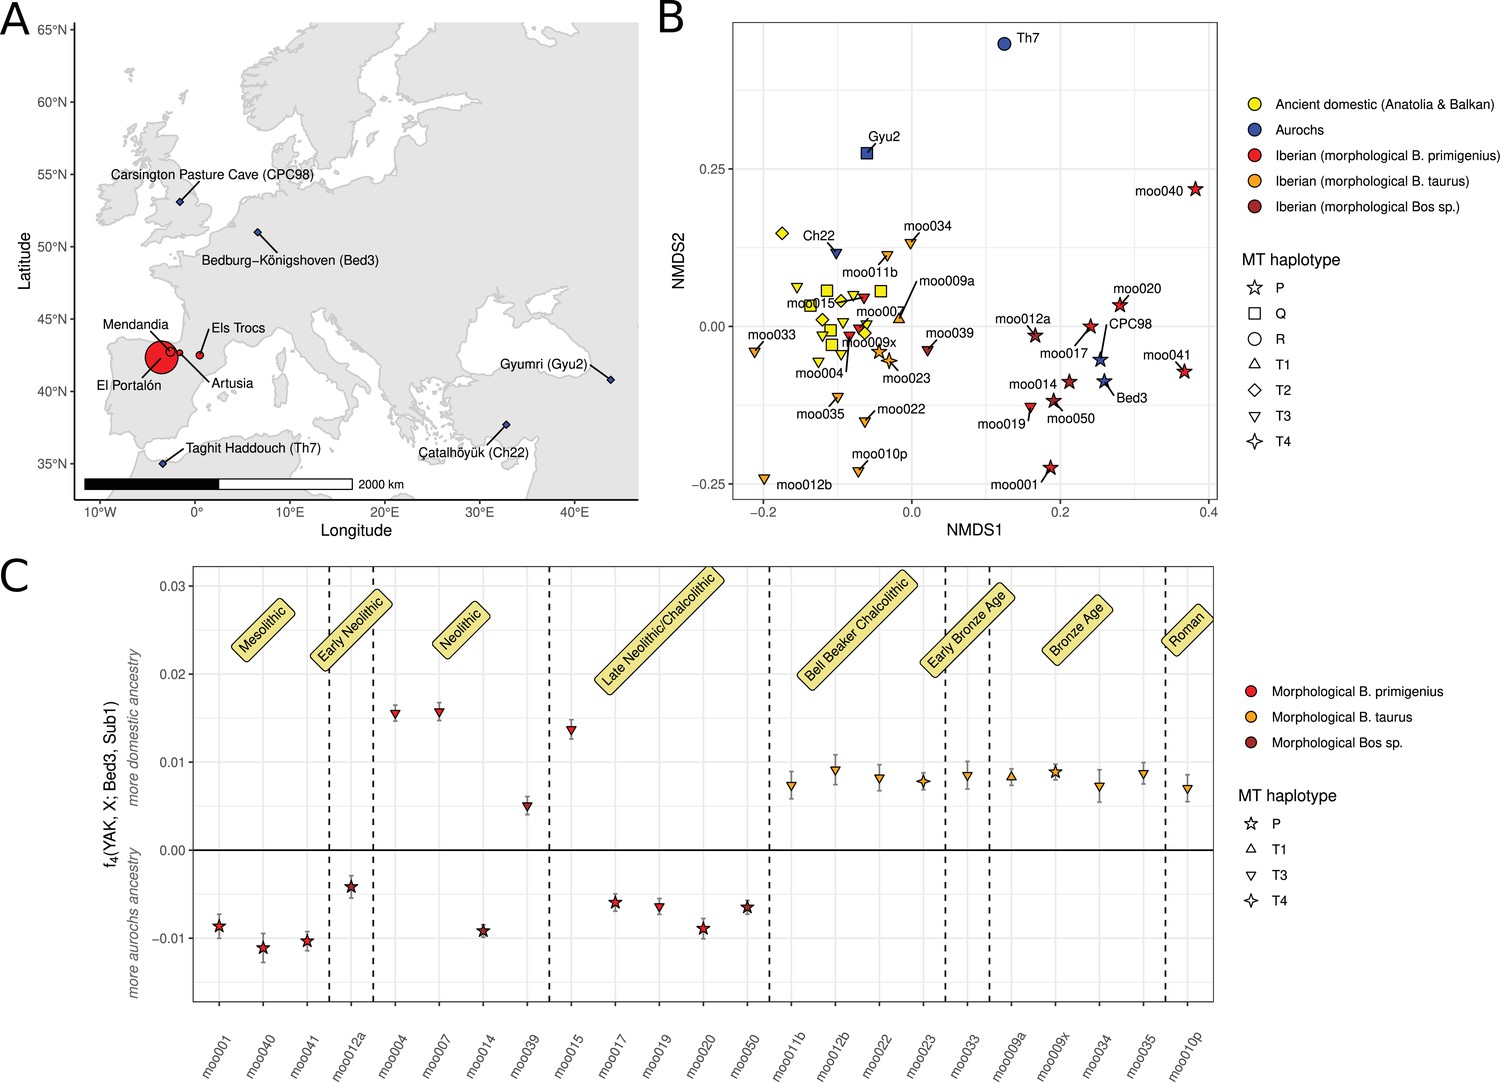
Data overview and descriptive ancestry analysis.
(A) Map of Europe showing the Iberian sampling sites (red circles, size proportional to sample sizes) and the sites for published aurochs genomes used in the analysis (blue diamonds). (B) Non-metric multi-dimensional scaling (NMDS) ordination of nuclear data of Iberian samples considered B. taurus samples (orange), Iberian samples that were morphologically considered B. primigenius (red), other Iberian Bos samples (brown), ancient domestic cattle from the Balkans and Anatolia (yellow), and aurochs (blue). Data point shape corresponds to mitochondrial haplogroups. (C) f4 statistic measuring allele sharing of the Iberian samples with European aurochs (Bed3) or Anatolian Neolithic cattle (Sub1). Error bars indicate 95% confidence intervals estimated using a block jackknife procedure. The time periods displayed are contextual.
Figure 2
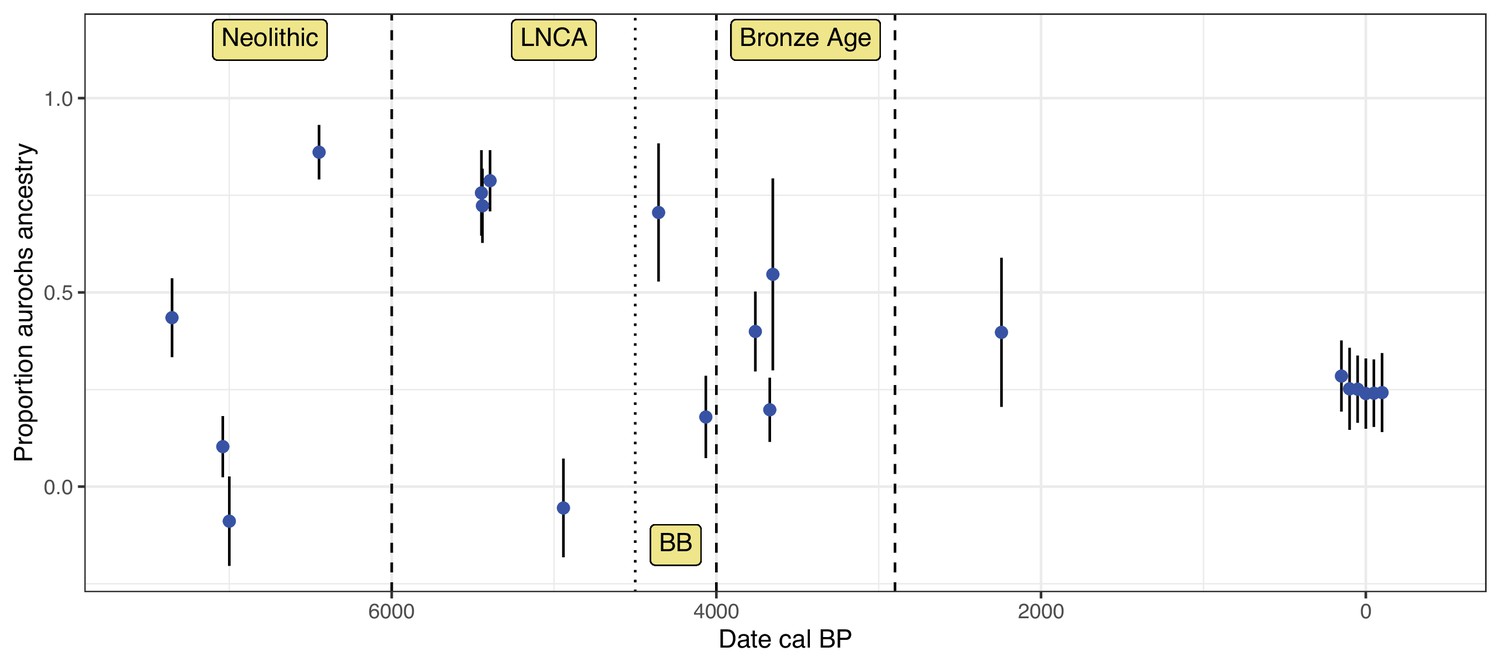
Development of aurochs ancestry over time.
Estimates of aurochs ancestry (estimated using the f4 ratio with Bed3 as European aurochs source) in directly dated post-Mesolithic Iberian samples over time. Error bars indicate the 95% confidence interval estimated using a block-jackknife procedure. Modern Iberian whole-genome sequenced Lidia individuals are added around date 0 with some horizontal jitter. Approximate boundaries for the main sampling periods are indicated by dashed vertical lines.
Figure 3
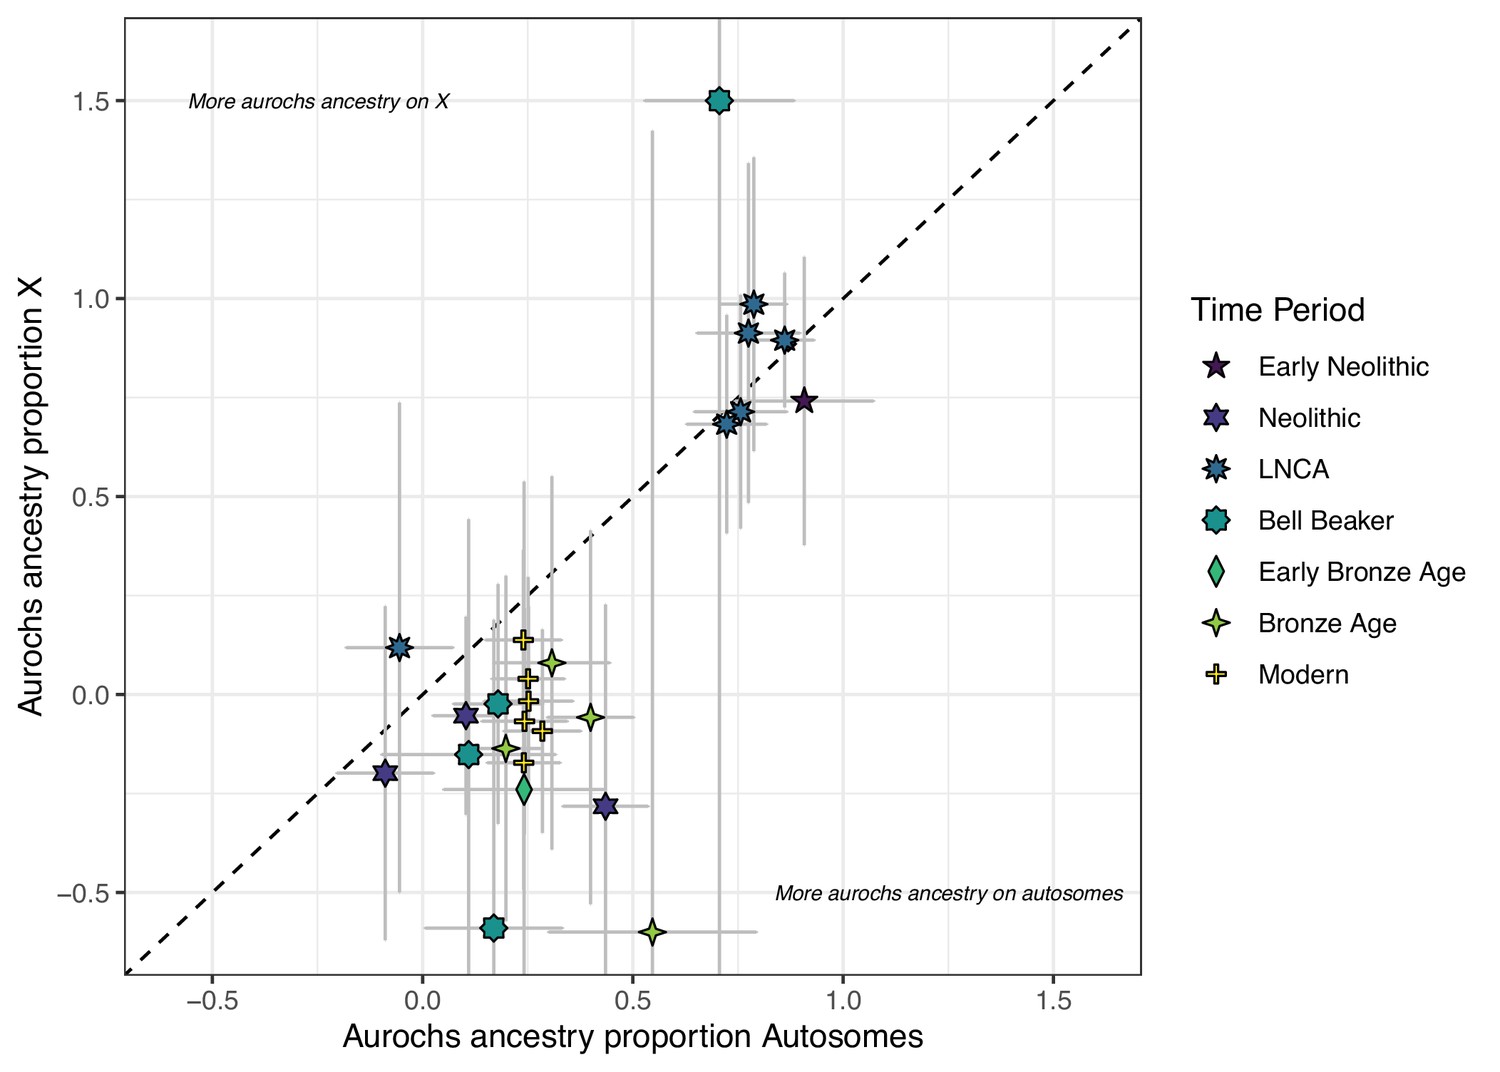
Comparison of f4 ratio estimated aurochs ancestry of post-Mesolithic Iberian samples on the autosomes vs X chromosomes.
Error bars indicate the 95% confidence interval estimated using a block jackknife procedure.
Figure 4 with 1 supplement
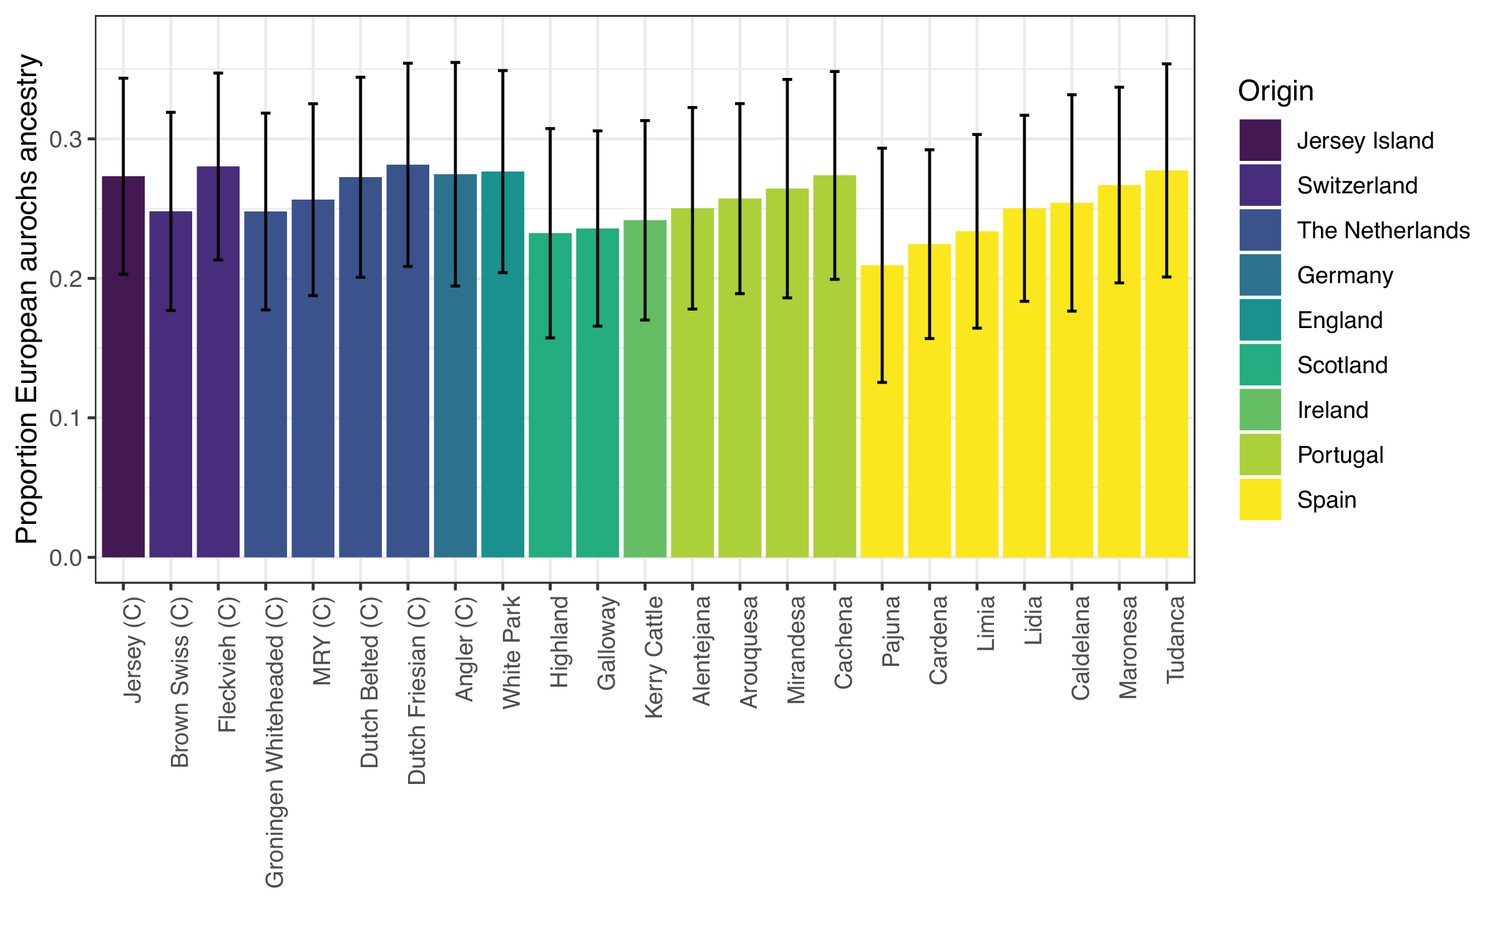
qpAdm estimates of aurochs ancestry in modern Western European cattle breeds from the Upadhyay et al., 2017, dataset.
Commercial breeds are marked with a ‘C’. The figure is only showing breeds with feasible and non-rejected two-source models, as all results are shown in Appendix 2—table 1. Error bars are showing block-jackknife estimates of the 95% confidence interval.
Figure 4—figure supplement 1

qpAdm aurochs ancestry estimates for the six individual Lidia genomes.
Figure 5
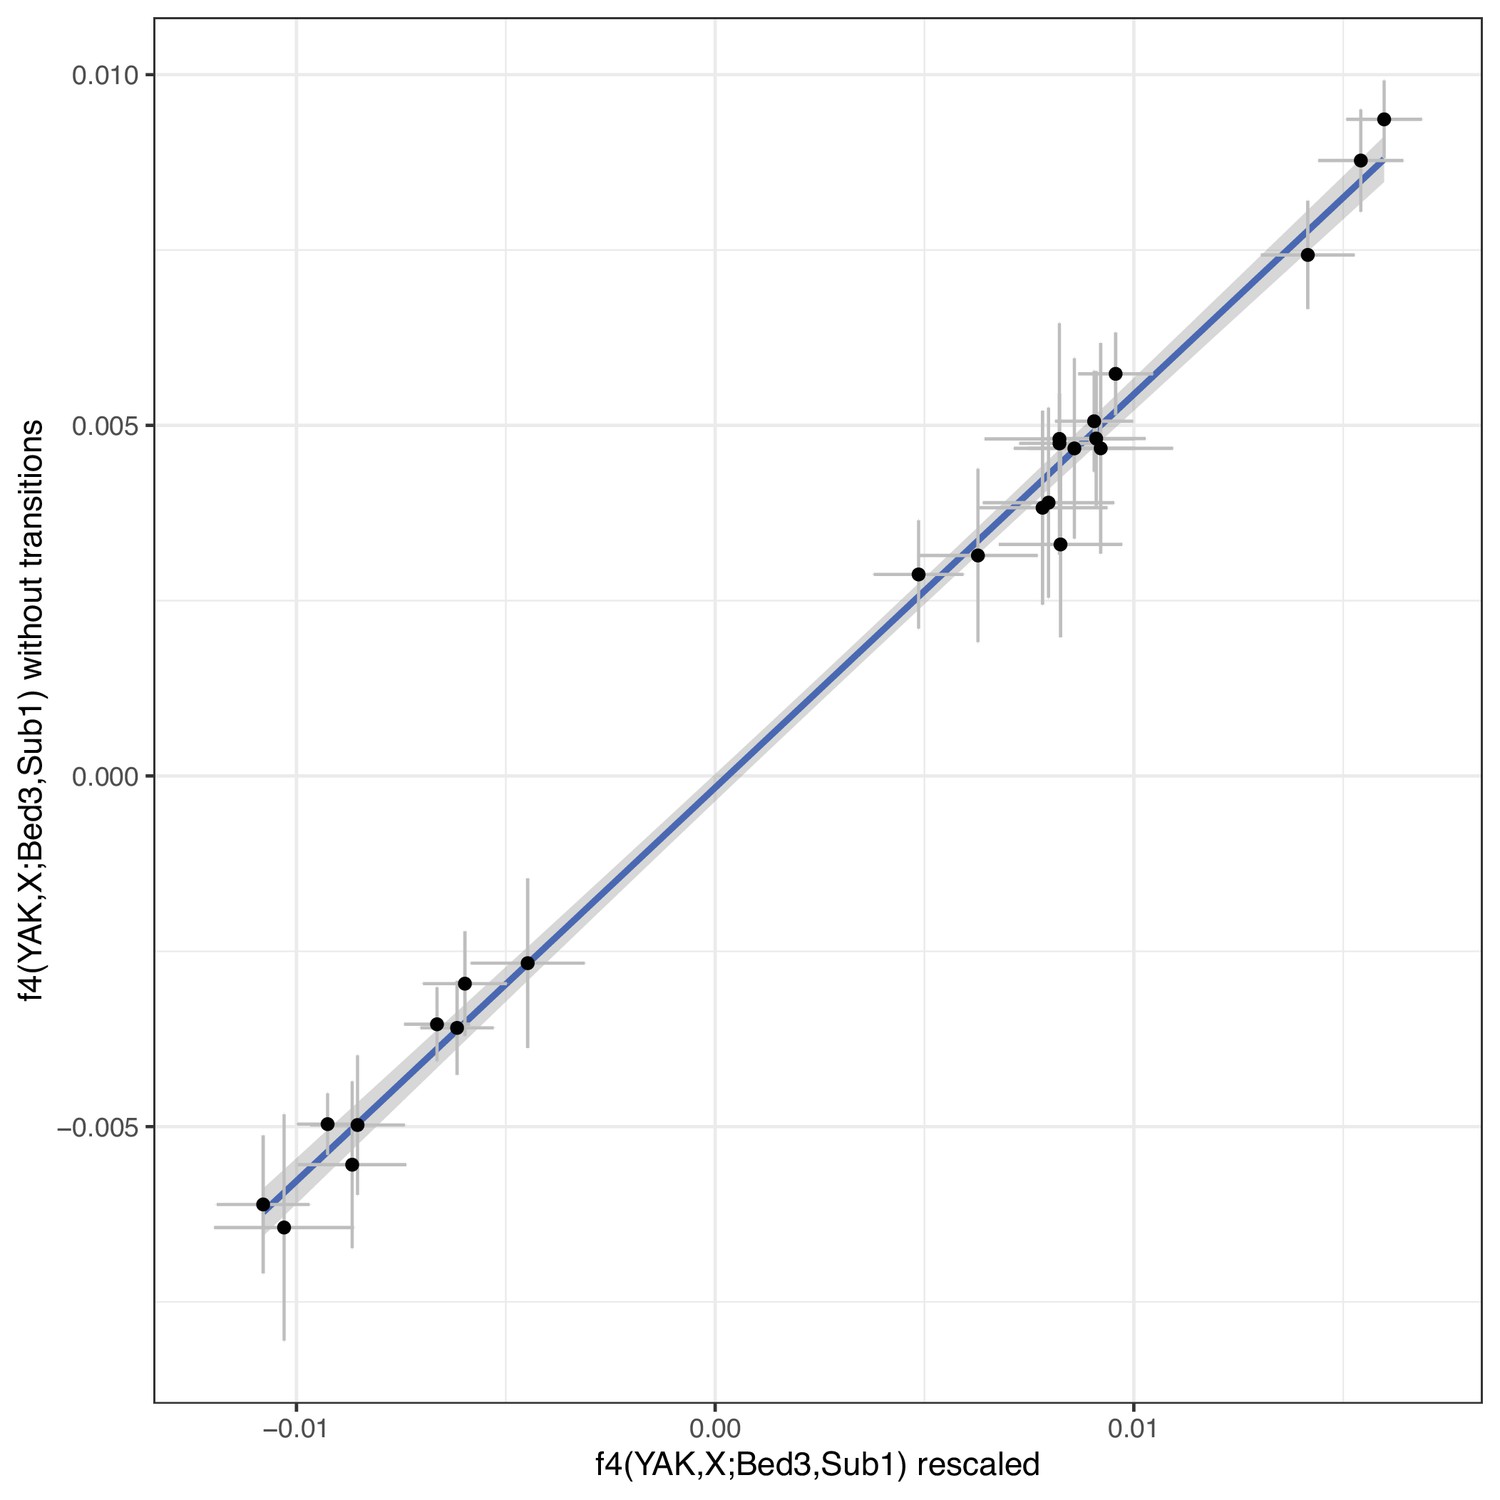
f4 statistics contrasting our newly sequenced samples to a reference domestic individual and a reference European aurochs.
The f4 statistics were calculated for two different versions of the bam files: with rescaled bases in fragment ends vs untreated bam files but an SNP panel excluding transitions. The blue line indicates a linear regression with confidence interval. Error bars indicate 95% confidence intervals estimated using a block jackknife procedure.
Figure 6
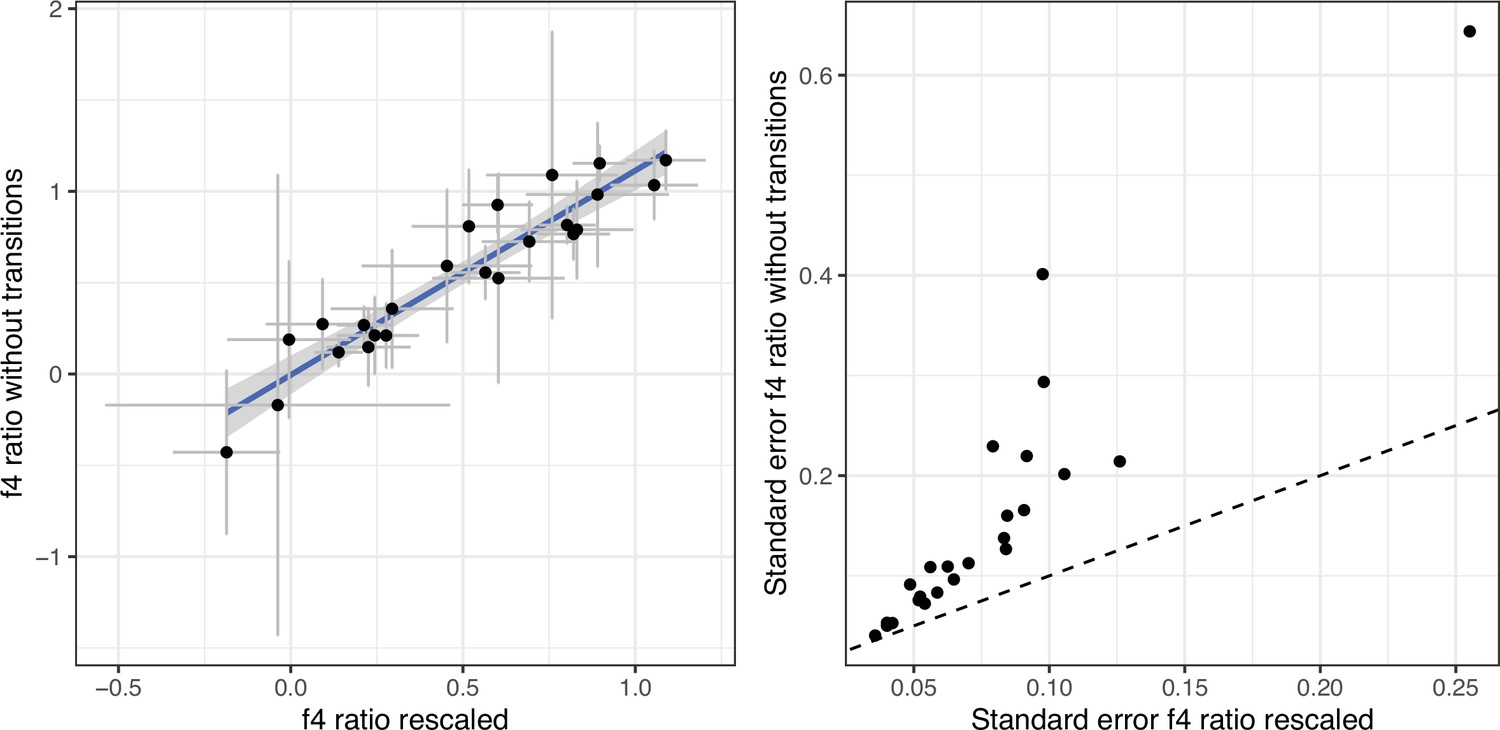
f4ratios estimating European aurochs ancestry in our newly sequenced Iberian samples.
The f4 ratios were calculated for two different versions of the bam files: with rescaled bases in fragment ends vs untreated bam files but an SNP panel excluding transitions. The right panel shows the standard errors for the f4 ratio estimates, the dashed line would correspond to equal standard errors for the two panels. Error bars indicate 95% confidence intervals estimated using a block jackknife procedure.
Appendix 2—figure 1
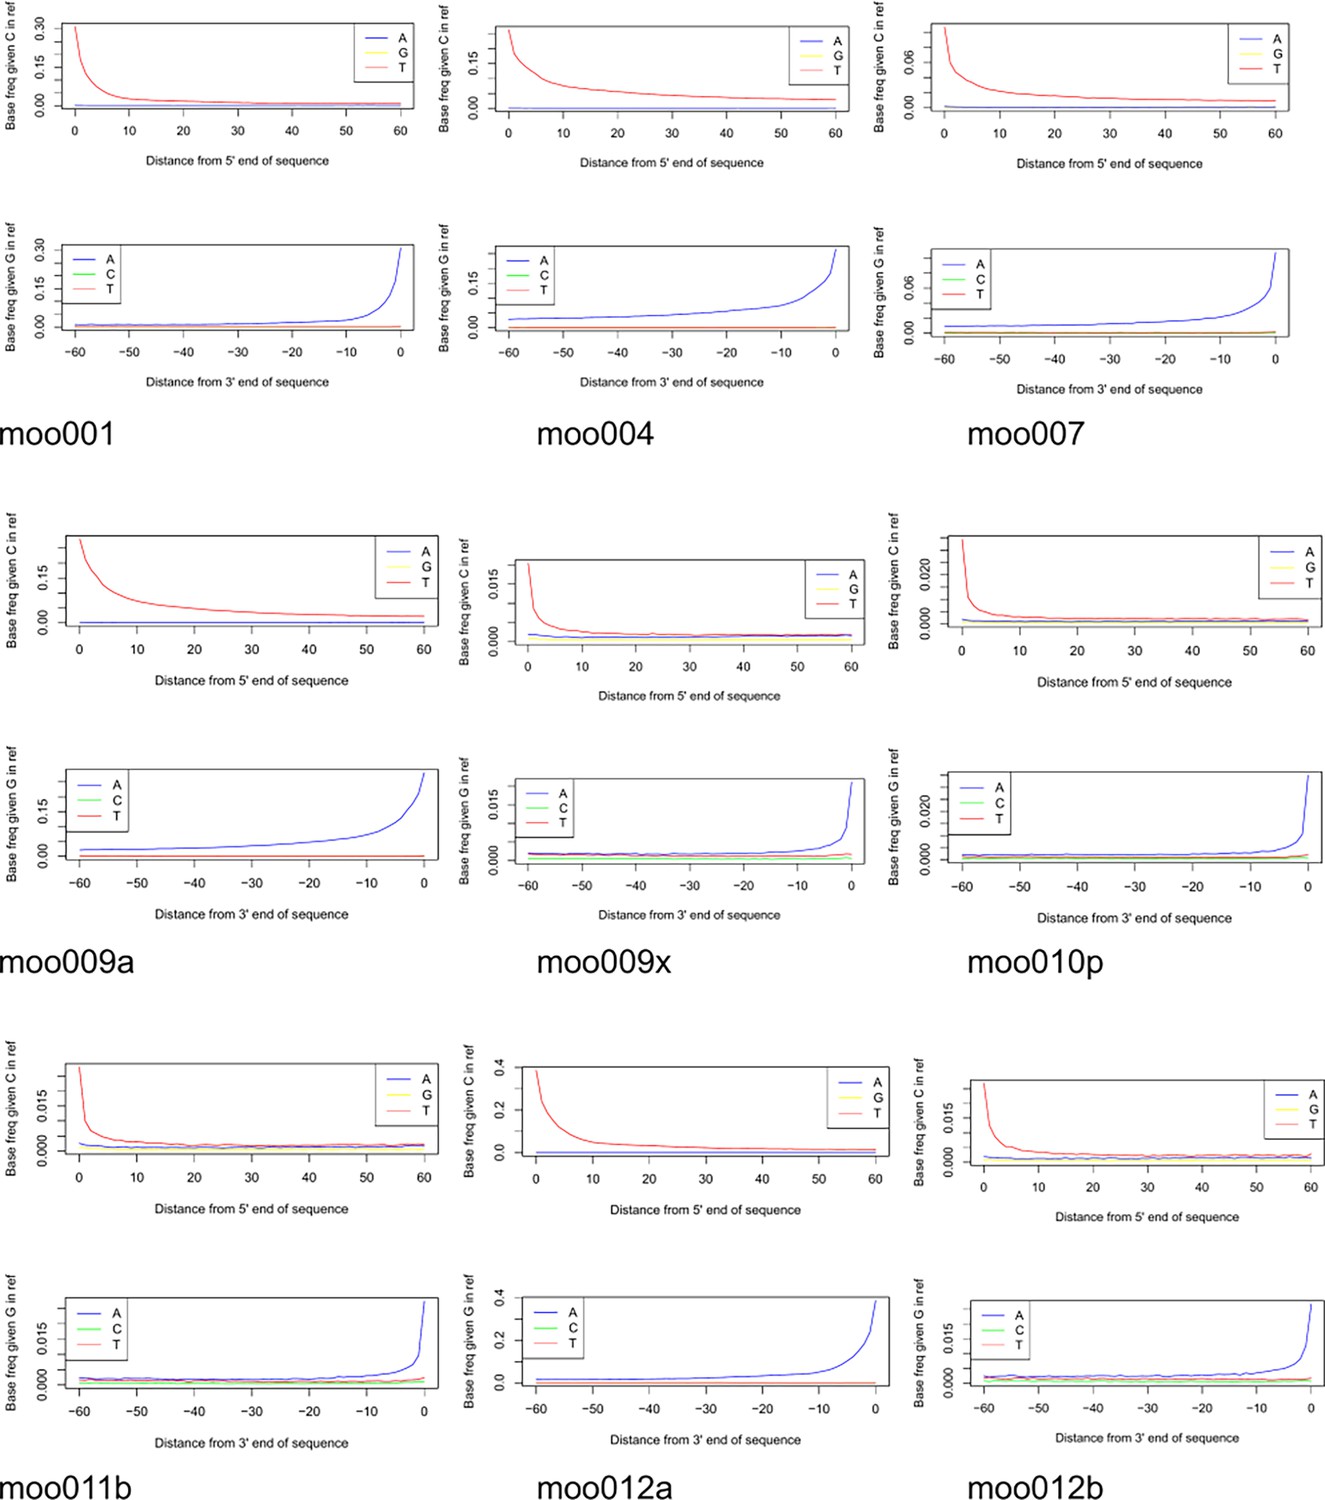
Misincorporation plots for the samples moo001–moo012b included in nuclear analysis.
Appendix 2—figure 2
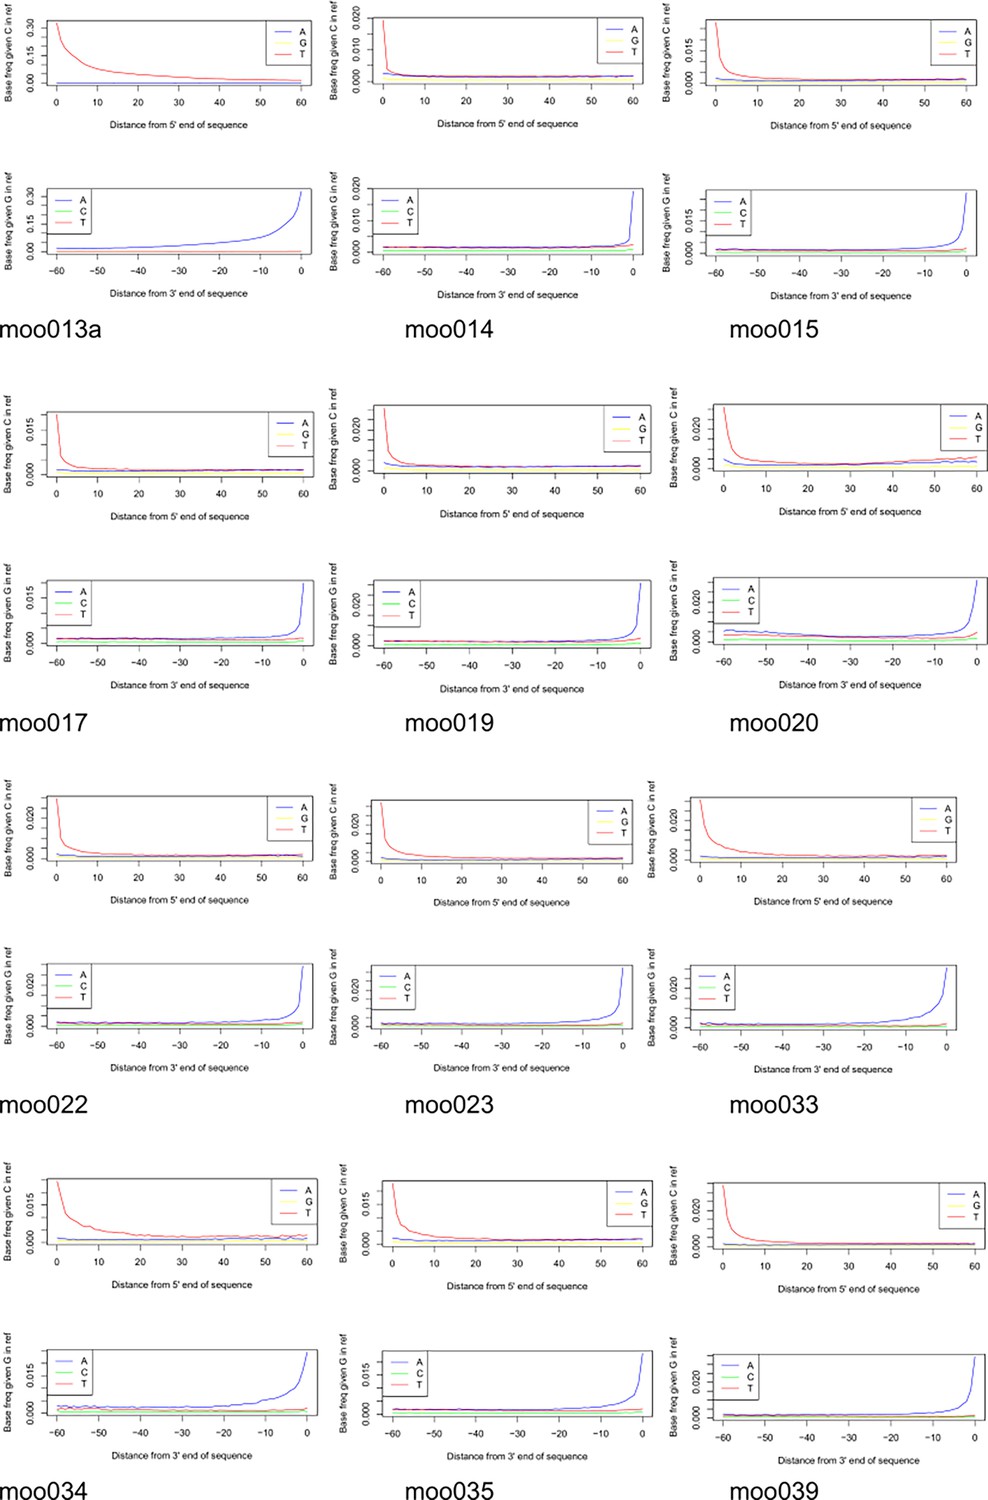
Misincorporation plots for the samples moo013a–moo039 included in nuclear analysis.
Appendix 2—figure 3
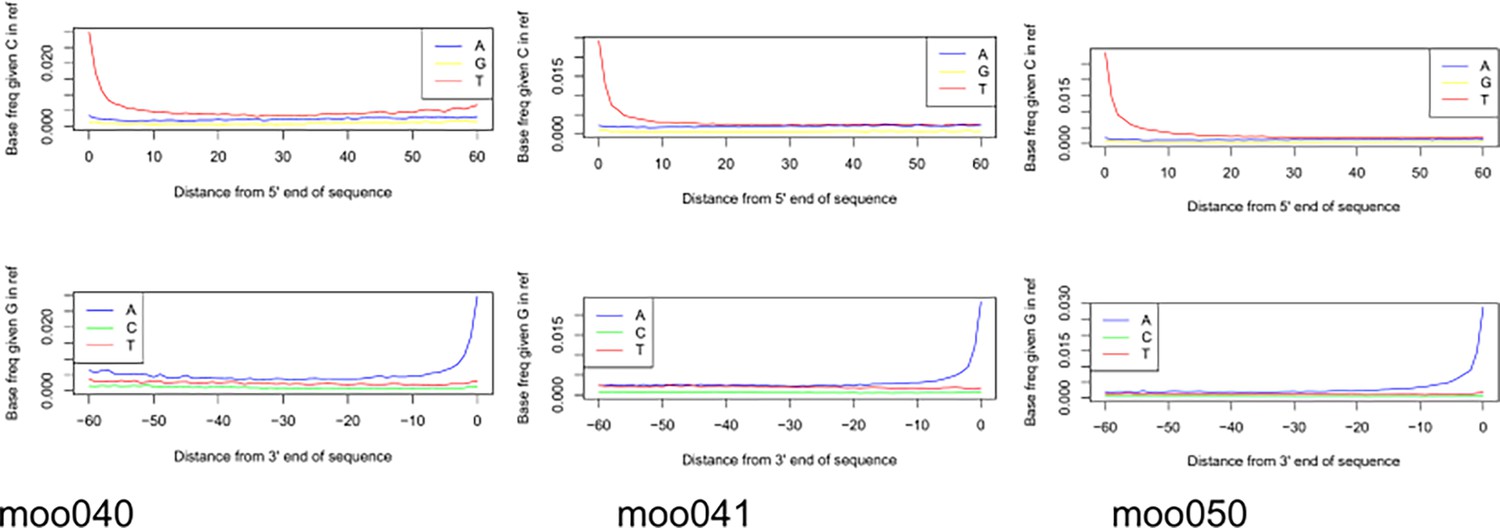
Misincorporation plots for the samples moo040–moo050 included in nuclear analysis.
Appendix 2—figure 4
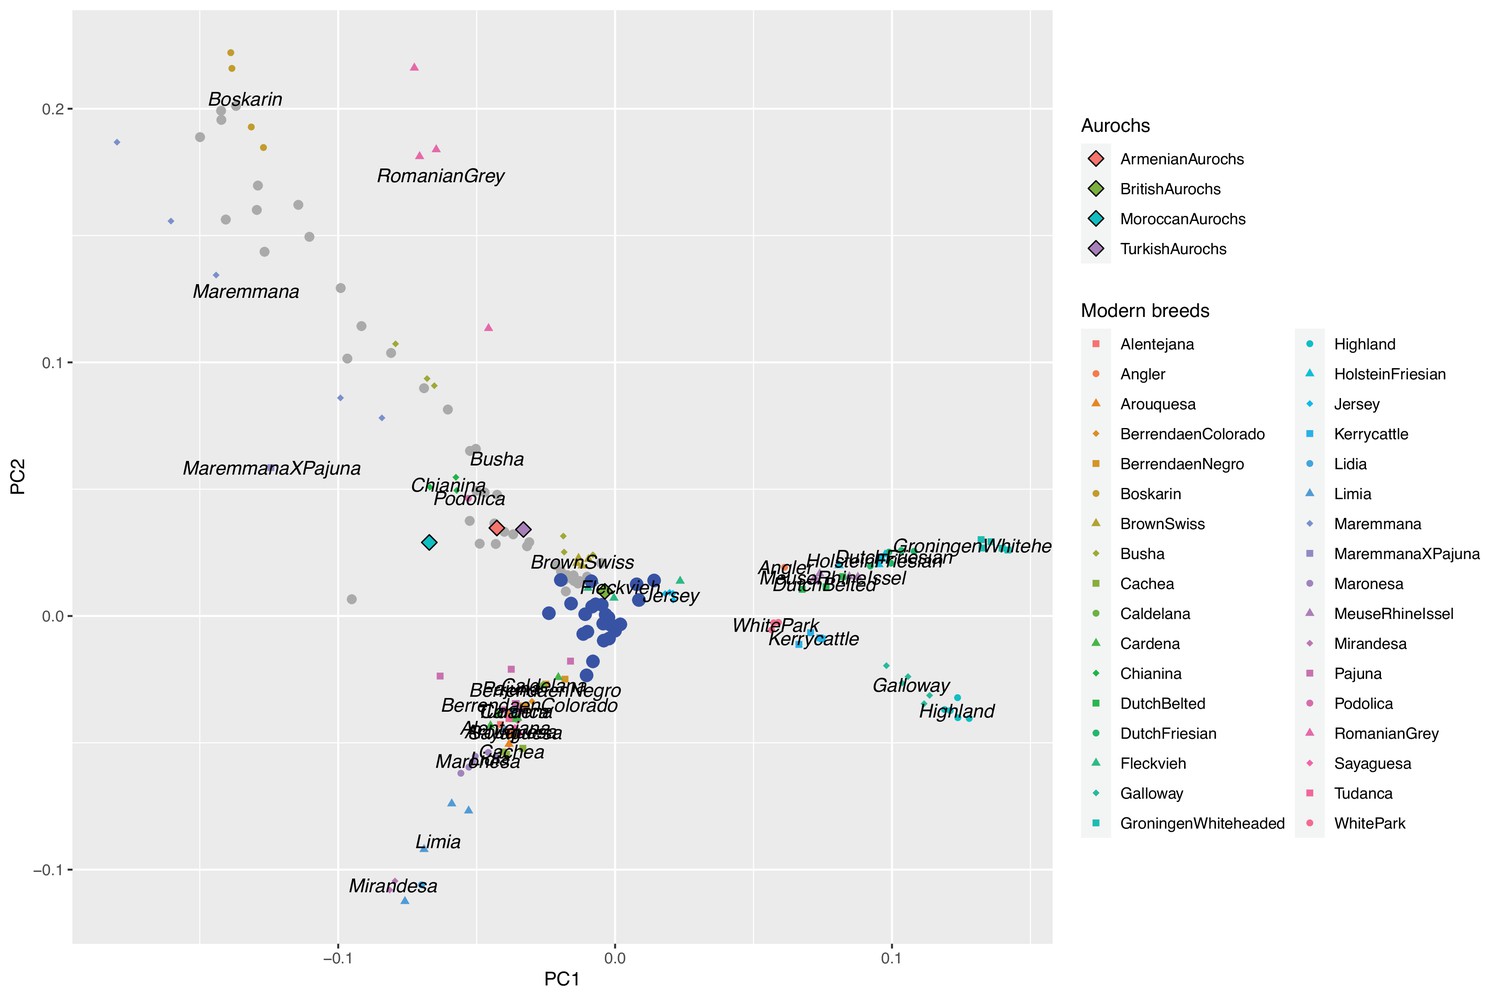
Biplot of PC1 and PC2 defined by modern western breeds together with ancient samples projected onto the PC-space.
Aurochs genomes are shown as diamonds, ancient Iberian samples as blue dots, and other ancient samples from Verdugo et al., 2019, as grey dots.
Appendix 2—figure 5
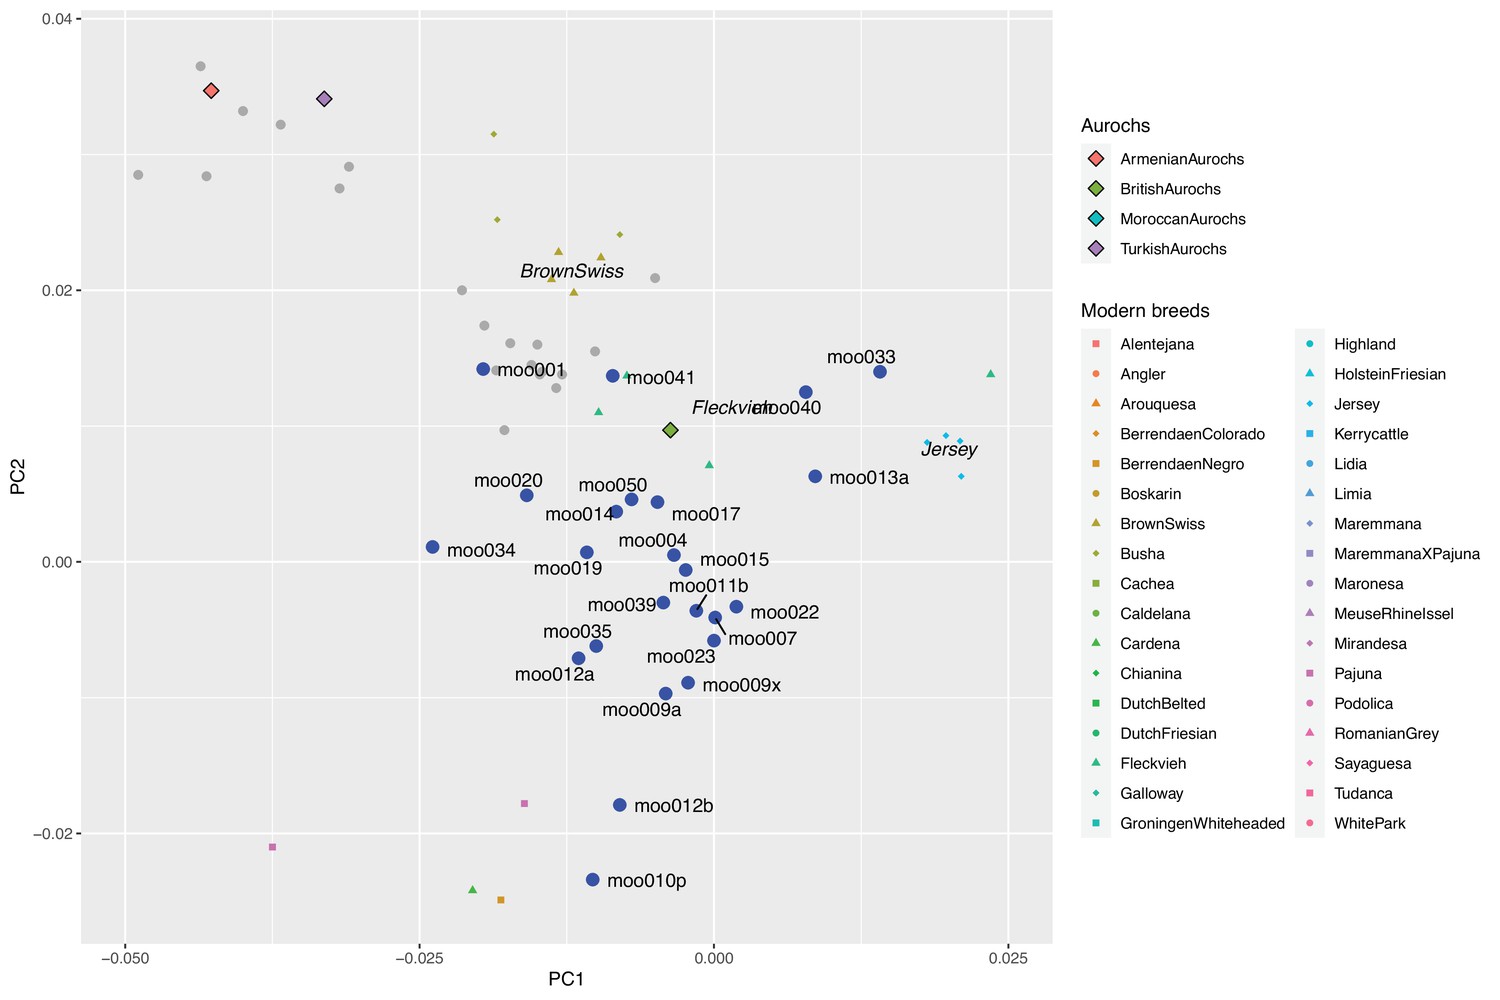
Zoomed version of a biplot of PC1 and PC2 defined by modern western breeds together with ancient samples projected onto the PC-space.
Aurochs genomes are shown as diamonds, ancient Iberian samples as blue dots, and other ancient samples from Verdugo et al., 2019, as grey dots. Sample IDs are added for Iberian samples.
Appendix 2—figure 6
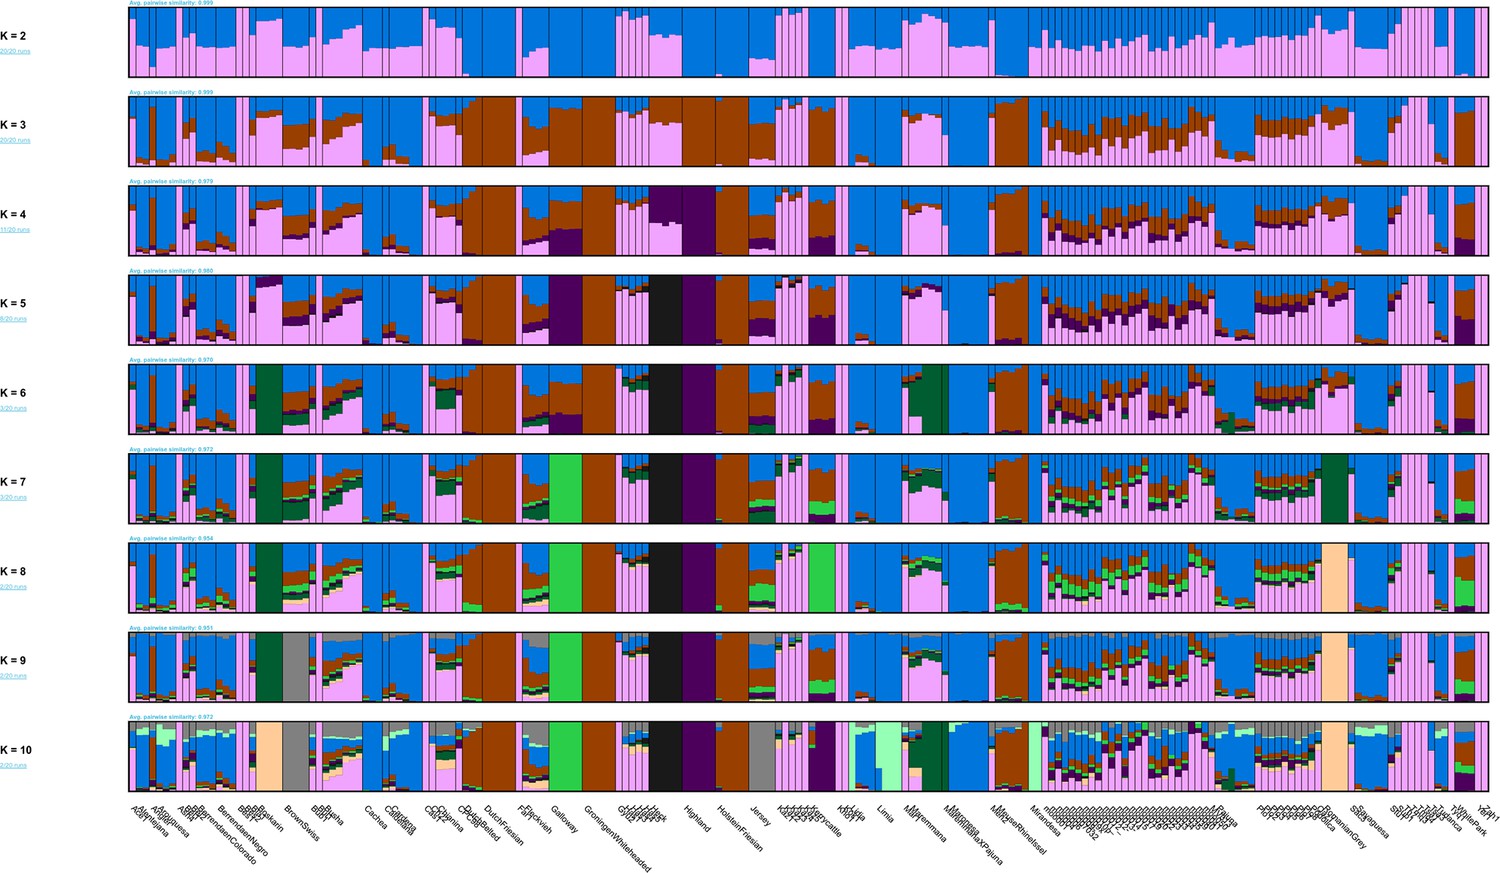
Model-based clustering results for modern breeds and ancient Bos samples from K=2 to K=10.
Appendix 2—figure 7
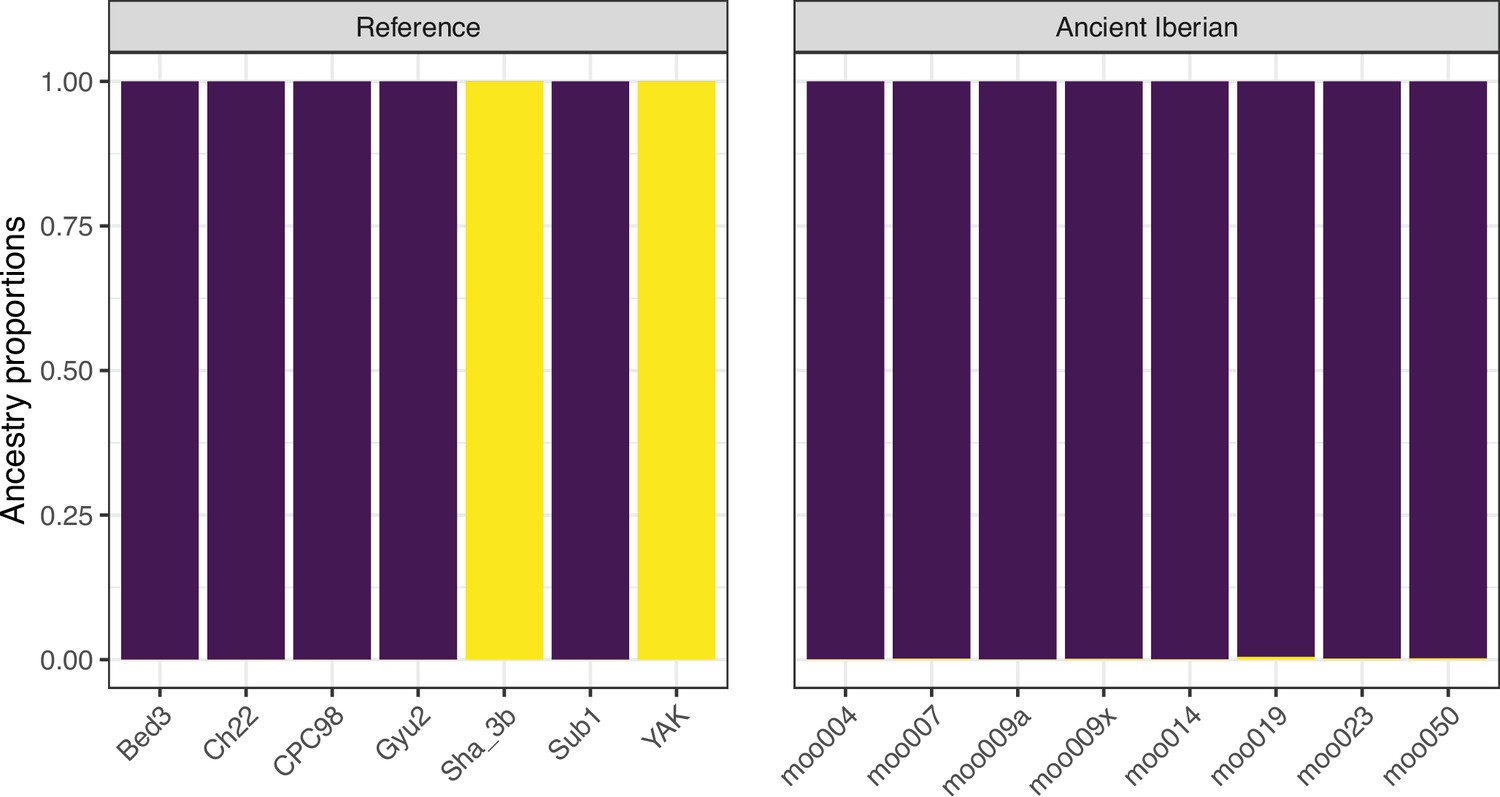
Structf4 results for K=2.
Appendix 2—figure 8
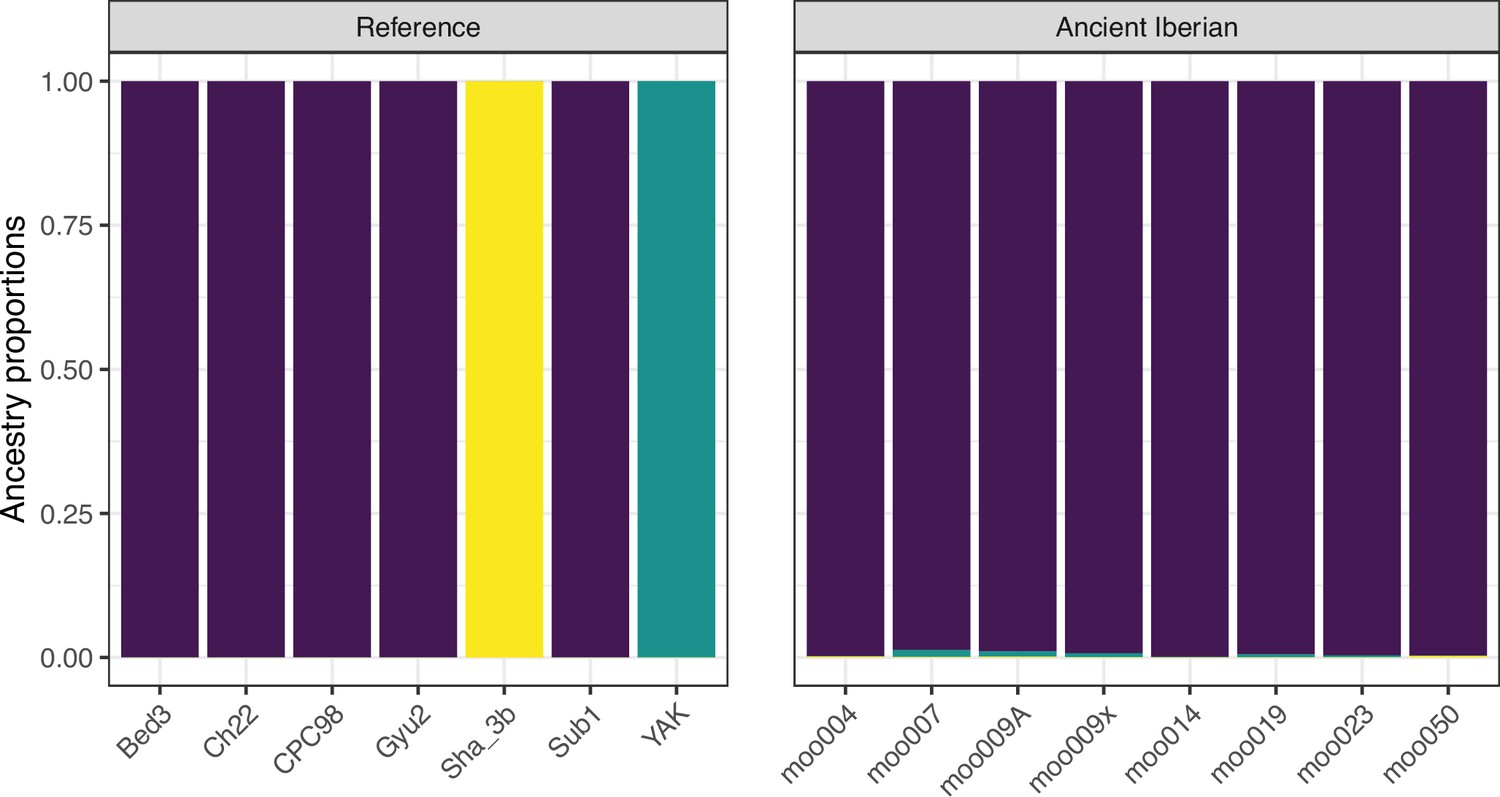
Structf4 results for K=3.
Appendix 2—figure 9
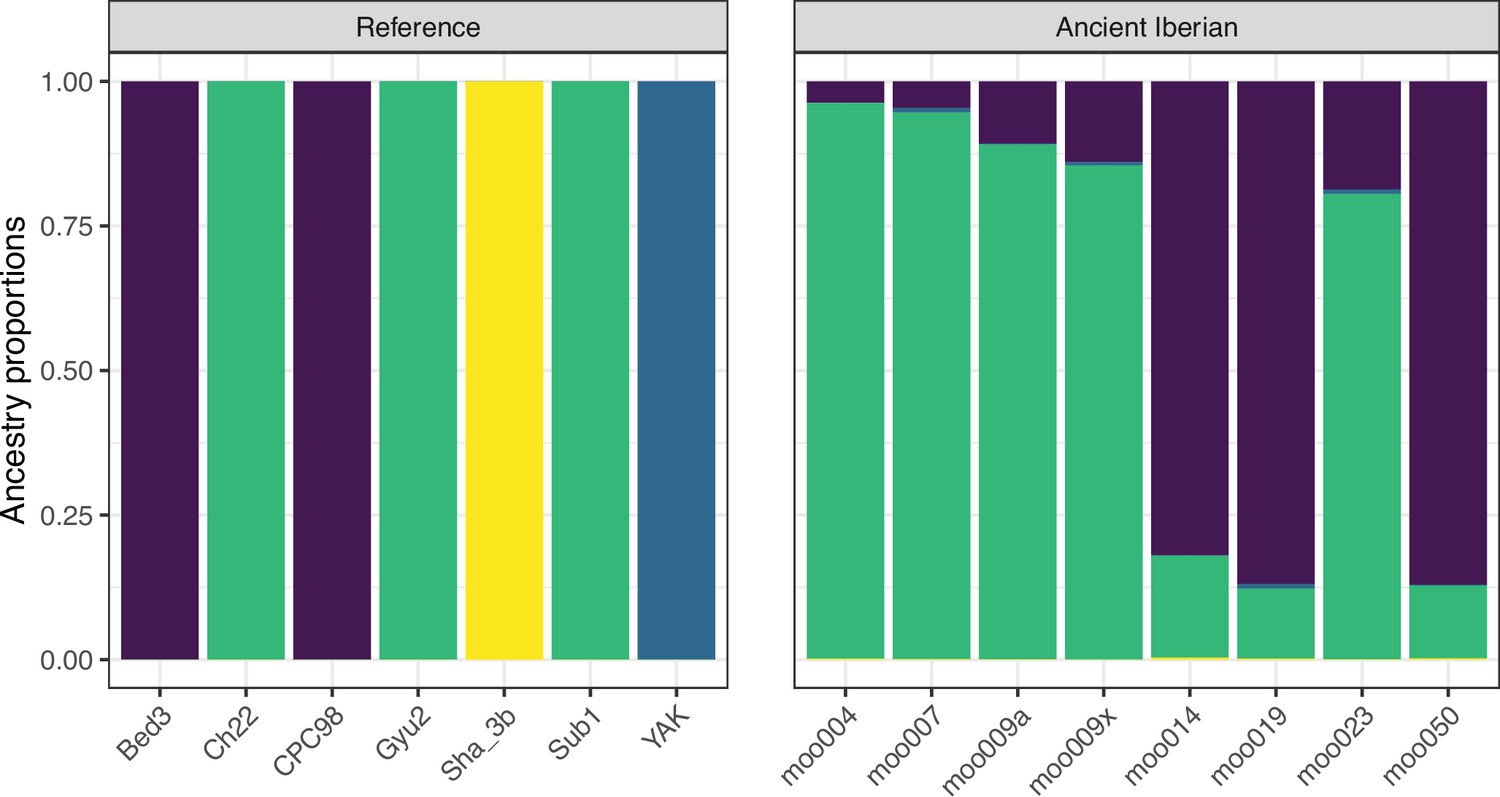
Structf4 results for K=4.
Appendix 2—figure 10
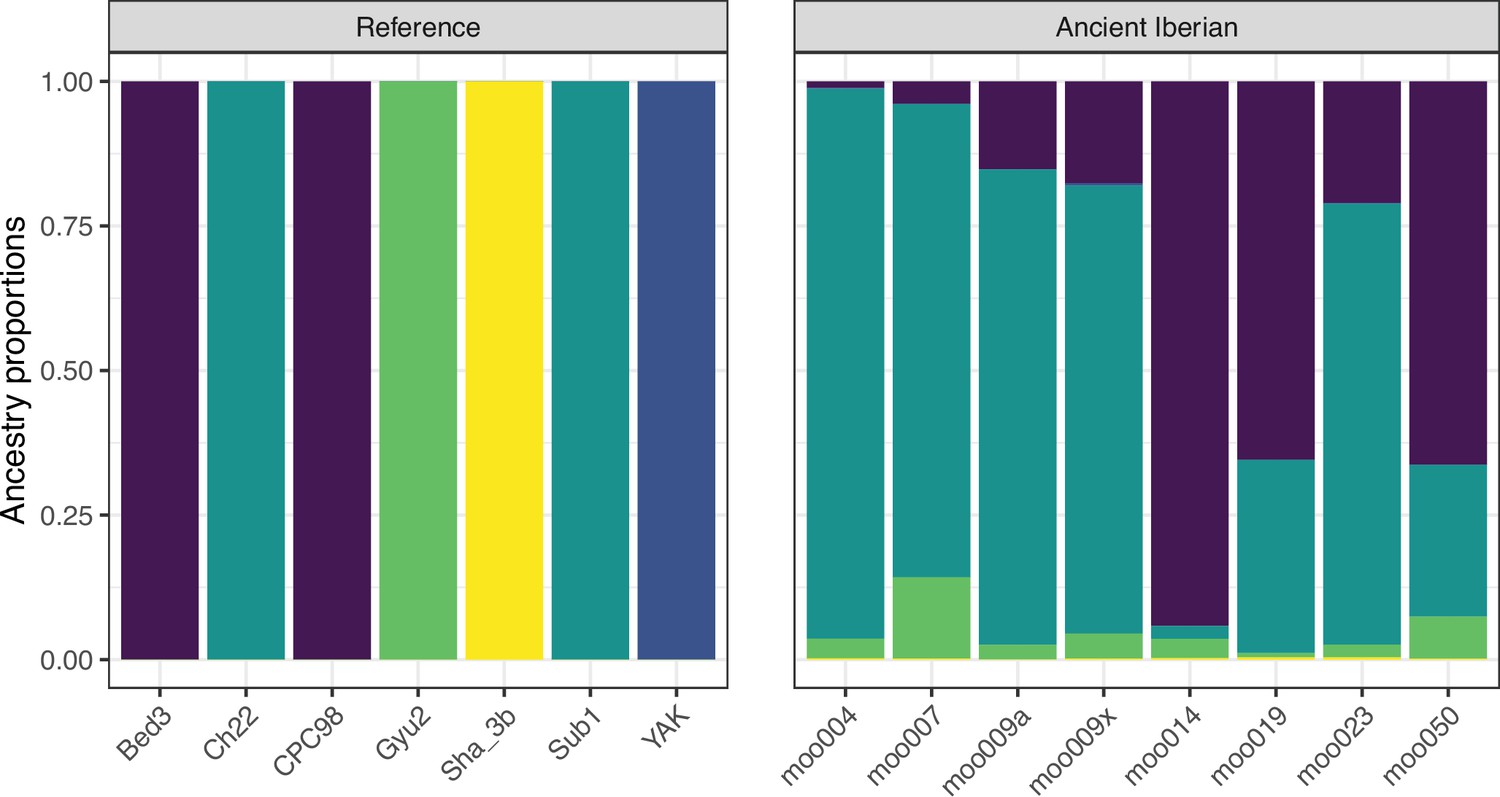
Structf4 results for K=5.
Appendix 3—figure 1
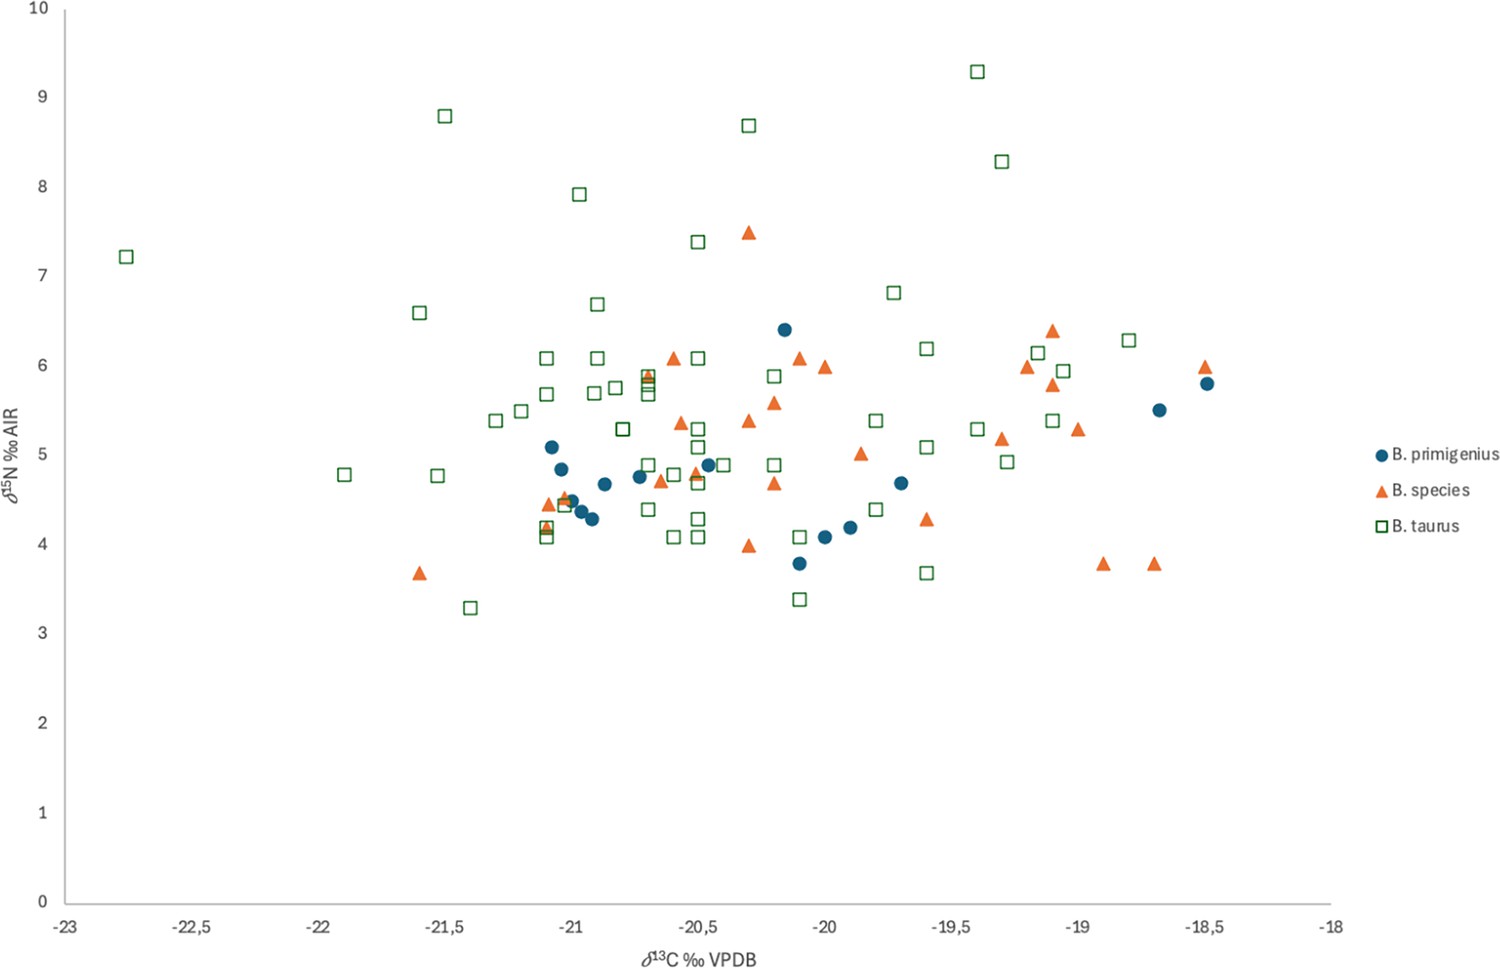
The distribution of 15N vs 13C for the samples, identified on the basis of morphology.
Tables
Table 1
European aurochs ancestry proportions in post-Mesolithic Iberian Bos samples.
Square brackets are showing block-jackknife estimates of the 95% confidence interval. f4 ratio and qpAdm are using Bed3 as source of European aurochs ancestry unless noted otherwise. Footnotes are added when deviations from the two-source model were needed. Struct-f4 was run in semi-supervised mode to estimate ancestry in the Iberian samples with K=5 as the different ancestries separated at this point. Only individuals with at least 0.1× coverage were included in this analysis to ensure convergence. LNCA = Late Neolithic/Chalcolithic.
| Sample ID | Site | Period | Date cal BP | f4 ratio | qpAdm | Struct-f4 (K=5) |
|---|---|---|---|---|---|---|
| moo012a | El Portalón | Early Neolithic | contextual | 0.908 [0.743, 1.072] | 0.928 [0.77, 1.085] | – |
| moo004 | Els Trocs | Neolithic | 7152–6890 | 0.103 [0.025, 0.182] | 0.06 [0.026, 0.098]* | 0.01¶ |
| moo007 | Els Trocs | Neolithic | 7151–6890 | –0.089 [-0.204, 0.026] | 0.073 [0.033, 0.113]* | 0.039¶ |
| moo014 | El Portalón | Neolithic | 6491–6403 | 0.861 [0.791, 0.931] | 0.942 [0.905, 0.979]† | 0.942¶ |
| moo039 | Mendandia | Neolithic | 7426–7280 | 0.435 [0.334, 0.536] | 0.866 [0.76, 0.971] | – |
| moo015 | El Portalón | LNCA | 5041–4842 | –0.055 [-0.182, 0.072] | 0.444 [0.32, 0.565] | – |
| moo017 | El Portalón | LNCA | 5567–5326 | 0.756 [0.646, 0.866] | 0.811 [0.769, 0.853]* | – |
| moo019 | El Portalón | LNCA | 5556–5325 | 0.723 [0.628, 0.818] | 0.828 [0.786, 0.87]* | 0.654 |
| moo020 | El Portalón | LNCA | contextual | 0.775 [0.652, 0.897] | 0.944 [0.80, 1.085] | – |
| moo050 | El Portalón | LNCA | 5468–5320 | 0.788 [0.709, 0.866] | 0.809 [0.773, 0.845]* | 0.663** |
| moo011b | El Portalón | Bell Beaker | contextual | 0.109 [-0.097, 0.316] | 0.667 [0.47, 0.865] | – |
| moo012b | El Portalón | Bell Beaker | 4421–4291 | 0.706 [0.528, 0.883] | 0.326 [0.258, 0.394]* | – |
| moo022 | El Portalón | Bell Beaker | contextual | 0.169 [0.006, 0.332] | 0.729 [0.55, 0.910] | – |
| moo023 | El Portalón | Bell Beaker | 4153–3976 | 0.179 [0.073, 0.285] | 0.641 [0.54, 0.738] | 0.21¶ |
| moo033 | El Portalón | Early Bronze Age | contextual | 0.241 [0.050, 0.432] | 0.987 [0.79, 1.182] | – |
| moo009a | El Portalón | Bronze Age | 3884–3635 | 0.399 [0.297, 0.502] | 0.284 [0.244, 0.324]* | 0.152¶ |
| moo009x | El Portalón | Bronze Age | 3829–3513 | 0.198 [0.115, 0.280] | 0.259 [0.203, 0.315]‡ | 0.176¶ |
| moo034 | El Portalón | Bronze Age | 3811–3492 | 0.547 [0.300, 0.794] | 0.112 [-0.061, 0.285]§ | – |
| moo035 | El Portalón | Bronze Age | contextual | 0.307 [0.170, 0.445] | 0.821 [0.68, 0.963] | – |
| moo010p | El Portalón | Roman | 2334–2156 | 0.397 [0.205, 0.589] | 0.281 [0.217, 0.345]* | – |
-
*
To produce a fitting and feasible model (p>0.01) a minor contribution (≤ 5%) of indicine ancestry is required to fit the data.
-
†
Model does not fit with Bed3 as European aurochs source but fits well (p=0.49) when using CPC98.
-
‡
To produce a fitting and feasible model (p>0.01) a contribution of 33.7% Caucasus aurochs ancestry (Gyu2) is required to fit the data. This additional source is not well resolved as the standard error is large (21.2%).
-
§
To produce a fitting and feasible model (p>0.01) a contribution of 85.9% Caucasus aurochs ancestry (Gyu2) is required to fit the data. This additional source is not well resolved as the standard error is large (74.6%).
-
¶
Struct-f4 also assigns a small proportion of Caucasus aurochs ancestry (Gyu2) to this individual (<5%).
-
**
Struct-f4 also assigns a proportion of Caucasus aurochs ancestry (Gyu2) to this individual (14.0%).
Appendix 2—table 1
qpAdm modelling of the genomic ancestry in modern European cattle breeds under a two-source model using European aurochs (Bed3) and Anatolian Neolithic cattle (Sub1) as representatives of the sources.
Genotypes for modern breeds from Upadhyay et al., 2017 (C=commercial breed).
| Breed code | Breed | Origin | Proportion European aurochs | Proportion Anatolia Neolithic | Standard error | p-Value |
|---|---|---|---|---|---|---|
| AL01 | Alentejana | Portugal | 0.2502 | 0.7498 | 0.0361 | 0.1030 |
| AN01 | Angler (C) | Germany | 0.2746 | 0.7254 | 0.0401 | 0.0747 |
| AR01 | Arouquesa | Portugal | 0.2572 | 0.7428 | 0.0341 | 0.0555 |
| BC01 | Berrenda en colorado | Spain | 0.2738 | 0.7262 | 0.0354 | 0.0077 |
| BN01 | Berrenda en negro | Spain | 0.3005 | 0.6995 | 0.0343 | 0.0014 |
| BS01 | Brown Swiss (C) | Switzerland | 0.2480 | 0.7520 | 0.0355 | 0.0343 |
| CA01 | Cardena | Spain | 0.2245 | 0.7755 | 0.0338 | 0.0141 |
| CC01 | Cachena | Portugal | 0.2738 | 0.7262 | 0.0372 | 0.0564 |
| CL01 | Caldelana | Spain | 0.2540 | 0.7460 | 0.0388 | 0.3139 |
| DB01 | Dutch Belted (C) | The Netherlands | 0.2724 | 0.7276 | 0.0358 | 0.2135 |
| DF01 | Dutch Friesian (C) | The Netherlands | 0.2814 | 0.7186 | 0.0364 | 0.0413 |
| FL01 | Fleckvieh (C) | Switzerland | 0.2801 | 0.7199 | 0.0335 | 0.0685 |
| GA01 | Galloway | Scotland | 0.2357 | 0.7643 | 0.0350 | 0.4203 |
| GW01 | Groningen Whiteheaded (C) | The Netherlands | 0.2479 | 0.7521 | 0.0353 | 0.3394 |
| HF01 | Holstein Friesian (C) | The Netherlands | 0.3402 | 0.6598 | 0.0352 | 0.0068 |
| HL01 | Highland | Scotland | 0.2323 | 0.7677 | 0.0375 | 0.0788 |
| JE01 | Jersey (C) | Jersey Island | 0.2732 | 0.7268 | 0.0352 | 0.3093 |
| KC01 | Kerry Cattle | Ireland | 0.2416 | 0.7584 | 0.0357 | 0.1596 |
| LI01 | Lidia | Spain | 0.2502 | 0.7498 | 0.0333 | 0.2204 |
| LM01 | Limia | Spain | 0.2337 | 0.7663 | 0.0347 | 0.3224 |
| ME01 | Maronesa | Spain | 0.2668 | 0.7332 | 0.0351 | 0.0339 |
| MI01 | Mirandesa | Portugal | 0.2643 | 0.7357 | 0.0391 | 0.0942 |
| MN01 | Maronesa | Spain | 0.2718 | 0.7282 | 0.0361 | 0.0400 |
| MR01 | MRY (C) | The Netherlands | 0.2564 | 0.7436 | 0.0344 | 0.0769 |
| PA01 | Pajuna | Spain | 0.2415 | 0.7585 | 0.0327 | 0.0097 |
| PA02 | Pajuna | Spain | 0.2093 | 0.7907 | 0.0420 | 0.0114 |
| SA01 | Sayaguesa | Spain | 0.2143 | 0.7857 | 0.0339 | 0.0021 |
| TU | Tudanca | Spain | 0.2773 | 0.7227 | 0.0382 | 0.1749 |
| TU01 | Tudanca | Spain | 0.2580 | 0.7420 | 0.0413 | 0.0295 |
| WP01 | White Park | England | 0.2765 | 0.7235 | 0.0362 | 0.5794 |
-
Italic p-values indicate rejected models with p<0.05.
Appendix 2—table 2
D statistics verifying the results of Upadhyay et al., 2017.
pop3 is a Western European breed while pop4 is an Alpine breed. Negative values indicate an excess of allele sharing between pop2 and pop3.
| pop1 | pop2 | pop3 | pop4 | D | SE | Z | n |
|---|---|---|---|---|---|---|---|
| YAK | CPC98 | EL01 | FL01 | –0.02652393 | 0.00456532 | –5.80987815 | 450246 |
| YAK | CPC98 | EL01 | BS01 | –0.03070768 | 0.00487875 | –6.29417402 | 450241 |
| YAK | CPC98 | GA01 | FL01 | –0.03044061 | 0.00392968 | –7.74633205 | 450234 |
| YAK | CPC98 | GA01 | BS01 | –0.03442162 | 0.00434763 | –7.91732385 | 450223 |
| YAK | CPC98 | WP01 | FL01 | –0.02563453 | 0.00397421 | –6.45021264 | 450035 |
| YAK | CPC98 | WP01 | BS01 | –0.02957367 | 0.00450710 | –6.56157650 | 450031 |
| YAK | CPC98 | HL01 | FL01 | –0.02842438 | 0.00387999 | –7.32588339 | 450320 |
| YAK | CPC98 | HL01 | BS01 | –0.03246308 | 0.00432781 | –7.50104292 | 450319 |
| YAK | CPC98 | KC01 | FL01 | –0.02672545 | 0.00390891 | –6.83706658 | 450352 |
| YAK | CPC98 | KC01 | BS01 | –0.03070730 | 0.00431715 | –7.11286432 | 450340 |
| YAK | CPC98 | JE01 | FL01 | –0.01497177 | 0.00407495 | –3.67409596 | 450360 |
| YAK | CPC98 | JE01 | BS01 | –0.01907032 | 0.00441154 | –4.32282854 | 450342 |
| YAK | CPC98 | DB01 | FL01 | –0.00874258 | 0.00384590 | –2.27322063 | 450195 |
| YAK | CPC98 | DB01 | BS01 | –0.01281078 | 0.00438547 | –2.92118480 | 450193 |
| YAK | CPC98 | DF01 | FL01 | –0.01004034 | 0.00368917 | –2.72157043 | 450373 |
| YAK | CPC98 | DF01 | BS01 | –0.01412771 | 0.00421435 | –3.35228684 | 450371 |
| YAK | CPC98 | HF01 | FL01 | –0.00512796 | 0.00341739 | –1.50055117 | 450378 |
| YAK | CPC98 | HF01 | BS01 | –0.00914451 | 0.00385993 | –2.36908732 | 450376 |
| YAK | CPC98 | MR01 | FL01 | –0.01566191 | 0.00346923 | –4.51451546 | 450313 |
| YAK | CPC98 | MR01 | BS01 | –0.01967925 | 0.00393753 | –4.99786229 | 450307 |
| YAK | CPC98 | AL01 | FL01 | –0.00515036 | 0.00420798 | –1.22395152 | 450178 |
| YAK | CPC98 | AL01 | BS01 | –0.00916224 | 0.00476407 | –1.92319693 | 450170 |
| YAK | CPC98 | AR01 | FL01 | –0.00733482 | 0.00358002 | –2.04881890 | 450360 |
| YAK | CPC98 | AR01 | BS01 | –0.01140575 | 0.00397343 | –2.87050092 | 450357 |
| YAK | CPC98 | CC01 | FL01 | –0.01185512 | 0.00429875 | –2.75780703 | 450210 |
| YAK | CPC98 | CC01 | BS01 | –0.01592615 | 0.00467210 | –3.40877812 | 450196 |
| YAK | CPC98 | CL01 | FL01 | –0.00620692 | 0.00463521 | –1.33908070 | 449745 |
| YAK | CPC98 | CL01 | BS01 | –0.01051648 | 0.00500205 | –2.10243173 | 449745 |
| YAK | CPC98 | MI01 | FL01 | –0.00384595 | 0.00456479 | –0.84252575 | 450236 |
| YAK | CPC98 | MI01 | BS01 | –0.00801398 | 0.00496662 | –1.61356702 | 450221 |
| YAK | CPC98 | BC01 | FL01 | –0.00087993 | 0.00355382 | –0.24760203 | 450356 |
| YAK | CPC98 | BC01 | BS01 | –0.00498252 | 0.00395135 | –1.26096675 | 450345 |
| YAK | CPC98 | BN01 | FL01 | 0.00099552 | 0.00349974 | 0.28445469 | 450351 |
| YAK | CPC98 | BN01 | BS01 | –0.00310245 | 0.00405350 | –0.76537570 | 450348 |
| YAK | CPC98 | CA01 | FL01 | –0.00565510 | 0.00342051 | –1.65329057 | 450392 |
| YAK | CPC98 | CA01 | BS01 | –0.00977242 | 0.00389924 | –2.50623975 | 450386 |
| YAK | CPC98 | LI01 | FL01 | –0.00497786 | 0.00344966 | –1.44300022 | 450380 |
| YAK | CPC98 | LI01 | BS01 | –0.00909228 | 0.00392637 | –2.31569677 | 450374 |
| YAK | CPC98 | LM01 | FL01 | –0.01139534 | 0.00342571 | –3.32641246 | 450377 |
| YAK | CPC98 | LM01 | BS01 | –0.01553056 | 0.00399342 | –3.88903604 | 450373 |
| YAK | CPC98 | PA01 | FL01 | –0.00469758 | 0.00300994 | –1.56068935 | 450393 |
| YAK | CPC98 | PA01 | BS01 | –0.00883186 | 0.00363419 | –2.43021611 | 450384 |
| YAK | CPC98 | PA02 | FL01 | 0.00015340 | 0.00519442 | 0.02953081 | 449545 |
| YAK | CPC98 | PA02 | BS01 | –0.00393103 | 0.00545916 | –0.72008057 | 449548 |
| YAK | CPC98 | SA01 | FL01 | –0.00887584 | 0.00354305 | –2.50514043 | 450377 |
| YAK | CPC98 | SA01 | BS01 | –0.01299958 | 0.00401364 | –3.23885174 | 450369 |
| YAK | CPC98 | TU | FL01 | –0.00446867 | 0.00469083 | –0.95263975 | 449680 |
| YAK | CPC98 | TU | BS01 | –0.00849743 | 0.00509594 | –1.66748978 | 449674 |
Appendix 2—table 3
D statistics verifying the results of da Fonseca et al., 2019.
pop3 is an Iberia breed while pop4 is a central or Northwestern European breed. Positive values indicate an excess of allele sharing between pop2 and pop4.
| pop1 | pop2 | pop3 | pop4 | D | SE | Z | n |
|---|---|---|---|---|---|---|---|
| YAK | CPC98 | AL01 | HF01 | 0.00010984 | 0.00444032 | 0.02473730 | 450186 |
| YAK | CPC98 | AL01 | JE01 | 0.00975475 | 0.00476772 | 2.04599760 | 450158 |
| YAK | CPC98 | AR01 | HF01 | –0.00209568 | 0.00376061 | –0.55727039 | 450365 |
| YAK | CPC98 | AR01 | JE01 | 0.00757226 | 0.00436317 | 1.73549446 | 450336 |
| YAK | CPC98 | CC01 | HF01 | –0.00664020 | 0.00434678 | –1.52761461 | 450211 |
| YAK | CPC98 | CC01 | JE01 | 0.00298956 | 0.00493465 | 0.60583115 | 450192 |
| YAK | CPC98 | CL01 | HF01 | –0.00089510 | 0.00478336 | –0.18712725 | 449748 |
| YAK | CPC98 | CL01 | JE01 | 0.00890081 | 0.00511564 | 1.73992026 | 449721 |
| YAK | CPC98 | MI01 | HF01 | 0.00119432 | 0.00474148 | 0.25188685 | 450238 |
| YAK | CPC98 | MI01 | JE01 | 0.01099329 | 0.00508326 | 2.16264559 | 450206 |
| YAK | CPC98 | BC01 | HF01 | 0.00420509 | 0.00380025 | 1.10653083 | 450359 |
| YAK | CPC98 | BC01 | JE01 | 0.01401724 | 0.00423143 | 3.31264957 | 450329 |
| YAK | CPC98 | BN01 | HF01 | 0.00610700 | 0.00367932 | 1.65981831 | 450360 |
| YAK | CPC98 | BN01 | JE01 | 0.01585867 | 0.00427758 | 3.70739043 | 450327 |
| YAK | CPC98 | CA01 | HF01 | –0.00046112 | 0.00364117 | –0.12663996 | 450396 |
| YAK | CPC98 | CA01 | JE01 | 0.00926087 | 0.00415092 | 2.23104269 | 450370 |
| YAK | CPC98 | LI01 | HF01 | 0.00017668 | 0.00374294 | 0.04720225 | 450385 |
| YAK | CPC98 | LI01 | JE01 | 0.00994126 | 0.00422452 | 2.35322801 | 450356 |
| YAK | CPC98 | LM01 | HF01 | –0.00611705 | 0.00379450 | –1.61208547 | 450383 |
| YAK | CPC98 | LM01 | JE01 | 0.00356800 | 0.00415838 | 0.85802696 | 450352 |
| YAK | CPC98 | PA01 | HF01 | 0.00044748 | 0.00328790 | 0.13609781 | 450395 |
| YAK | CPC98 | PA01 | JE01 | 0.01022468 | 0.00374297 | 2.73170629 | 450366 |
| YAK | CPC98 | PA02 | HF01 | 0.00519730 | 0.00529190 | 0.98212286 | 449549 |
| YAK | CPC98 | PA02 | JE01 | 0.01507871 | 0.00565298 | 2.66739024 | 449529 |
| YAK | CPC98 | SA01 | HF01 | –0.00363095 | 0.00362183 | –1.00251585 | 450382 |
| YAK | CPC98 | SA01 | JE01 | 0.00607429 | 0.00435903 | 1.39349602 | 450359 |
| YAK | CPC98 | TU | HF01 | 0.00055343 | 0.00493685 | 0.11210270 | 449674 |
| YAK | CPC98 | TU | JE01 | 0.01044897 | 0.00524529 | 1.99206629 | 449653 |
Appendix 2—table 4
qpAdm results for the modern breeds in a three-source model.
| Breed | European Aurochs proportion | European domestic proportion | Indicus proportion | SE (aurochs) | SE (taurus) | SE (indicus) | p |
|---|---|---|---|---|---|---|---|
| AL01 | 0.1489 | 0.8332 | 0.0179 | 0.0477 | 0.0416 | 0.0086 | 0.1290 |
| AN01 | 0.1334 | 0.8403 | 0.0264 | 0.0505 | 0.0439 | 0.0096 | 0.6038 |
| AR01 | 0.1465 | 0.8333 | 0.0202 | 0.0427 | 0.0370 | 0.0081 | 0.2356 |
| BC01 | 0.1446 | 0.8303 | 0.0252 | 0.0433 | 0.0378 | 0.0080 | 0.5834 |
| BK01 | 0.0399 | 0.8771 | 0.0829 | 0.0489 | 0.0426 | 0.0093 | 0.0774 |
| BN01 | 0.1223 | 0.8447 | 0.0329 | 0.0430 | 0.0375 | 0.0080 | 0.1930 |
| BS01 | 0.0690 | 0.9010 | 0.0300 | 0.0477 | 0.0416 | 0.0088 | 0.1299 |
| BU01 | 0.0683 | 0.8212 | 0.1106 | 0.0465 | 0.0405 | 0.0088 | 0.1236 |
| BU02 | 0.0481 | 0.8906 | 0.0613 | 0.0464 | 0.0403 | 0.0086 | 0.1336 |
| CA01 | 0.1713 | 0.8153 | 0.0135 | 0.0426 | 0.0370 | 0.0079 | 0.1055 |
| CC01 | 0.1525 | 0.8241 | 0.0233 | 0.0492 | 0.0425 | 0.0092 | 0.5879 |
| CH01 | 0.0313 | 0.8667 | 0.1020 | 0.0492 | 0.0429 | 0.0092 | 0.1833 |
| CL01 | 0.1003 | 0.8756 | 0.0241 | 0.0518 | 0.0452 | 0.0094 | 0.2378 |
| DB01 | 0.1892 | 0.7951 | 0.0158 | 0.0449 | 0.0390 | 0.0084 | 0.4417 |
| DF01 | 0.1837 | 0.7962 | 0.0201 | 0.0444 | 0.0386 | 0.0084 | 0.4395 |
| FL01 | 0.1138 | 0.8590 | 0.0271 | 0.0427 | 0.0372 | 0.0080 | 0.1621 |
| GA01 | 0.2064 | 0.7859 | 0.0077 | 0.0432 | 0.0377 | 0.0080 | 0.6631 |
| GW01 | 0.1925 | 0.7969 | 0.0107 | 0.0442 | 0.0386 | 0.0081 | 0.3708 |
| HF01 | 0.1941 | 0.7799 | 0.0260 | 0.0430 | 0.0374 | 0.0080 | 0.0834 |
| HL01 | 0.1905 | 0.8023 | 0.0072 | 0.0459 | 0.0400 | 0.0087 | 0.0260 |
| JE01 | 0.1233 | 0.8527 | 0.0240 | 0.0458 | 0.0399 | 0.0086 | 0.3298 |
| KC01 | 0.2136 | 0.7775 | 0.0089 | 0.0438 | 0.0382 | 0.0081 | 0.5727 |
| LI01 | 0.1345 | 0.8454 | 0.0201 | 0.0433 | 0.0377 | 0.0081 | 0.6682 |
| LM01 | 0.1640 | 0.8229 | 0.0131 | 0.0429 | 0.0374 | 0.0081 | 0.5898 |
| MA01 | 0.0401 | 0.8589 | 0.1010 | 0.0441 | 0.0384 | 0.0087 | 0.1193 |
| ME01 | 0.1554 | 0.8229 | 0.0217 | 0.0432 | 0.0377 | 0.0081 | 0.3929 |
| MI01 | 0.1468 | 0.8312 | 0.0220 | 0.0489 | 0.0426 | 0.0090 | 0.6720 |
| MN01 | 0.1336 | 0.8423 | 0.0240 | 0.0458 | 0.0399 | 0.0086 | 0.1144 |
| MR01 | 0.1525 | 0.8276 | 0.0198 | 0.0443 | 0.0387 | 0.0082 | 0.3582 |
| PA01 | 0.1437 | 0.8364 | 0.0199 | 0.0412 | 0.0357 | 0.0078 | 0.1722 |
| PA02 | 0.1864 | 0.8000 | 0.0135 | 0.0513 | 0.0444 | 0.0098 | 0.6806 |
| PO01 | 0.0003 | 0.8877 | 0.1119 | 0.0557 | 0.0485 | 0.0112 | 0.6150 |
| RO01 | 0.0318 | 0.8844 | 0.0838 | 0.0461 | 0.0402 | 0.0090 | 0.3009 |
| SA01 | 0.1260 | 0.8532 | 0.0208 | 0.0430 | 0.0375 | 0.0079 | 0.1805 |
| TU | 0.1698 | 0.8105 | 0.0196 | 0.0500 | 0.0434 | 0.0094 | 0.3151 |
| TU01 | 0.1303 | 0.8449 | 0.0248 | 0.0532 | 0.0465 | 0.0096 | 0.2313 |
| WP01 | 0.1637 | 0.8184 | 0.0179 | 0.0461 | 0.0402 | 0.0085 | 0.5317 |
Appendix 3—table 1
Collagen isotope data summary based on morphological identification.
Significant differences (at p=0.05) from normal distributions are highlighted in blue.
| 13C | Normality tests | |||||||||
|---|---|---|---|---|---|---|---|---|---|---|
| Morphological species | Number of samples | Mean | Std dev | Median | Shapiro-Wilk W-value | Shapiro-Wilk p-value | Anderson-Darling A-value | Anderson-Darling p-value | ||
| All | B. taurus | 54 | –20.48 | 0.80 | –20.55 | 0.972 | 0.242 | 0.628 | 0.097 | |
| B. species | 26 | –20.02 | 0.83 | –20.20 | 0.961 | 0.415 | 0.438 | 0.273 | ||
| B. primigenius | 13 | –20.20 | 0.86 | –20.16 | 0.864 | 0.043 | 0.670 | 0.061 | ||
| B. primigenius+B. primigenius? | 15 | –20.27 | 0.83 | –20.46 | 0.853 | 0.019 | 0.784 | 0.032 | ||
| B. taurus+B. species | 80 | –20.33 | 0.83 | –20.50 | 0.976 | 0.133 | 0.810 | 0.035 | ||
| Northern (>41°N) | B. taurus | 51 | –20.56 | 0.75 | –20.60 | 0.977 | 0.403 | 0.529 | 0.168 | |
| B. species | 21 | –20.26 | 0.73 | –20.30 | 0.955 | 0.415 | 0.429 | 0.282 | ||
| B. primigenius | 7 | –20.82 | 0.31 | –20.92 | 0.775 | 0.023 | N/A | N/A | ||
| B. primigenius+B. primigenius? | 9 | –20.80 | 0.31 | –20.92 | 0.835 | 0.050 | 0.662 | 0.055 | ||
| B. taurus+B. species | 72 | –20.47 | 0.75 | –20.51 | 0.979 | 0.259 | 0.589 | 0.120 | ||
| 15N | Normality tests | |||||||||
| Morphological species | Number of samples | Mean | Std dev | Median | Shapiro-Wilk W-value | Shapiro-Wilk p-value | Anderson-Darling A-value | Anderson-Darling p-value | ||
| All | B. taurus | 54 | 5.58 | 1.33 | 5.40 | 0.940 | 0.010 | 0.963 | 0.014 | |
| B. species | 26 | 5.18 | 0.95 | 5.25 | 0.961 | 0.420 | 0.317 | 0.519 | ||
| B. primigenius | 13 | 4.79 | 0.74 | 4.69 | 0.927 | 0.310 | 0.430 | 0.261 | ||
| B. primigenius+B. primigenius? | 15 | 4.80 | 0.69 | 4.70 | 0.938 | 0.361 | 0.397 | 0.324 | ||
| B. taurus+B. species | 80 | 5.45 | 1.23 | 5.34 | 0.943 | 0.001 | 1.096 | 0.007 | ||
| Northern (>42°N) | B. taurus | 46 | 5.60 | 1.41 | 5.40 | 0.935 | 0.013 | 0.975 | 0.013 | |
| B. species | 11 | 5.36 | 0.92 | 5.03 | 0.862 | 0.061 | 0.575 | 0.104 | ||
| B. primigenius | 7 | 4.88 | 0.73 | 4.69 | 0.778 | 0.024 | N/A | N/A | ||
| B. primigenius+B. primigenius? | 9 | 4.88 | 0.63 | 4.77 | 0.776 | 0.011 | 0.821 | 0.020 | ||
| B. taurus+B. species | 57 | 5.55 | 1.33 | 5.38 | 0.930 | 0.003 | 1.291 | 0.002 | ||
Appendix 3—table 2
Summary of Wilcoxon rank sum test results of comparisons of stable isotope data based on morphological characterisation.
Significant differences (at p=0.05) are highlighted in blue.
| Wilcoxon rank sum test with continuity correction | ||||
|---|---|---|---|---|
| Test comparison | W-value | p-value | ||
| All | B. primigenius vs B. taurus | 13C | 398 | 0.461 |
| 15N | 213 | 0.029 | ||
| B. primigenius vs B. taurus+ B. species | 13C | 549 | 0.752 | |
| 15N | 339 | 0.045 | ||
| B. primigenius+ B. primigenius? vs B. taurus | 13C | 444 | 0.575 | |
| 15N | 246 | 0.021 | ||
| B. primigenius+B. primigenius? vs B. taurus +B. species | 13C | 607 | 0.947 | |
| 15N | 395 | 0.036 | ||
| Northern only | B. primigenius vs B. taurus | 13C | 128 | 0.232 |
| 15N | 105 | 0.141 | ||
| B. primigenius vs B. taurus+B. species | 13C | 165 | 0.135 | |
| 15N | 128 | 0.124 | ||
| B. primigenius+B. primigenius? vs B. taurus | 13C | 174 | 0.254 | |
| 15N | 136 | 0.106 | ||
| B. primigenius+B. primigenius? vs B. taurus+B. species | 13C | 223 | 0.131 | |
| 15N | 169 | 0.102 | ||
Appendix 3—table 3
Collagen isotope data summary based on genetic (or morphological identification for published studies).
Significant differences (at p=0.05) from normal distributions are highlighted in blue.
| 13C | Normality tests | |||||||||
|---|---|---|---|---|---|---|---|---|---|---|
| Genetic model | Genetic species | Number of samples | Mean | Std dev | Median | Shapiro-Wilk W-value | Shapiro-Wilk p-value | Anderson-Darling A-value | Anderson-Darling p-value | |
| All | Model 1 | B. taurus | 55 | –20.48 | 0.73 | –20.65 | 0.951 | 0.025 | 1.140 | 0.005 |
| B. primigenius | 17 | –20.38 | 0.99 | –20.46 | 0.937 | 0.283 | 0.470 | 0.216 | ||
| Model 2 | B. taurus | 52 | –20.45 | 0.74 | –20.60 | 0.958 | 0.064 | 0.916 | 0.018 | |
| B. primigenius | 16 | –20.23 | 0.81 | –20.31 | 0.884 | 0.045 | 0.612 | 0.092 | ||
| Hybrid | 4 | –21.41 | 0.90 | –21.03 | 0.719 | 0.019 | N/A | N/A | ||
| Model 3 | B. taurus | 51 | –20.44 | 0.75 | –20.60 | 0.960 | 0.084 | 0.849 | 0.027 | |
| B. primigenius | 11 | –20.08 | 0.89 | –20.10 | 0.893 | 0.150 | 0.478 | 0.187 | ||
| Hybrid | 10 | –20.93 | 0.76 | –20.94 | 0.826 | 0.030 | 0.867 | 0.016 | ||
| Northern (>41°N) | Model 1 | B. taurus | 52 | –20.55 | 0.68 | –20.70 | 0.959 | 0.069 | 0.911 | 0.019 |
| B. primigenius | 11 | –20.87 | 0.76 | –20.92 | 0.852 | 0.045 | 0.74 | 0.038 | ||
| Model 2 | B. taurus | 49 | –20.53 | 0.69 | –20.65 | 0.966 | 0.164 | 0.723 | 0.055 | |
| B. primigenius | 10 | –20.68 | 0.45 | –20.90 | 0.851 | 0.060 | 0.636 | 0.068 | ||
| Hybrid | 4 | –21.41 | 0.90 | –21.03 | 0.719 | 0.019 | N/A | N/A | ||
| Model 3 | B. taurus | 48 | –20.52 | 0.69 | –20.63 | 0.968 | 0.209 | 0.668 | 0.076 | |
| B. primigenius | 5 | –20.81 | 0.37 | –20.92 | 0.763 | 0.039 | N/A | N/A | ||
| Hybrid | 10 | –20.93 | 0.76 | –20.94 | 0.826 | 0.030 | 0.867 | 0.016 | ||
| 15N | Normality tests | |||||||||
| Genetic model | Genetic species | Number of samples | Mean | Std dev | Median | Shapiro-Wilk W-value | Shapiro-Wilk p-value | Anderson-Darling A-value | Anderson-Darling p-value | |
| All | Model 1 | B. taurus | 55 | 5.48 | 1.31 | 5.30 | 0.915 | 0.001 | 1.424 | 0.001 |
| B. primigenius | 17 | 5.06 | 0.99 | 4.70 | 0.898 | 0.062 | 0.702 | 0.054 | ||
| Model 2 | B. taurus | 52 | 5.51 | 1.33 | 5.30 | 0.918 | 0.002 | 1.325 | 0.002 | |
| B. primigenius | 16 | 4.93 | 0.85 | 4.70 | 0.914 | 0.133 | 0.557 | 0.126 | ||
| Hybrid | 4 | 5.50 | 1.31 | 5.15 | 0.877 | 0.326 | N/A | N/A | ||
| Model 3 | B. taurus | 51 | 5.51 | 1.34 | 5.30 | 0.918 | 0.002 | 1.324 | 0.002 | |
| B. primigenius | 11 | 4.77 | 0.81 | 4.50 | 0.893 | 0.151 | 0.572 | 0.106 | ||
| Hybrid | 10 | 5.40 | 0.99 | 5.10 | 0.885 | 0.148 | 0.480 | 0.179 | ||
| Northern (>42°N) | Model 1 | B. taurus | 47 | 5.47 | 1.38 | 5.30 | 0.903 | 0.001 | 1.518 | 0.001 |
| B. primigenius | 11 | 5.26 | 1.05 | 4.90 | 0.816 | 0.015 | 0.897 | 0.014 | ||
| Model 2 | B. taurus | 44 | 5.51 | 1.41 | 5.30 | 0.908 | 0.002 | 1.381 | 0.001 | |
| B. primigenius | 10 | 5.07 | 0.87 | 4.80 | 0.799 | 0.014 | 0.875 | 0.015 | ||
| Hybrid | 4 | 5.50 | 1.31 | 5.15 | 0.877 | 0.326 | N/A | N/A | ||
| Model 3 | B. taurus | 43 | 5.51 | 1.43 | 5.30 | 0.907 | 0.002 | 1.379 | 0.001 | |
| B. primigenius | 5 | 4.87 | 0.88 | 4.50 | 0.700 | 0.010 | N/A | N/A | ||
| Hybrid | 10 | 5.40 | 0.99 | 5.10 | 0.885 | 0.148 | 0.480 | 0.179 | ||
Appendix 3—table 4
Summary of Wilcoxon rank sum test results of comparisons of stable isotope data based on morphological characterisation (or morphological identification for published studies).
| Wilcoxon rank sum test with continuity correction | |||||
|---|---|---|---|---|---|
| Test comparison | W-value | p-Value | |||
| All | B. primigenius vs B. taurus | Model 1 | 13C | 516 | 0.524 |
| 15N | 370 | 0.198 | |||
| Model 2 | 13C | 478 | 0.374 | ||
| 15N | 298 | 0.089 | |||
| Model 3 | 13C | 342 | 0.261 | ||
| 15N | 177 | 0.056 | |||
| Northern only | B. primigenius vs B. taurus | Model 1 | 13C | 237 | 0.379 |
| 15N | 235 | 0.641 | |||
| Model 2 | 13C | 217 | 0.578 | ||
| 15N | 178 | 0.349 | |||
| Model 3 | 13C | 87 | 0.322 | ||
| 15N | 74 | 0.258 | |||
Additional files
-
Supplementary file 1
Excel sheet containing three tables: (i) sample list, (ii) ancestry estimates, and (iii) metric and isotope data.
- https://cdn.elifesciences.org/articles/93076/elife-93076-supp1-v2.xlsx
-
MDAR checklist
- https://cdn.elifesciences.org/articles/93076/elife-93076-mdarchecklist1-v2.docx
Download links
A two-part list of links to download the article, or parts of the article, in various formats.
Downloads (link to download the article as PDF)
Open citations (links to open the citations from this article in various online reference manager services)
Cite this article (links to download the citations from this article in formats compatible with various reference manager tools)
The genomic legacy of aurochs hybridisation in ancient and modern Iberian cattle
eLife 13:RP93076.
https://doi.org/10.7554/eLife.93076.3


