Aberrant methylation and expression of TNXB promote chondrocyte apoptosis and extracullar matrix degradation in hemophilic arthropathy via AKT signaling
- Institute of Orthopaedics and Traumatology, the First Affiliated Hospital of Zhejiang Chinese Medical University, Zhejiang Provincial Hospital of Chinese Medicine, China
- The First College of Clinical Medicine, Zhejiang Chinese Medical University, China
- Department of Orthopaedics, Affiliated Hospital of Jiangxi University of Traditional Chinese Medicine, China
- Department of Osteology, The Second Affiliated Hospital of Zhejiang Chinese Medical University, China
- Department of Orthopaedic Surgery, Fuyang Orthopaedics and Traumatology Affiliated Hospital of Zhejiang Chinese Medical University, China
- Research Center for Computer-aided Drug Discovery, Shenzhen Institute of Advanced Technology, Chinese Academy of Sciences, China
- Faculty of Pharmaceutical Sciences, Shenzhen Institute of Advanced Technology, Chinese Academy of Sciences, China
- Department of Orthopaedic Surgery, the First Affiliated Hospital of Zhejiang Chinese Medical University, Zhejiang Provincial Hospital of Chinese Medicine, China
Figures
Figure 1 with 1 supplement
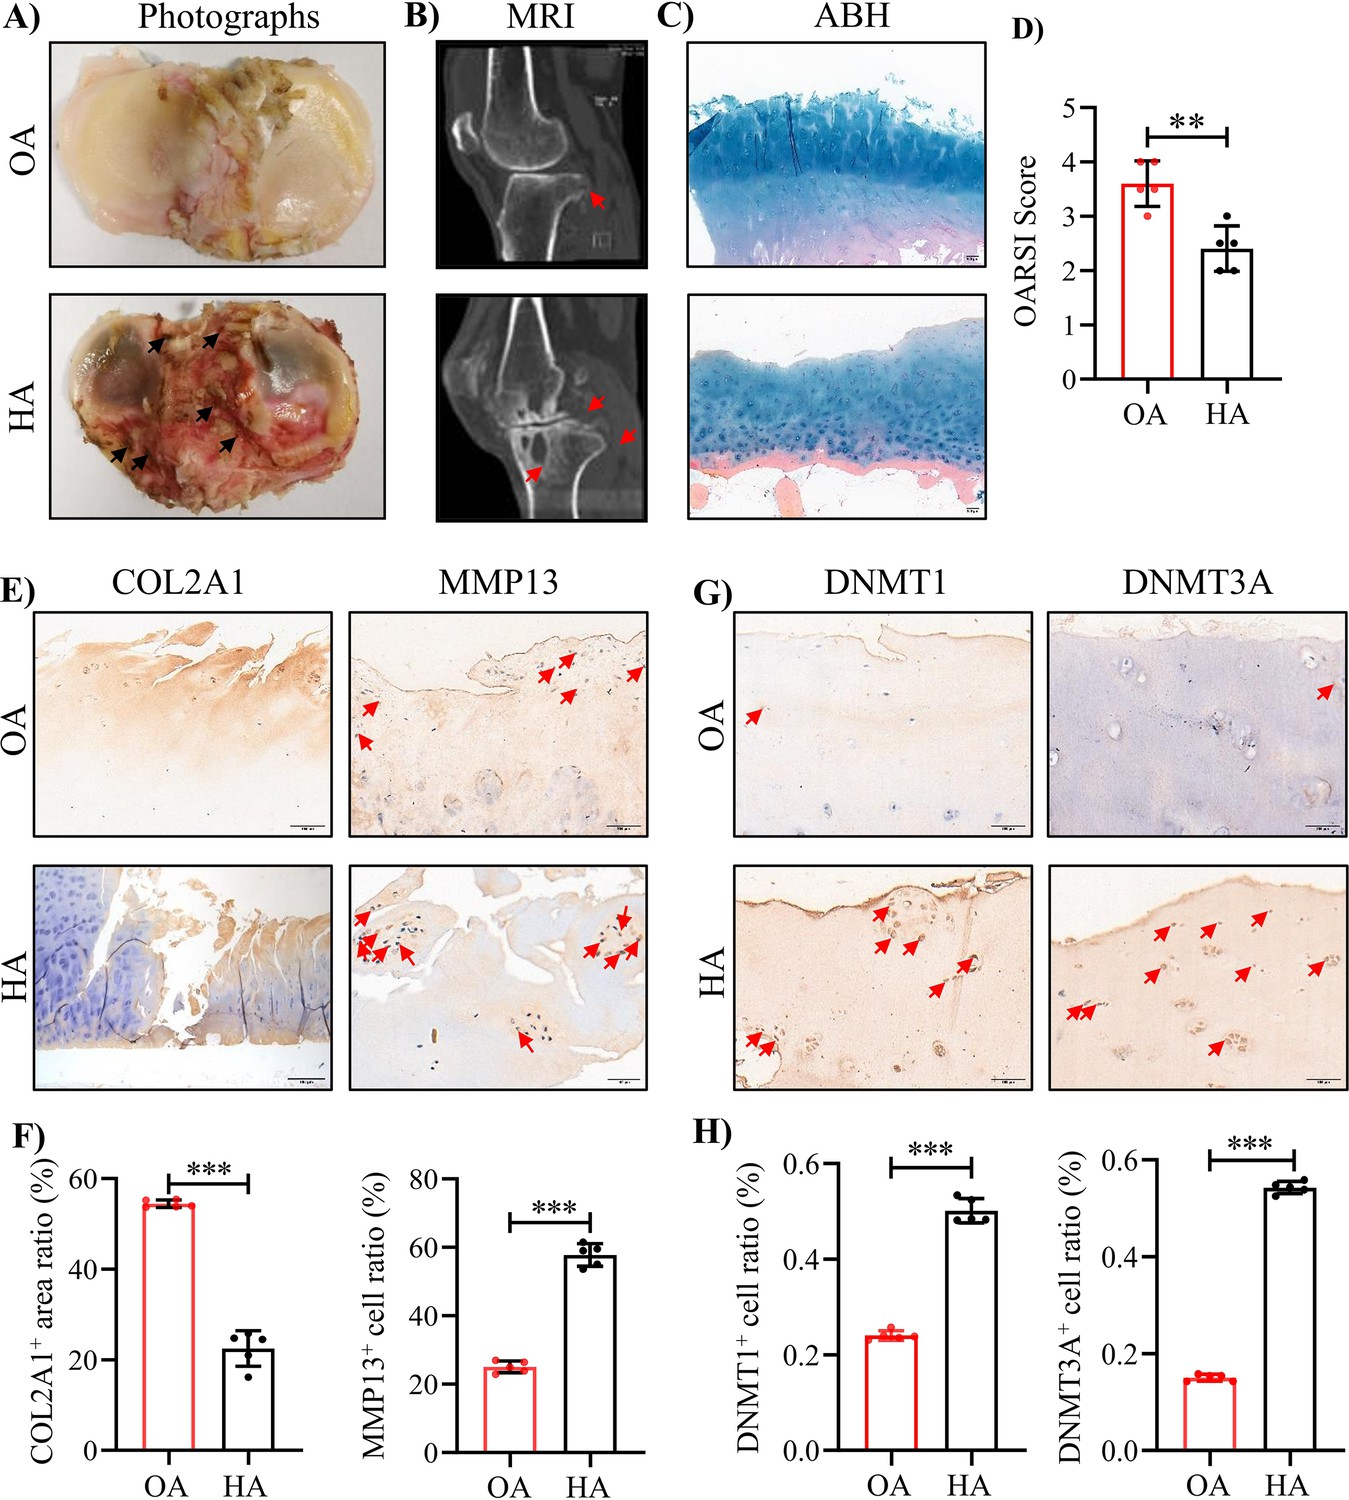
The severe cartilage damage in human HA.
(A) Human cartilage samples in the tibial plateau were obtained from patients with OA and HA. Black arrow indicates hemorrhagic ferruginous deposits. (B) MRI imaging of the knee joint in patients with HA and OA. Red arrow indicates the wear area. (C) Representative images of ABH/OG staining for HA and OA cartilage. (D) The degree of cartilage degeneration was quantified according to the OARSI score. (E) Representative IHC staining of COL2A1 and MMP13. (F) Quantification of the proportion of COL2A1 and MMP13 positive regions in human cartilage. (G) Representative IHC staining of DNMT1 and DNMT3A. (H) Quantification of the proportion of DNMT1 and DNMT3A positive cells in human cartilage. Red arrows indicate positive cells. Scale bar: 100 μm. Data were presented as means ± SD; n = 5 per group. And analyzed by two-tailed unpaired parametric Student’s t test, **p < 0.01, ***p < 0.001.
Figure 1—figure supplement 1
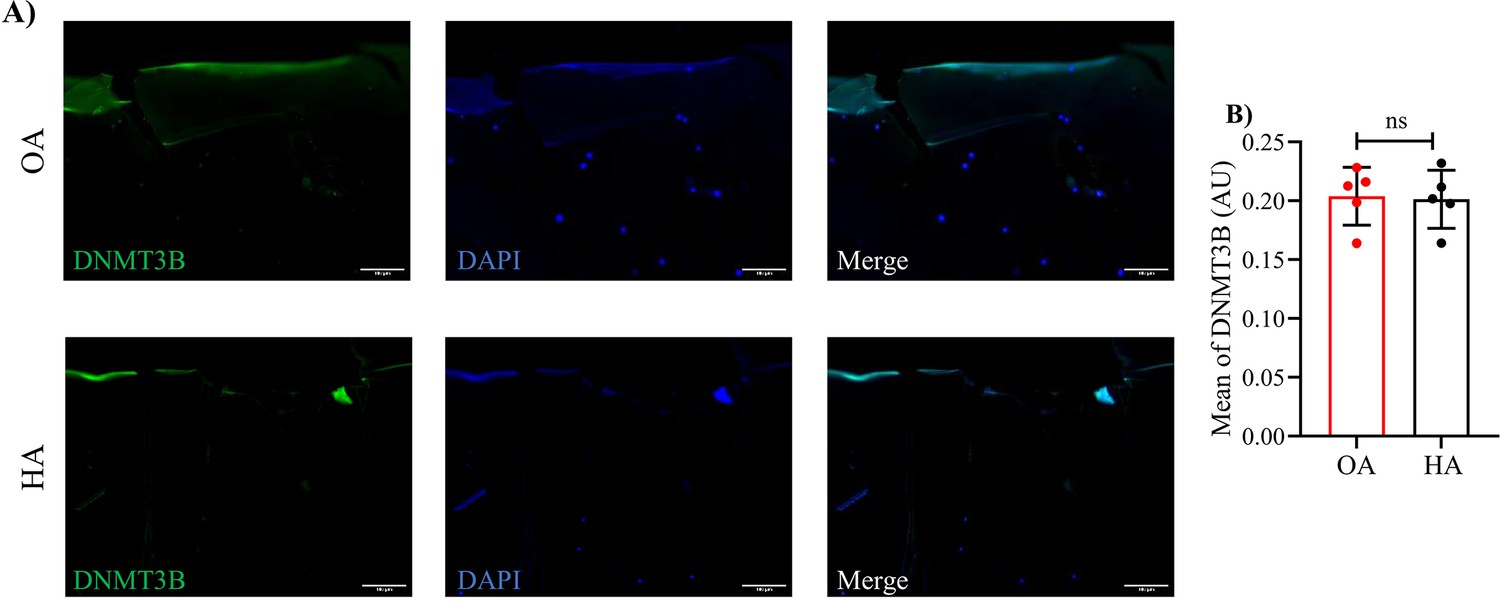
Representative immunofluorescence images (A) and quantification (B) of DNMT3B in human HA and OA cartilages.
Scale bar: 100 μm. Data were presented as means ± SD; n = 5 in each group. ns = no significance by unpaired Student’s t test.
Figure 2 with 3 supplements
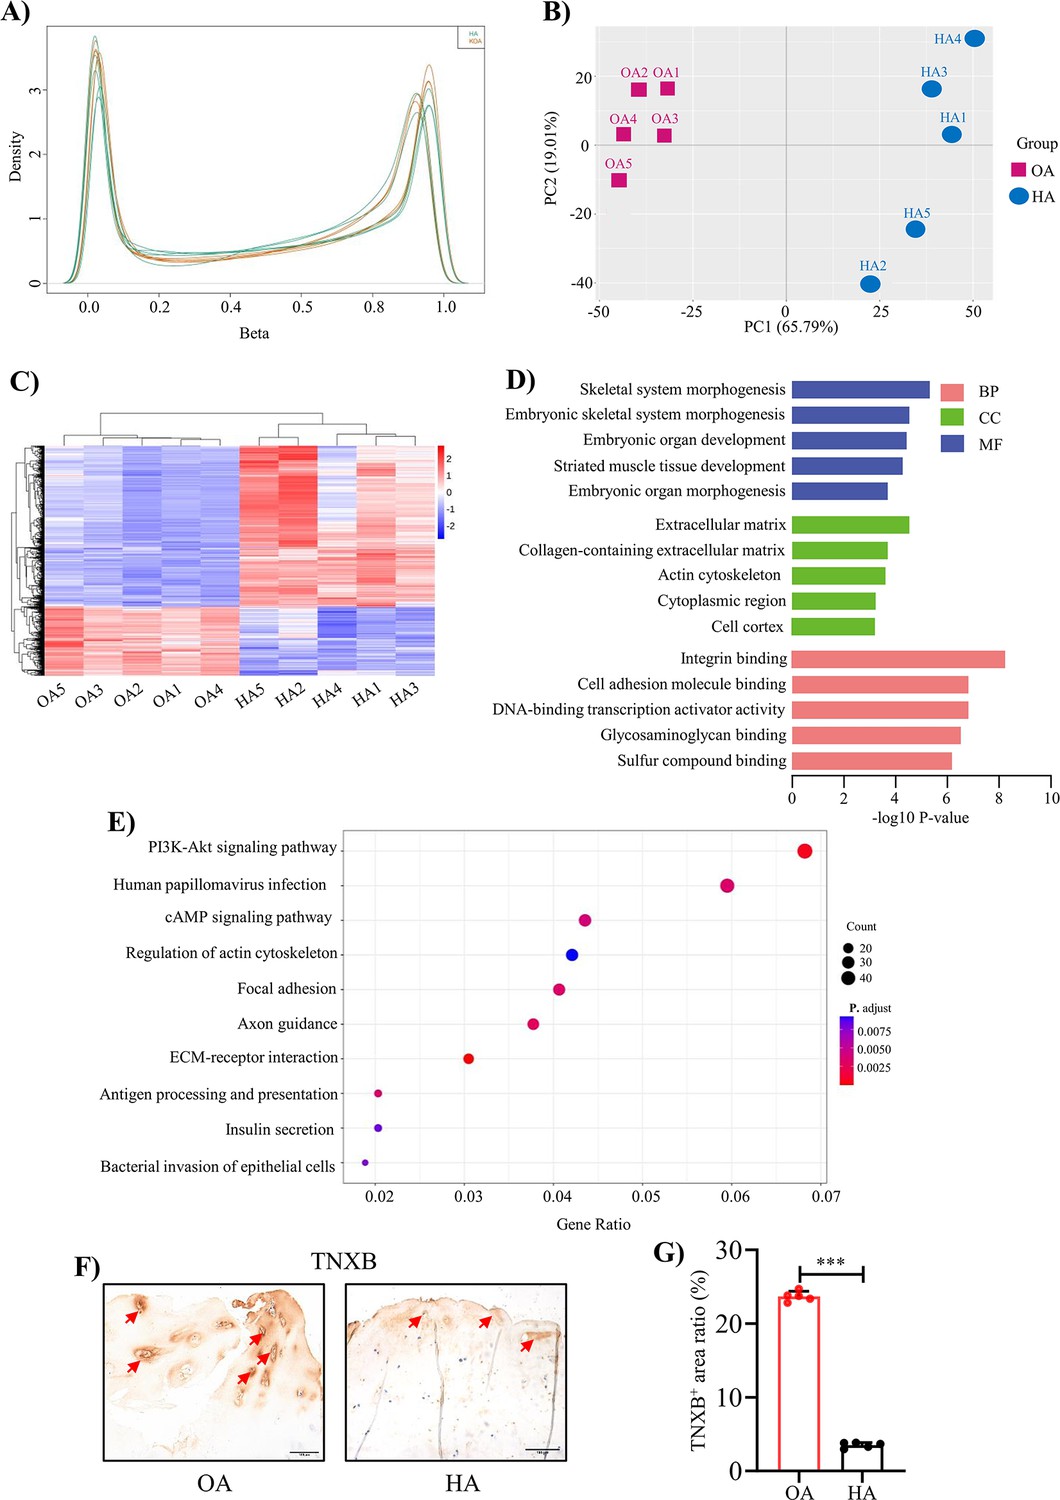
Genome-wide DNA methylation profile in HA cartilage and biological functions of DMGs.
(A) Distribution of methylation level density of CpGs. Note: X = degree of methylation; Y = the CpG site density corresponding to the level of methylation. (B) Principal component analysis of DNA methylation data. (C) Heatmap shows the 700 significant DMRs between HA and OA. (D) Enriched GO terms for DMR-related genes. (E) KEGG enrichment analysis of DMR-related genes. (F) Representative IHC staining of TNXB. Red arrows indicate positive areas. Scale bar: 100 μm. (G) Quantification of the proportion of TNXB positive regions in human cartilage. Data were presented as means ± SD; n = 5 per group. And analyzed by two-tailed unpaired parametric Student’s t test, ***p < 0.001.
Figure 2—figure supplement 1

The proportion of hypermethylated and hypomethylated DMRs.
Figure 2—figure supplement 2

Proportion of DMRs for each genetic feature.
Figure 2—figure supplement 3
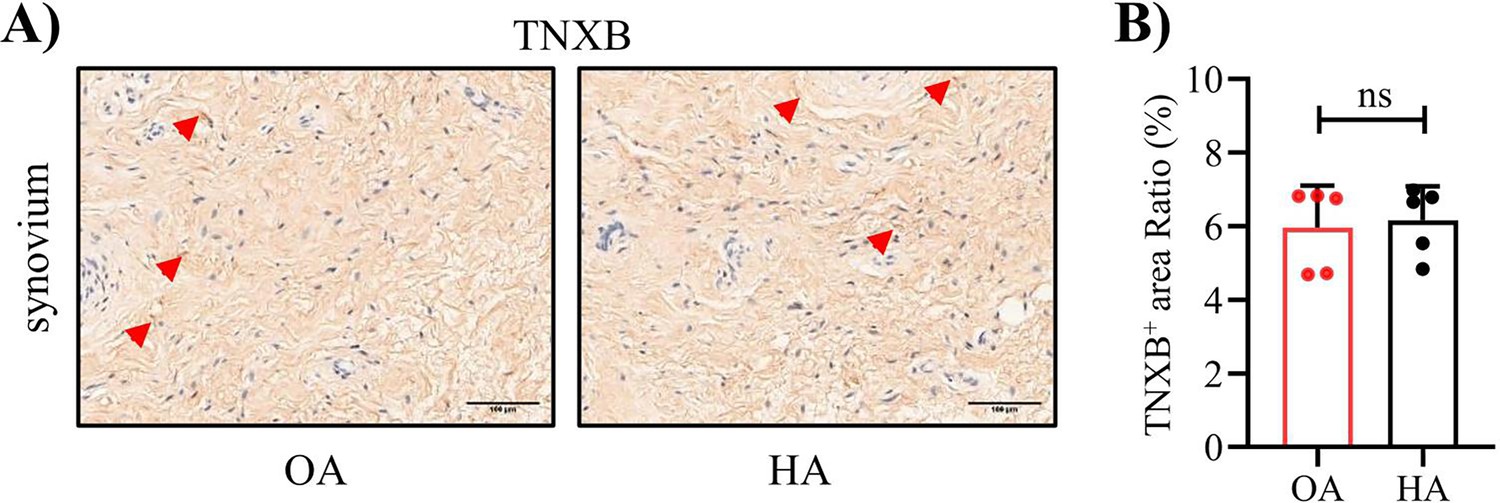
Representative IHC staining (A) images and (B) corresponding quantification ofTNXB in synovium from human HA and OA.
Red arrows indicate positive cells. Scale bar: 100 μm. Data were presented as means ± SD; n = 5 in each group. ns = no significance by unpaired Student’s t test.
Figure 3 with 2 supplements
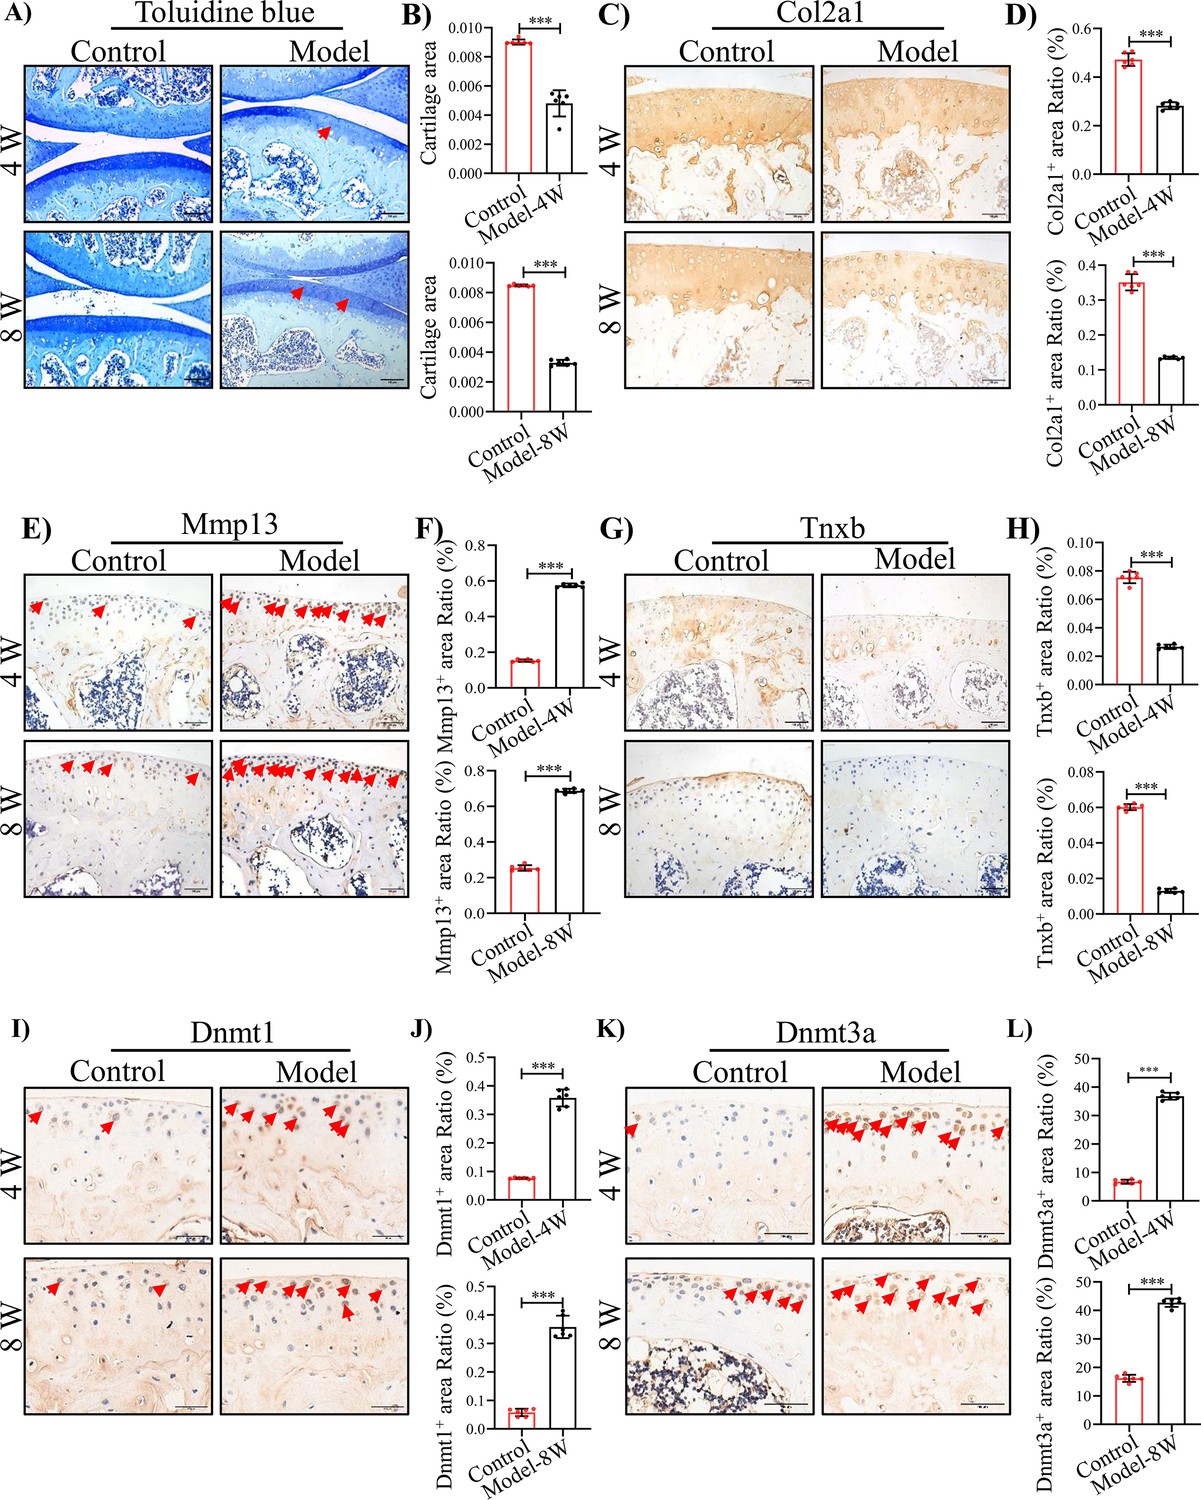
TNXB expression is drastically reduced in HA mouse cartilages.
(A) Representative images and (B) Quantitative analysis of Toluidine blue staining for knee sections of F8-/- mice at 4 and 8 weeks following injury. Representative IHC staining of (C) Col2a1, (E) Mmp13, (G) Tnxb, (I) Dnmt1, and (K) Dnmt3a in F8-/- mice at 4 and 8 weeks post injury. Quantification of the proportion of (D) Col2a1, (F) Mmp13, (H) Tnxb, (J) Dnmt1 and (L) Dnmt3a positive regions. Scale bar: 100 μm. Data were presented as means ± SD; n = 6 mice per group. And analyzed by two-tailed unpaired parametric Student’s t test, ***p < 0.001.
Figure 3—figure supplement 1

Representative images of bleeding knee joint of F8-/- mice at (A) 4 and (B) 8 weeks following injury.
Figure 3—figure supplement 2
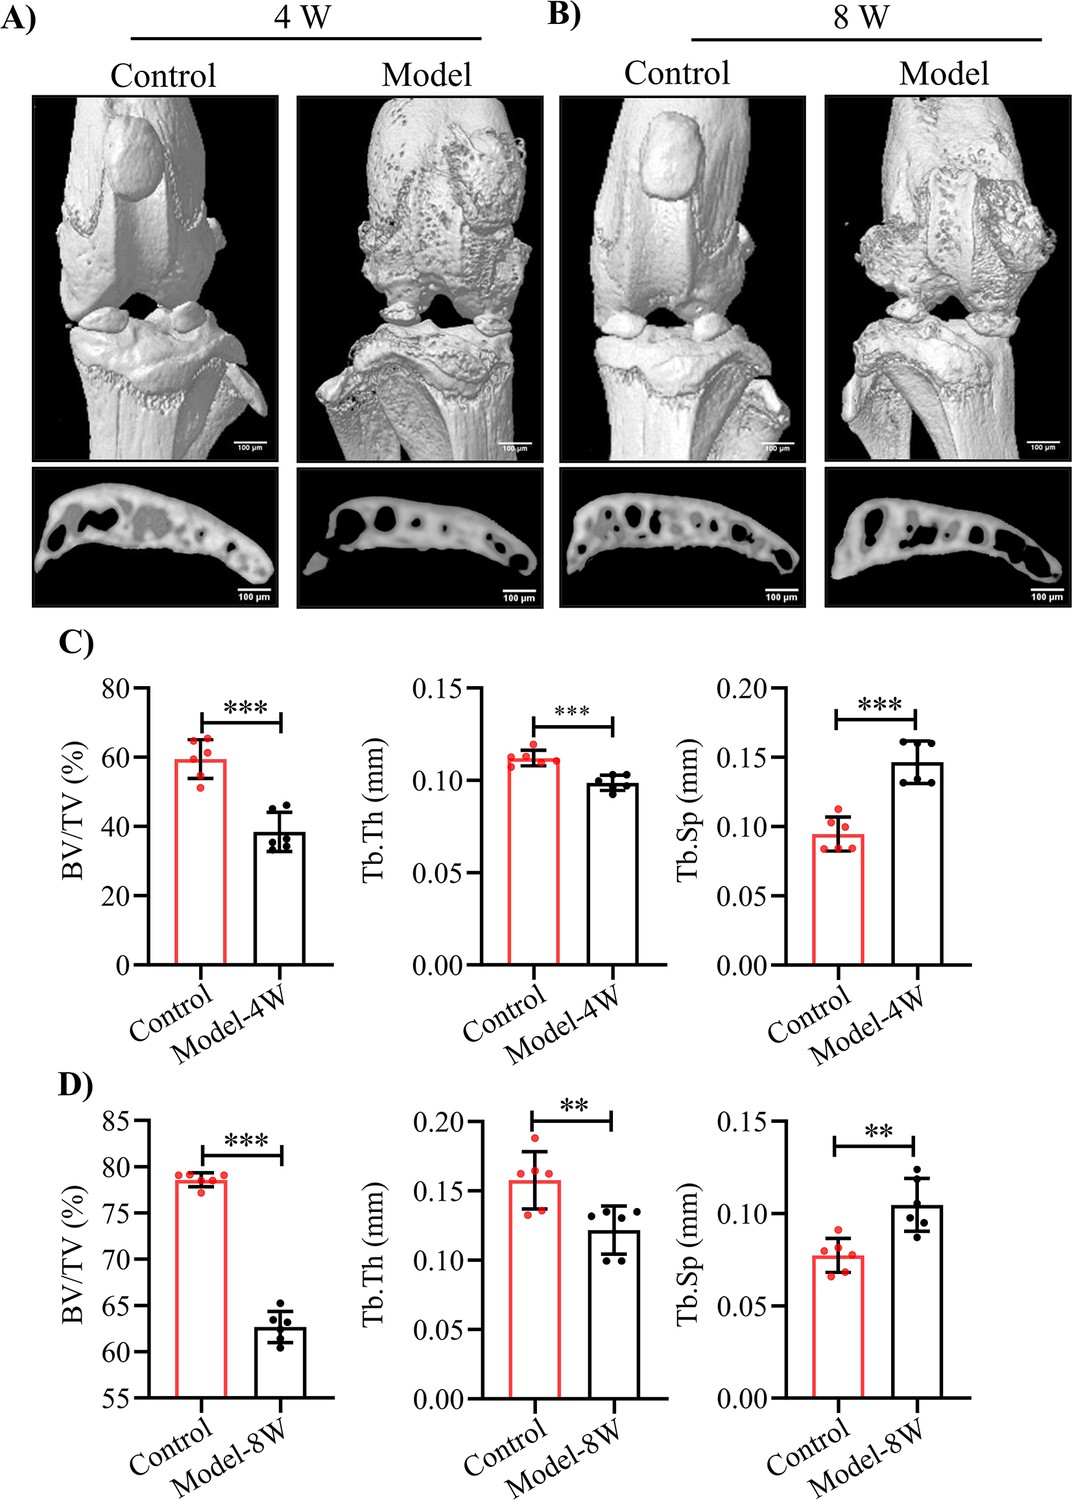
Representative 3D reconstruction of the knee joint and subchondral bone of HA model mice at (A) 4 weeks and (B) 8 weeks after puncture-induced injury.
Quantification analysis of the subchondral bone BV/TV (%), Tb.Th (mm) and Tb.Sp (mm) at HA model mice at (C) 4 weeks and (D) 8 weeks after injury. Data were presented as means ± SD and analyzed by two-tailed unpaired parametric Student’s t test, **p < 0.01, ***p < 0.001, n = 6 in each group.
Figure 4 with 2 supplements
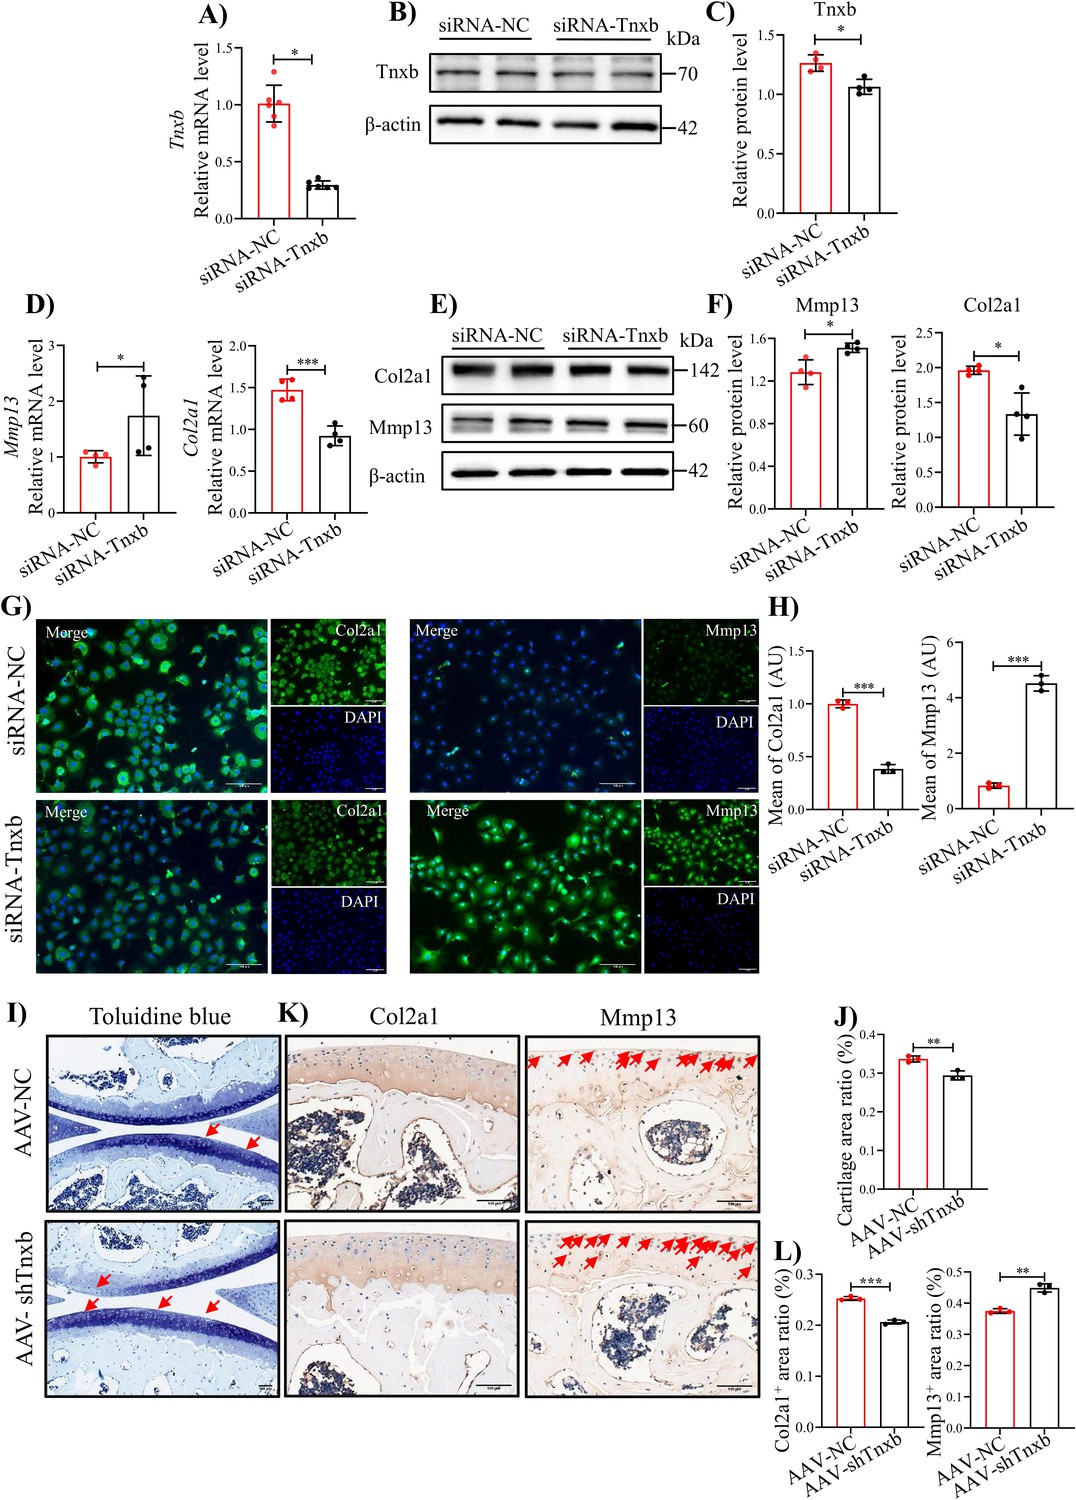
knockdown of Tnxb in chondrocytes induces extracellular matrix degradation and accelerates the progression of HA.
(A) qPCR and (B) western blotting analysis for Tnxb in mouse chondrocytes treated with siRNA-NC or siRNA-Tnxb. (C) Corresponding quantification analysis of Tnxb protein. Quantification of mRNA levels for (D) Mmp13 andCol2a1 in Tnxb-KD chondrocytes. (E) Western blot and (F) corresponding quantification analysis for Mmp13 and Col2a1 protein. (G) Representative immunofluorescence images of Col2a1 and Mmp13 expression in Tnxb-KD chondrocytes. (H) Quantification of Col2a1 and Mmp13 fluorescence intensity. Representative images of (I) Toluidine blue staining and (K) IHC staining of Col2a1 and Mmp13 for knee sections of F8-/- mice at 4 weeks after Intra-articular injection of AAV-shTnxb. (J) Quantitative detection of the area of the tibial cartilage area. (L) Quantification of the proportion of Col2a1 and Mmp13 positive regions. Red arrow indicates the wear area. Scale bar: 100 μm. Data were presented as means ± SD; n ≥ 3 in each group. And analyzed by two-tailed unpaired parametric Student’s t test, *p < 0.05, **p < 0.01, ***p < 0.001.
-
Figure 4—source data 1
Original file for the western blot analysis of β-actin in Figure 4B.
- https://cdn.elifesciences.org/articles/93087/elife-93087-fig4-data1-v2.zip
-
Figure 4—source data 2
Original file for the western blot analysis of Tnxb in Figure 4B.
- https://cdn.elifesciences.org/articles/93087/elife-93087-fig4-data2-v2.zip
-
Figure 4—source data 3
PDF containing Figure 4B and original scans of the relevant western blot analysis (anti-β-actin and anti-Tnxb) with highlighted bands and sample labels.
- https://cdn.elifesciences.org/articles/93087/elife-93087-fig4-data3-v2.pdf
-
Figure 4—source data 4
Original file for the western blot analysis of β-actin in Figure 4E.
- https://cdn.elifesciences.org/articles/93087/elife-93087-fig4-data4-v2.zip
-
Figure 4—source data 5
Original file for the western blot analysis of Col2a1 in Figure 4E.
- https://cdn.elifesciences.org/articles/93087/elife-93087-fig4-data5-v2.zip
-
Figure 4—source data 6
Original file for the western blot analysis of Mmp13 in Figure 4E.
- https://cdn.elifesciences.org/articles/93087/elife-93087-fig4-data6-v2.zip
-
Figure 4—source data 7
PDF containing Figure 4E and original scans of the relevant western blot analysis (anti-β-actin, anti-Col2a1, and anti-Mmp13) with highlighted bands and sample labels.
- https://cdn.elifesciences.org/articles/93087/elife-93087-fig4-data7-v2.pdf
Figure 4—figure supplement 1
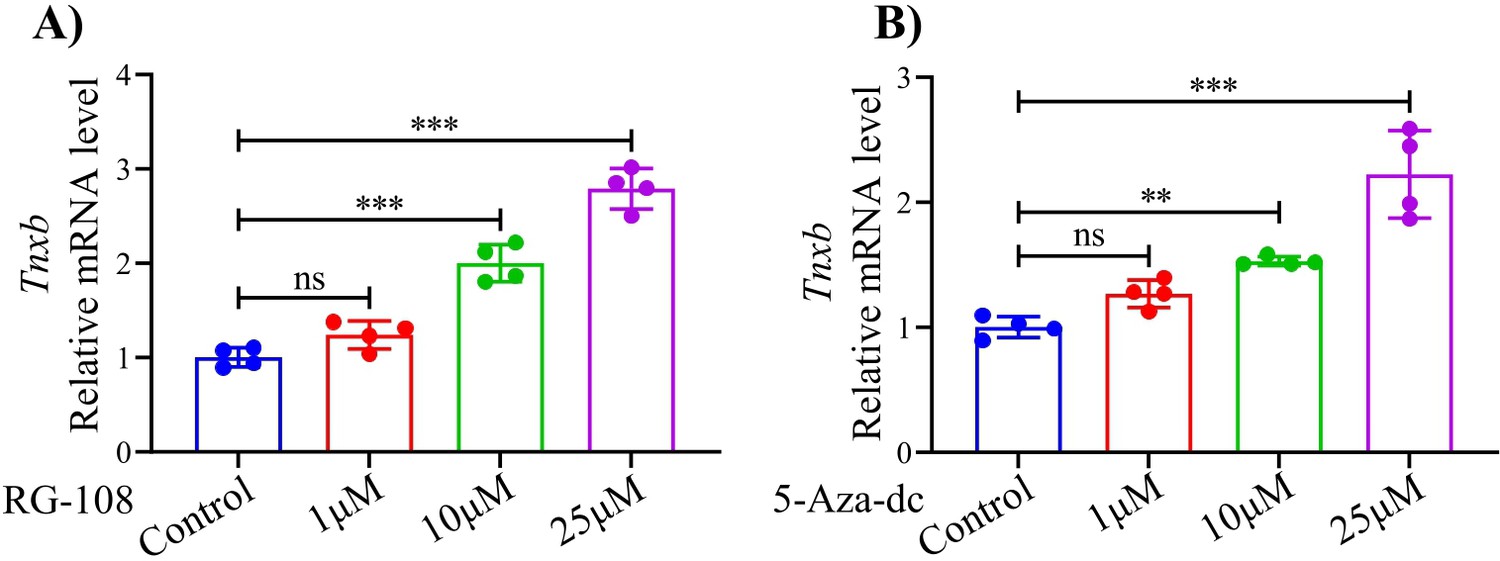
The qPCR analysis for the mRNA level of Tnxb in mouse chondrocytes treated with (A) RG-108 or (B) 5-Aza-dc.
Data were presented as means ± SD and analyzed by two-tailed unpaired parametric Student’s t test, ns = no significance, **p < 0.01, ***p < 0.001, n = 4 in each group.
Figure 4—figure supplement 2
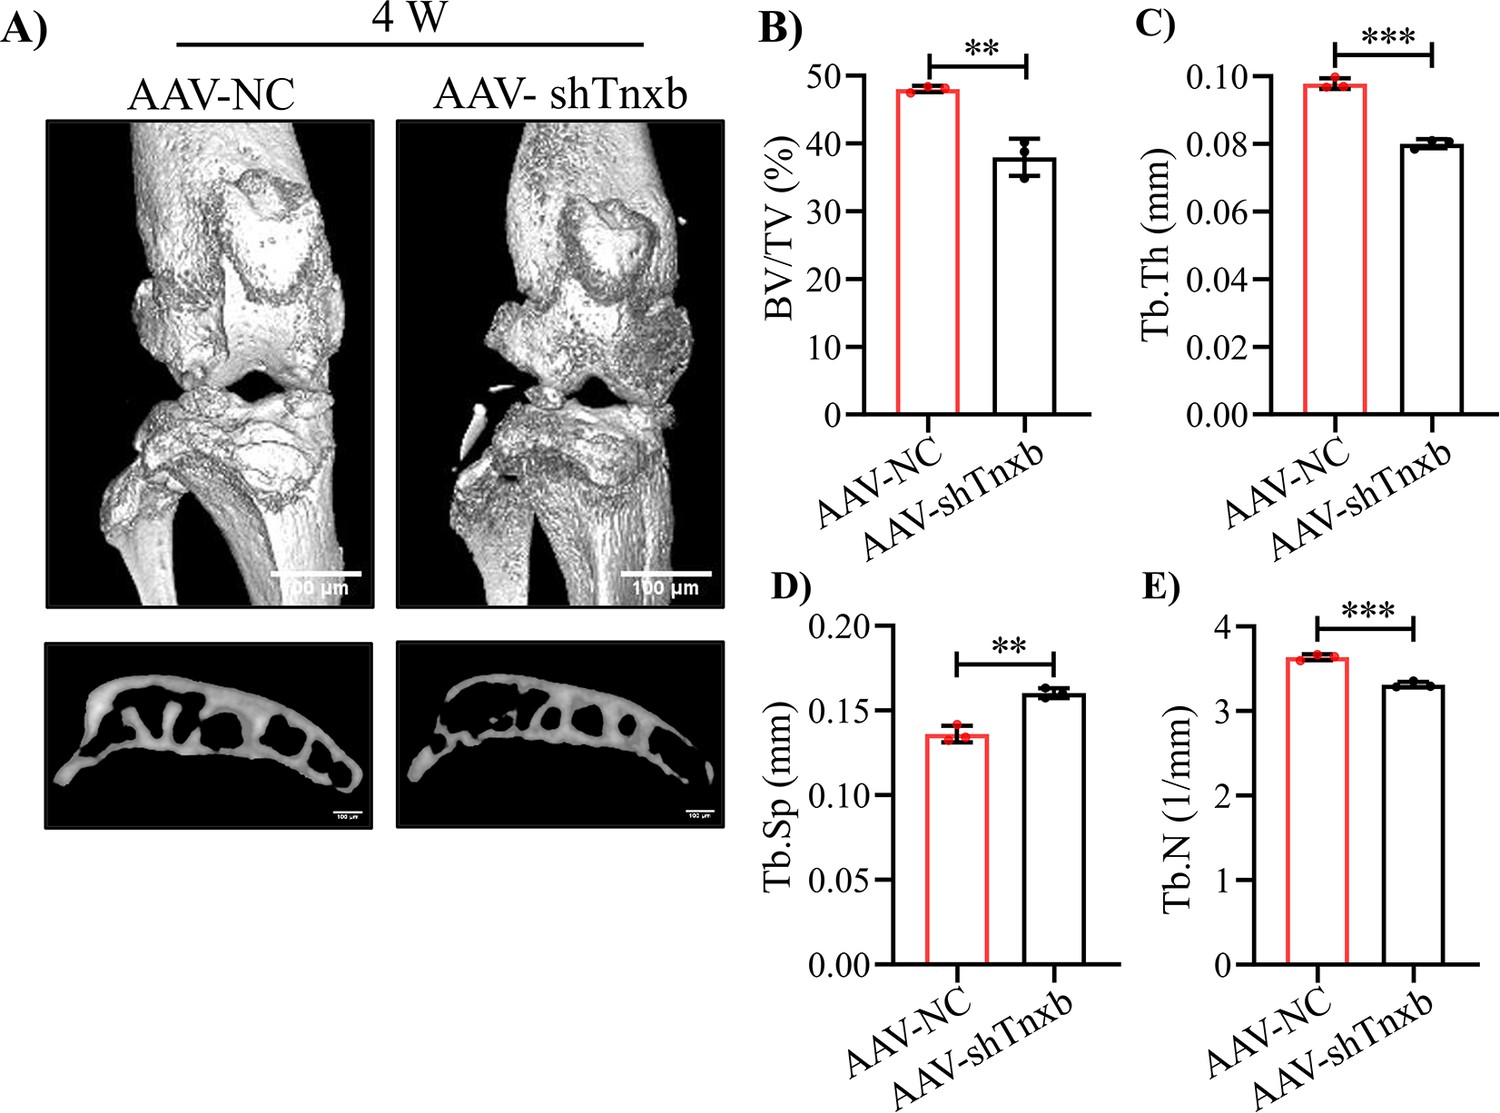
The micro-CT analysis of subchondral bone in Tnxb-KD HA mice.
(A) Representative 3D reconstruction of the knee joint and subchondral bone. Quantification analysis of the subchondral bone (B) BV/TV (%), (C) Tb.Th (mm), (D) Tb.Sp (mm) and (E) Tb.N (1 /mm). Data were presented as means ± SD and analyzed by 2-tailed unpaired parametric Student’s t test, **p < 0.01, ***p < 0.001, n = 3 in each group.
Figure 5 with 1 supplement
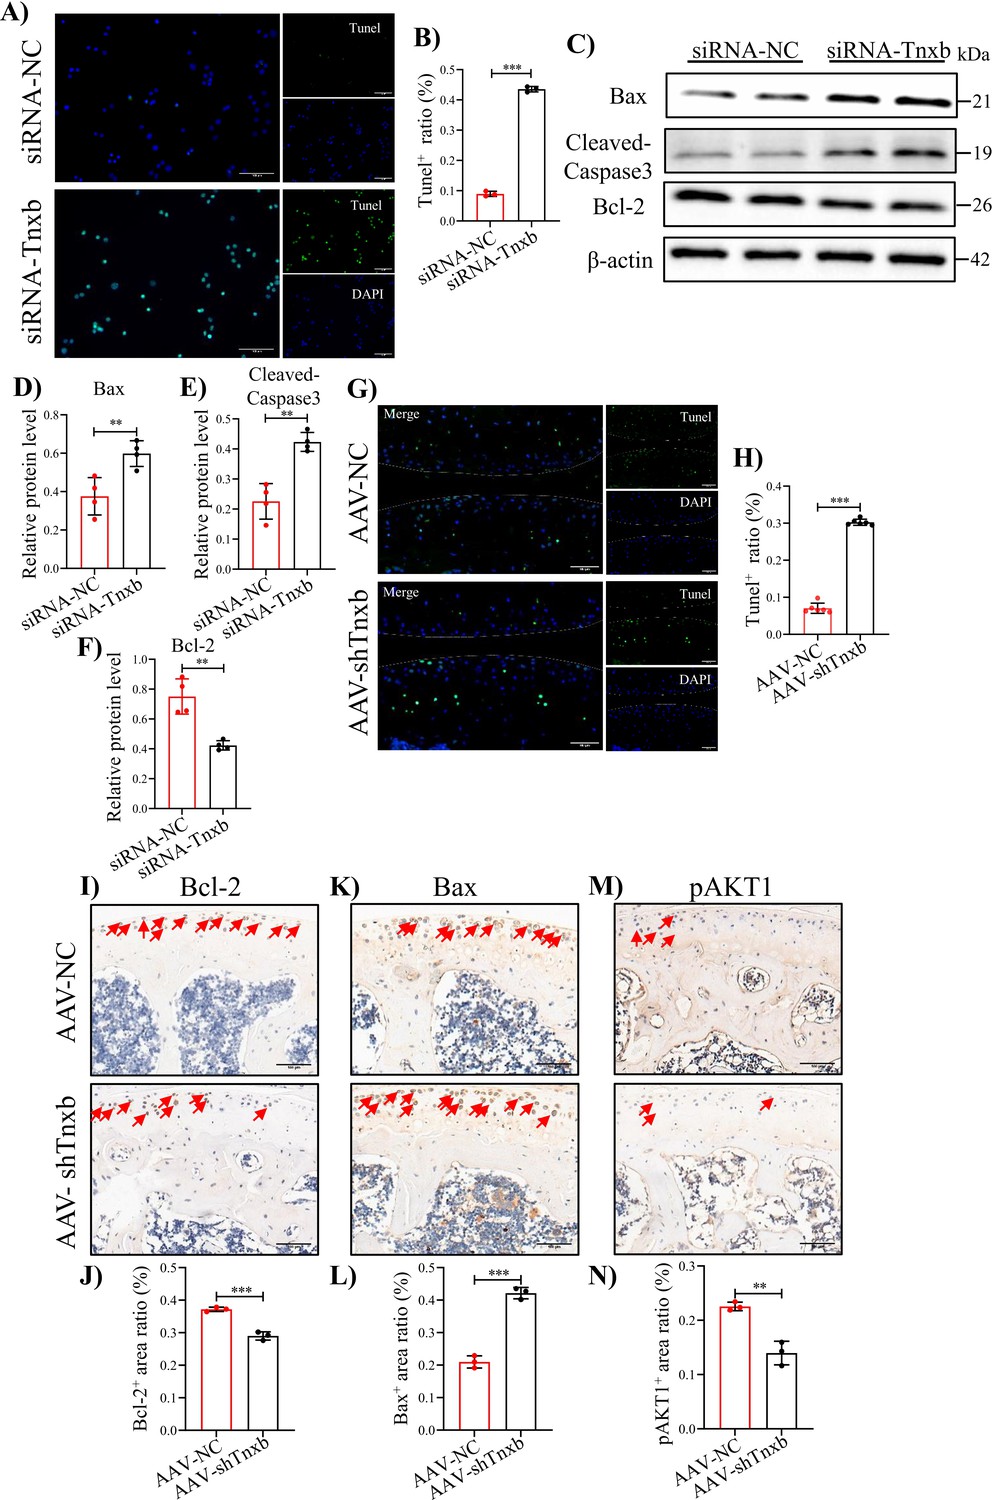
Tnxb knockdown increases apoptosis in chondrocytes and HA cartilages.
(A) Representative images of Tunel staining in Tnxb-KD chondrocytes (B) Quantification for Tunel positive cells. (C–F) Western blot and corresponding quantification analysis for Bax, Cleaved-Caspase3, and Bcl-2. (G) Tunel staining for apoptosis in articular cartilage from Tnxb-KD HA mice. (H) Quantification for Tunel-positive cells in articular cartilage. Representative IHC staining of Bax (I), Bcl-2 (K), and p-AKT1 (M) in articular cartilage from Tnxb-KD HA mice. Corresponding quantification of the proportion of (J) Bax, (L) Bcl-2 and (N) p-AKT1-positive regions. Red arrows indicate positive cells. Scale bar: 100 μm. Data were presented as means ± SD; n ≥ 3 in each group. And analyzed by two-tailed unpaired parametric Student’s t test, **p < 0.01, ***p < 0.001.
-
Figure 5—source data 1
Original file for the western blot analysis of β-actin in Figure 5C.
- https://cdn.elifesciences.org/articles/93087/elife-93087-fig5-data1-v2.zip
-
Figure 5—source data 2
Original file for the western blot analysis of Bax in Figure 5C.
- https://cdn.elifesciences.org/articles/93087/elife-93087-fig5-data2-v2.zip
-
Figure 5—source data 3
Original file for the western blot analysis of Bcl-2 in Figure 5C.
- https://cdn.elifesciences.org/articles/93087/elife-93087-fig5-data3-v2.zip
-
Figure 5—source data 4
Original file for the western blot analysis of Cleaved-Caspase 3 in Figure 5C.
- https://cdn.elifesciences.org/articles/93087/elife-93087-fig5-data4-v2.zip
-
Figure 5—source data 5
PDF containing Figure 5C and original scans of the relevant western blot analysis (anti-β-actin, anti-Bax, anti-Bcl-2, and anti-Cleaved-Caspase 3) with highlighted bands and sample labels.
- https://cdn.elifesciences.org/articles/93087/elife-93087-fig5-data5-v2.pdf
Figure 5—figure supplement 1
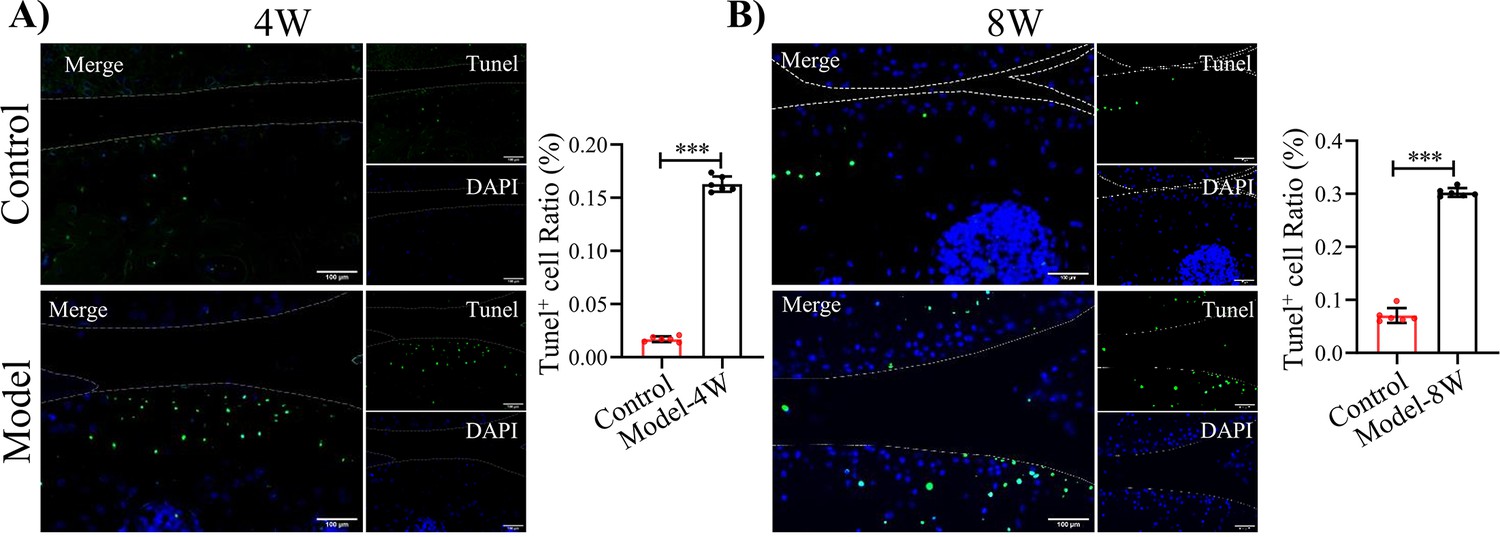
Tunel staining for apoptosis in articular cartilage of F8-/- mice at (A) 4 and (B) 8 weeks following injury.
Scale bar: 100 μm. Quantification for Tunel positive cells in articular cartilages.
Figure 6 with 2 supplements
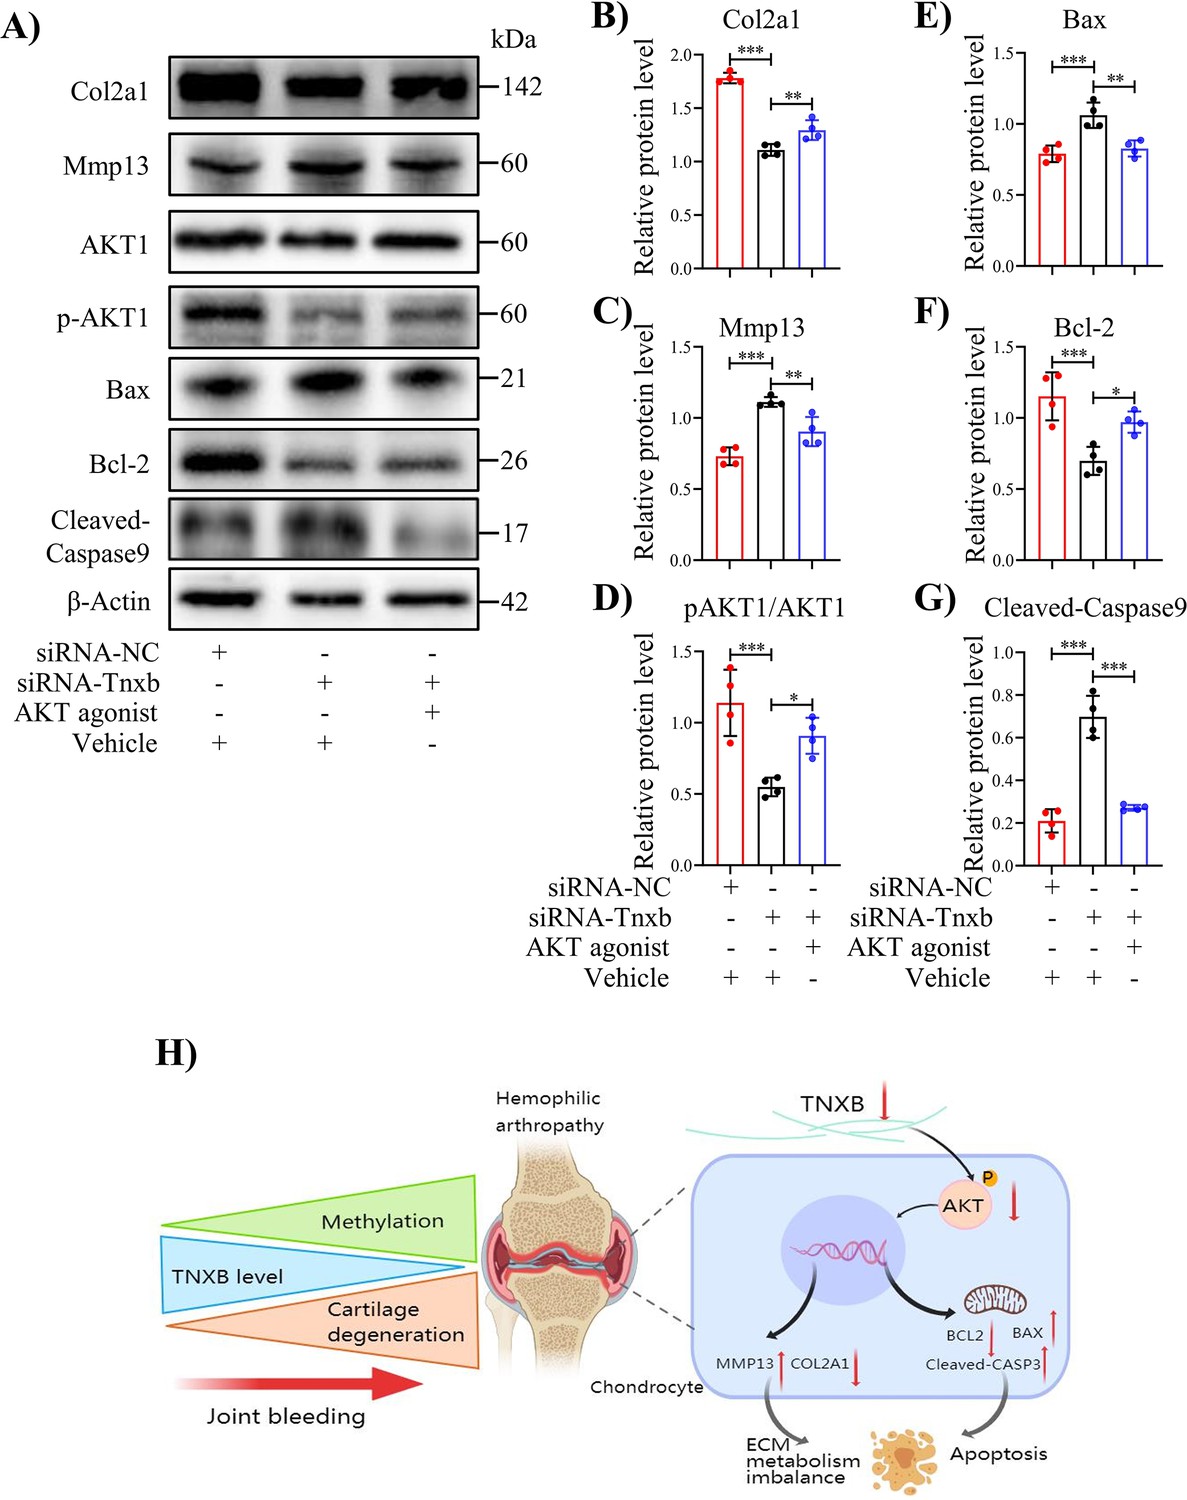
Treatment with AKT agonist decreases apoptosis in Tnxb-KD chondrocytes.
(A) Western blot analysis for Col2a1, Mmp13, Bax, Bcl-2, p-AKT1, AKT1 and Cleaved-Caspase9 in Tnxb-KD chondrocytes treated with SC79 (0 or 10 μM) for 24 h. (B–G) Corresponding quantification of these proteins. (H) Schematic of the role of TNXB in the pathogenesis of HA cartilage degeneration. Data were presented as means ± SD; n = 4 per group. And analyzed by two-tailed unpaired parametric Student’s t test or one-way ANOVA with Tukey’s multiple comparisons test, *p < 0.05, **p < 0.01, ***p < 0.001.
-
Figure 6—source data 1
Original file for the western blot analysis of β-actin in Figure 6A.
- https://cdn.elifesciences.org/articles/93087/elife-93087-fig6-data1-v2.zip
-
Figure 6—source data 2
Original file for the western blot analysis of Col2a1 in Figure 6A.
- https://cdn.elifesciences.org/articles/93087/elife-93087-fig6-data2-v2.zip
-
Figure 6—source data 3
Original file for the western blot analysis of Mmp13 in Figure 6A.
- https://cdn.elifesciences.org/articles/93087/elife-93087-fig6-data3-v2.zip
-
Figure 6—source data 4
Original file for the western blot analysis of AKT1 in Figure 6A.
- https://cdn.elifesciences.org/articles/93087/elife-93087-fig6-data4-v2.zip
-
Figure 6—source data 5
Original file for the western blot analysis of pAKT1 in Figure 6A.
- https://cdn.elifesciences.org/articles/93087/elife-93087-fig6-data5-v2.zip
-
Figure 6—source data 6
Original file for the western blot analysis of Bax in Figure 6A.
- https://cdn.elifesciences.org/articles/93087/elife-93087-fig6-data6-v2.zip
-
Figure 6—source data 7
Original file for the western blot analysis of Bcl-2 in Figure 6A.
- https://cdn.elifesciences.org/articles/93087/elife-93087-fig6-data7-v2.zip
-
Figure 6—source data 8
Original file for the western blot analysis of Cleaved-Caspase9 in Figure 6A.
- https://cdn.elifesciences.org/articles/93087/elife-93087-fig6-data8-v2.zip
-
Figure 6—source data 9
Original file for the western blot analysis of Cleaved-Caspase9-β-actin in Figure 6A.
- https://cdn.elifesciences.org/articles/93087/elife-93087-fig6-data9-v2.zip
-
Figure 6—source data 10
PDF containing Figure 6A and original scans of the relevant western blot analysis (anti-β-actin, anti-Col2a1, anti-Mmp13, anti-AKT1, anti-pAKT1, anti-Bax, anti-Bcl-2, anti-Cleaved-Caspase 9, and anti-Cleaved-Caspase 9-β-actin) with highlighted bands and sample labels.
- https://cdn.elifesciences.org/articles/93087/elife-93087-fig6-data10-v2.pdf
Figure 6—figure supplement 1
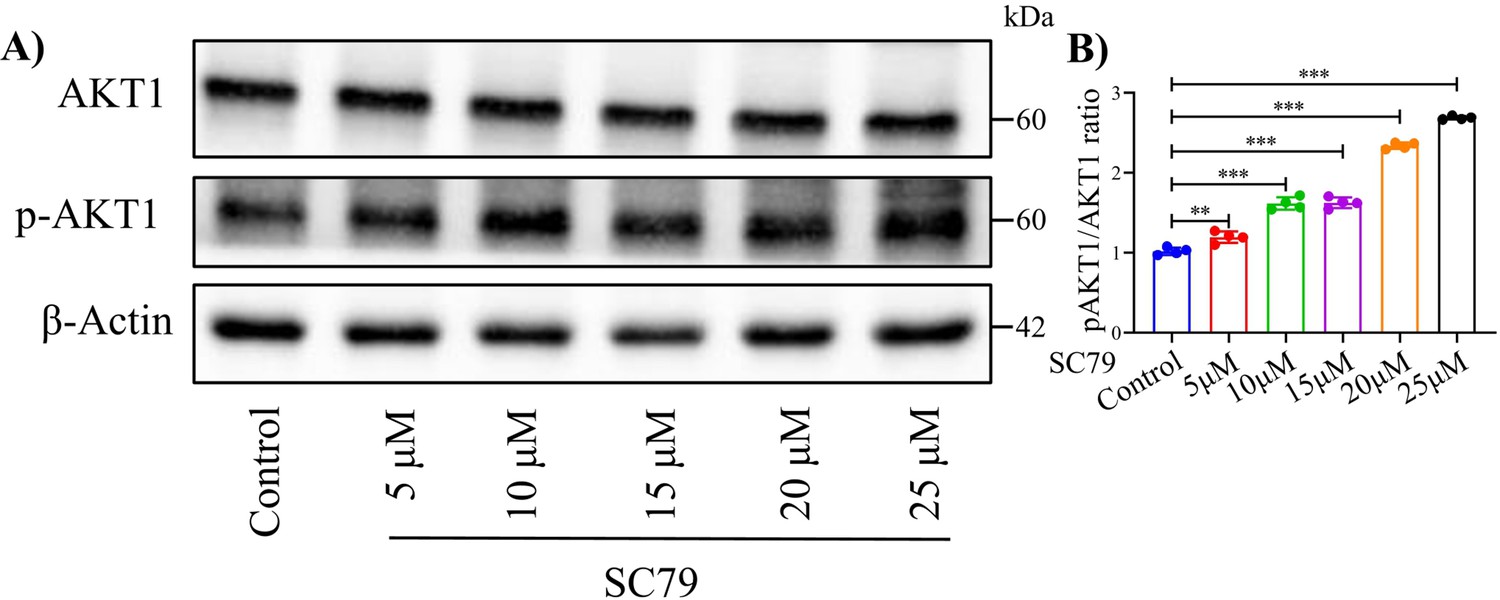
Western blot examined the function of AKT1 and p-AKT1 agonist SC79.
(A) Western blot label and (B) corresponding quantification of AKT1 and p-AKT1. Data were presented as means ± SD and analyzed by two-tailed unpaired parametric Student’s t test, **p < 0.01, ***p < 0.001, n = 4 in each group.
-
Figure 6—figure supplement 1—source data 1
Original file for the western blot analysis of β-actin in Figure 6—figure supplement 1.
- https://cdn.elifesciences.org/articles/93087/elife-93087-fig6-figsupp1-data1-v2.zip
-
Figure 6—figure supplement 1—source data 2
Original file for the western blot analysis of AKT1 in Figure 6—figure supplement 1.
- https://cdn.elifesciences.org/articles/93087/elife-93087-fig6-figsupp1-data2-v2.zip
-
Figure 6—figure supplement 1—source data 3
Original file for the western blot analysis of pAKT1 in Figure 6—figure supplement 1.
- https://cdn.elifesciences.org/articles/93087/elife-93087-fig6-figsupp1-data3-v2.zip
-
Figure 6—figure supplement 1—source data 4
PDF containing Figure 6—figure supplement 1 and original scans of the relevant western blot analysis (anti-β-actin, anti-AKT1, and anti-pAKT1) with highlighted bands and sample labels.
- https://cdn.elifesciences.org/articles/93087/elife-93087-fig6-figsupp1-data4-v2.pdf
Figure 6—figure supplement 2
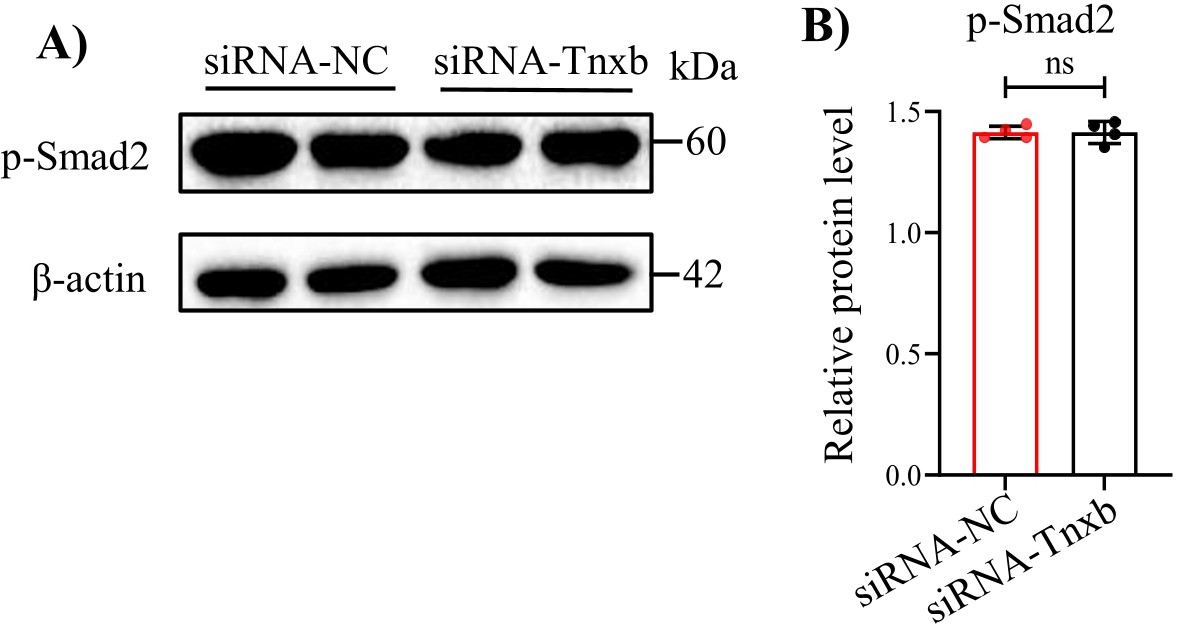
Western blot examined the expression of p-Smad2 in mouse chondrocytes treated with siRNA-NC or siRNA-Tnxb.
(A) Western blot label and (B) corresponding quantification of p-Smad2. Data were presented as means ± SD and analyzed by two-tailed unpaired parametric Student’s t test, ns = no significance, n = 4 in each group.
-
Figure 6—figure supplement 2—source data 1
Original file for the western blot analysis of β-actin in Figure 6—figure supplement 2.
- https://cdn.elifesciences.org/articles/93087/elife-93087-fig6-figsupp2-data1-v2.zip
-
Figure 6—figure supplement 2—source data 2
Original file for the western blot analysis of pSmad2 in Figure 6—figure supplement 2.
- https://cdn.elifesciences.org/articles/93087/elife-93087-fig6-figsupp2-data2-v2.zip
Author response image 1
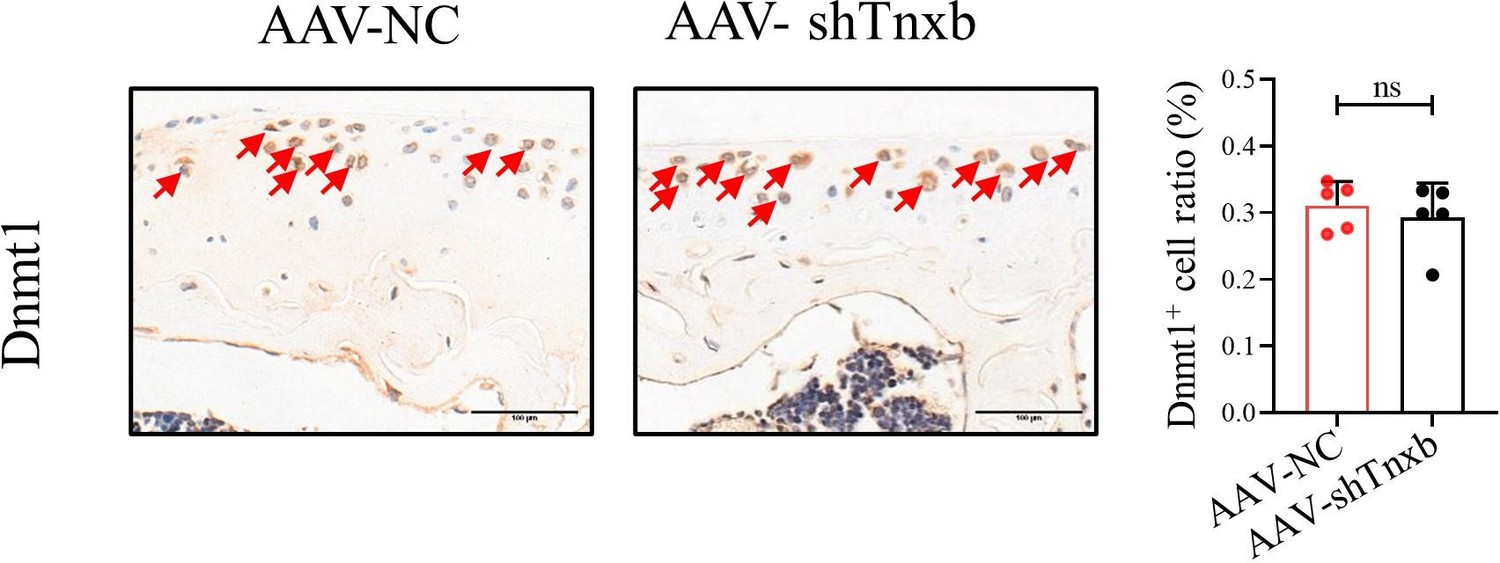
Figure Legend: Representative IHC staining of Dnmt1 in articular cartilage from Tnxb-KD HA mice.
Corresponding quantification of the proportion of Dnmt1 positive regions. Red arrows indicate positive cells. Scale bar: 100 μm. Data were presented as means ± SD; n = 5 in each group. ns = no significance by unpaired Student’s t test.
Additional files
-
Supplementary file 1
Basic characteristics of subjects.
- https://cdn.elifesciences.org/articles/93087/elife-93087-supp1-v2.docx
-
Supplementary file 2
Primer sequences for qPCR.
- https://cdn.elifesciences.org/articles/93087/elife-93087-supp2-v2.docx
-
Supplementary file 3
Identification and functional enrichment analysis of differentially methylated genes between HA and OA cartilages.
(a) DMRs between HA and OA cartilages (b) GO pathway enrichment analysis of DMRs-related gene (Top 10 pathways) (c) KEGG pathway enrichment analysis of DMRs-related gene (Top 10 pathways).
- https://cdn.elifesciences.org/articles/93087/elife-93087-supp3-v2.xlsx
-
MDAR checklist
- https://cdn.elifesciences.org/articles/93087/elife-93087-mdarchecklist1-v2.docx
Download links
A two-part list of links to download the article, or parts of the article, in various formats.
Downloads (link to download the article as PDF)
Open citations (links to open the citations from this article in various online reference manager services)
Cite this article (links to download the citations from this article in formats compatible with various reference manager tools)
Aberrant methylation and expression of TNXB promote chondrocyte apoptosis and extracullar matrix degradation in hemophilic arthropathy via AKT signaling
eLife 13:RP93087.
https://doi.org/10.7554/eLife.93087.3


